Attached files
| file | filename |
|---|---|
| 8-K - FORM 8-K - OCCIDENTAL PETROLEUM CORP /DE/ | form8k-20110428.htm |
| EX-99.1 - EXHIBIT 99.1 - OCCIDENTAL PETROLEUM CORP /DE/ | ex99_1-20110428.htm |
| EX-99.2 - EXHIBIT 99.2 - OCCIDENTAL PETROLEUM CORP /DE/ | ex99_2-20110428.htm |
| EX-99.4 - OCCIDENTAL PETROLEUM CORP /DE/ | ex99_4-20110428.htm |
| EX-99.5 - EXHIBIT 99.5 - OCCIDENTAL PETROLEUM CORP /DE/ | ex99_5-20110428.htm |
EXHIBIT 99.3
Investor Relations Supplemental Schedules

|
Investor Relations Supplemental Schedules
|
|||||||
|
Summary
|
|||||||
|
($ Millions)
|
|||||||
|
1Q 2011
|
1Q 2010
|
||||||
|
Core Results
|
$1,593
|
$1,097
|
|||||
|
EPS - Diluted
|
$1.96
|
$1.35
|
|||||
| Reported Net Income | $1,549 |
$1,064
|
|||||
|
EPS - Diluted
|
$1.90
|
$1.31
|
|||||
|
Total Worldwide Sales Volumes (mboe/day)
|
728
|
685
|
|||||
|
Total Worldwide Crude Oil Realizations ($/BBL)
|
$92.14
|
$74.09
|
|||||
|
Total Worldwide NGL Realizations ($/BBL)
|
$52.64
|
$47.48
|
|||||
|
Domestic Natural Gas Realizations ($/MCF)
|
$4.21
|
$5.62
|
|||||
|
Wtd. Average Basic Shares O/S (mm)
|
812.6
|
812.1
|
|||||
|
Wtd. Average Diluted Shares O/S (mm)
|
813.4
|
813.5
|
|||||
|
Shares Outstanding (mm)
|
812.9
|
812.2
|
|||||
|
Cash Flow from Operations
|
$
|
2,200
|
$
|
2,200
|
|||
1
Investor Relations Supplemental Schedules
|
OCCIDENTAL PETROLEUM
|
|||||||||||||
|
2011 First Quarter
|
|||||||||||||
|
Net Income (Loss)
|
|||||||||||||
|
($ millions)
|
|||||||||||||
|
Reported
|
Core | ||||||||||||
|
Income
|
Significant Items Affecting Income
|
Results
|
|||||||||||
|
Oil & Gas
|
$
|
2,468
|
$
|
35
|
Libya exploration write-off |
$
|
2,510
|
||||||
|
(22
|
)
|
Gain on sale of Colombia pipeline interest | |||||||||||
|
29
|
Foreign tax | ||||||||||||
|
Chemical
|
219
|
219
|
|||||||||||
|
Midstream, marketing and other
|
114
|
114
|
|||||||||||
|
Corporate
|
|||||||||||||
|
Interest expense, net
|
(214
|
)
|
163
|
Premium on debt extinguishments |
(51
|
)
|
|||||||
|
Other
|
(128
|
)
|
(128
|
)
|
|||||||||
|
Taxes
|
(1,054
|
)
|
(50
|
)
|
Tax effect of adjustments |
(1,071
|
)
|
||||||
|
33
|
State income tax charge | ||||||||||||
|
Income from continuing operations
|
1,405
|
188
|
1,593
|
||||||||||
|
Discontinued operations, net of tax
|
144
|
(144
|
)
|
Discontinued operations, net |
-
|
||||||||
|
Net Income
|
$
|
1,549
|
$
|
44
|
$
|
1,593
|
|||||||
|
Basic Earnings Per Common Share
|
|||||||||||||
|
Income from continuing operations
|
$
|
1.72
|
|||||||||||
|
Discontinued operations, net
|
0.18
|
||||||||||||
|
Net Income
|
$
|
1.90
|
$
|
1.96
|
|||||||||
|
Diluted Earnings Per Common Share
|
|||||||||||||
|
Income from continuing operations
|
$
|
1.72
|
|||||||||||
|
Discontinued operations, net
|
0.18
|
||||||||||||
|
Net Income
|
$
|
1.90
|
$
|
1.96
|
|||||||||
2
Investor Relations Supplemental Schedules
|
OCCIDENTAL PETROLEUM
|
|||||||||||||
|
2010 First Quarter
|
|||||||||||||
|
Net Income (Loss)
|
|||||||||||||
|
($ millions)
|
|||||||||||||
|
Reported
|
Core | ||||||||||||
|
Income
|
Significant Items Affecting Income
|
Results
|
|||||||||||
|
Oil & Gas
|
$
|
1,861
|
$
|
1,861
|
|||||||||
|
Chemical
|
30
|
30
|
|||||||||||
|
Midstream, marketing and other
|
94
|
94
|
|||||||||||
|
Corporate
|
|||||||||||||
|
Interest expense, net
|
(35
|
)
|
(35
|
)
|
|||||||||
|
Other
|
(107
|
)
|
(107
|
)
|
|||||||||
|
Taxes
|
(746
|
)
|
(746
|
)
|
|||||||||
|
Income from continuing operations
|
1,097
|
-
|
1,097
|
||||||||||
|
Discontinued operations, net of tax
|
(33
|
)
|
33
|
Discontinued operations, net |
-
|
||||||||
|
Net Income
|
$
|
1,064
|
$
|
33
|
$
|
1,097
|
|||||||
|
Basic Earnings Per Common Share
|
|||||||||||||
|
Income from continuing operations
|
$
|
1.35
|
|||||||||||
|
Discontinued operations, net
|
(0.04
|
)
|
|||||||||||
|
Net Income
|
$
|
1.31
|
$
|
1.35
|
|||||||||
|
Diluted Earnings Per Common Share
|
|||||||||||||
|
Income from continuing operations
|
$
|
1.35
|
|||||||||||
|
Discontinued operations, net
|
(0.04
|
)
|
|||||||||||
|
Net Income
|
$
|
1.31
|
$
|
1.35
|
|||||||||
3
Investor Relations Supplemental Schedules
|
OCCIDENTAL PETROLEUM
|
||||||||||||||
|
Worldwide Effective Tax Rate
|
||||||||||||||
|
QUARTERLY
|
||||||||||||||
|
2011
|
2010
|
2010
|
||||||||||||
|
CORE RESULTS
|
QTR 1
|
QTR 4
|
QTR 1
|
|||||||||||
|
Oil & Gas
|
2,510
|
1,941
|
1,861
|
|||||||||||
|
Chemicals
|
219
|
111
|
30
|
|||||||||||
|
Midstream, marketing and other
|
114
|
202
|
94
|
|||||||||||
|
Corporate & other
|
(179
|
)
|
(169
|
)
|
(142
|
)
|
||||||||
|
Pre-tax income
|
2,664
|
2,085
|
1,843
|
|||||||||||
|
Income tax expense
|
||||||||||||||
|
Federal and state
|
483
|
309
|
307
|
|||||||||||
|
Foreign
|
588
|
489
|
439
|
|||||||||||
|
Total
|
1,071
|
798
|
746
|
|||||||||||
|
Core results
|
1,593
|
1,287
|
1,097
|
|||||||||||
|
Worldwide effective tax rate
|
40%
|
38%
|
40%
|
|||||||||||
|
2011
|
2010
|
2010
|
||||||||||||
|
REPORTED INCOME
|
QTR 1
|
QTR 4
|
QTR 1
|
|||||||||||
|
Oil & Gas
|
2,468
|
1,666
|
1,861
|
|||||||||||
|
Chemicals
|
219
|
111
|
30
|
|||||||||||
|
Midstream, marketing and other
|
114
|
202
|
94
|
|||||||||||
|
Corporate & other
|
(342
|
)
|
(169
|
)
|
(142
|
)
|
||||||||
|
Pre-tax income
|
2,459
|
1,810
|
1,843
|
|||||||||||
|
Income tax expense
|
||||||||||||||
|
Federal and state
|
466
|
129
|
307
|
|||||||||||
|
Foreign
|
588
|
489
|
439
|
|||||||||||
|
Total
|
1,054
|
618
|
746
|
|||||||||||
|
Income from continuing operations
|
1,405
|
1,192
|
1,097
|
|||||||||||
|
Worldwide effective tax rate
|
43%
|
34%
|
40%
|
|||||||||||
4
Investor Relations Supplemental Schedules
|
OCCIDENTAL PETROLEUM
|
||||||||||||
|
2011 First Quarter Net Income (Loss)
|
||||||||||||
|
Core Results Comparison
|
||||||||||||
|
First
|
Fourth
|
|||||||||||
|
Quarter
|
Quarter
|
|||||||||||
|
2011
|
2010
|
B / (W)
|
||||||||||
|
Oil & Gas
|
$
|
2,510
|
$
|
1,941
|
$
|
569
|
||||||
|
Chemical
|
219
|
111
|
108
|
|||||||||
|
Midstream, marketing and other
|
114
|
202
|
(88
|
)
|
||||||||
|
Corporate
|
||||||||||||
|
Interest expense, net
|
(51
|
)
|
(20
|
)
|
(31
|
)
|
||||||
|
Other
|
(128
|
)
|
(149
|
)
|
21
|
|||||||
|
Taxes
|
(1,071
|
)
|
(798
|
)
|
(273
|
)
|
||||||
|
Core Results
|
$
|
1,593
|
$
|
1,287
|
$
|
306
|
||||||
|
Core Results Per Common Share
|
||||||||||||
|
Basic
|
$
|
1.96
|
$
|
1.58
|
$
|
0.38
|
||||||
|
Diluted
|
$
|
1.96
|
$
|
1.58
|
$
|
0.38
|
||||||
|
Worldwide Effective Tax Rate
|
40%
|
38%
|
-2%
|
|||||||||
|
OCCIDENTAL PETROLEUM
|
||||||||||||
|
2011 First Quarter Net Income (Loss)
|
||||||||||||
|
Reported Income Comparison
|
||||||||||||
|
First
|
Fourth
|
|||||||||||
|
Quarter
|
Quarter
|
|||||||||||
|
2011
|
2010
|
B / (W)
|
||||||||||
|
Oil & Gas
|
$
|
2,468
|
$
|
1,666
|
$
|
802
|
||||||
|
Chemical
|
219
|
111
|
108
|
|||||||||
|
Midstream, marketing and other
|
114
|
202
|
(88
|
)
|
||||||||
|
Corporate
|
||||||||||||
|
Interest expense, net
|
(214
|
)
|
(20
|
)
|
(194
|
)
|
||||||
|
Other
|
(128
|
)
|
(149
|
)
|
21
|
|||||||
|
Taxes
|
(1,054
|
)
|
(618
|
)
|
(436
|
)
|
||||||
| Income from continuing operations | 1,405 | 1,192 | 213 | |||||||||
| Discontinued operations, net | 144 | 20 | 124 | |||||||||
|
Net Income
|
$
|
1,549
|
$
|
1,212
|
$
|
337
|
||||||
|
Earnings Per Common Share
|
||||||||||||
|
Basic
|
$
|
1.90
|
$
|
1.49
|
$
|
0.41
|
||||||
|
Diluted
|
$
|
1.90
|
$
|
1.49
|
$
|
0.41
|
||||||
|
Worldwide Effective Tax Rate
|
43%
|
34%
|
-9%
|
|||||||||
5
Investor Relations Supplemental Schedules
6
Investor Relations Supplemental Schedules
|
OCCIDENTAL PETROLEUM
|
||||||||||||
|
2011 First Quarter Net Income (Loss)
|
||||||||||||
|
Core Results Comparison
|
||||||||||||
|
First
|
First
|
|||||||||||
|
Quarter
|
Quarter
|
|||||||||||
|
2011
|
2010
|
B / (W)
|
||||||||||
|
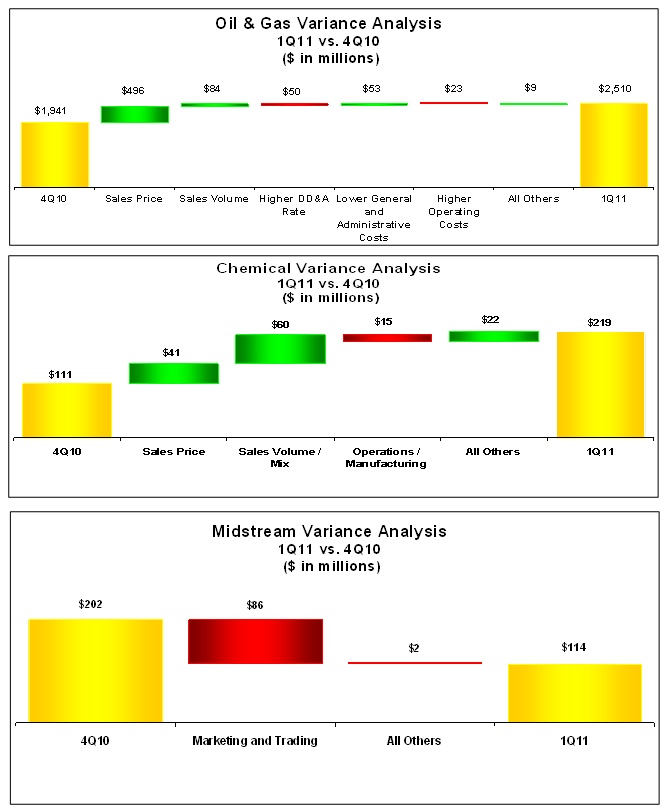
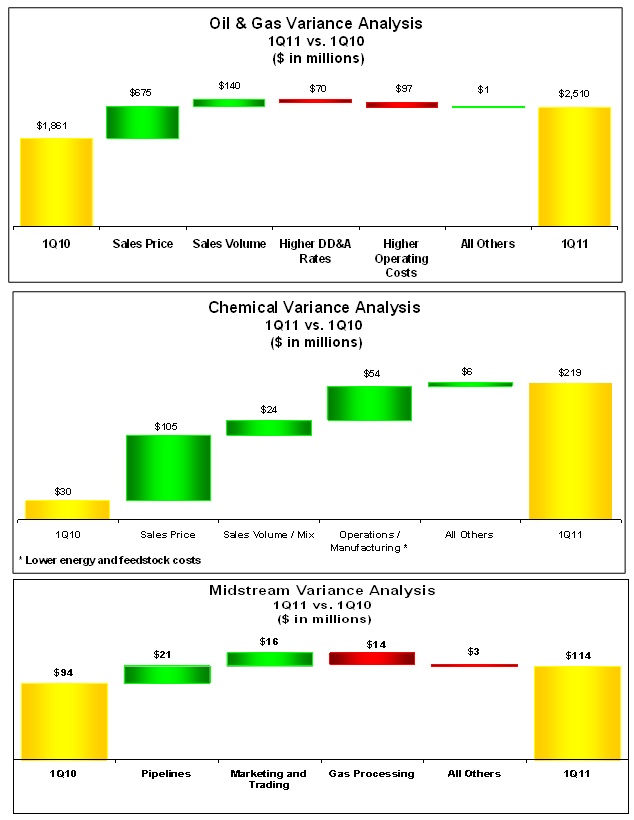
Oil & Gas
|
$
|
2,510
|
$
|
1,861
|
$
|
649
|
||||||
|
Chemical
|
219
|
30
|
189
|
|||||||||
|
Midstream, marketing and other
|
114
|
94
|
20
|
|||||||||
|
Corporate
|
||||||||||||
|
Interest expense, net
|
(51
|
)
|
(35
|
)
|
(16
|
)
|
||||||
|
Other
|
(128
|
)
|
(107
|
)
|
(21
|
)
|
||||||
|
Taxes
|
(1,071
|
)
|
(746
|
)
|
(325
|
)
|
||||||
|
Core Results
|
$
|
1,593
|
$
|
1,097
|
$
|
496
|
||||||
|
Core Results Per Common Share
|
||||||||||||
|
Basic
|
$
|
1.96
|
$
|
1.35
|
$
|
0.61
|
||||||
|
Diluted
|
$
|
1.96
|
$
|
1.35
|
$
|
0.61
|
||||||
|
Worldwide Effective Tax Rate
|
40%
|
40%
|
0%
|
|||||||||
|
OCCIDENTAL PETROLEUM
|
||||||||||||
|
2011 First Quarter Net Income (Loss)
|
||||||||||||
|
Reported Income Comparison
|
||||||||||||
|
First
|
First
|
|||||||||||
|
Quarter
|
Quarter
|
|||||||||||
|
2011
|
2010
|
B / (W)
|
||||||||||
|
Oil & Gas
|
$
|
2,468
|
$
|
1,861
|
$
|
607
|
||||||
|
Chemical
|
219
|
30
|
189
|
|||||||||
|
Midstream, marketing and other
|
114
|
94
|
20
|
|||||||||
|
Corporate
|
||||||||||||
|
Interest expense, net
|
(214
|
)
|
(35
|
)
|
(179
|
)
|
||||||
|
Other
|
(128
|
)
|
(107
|
)
|
(21
|
)
|
||||||
|
Taxes
|
(1,054
|
)
|
(746
|
)
|
(308
|
)
|
||||||
| Income from continuing operations | 1,405 | 1,097 | 308 | |||||||||
| Discontinued operations, net | 144 | (33 | ) | 177 | ||||||||
|
Net Income
|
$
|
1,549
|
$
|
1,064
|
$
|
485
|
||||||
|
Earnings Per Common Share
|
||||||||||||
|
Basic
|
$
|
1.90
|
$
|
1.31
|
$
|
0.59
|
||||||
|
Diluted
|
$
|
1.90
|
$
|
1.31
|
$
|
0.59
|
||||||
|
Worldwide Effective Tax Rate
|
43%
|
40%
|
-3%
|
|||||||||
7
Investor Relations Supplemental Schedules
8
Investor Relations Supplemental Schedules
|
OCCIDENTAL PETROLEUM
|
||||||||||||||
|
SUMMARY OF OPERATING STATISTICS
|
||||||||||||||
|
First Quarter
|
||||||||||||||
|
2011
|
2010
|
|||||||||||||
|
NET PRODUCTION PER DAY:
|
||||||||||||||
|
United States
|
||||||||||||||
|
Crude Oil (MBBL)
|
||||||||||||||
|
California
|
77
|
77
|
||||||||||||
|
Permian
|
132
|
137
|
||||||||||||
|
Midcontinent and other
|
13
|
7
|
||||||||||||
|
Total
|
222
|
221
|
||||||||||||
|
NGL (MBBL)
|
||||||||||||||
|
California
|
14
|
17
|
||||||||||||
|
Permian
|
37
|
27
|
||||||||||||
|
Midcontinent and other
|
8
|
6
|
||||||||||||
|
Total
|
59
|
50
|
||||||||||||
|
Natural Gas (MMCF)
|
||||||||||||||
|
California
|
242
|
295
|
||||||||||||
|
Permian
|
165
|
198
|
||||||||||||
|
Midcontinent and other
|
327
|
182
|
||||||||||||
|
Total
|
734
|
675
|
||||||||||||
|
Latin America
|
||||||||||||||
|
Crude Oil (MBBL)
|
Colombia
|
31
|
34
|
|||||||||||
|
Natural Gas (MMCF)
|
Bolivia
|
16
|
12
|
|||||||||||
|
Middle East / North Africa
|
||||||||||||||
|
Crude Oil (MBBL)
|
||||||||||||||
|
Bahrain
|
4
|
3
|
||||||||||||
|
Dolphin
|
9
|
11
|
||||||||||||
|
Iraq
|
9
|
-
|
||||||||||||
|
Libya
|
15
|
13
|
||||||||||||
|
Oman
|
67
|
57
|
||||||||||||
|
Qatar
|
75
|
75
|
||||||||||||
|
Yemen
|
33
|
35
|
||||||||||||
|
Total
|
212
|
194
|
||||||||||||
|
NGL (MBBL)
|
||||||||||||||
|
Dolphin
|
10
|
12
|
||||||||||||
|
Libya
|
1
|
1
|
||||||||||||
|
Total
|
11
|
13
|
||||||||||||
|
Natural Gas (MMCF)
|
||||||||||||||
|
Bahrain
|
173
|
166
|
||||||||||||
|
Dolphin
|
196
|
228
|
||||||||||||
|
Oman
|
50
|
52
|
||||||||||||
|
Total
|
419
|
446
|
||||||||||||
|
Barrels of Oil Equivalent (MBOE)
|
730
|
701
|
||||||||||||
9
Investor Relations Supplemental Schedules
|
OCCIDENTAL PETROLEUM
|
||||||||||||||
|
SUMMARY OF OPERATING STATISTICS
|
||||||||||||||
|
First Quarter
|
||||||||||||||
|
2011
|
2010
|
|||||||||||||
|
NET SALES VOLUMES PER DAY:
|
||||||||||||||
|
United States
|
||||||||||||||
|
Crude Oil (MBBL)
|
222
|
221
|
||||||||||||
|
NGL (MBBL)
|
59
|
50
|
||||||||||||
|
Natural Gas (MMCF)
|
734
|
675
|
||||||||||||
|
Latin America
|
||||||||||||||
|
Crude Oil (MBBL)
|
Colombia
|
33
|
33
|
|||||||||||
|
Natural Gas (MMCF)
|
16
|
12
|
||||||||||||
|
Middle East / North Africa
|
||||||||||||||
|
Crude Oil (MBBL)
|
||||||||||||||
|
Bahrain
|
4
|
2
|
||||||||||||
|
Dolphin
|
9
|
11
|
||||||||||||
|
Libya
|
15
|
4
|
||||||||||||
|
Oman
|
71
|
56
|
||||||||||||
|
Qatar
|
76
|
74
|
||||||||||||
|
Yemen
|
34
|
33
|
||||||||||||
|
Total
|
209
|
180
|
||||||||||||
|
NGL (MBBL)
|
Dolphin
|
10
|
12
|
|||||||||||
|
Natural Gas (MMCF)
|
419
|
446
|
||||||||||||
|
Barrels of Oil Equivalent (MBOE)
|
728
|
685
|
||||||||||||
10
Investor Relations Supplemental Schedules
|
OCCIDENTAL PETROLEUM
|
|||||||||||||||||
|
SUMMARY OF OPERATING STATISTICS
|
|||||||||||||||||
|
First Quarter
|
|||||||||||||||||
|
2011
|
2010
|
||||||||||||||||
|
OIL & GAS:
|
|||||||||||||||||
|
PRICES
|
|||||||||||||||||
|
United States
|
|||||||||||||||||
|
Crude Oil ($/BBL)
|
88.04
|
73.08
|
|||||||||||||||
|
NGL ($/BBL)
|
55.90
|
52.36
|
|||||||||||||||
|
Natural gas ($/MCF)
|
4.21
|
5.62
|
|||||||||||||||
|
Latin America
|
|||||||||||||||||
|
Crude Oil ($/BBL)
|
92.68
|
75.77
|
|||||||||||||||
|
Natural Gas ($/MCF)
|
8.23
|
7.35
|
|||||||||||||||
|
Middle East / North Africa
|
|||||||||||||||||
|
Crude Oil ($/BBL)
|
96.44
|
74.96
|
|||||||||||||||
|
NGL ($/BBL)
|
33.93
|
26.56
|
|||||||||||||||
|
Total Worldwide
|
|||||||||||||||||
|
Crude Oil ($/BBL)
|
92.14
|
74.09
|
|||||||||||||||
|
NGL ($/BBL)
|
52.64
|
47.48
|
|||||||||||||||
|
Natural Gas ($/MCF)
|
3.05
|
3.74
|
|||||||||||||||
|
First Quarter
|
|||||||||||||||||
|
2011
|
2010
|
||||||||||||||||
|
Exploration Expense
|
|||||||||||||||||
|
United States
|
$
|
40
|
$
|
30
|
|||||||||||||
|
Middle East / North Africa
|
44
|
26
|
|||||||||||||||
|
TOTAL REPORTED
|
$
|
84
|
$
|
56
|
|||||||||||||
|
Less - non-core impairments
|
(35
|
)
|
-
|
||||||||||||||
|
TOTAL CORE
|
$
|
49
|
$
|
56
|
|||||||||||||
11
Investor Relations Supplemental Schedules
|
OCCIDENTAL PETROLEUM
|
||||||||||||||||
|
SUMMARY OF OPERATING STATISTICS
|
||||||||||||||||
|
First Quarter
|
||||||||||||||||
|
Capital Expenditures ($MM)
|
2011
|
2010
|
||||||||||||||
|
Oil & Gas
|
||||||||||||||||
|
California
|
$
|
308
|
$
|
149
|
||||||||||||
|
Permian
|
216
|
73
|
||||||||||||||
|
Midcontinent and other
|
180
|
37
|
||||||||||||||
|
Latin America
|
42
|
30
|
||||||||||||||
|
Middle East / North Africa
|
352
|
263
|
||||||||||||||
|
Exploration
|
65
|
50
|
||||||||||||||
|
Chemicals
|
22
|
30
|
||||||||||||||
|
Midstream, marketing and other
|
127
|
124
|
||||||||||||||
|
Corporate
|
13
|
12
|
||||||||||||||
|
TOTAL
|
$
|
1,325
|
$
|
768
|
||||||||||||
|
Depreciation, Depletion &
|
First Quarter
|
|||||||||||||||
|
Amortization of Assets ($MM)
|
2011
|
2010
|
||||||||||||||
|
Oil & Gas
|
||||||||||||||||
|
Domestic
|
$
|
407
|
$
|
351
|
||||||||||||
|
Latin America
|
28
|
31
|
||||||||||||||
|
Middle East / North Africa
|
322
|
259
|
||||||||||||||
|
Chemicals
|
82
|
80
|
||||||||||||||
|
Midstream, marketing and other
|
45
|
37
|
||||||||||||||
|
Corporate
|
6
|
5
|
||||||||||||||
|
TOTAL
|
$
|
890
|
$
|
763
|
||||||||||||
12
Investor Relations Supplemental Schedules
|
OCCIDENTAL PETROLEUM
|
||||||||||||
|
CORPORATE
|
||||||||||||
|
($ millions)
|
||||||||||||
|
31-Mar-11
|
31-Dec-10
|
|||||||||||
|
CAPITALIZATION
|
||||||||||||
|
Long-Term Debt (including short-term borrowings)
|
$
|
4,748
|
$
|
5,111
|
||||||||
|
EQUITY
|
$
|
33,658
|
$
|
32,484
|
||||||||
|
Total Debt To Total Capitalization
|
12%
|
14%
|
||||||||||
13
Investor Relations Supplemental Schedules
|
OCCIDENTAL PETROLEUM
|
|||||||||||||||||
|
2010 PRODUCTION VOLUMES
|
|||||||||||||||||
|
Qtr 1
|
Qtr 2
|
Qtr 3
|
Qtr 4
|
TY
|
|||||||||||||
|
NET PRODUCTION PER DAY:
|
|||||||||||||||||
|
United States
|
|||||||||||||||||
|
Crude Oil (MBBL)
|
|||||||||||||||||
|
California
|
77
|
75
|
75
|
75
|
76
|
||||||||||||
|
Permian
|
137
|
135
|
134
|
135
|
136
|
||||||||||||
|
Midcontinent and other
|
7
|
7
|
7
|
9
|
7
|
||||||||||||
|
Total
|
221
|
217
|
216
|
219
|
219
|
||||||||||||
|
NGL (MBBL)
|
|||||||||||||||||
|
California
|
17
|
17
|
17
|
15
|
16
|
||||||||||||
|
Permian
|
27
|
28
|
30
|
31
|
29
|
||||||||||||
|
Midcontinent and other
|
6
|
7
|
7
|
7
|
7
|
||||||||||||
|
Total
|
50
|
52
|
54
|
53
|
52
|
||||||||||||
|
Natural Gas (MMCF)
|
|||||||||||||||||
|
California
|
295
|
293
|
276
|
259
|
280
|
||||||||||||
|
Permian
|
198
|
196
|
186
|
215
|
199
|
||||||||||||
|
Midcontinent and other
|
182
|
192
|
194
|
225
|
198
|
||||||||||||
|
Total
|
675
|
681
|
656
|
699
|
677
|
||||||||||||
|
Latin America
|
|||||||||||||||||
|
Crude Oil (MBBL)
|
Colombia
|
34
|
32
|
33
|
30
|
32
|
|||||||||||
|
Natural Gas (MMCF)
|
Bolivia
|
12
|
15
|
19
|
18
|
16
|
|||||||||||
|
Middle East / North Africa
|
|||||||||||||||||
|
Crude Oil (MBBL)
|
|||||||||||||||||
|
Bahrain
|
3
|
3
|
3
|
3
|
3
|
||||||||||||
|
Dolphin
|
11
|
11
|
12
|
11
|
11
|
||||||||||||
|
Iraq
|
-
|
-
|
-
|
11
|
3
|
||||||||||||
|
Libya
|
13
|
14
|
11
|
11
|
12
|
||||||||||||
|
Oman
|
57
|
60
|
63
|
67
|
62
|
||||||||||||
|
Qatar
|
75
|
78
|
78
|
75
|
76
|
||||||||||||
|
Yemen
|
35
|
31
|
30
|
27
|
31
|
||||||||||||
|
Total
|
194
|
197
|
197
|
205
|
198
|
||||||||||||
|
NGL (MBBL)
|
|||||||||||||||||
|
Dolphin
|
12
|
12
|
13
|
12
|
13
|
||||||||||||
|
Libya
|
1
|
1
|
1
|
1
|
1
|
||||||||||||
|
Total
|
13
|
13
|
14
|
13
|
14
|
||||||||||||
|
Natural Gas (MMCF)
|
|||||||||||||||||
|
Bahrain
|
166
|
161
|
181
|
170
|
169
|
||||||||||||
|
Dolphin
|
228
|
235
|
250
|
232
|
236
|
||||||||||||
|
Oman
|
52
|
48
|
47
|
47
|
48
|
||||||||||||
|
Total
|
446
|
444
|
478
|
449
|
453
|
||||||||||||
|
Barrels of Oil Equivalent (MBOE)
|
701
|
701
|
706
|
714
|
706
|
||||||||||||
14
Investor Relations Supplemental Schedules
|
OCCIDENTAL PETROLEUM
|
|||||||||||||||||
|
2010 SALES VOLUMES
|
|||||||||||||||||
|
Qtr 1
|
Qtr 2
|
Qtr 3
|
Qtr 4
|
TY
|
|||||||||||||
|
NET SALES VOLUMES PER DAY:
|
|||||||||||||||||
|
United States
|
|||||||||||||||||
|
Crude Oil (MBBL)
|
221
|
217
|
216
|
219
|
219
|
||||||||||||
|
NGL (MBBL)
|
50
|
52
|
54
|
53
|
52
|
||||||||||||
|
Natural Gas (MMCF)
|
675
|
681
|
656
|
699
|
677
|
||||||||||||
|
Latin America
|
|||||||||||||||||
|
Crude Oil (MBBL)
|
Colombia
|
33
|
27
|
36
|
31
|
32
|
|||||||||||
|
Natural Gas (MMCF)
|
12
|
15
|
19
|
18
|
16
|
||||||||||||
|
Middle East / North Africa
|
|||||||||||||||||
|
Crude Oil (MBBL)
|
|||||||||||||||||
|
Bahrain
|
2
|
3
|
3
|
3
|
3
|
||||||||||||
|
Dolphin
|
11
|
11
|
12
|
11
|
12
|
||||||||||||
|
Libya
|
4
|
22
|
12
|
9
|
12
|
||||||||||||
|
Oman
|
56
|
58
|
66
|
63
|
61
|
||||||||||||
|
Qatar
|
74
|
78
|
79
|
74
|
76
|
||||||||||||
|
Yemen
|
33
|
32
|
30
|
27
|
30
|
||||||||||||
|
Total
|
180
|
204
|
202
|
187
|
194
|
||||||||||||
|
NGL (MBBL)
|
Dolphin
|
12
|
12
|
13
|
12
|
12
|
|||||||||||
|
Libya
|
-
|
3
|
-
|
3
|
1
|
||||||||||||
|
Total
|
12
|
15
|
13
|
15
|
13
|
||||||||||||
|
Natural Gas (MMCF)
|
446
|
444
|
478
|
449
|
453
|
||||||||||||
|
Barrels of Oil Equivalent (MBOE)
|
685
|
705
|
713
|
699
|
701
|
||||||||||||
15
Investor Relations Supplemental Schedules
|
OCCIDENTAL PETROLEUM
|
|||||||||||||||||
|
2010 REALIZED PRICES
|
|||||||||||||||||
|
Qtr 1
|
Qtr 2
|
Qtr 3
|
Qtr 4
|
TY
|
|||||||||||||
|
OIL & GAS:
|
|||||||||||||||||
|
PRICES
|
|||||||||||||||||
|
United States
|
|||||||||||||||||
|
Crude Oil ($/BBL)
|
73.08
|
71.66
|
71.14
|
79.20
|
73.79
|
||||||||||||
|
NGL ($/BBL)
|
52.36
|
47.65
|
43.67
|
51.97
|
48.86
|
||||||||||||
|
Natural gas ($/MCF)
|
5.62
|
4.19
|
4.20
|
4.13
|
4.53
|
||||||||||||
|
Latin America
|
|||||||||||||||||
|
Crude Oil ($/BBL)
|
75.77
|
72.99
|
71.82
|
81.05
|
75.29
|
||||||||||||
|
Natural Gas ($/MCF)
|
7.35
|
8.00
|
7.71
|
7.76
|
7.73
|
||||||||||||
|
Middle East / North Africa
|
|||||||||||||||||
|
Crude Oil ($/BBL)
|
74.96
|
77.50
|
73.66
|
80.65
|
76.67
|
||||||||||||
|
NGL ($/BBL)
|
26.56
|
31.89
|
23.24
|
39.13
|
30.64
|
||||||||||||
|
Total Worldwide
|
|||||||||||||||||
|
Crude Oil ($/BBL)
|
74.09
|
74.39
|
72.31
|
79.96
|
75.16
|
||||||||||||
|
NGL ($/BBL)
|
47.48
|
44.08
|
39.70
|
49.17
|
45.08
|
||||||||||||
|
Natural Gas ($/MCF)
|
3.74
|
2.93
|
2.85
|
2.91
|
3.11
|
||||||||||||
16
Investor Relations Supplemental Schedules
|
OCCIDENTAL PETROLEUM
|
||||||||
|
QTR 1 PRODUCTION GUIDANCE RECONCILIATION
|
||||||||
|
MBOE PER DAY
|
||||||||
|
Guidance
|
740
|
750
|
||||||
|
Price Impact
|
(10
|
)
|
(10
|
)
|
||||
|
Guidance Adjusted for Price
|
730
|
740
|
||||||
|
Iraq Spending Impact
|
(9
|
)
|
(9
|
)
|
||||
|
721
|
731
|
|||||||
|
Weather Impact
|
(7
|
)
|
(7
|
)
|
||||
|
714
|
724
|
|||||||
|
Actual Production
|
730
|
|||||||
17
Investor Relations Supplemental Schedules
|
OCCIDENTAL PETROLEUM
|
||||||
|
QTR 1 SALES GUIDANCE RECONCILIATION
|
||||||
|
MBOE PER DAY
|
||||||
|
Guidance
|
725
|
|||||
|
Price Impact
|
(10
|
)
|
||||
|
Guidance Adjusted for Price
|
715
|
|||||
|
Weather Impact
|
(7
|
)
|
||||
|
708
|
||||||
|
Lifting timing
|
14
|
|||||
|
722
|
||||||
|
Actual Sales Volume
|
728
|
|||||
18