Attached files
| file | filename |
|---|---|
| 8-K - CURRENT REPORT ON FORM 8-K - OUTERWALL INC | d8k.htm |
| EX-99.1 - EARNINGS RELEASE FOR THE QUARTER ENDED MARCH 31, 2011 - OUTERWALL INC | dex991.htm |
 Investor Update 2011 Q1
April 28, 2011
Exhibit 99.2 |
 2
This presentation contains statements considered forward-looking for purposes
of the safe harbor provisions
under
the
Private
Securities
Litigation
Reform
Act
of
1995.
Actual
results
may
differ
materially from those indicated by these forward-looking statements as a result
of various factors, including those discussed in our most recent Annual
Report on Form 10-K and Quarterly Reports on Form 10-Q filed with
the Securities and Exchange Commission. Coinstar, Inc. assumes no obligation
and does not intend to update these forward-looking statements.
© 2011 Coinstar, Inc. All Rights Reserved. These materials may not be reproduced, altered or
distributed without the express written consent of Coinstar, Inc.
Safe Harbor for Forward-Looking Statements |
 3
2011 Full Year and Q2 Guidance
* Adjusted EBITDA from continuing operations is defined as earnings
before net interest expense, income taxes, depreciation, amortization
and certain other non-cash charges including the write-off from early
retirement of debt, and share-based expenses from continuing
operations.
** Free cash flow from continuing operations is defined as net cash
provided by operating activities from continuing operations after cash
paid for capital expenditures from continuing operations.
2011 Full Year –
Revenue by Segment (in millions)
redbox
$1,450 –
$1,555
Coin
$280 –
$290
New Ventures
$0 –
$5
Total
$1,730 –
$1,850
2011 Full Year –
Other
Adjusted EBITDA from continuing
operations* (in millions)
$335 –
$355
EPS from continuing operations
$2.75 –
$3.10
Shares Outstanding (in millions)
32.1 –
32.2
Estimated Effective Tax Rate
39%
Free Cash Flow from continuing
operations** (in millions)
$110 –
$135
2011 Q2 Guidance
Revenue (in millions)
$430 –
$450
Adjusted EBITDA from continuing
operations* (in millions)
$83 –
$93
EPS from continuing operations
$0.76 –
$0.86
2011 Full Year Capital Expenditures
from Continuing Operations (in millions)
redbox
$125 –
$140
Coin –
New
$8 –
$10
Coin –
Maintenance
$10 –
$12
Corporate/Other
$32 –
$40
Total
$175 –
$202
2011 Full Year –
Installations, net
redbox Kiosks
5,000 –
6,000
Coin Kiosks
0
As of April 28, 2011
© 2011 Coinstar, Inc. All Rights Reserved. These materials may not be reproduced, altered or
distributed without the express written consent of Coinstar, Inc. |
 4
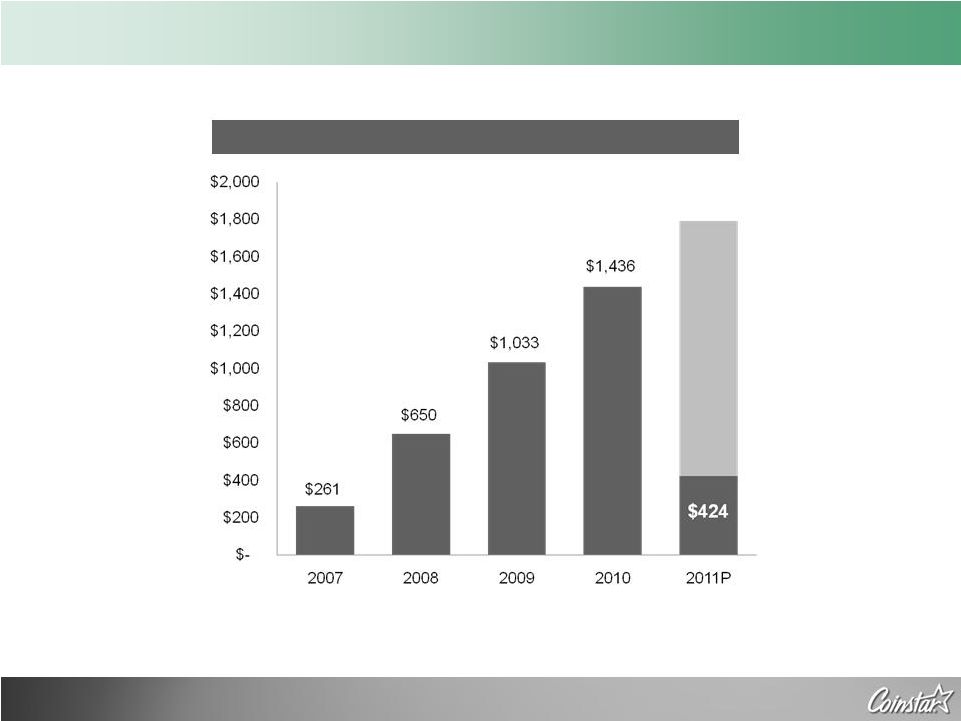
Consolidated Revenue
As of March 31, 2011
* Guidance as of April 28, 2011
$1,730 to $1,850*
Q1
Revenue
(in millions)
© 2011 Coinstar, Inc. All Rights Reserved. These materials may not be reproduced, altered or
distributed without the express written consent of Coinstar, Inc. |
 5
Business Segment Information
As of March 31, 2011
* From acquisition date
redbox *
Q1
Q2
Q3
Q4
YTD
2011
362,344
$
---
---
---
362,344
$
2010
263,078
$
271,869
$
305,365
$
319,397
$
1,159,709
$
2009
154,697
$
188,909
$
198,064
$
231,760
$
773,430
$
2008
60,513
$
89,956
$
104,192
$
133,792
$
388,453
$
2007
2,602
$
3,063
$
1,649
$
2,218
$
9,532
$
Coin
Q1
Q2
Q3
Q4
YTD
2011
20,609
$
---
---
---
20,609
$
2010
15,020
$
28,043
$
27,872
$
24,274
$
95,209
$
2009
22,391
$
26,016
$
27,254
$
26,949
$
102,610
$
Coin
Q1
Q2
Q3
Q4
YTD
2011
61,363
$
---
---
---
61,363
$
2010
59,918
$
70,362
$
74,669
$
71,033
$
275,982
$
2009
57,876
$
64,741
$
69,501
$
66,398
$
258,516
$
2008
59,329
$
64,585
$
71,104
$
66,608
$
261,626
$
2007
54,915
$
62,523
$
67,513
$
66,363
$
251,314
$
New Ventures
Q1
Q2
Q3
Q4
YTD
2011
365
$
---
---
---
365
$
2010
126
$
125
$
153
$
326
$
730
$
2009
180
$
194
$
160
$
143
$
677
$
redbox *
Q1
Q2
Q3
Q4
YTD
2011
50,821
$
---
---
---
50,821
$
2010
46,301
$
37,167
$
53,648
$
54,841
$
191,957
$
2009
20,850
$
24,568
$
26,684
$
29,469
$
101,571
$
New Ventures
Q1
Q2
Q3
Q4
YTD
2011
(2,555)
$
---
---
---
(2,555)
$
2010
(1,488)
$
(1,927)
$
(2,248)
$
(2,559)
$
(8,222)
$
2009
(154)
$
(641)
$
(669)
$
(617)
$
(2,081)
$
Revenue
Operating Profit
(in thousands)
(in thousands)
© 2011 Coinstar, Inc. All Rights Reserved. These materials may not be reproduced, altered or
distributed without the express written consent of Coinstar, Inc. |
 6
Business Segment Information
As of March 31, 2011
Coin
Q1
Q2
Q3
Q4
YTD
2011
7,371
$
---
---
---
7,371
$
2010
7,059
$
7,562
$
7,467
$
7,632
$
29,720
$
2009
6,741
$
7,177
$
7,081
$
7,008
$
28,007
$
redbox *
Q1
Q2
Q3
Q4
YTD
2011
27,098
$
---
---
---
27,098
$
2010
22,121
$
23,866
$
23,956
$
23,503
$
93,446
$
2009
13,169
$
14,725
$
15,527
$
17,267
$
60,688
$
New Ventures
Q1
Q2
Q3
Q4
YTD
2011
175
$
---
---
---
175
$
2010
3,500
$
184
$
(41)
$
183
$
3,826
$
2009
240
$
273
$
367
$
406
$
1,286
$
Depreciation, Amortization and Other
(in thousands)
* From acquisition date
© 2011 Coinstar, Inc. All Rights Reserved. These materials may not be reproduced, altered or
distributed without the express written consent of Coinstar, Inc. |
 7
Installations and Same Store Sales
As of
March 31, 2011
redbox Kiosks (rounded)
Q1
Q2
Q3
Q4
2011
31,800
---
---
---
2010
24,800
26,900
28,500
30,200
2009
15,400
17,900
20,600
22,400
2008
7,900
9,600
11,800
13,700
2007
3,000
4,300
5,700
7,000
Coin Kiosk Same Store Sales
Q1
Q2
Q3
Q4
2011
5.3%
---
---
---
2010
0.5%
7.9%
7.9%
10.0%
2009
-5.0%
-4.3%
-5.4%
-5.1%
Coin Kiosks (rounded)
Q1
Q2
Q3
Q4
2011
18,800
---
---
---
2010
19,100
19,000
18,900
18,900
2009
18,400
18,400
18,800
19,200
2008
15,500
16,500
17,500
18,400
2007
13,800
14,200
14,500
15,400
redbox Kiosk Same Store Sales
Q1
Q2
Q3
Q4
2011
15.3%
---
---
---
2010
21.0%
3.5%
17.2%
12.5%
2009
35.0%
33.0%
26.3%
21.0%
redbox
Coin
© 2011 Coinstar, Inc. All Rights Reserved. These materials may not be reproduced, altered or
distributed without the express written consent of Coinstar, Inc. |
 8
As of March 31, 2011
redbox Gross Margin
Q1
Q2
Q3
Q4
YTD
2011
53.1%
---
---
---
53.1%
2010
59.0%
56.4%
59.7%
54.4%
57.3%
2009
59.6%
57.4%
58.1%
54.0%
57.0%
2008
65.2%
63.0%
62.5%
62.2%
62.9%
Q1
Q2
Q3
Q4
YTD
2011
38,472
$
---
---
---
38,472
$
2010
31,517
$
52,822
$
48,135
$
38,373
$
170,847
$
2009
34,987
$
38,288
$
28,647
$
46,545
$
148,467
$
2008
28,182
$
34,653
$
47,692
$
33,525
$
144,052
$
2007
7,495
$
11,926
$
15,375
$
15,047
$
49,843
$
Consolidated Capital Expenditures* (in thousands)
* For continuing operations
© 2011 Coinstar, Inc. All Rights Reserved. These materials may not be reproduced, altered or
distributed without the express written consent of Coinstar, Inc.
Other Information |
 9
* All Walmart related companies, including Sam’s Club and ASDA
As of March 31, 2011
•
Walmart*
•
Walgreens
•
Kroger
•
7-
Eleven
•
McDonald’s
•
Walmart*
•
Kroger
•
Supervalu
•
Delhaize
•
Ahold
•
Walmart*
•
Walgreens
•
Kroger
•
7-Eleven
•
Supervalu
redbox
Coin
Consolidated
© 2011 Coinstar, Inc. All Rights Reserved. These materials may not be reproduced, altered or
distributed without the express written consent of Coinstar, Inc.
Top 5 Customers by Revenue |