Attached files
| file | filename |
|---|---|
| 8-K - FORM 8-K - BANC OF CALIFORNIA, INC. | d8k.htm |
 April
2011 Exhibit 99.1 |
 1
Important Disclosures
Forward-Looking Statements These
materials contain various forward-looking statements that are based on assumptions and describe our future plans and strategies and our expectations. These forward-
looking statements are generally identified by words such as “believe,”
“expect,” “intend,” “anticipate,” “estimate,” “project,” or similar words. Our ability to predict results or the
actual effect of future plans or strategies is uncertain. Factors which could cause actual
results to differ materially from those anticipated include, but are not limited to the
continuation or worsening of current recessionary conditions, as well as continued turmoil in
the financial markets; our ability to implement our acquisition strategy and the
applicability of the FDIC Statement of Policy on Qualifications for Failed Bank Acquisitions
to us; the credit risks of lending activities, which may be affected by further deterioration
in the real estate market, may lead to decreased loan delinquencies, losses and nonperforming
assets in our loan portfolios, and may result in our allowance for loan losses not
being adequate to cover actual losses, and require us to materially increase our reserves;
changes in general economic conditions, either nationally or in our market area; changes
in the levels of general interest rates, and the relative differences between short- and
long-term interest rates, deposit interest rates, our net interest margin and funding sources;
fluctuations in the demand for loans, the number of unsold homes and other properties and
fluctuations in commercial and residential real estate values in our market area;
results of examinations of us by the Office of Thrift Supervision or by other regulatory
authorities, including our compliance with our Memorandum of Understanding and the
possibility that any such regulatory authority may, among other things, require us to increase
our allowance for loan losses, write-down asset values, increase our capital levels, or
affect our ability to borrow funds or maintain or increase deposits, which could adversely
affect our liquidity and earnings; legislative or regulatory changes that adversely affect
our business, including changes in the interpretation of regulatory capital or other rules;
our ability to control operating costs and expenses; our ability to successfully integrate any
assets, liabilities, customers, systems, and management personnel we have acquired or may in
the future acquire into our operations and our ability to realize related revenue
synergies and cost savings within expected time frames and any goodwill charges related
thereto; staffing fluctuations in response to product demand or the implementation of
corporate strategies that affect our work force and potential associated charges; errors in
our estimates in determining fair value of certain of our assets, which may result in
significant declines in valuation; the network and computer systems on which we depend could
fail or experience a security breach; our ability to retain key members of our senior
management team; costs and effects of litigation, including settlements and judgments;
increased competitive pressures among financial services companies; changes in consumer
spending, borrowing and savings habits; adverse changes in the securities markets; earthquake,
fire or other natural disasters affecting the condition of real estate collateral; the
availability of resources to address changes in laws, rules, or regulations or to respond to
regulatory actions; inability of key third-party providers to perform their obligations to us;
changes in accounting policies and practices, as may be adopted by the financial institution
regulatory agencies or the Financial Accounting Standards Board or their application to
our business or final audit adjustments, including additional guidance and interpretation on
accounting issues and details of the implementation of new accounting methods; war or
terrorist activities; other economic, competitive, governmental, regulatory, and technological factors affecting our operations, pricing, products, and services and the other risks
described as detailed in the Company’s reports filed with the SEC, including our Annual
Report on Form 10-K for the fiscal year ended December 31, 2010 and subsequently filed
Quarterly Reports on Form 10-Q and Current Reports on Form 8-K. As used herein, the
“Company,” “we,” “us” and “our” refer to First PacTrust Bancorp, Inc. and the “Bank” refers
to Pacific Trust Bank, a wholly owned subsidiary of the Company. Analysts
Information
The “rating” and “price target” information set forth on page 12 herein
was obtained from reports published by the respective securities analysts listed. The Company has no
affiliation with these analysts and did not participate in the preparation of their
reports. By including this rating and price target information herein, the Company does not in any
way endorse or support such information or assume any responsibility for its accuracy.
Nor does the inclusion of this information represent an opinion, forecast, estimate or
prediction of the Company regarding the future performance of the Company or its stock price
or the advisability of investing in the Company’s stock. There may be analysts other
than those listed herein who have issued, or in the future may issue, ratings and price
targets for the Company’s stock that differ materially from those contained herein. The
ratings and price targets contained herein are the most recent available and are subject to
change, and the Company assumes no responsibility or obligation to update this material
for any such change or to continue to include ratings and/or price targets issued by any analysts, including those listed herein.
|
 2
NAME (CHARTER TYPE)
12/31/2007
12/31/2008
12/31/2009
MOST
RECENT
California Bank & Trust (STATE)
1
1
1
1
Pacific Western Bank (STATE)
2
2
2
2
Imperial Capital Bank (STATE)
3
3
FAIL
FAIL
La Jolla Bank (FEDERAL)
4
4
3
FAIL
San Diego National Bank (FEDERAL)
5
5
FAIL
FAIL
Bank of Internet USA (FEDERAL)
6
6
4
3
PACIFIC TRUST BANK (FEDERAL)
7
7
6
5
Torrey Pines Bank (STATE)
8
8
5
4
1st Pacific Bank of California (STATE)
9
10
9
FAIL
Metro United Bank (STATE)
10
9
7
6
Regents Bank (FEDERAL)
11
12
10
7
Silvergate Bank (STATE)
12
11
8
8
Balboa Thrift and Loan Association (STATE)
13
13
12
11
Discovery Bank (STATE)
14
16
NA
NA
Security Business Bank of S.D. (STATE)
15
14
13
12
Home Bank of California (STATE)
16
17
14
15
California Community Bank (STATE)
17
15
11
10
Neighborhood National Bank (FEDERAL)
18
18
16
14
San Diego Trust Bank (STATE)
19
NA
15
13
Rancho Santa Fe Thrift & Loan (STATE)
20
20
NA
NA
Borrego Springs Bank (FEDERAL)
NA
19
20
16
San Diego Private Bank (STATE)
NA
NA
17
17
First Business Bank (FEDERAL)
NA
NA
18
18
Seacoast Commerce Bank (STATE)
NA
NA
19
19
Coronado First Bank (STATE)
NA
NA
NA
20
Community Roots
Chartered by the U.S. Office of Thrift Supervision
Insured by the FDIC
Founded in 1941 with 70 years of continuous
operations (public since 2002)
Former credit union for Rohr, Inc.
95 employees and 18,000 depository relationships
Branch Network
10 banking locations, including 7 full service branches
11
th
branch to open in June 2011
Member of CU Service Center Network with over
4,100 shared branch locations throughout the U.S.
0.80% cost of deposits with no brokered funds
Funding costs continue to trend down
Credit Underwriting
Average FICO score at origination of 739
Average LTV at origination of 58%
No construction or subprime loans. Limited land loans
31 non-performing loans ($19.6 million, net of SVAs),
31 as TDRs ($22.3 million), and 8 OREO assets ($6.4
million)
Attractive Market
1
st
Deed of Trust SFR mortgages focused in beach
cities throughout the San Diego area (i.e., La Jolla,
Coronado, Rancho Santa Fe, Del Mar and Carlsbad)
Rebounding home prices in San Diego since Q3-09
Strong Capital Partners
Completed $60 million capital raise led by TCW & COR
Capital
Ranking for Largest Community Bank Franchises in San Diego by Assets *
*Source: FDIC Website as of 6/30/2010.
Overview |
 3
CAMEL Summary -3/31/11
ASSETS
CAPITAL
MANAGEMENT
EARNINGS
LIQUIDITY
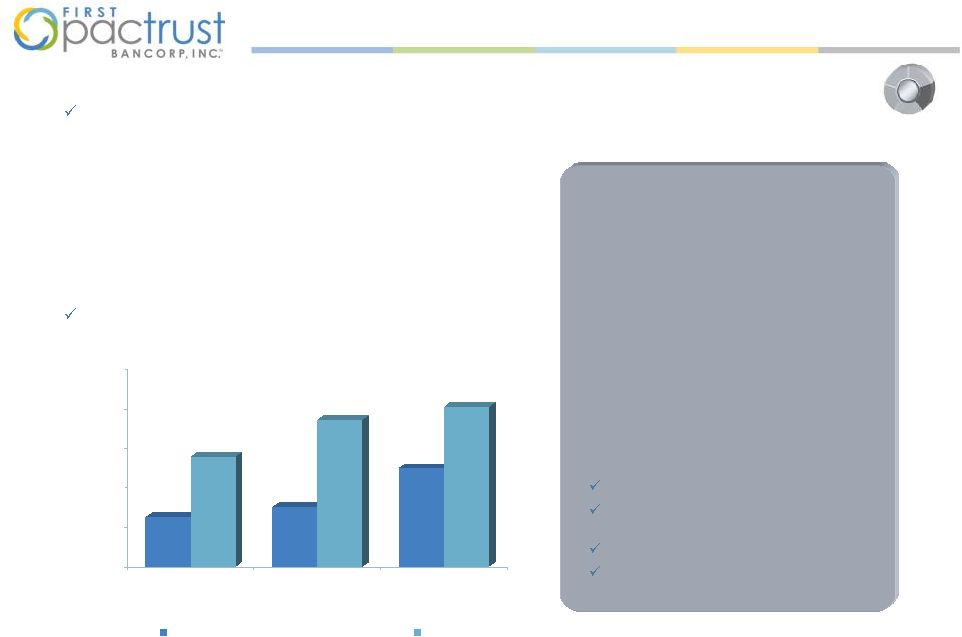
Positioned for growth
Exceeds regulatory capital standards
for “well-capitalized”
banks. Capital
to support up to $1.0 billion of
organic growth without need for
new capital. Capacity to acquire
added capital for accretive
transactions ($250 million shelf)
Significant capacity to originate or
acquire meaningful volumes of CRE
and small business (C&I) loans
Management team with diverse
experience in executing
consolidation strategy in Southern
California market
Key Metrics
$13.94 Tangible Common Equity per share
$135.7 million Tangible Common Equity
16.3% Tangible Common Equity (Bank)
16.0% Tier 1 Risk-Based (Bank)
17.3% Total Risk-Based (Bank)
$157.3 million market cap
$835.0 million of assets
$681 million total gross loans, 83% first deed of
trust SFRs
1.75% loan loss reserve
$74 million security portfolio, plus $23.7 million
in interest bearing deposits
Prudent approach to underwriting & lending and
proven ability to transform “thrifts”
into
community banks.
Executive team responsible for 17 bank
acquisitions / integrations in California
Deep expertise with unassisted and FDIC
assisted acquisitions.
$2.0 million core earnings in Q1 2011
Net interest margin 3.63% (Q1)
$0.105 first quarter dividend
$634 million deposits, no brokered deposits
0.80% cost of deposits
$60 million of FHLB borrowings
$102 million in cash and securities |
 4
1. Organic Growth
2. Traditional M&A
3. FDIC-Based M&A
Increase market penetration within the
Bank’s primary footprint and expand into
neighboring regions
—
Acquire prime branch locations from
distressed sellers or the FDIC
—
Open new retail banking locations and
staff with well known community
bankers to attract core deposits
—
Enhance loan and deposit product set
—
Establish high quality C&I and
community banking relationships
Diversify portfolio and prudently deploy
capital by originating high quality
commercial real estate and C&I loans
—
Hire great talent with strong
production and risk management skills
—
Exploit high market demand resulting
from limited supply of lenders in
Southern California
—
Strengthened balance sheet, strong
credit and pricing with reduced
concentration risk
Selectively explore traditional
acquisitions
Focus on banks with the following
characteristics
—
Privately held or limited trading
liquidity
—
Subscale (< $1.5 billion in assets)
—
Broken business models
—
Enlightened boards and management
teams that understand the “new
paradigm”
in banking as well as the
value of partnering with a strong
community bank.
Strategic benefits to franchise
development
—
Markets
—
Products
—
People
Pursue strategic transactions with FDIC
assistance
—
Focus on smaller banks (i.e., $500
million in assets and less) in attractive
markets
—
FDIC’s troubled list is currently over
800 banks
Acquire attractive assets from the FDIC
—
Acquired La Jolla branch in November
2010 from FDIC
—
Acquired San Marcos branch in
February 2011 from FDIC
—
Additional properties and notes may
become available
Growth Strategy |
 5
Keys to Success
Mission Statement:
To be the premier
community bank in
Southern California
serving the needs of
growing families, high net
worth individuals,
professionals, small to mid
sized businesses and their
owners
Market
Opportunity
Management
Team
Access to
Capital
Strong
Balance
Sheet
Scalable
Business |
 6
Officer
Position
Experience
Greg Mitchell
President & CEO
First Pac Trust Bancorp
Transformed a thrift with six branches and $700
million in assets to what became California
National Bank. 68 branches and $7.7 billion in
assets
Investment banker focusing on regional banks
in the Western United States
Former regulator with OTS, founder of Capital
Assistance Group for troubled thrifts during
RTC
Richard Herrin
Chief Administrative
Officer
FDIC regulator until 2010; Special Operations
Group overseeing distressed financial institutions;
Receiver In Charge of failed banks; Asset
Management Group for Western Region
Southern California community banker with
deep credit, operations and asset management
experience
Matt
Bonaccorso
Chief Credit Officer
Managed the Western operation of Special
Assets Group at U.S. Bank
30+ years of banking experience including eight
years as Chief Credit Officer at California National
Bank
Hans Ganz
President & CEO, Pacific
Trust Bank
Grew First Pacific Trust Bank from a four branch
credit union with $200 million of assets to a
publicly traded thrift with 9 branches and $900
million of assets
Deep expertise in residential lending focused in the
Southern California market
Recent Additions to
Management Team include
Gaylin Anderson (Chief Retail
Officer), and Chang Liu (Chief
Lending Officer) and Joseph
Abraham (Credit Services)
Team members have successfully
transformed a small Southern
California based thrift into a
regional bank with 68 branches
and $7+ billion in assets and
robust levels of organic loan
production
Team members have overseen
the acquisition and integration of
more than 17 banks in California
Team members possess deep
skill and insights in unassisted
and assisted acquisitions as well
as other FDIC opportunities
Equity ownership of insiders
exceeds 30% of fully-diluted
shares outstanding
Management Team |
 7
5%
11.14%
6%
14.92%
10%
16.17%
0.00%
4.00%
8.00%
12.00%
16.00%
20.00%
Tier 1 Leverage Ratio
Tier 1 Risked Based
Capital
Total Risk-Based
Capital
Well Capitalized Minimum
FPTB
Access to Capital
Pacific Trust Bank’s equity capitalization exceed “well-
capitalized”
levels by $40 million
—Could support
more than $450+ million in added CRE assets without exceeding concentration
limits
—Eligible to
apply for up to $32 million of additional Tier 1 capital via the Small Business
Lending Fund
—100% of capital
would be tangible equity with no TRUPS, goodwill or debt
Strong institutional investor base led by Trust Company of the
West and COR Capital
Example Opportunity
Small Business Lending Fund (SBLF)
Enacted into law by President Obama as part of the
Small Business Jobs Act of 2010, the SBLF
encourages lending to small businesses by providing
Tier 1 capital to qualified community banks with less
than $10 billion in assets. Banks with less than $1
billion in capital as of 12/31/09 will be given priority
of approval. The U.S. Treasury will charge a rate of
as low as 1% for five years to banks that increase
lending to small business by 10%.
Subject to the support of its regulators and approval
by the Department of Treasury, First PacTrust:
qualifies for participation in SBLF;
meets the regulatory conditions for
approval;
qualifies for priority approval; and
is eligible to receive up to $32 million in
Tier 1 capital
Note: Ratios as of 12/31/10.
Bancorp maintains 16.3% tangible equity to total assets
|
 8
Southern California Banks with Assets < $1.0 Billion*
Market Opportunity
1.
Banks with less than $500 million to $1 billion in assets
in Southern California are sub-scale and face increasing
difficulties achieving profitability. These include
concentration risks, regulatory pressure to consolidate,
and difficulties raising capital.
2.
First PacTrust is well positioned to be a leading
consolidator of the market with a liquid, public
currency, strong management team, scalable balance
sheet and profitable business with attractive dividend.
Banks facing increased regulatory and earnings
pressure are more and more likely to seek better-
capitalized, well-equipped partners such as First
PacTrust Bancorp.
—
There are nearly 150 potential consolidation targets
with < $1 Billion in assets headquartered within First
PacTrust’s footprint.
—
First PacTrust can offer public stock in a transaction
that provides tax efficiency to potential targets.
—
Most of the other acquirers are either too large to
focus on sub $500 million to $1 billion banks or are
private, cash buyers without the ability to provide
targets with continuing bank exposure.
Service Area
Number
Assets ($mm)
Assets/Bank ($mm)
Los Angeles Service Areas
88
$24,555,905
$279,044
San Diego/Orange County Service Areas
58
$14,865,761
$256,306
Grand Total
146
$39,421,666
$270,011
*Source:
FDIC website with 9/30/10 reported data.
Los Angeles Service Area include Long Beach, Santa Ana, Oxnard, Thousand Oaks, and
Ventura. San Diego/Orange County Service areas include Riverside, San
Bernardino, Ontario, Carlsbad, and San Marcos.
Rationale
Belief |
 9
$102 million of cash and securities including fed funds,
agencies and RMBS/Re-REMICs
—
Marked to market accounting based on independent
valuations provided by Red Pine-
Houlihan Lokey
—
Strong investment returns historically including 2008-
2011
$634 million in deposits
—
No brokered deposits
—
Green accounts tie deposit accounts to borrowers
outstanding balance increasing relationship with
clients
—
$60 million FHLB borrowings
—
Stable, growing funding base
Ability to take advantage of massive displacement of
quality bankers ,premium retail banking locations and
disaffected consumers (organic growth)
Project moderate growth in low cost deposits as PacTrust
rolls-out small business and community banking
initiatives
Strong Balance Sheet
No debt or preferred stock (repaid TARP in 2010)
17.27% Total Risk Based Capital
$37 million in excess capital
Eligible for Small Business Lending Fund, active shelf
registration and strong relationships with potential
capital partners
$653 million of performing loans comprised primarily of
first deeds of trust on SFR
—
Performing loans held at book value
—
Receive independent valuation of every SFR at least
twice per year from Data Quick
$34.1million of non-performing assets including non-
performing loans and OREO
—
All NPAs receive updated appraisal upon entry into
NPA category and are marked at no more than 90% of
appraised value
Assets
Liabilities |
 10
1.
Community banks with strong and scalable balance
sheets, solid capital levels with access to capital markets,
and proven management teams in achieving organic and
acquisitive growth will thrive in the current economic
and regulatory environment and have the ability to
produce superior returns to shareholders
2.
With the capacity to originate or acquire more high-
quality CRE and C&I loans, Pacific Trust Bank is
positioned to take advantage of limited competition and
high demand with the “small ticket”
commercial real
estate segment
3.
Due to its large SFR loan concentration and lack of
competition, First PacTrust can advance its other
commercial lending businesses
Numerous failures of both community and regional
banks in Southern California have left a massive void in
the lending market
Majority of displaced customers are “highly dissatisfied”
with their new bank
Due to the scarcity in supply of loan originators, First
PacTrust will benefit from advantageous credit and
pricing terms
Having previously overseen billions in bank assets, First
PacTrust’s management team has extensive experience
underwriting in these asset classes
—
As numerous local banks seek additional capital to
strengthen balance sheets, absorb losses from legacy
positions, and meet regulatory capital requirements,
they are unable to meet the credit needs of credit-
worthy clients
—
Many banks are prevented from lending in CRE & C&I
asset classes due to concentration limits
—
Regulations limit exposure to each asset class to no
more than 350% its Tier 1 equity
Rationale
Belief
Scalable Business |
 Price
$16.17
As of 04/26/11
Yield / Div.
2.60%
/
$0.42
Market Cap
$157.3M
Avg Volume (3M)
29,657
Tangible Book Value
$136.1M
Volatility
28%
Shares Outstanding
9,729,066
Beta
0.50
Analyst
Date Initiated
Rating
Price Target
Baird
10/15/2010
Overweight
$21.00
Wunderlich
01/25/2011
Buy
$20.00
Raymond James
12/30/2010
Buy
$19.00
B. Riley
4/12/2011
Buy
$19.00
DA Davidson
2/18/11
Buy
$19.00
FIG Partners
12/27/2010
Overweight
$17.50
Sandler O'Neill
12/30/2010
Buy
$16.50
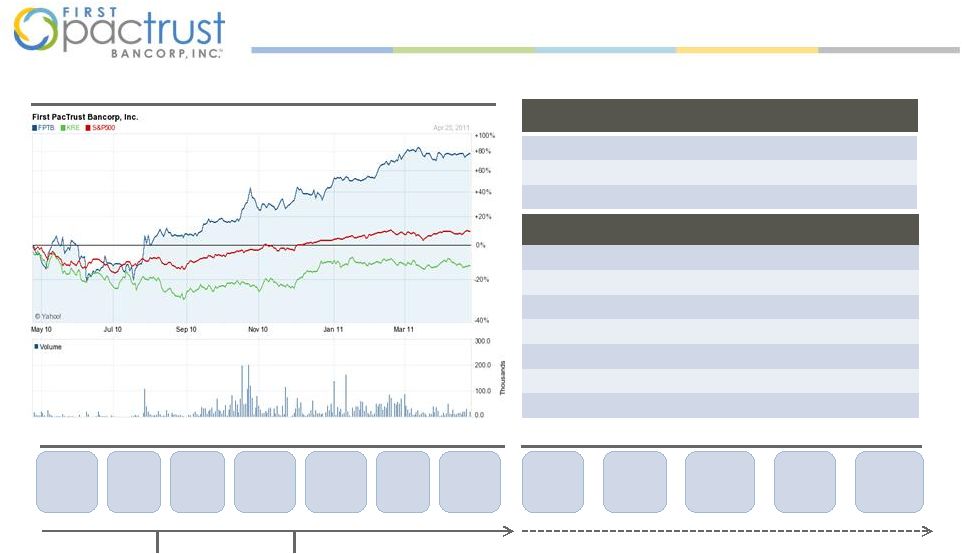
Relative Performance
October
November
December
2011
2010
Execution
Q3 Earnings
reported
$3.0 million
Net income ,
$0.66 EPS
Annc’d
purchase
of La Jolla
branch
from FDIC
Annc’d
completion
of $60M
private
placement
Annc’d
100% div.
increase
from 5 cents/q
to 10 cents/q
Bancorp sold
subordinated
debt at $3.5M
gain to
Book value
Full
repayment
of $19.3M
in TARP
funds
Annc’d
Purchase of
San Marcos
branch
from FDIC
Acquisition
of
Whole Bank(s)
Branch
acquisitions
and de novo
openings
Commercial
lending
rollout
Asset
purchases
Upgrade
systems and
infrastructure
Current Activities
Market Beginning to Recognize
Execution
Note:
Market info as of 04/26/2011. The “rating” and “price target” information set
forth herein was obtained from reports published by the respective securities analysts listed. The
Company has no affiliation with these analysts and did not participate in the preparation of their
reports. By including this rating and price target information herein, the Company does
not in any way endorse or support such information or assume any responsibility for its accuracy. Nor does the inclusion of this information represent an
opinion, forecast, estimate or prediction of the Company regarding the future performance of the
Company or its stock price or the advisability of investing in the Company’s stock.
There may be analysts other than those listed herein who have issued, or in the future may issue, ratings and price targets for the Company’s stock that differ
materially from those contained herein. The ratings and price targets contained herein
are the most recent available and are subject to change, and the Company assumes no
responsibility or obligation to update this material for any such change or to continue to include ratings and/or price targets issued by any analysts, including those listed
herein.
11 |
 12
Dividend Paying Banks, < $2.5b in Assets, Raised > $30m since 1/2009
FPTB stock
price would
need to
appreciate
21% to reach
peer median
Company Name
Ticker
City
State
Stock Price ($)
TBV ($)
Price /
TBV
Bank of Commerce Holdings
BOCH
Redding
CA
4.40
4.75
88.5
CNB Financial Corporation
CCNE
Clearfield
PA
13.68
8.31
164.6
First of Long Island Corporation
FLIC
Glen Head
NY
25.72
17.99
143.0
Lakeland Financial Corporation
LKFN
Warsaw
IN
21.45
15.27
140.5
MidSouth Bancorp, Inc.
MSL
Lafayette
LA
14.16
10.57
134.0
Orrstown Financial Services, Inc.
ORRF
Shippensburg
PA
26.59
17.50
151.9
Pacific Continental Corporation
PCBK
Eugene
OR
9.50
8.22
115.6
Sterling Bancorp
STL
New York
NY
10.55
5.93
177.9
Tower Bancorp, Inc.
TOBC
Harrisburg
PA
22.11
19.41
113.9
Univest Corp of Pennsylvania
UVSP
Souderton
PA
16.74
12.73
131.5
Washington Banking Company
WBCO
Oak Harbor
WA
13.95
9.71
143.7
Average
136.8
Median
140.5
First PacTrust Bancorp, Inc.
FPTB
Chula Vista
CA
16.17
13.94
116.0
Trading price as of April 26, 2011
Source: Bloomberg
Market Valuation of Peers |
 13
Delivering Strong Earnings During
Growth Phase
$2.0 million in core earnings in the first quarter of 2011
—
Historically strong core earnings have enabled First PacTrust Bancorp to charge-off or
reserve for credit losses while providing cumulative net earnings for the period
2008-2011 $0.42 (annualized)/ share cash dividend (5% Q1 increase)
Net interest margin of 3.63% for the quarter ended 3/31/2011
Note: Core earnings equals pre-tax earnings, plus provisions, less private placement expenses, less
gain on sale of securities.
Opportunity for further NIM expansion as FHLB advances and higher-cost CDs mature in
2011 |
 14
Business Plan
Grow core earnings by prudently
deploying capital into CRE and C&I
lending
Open 3-5 de novo branches in
Southern California
Complete $200 -
$500 million of
accretive M&A activity (where
prudent)
Purchase high quality assets at
distressed prices
4% + NIM
Low 50s efficiency ratio
1.2% ROAA
Reach critical mass (~$1 billion
assets) in each of Los Angeles
County, Orange County, and San
Diego County
Secure dividend with growth that
exceeds inflation
2011 Goals
5 Year Objectives |
 15
Why Invest in First PacTrust Bancorp?
First PacTrust is a profitable bank with a strong dividend
First PacTrust is well-positioned to be a lead bank consolidator in Southern
California —
With a scalable balance sheet, access to fresh capital, First PacTrust Bancorp is uniquely
positioned to benefit from distress in the Southern California banking
environment —
First-rate management team with a solid track record of managing and growing larger
institutions
in
the
region
will
continue
to
“unlock”
value
and
exploit
opportunities
—
Publicly traded currency
—
Scalable balance sheet and strong opportunities to prudently originate new loans in CRE,
construction, and C&I asset classes
First PacTrust offers investors an attractive investment opportunity
—
Currently trading at slight premium to tangible book value --
a significant discount to peers
—
Top notch management team
—
Quantifiable loan portfolio |
 Appendix
 |
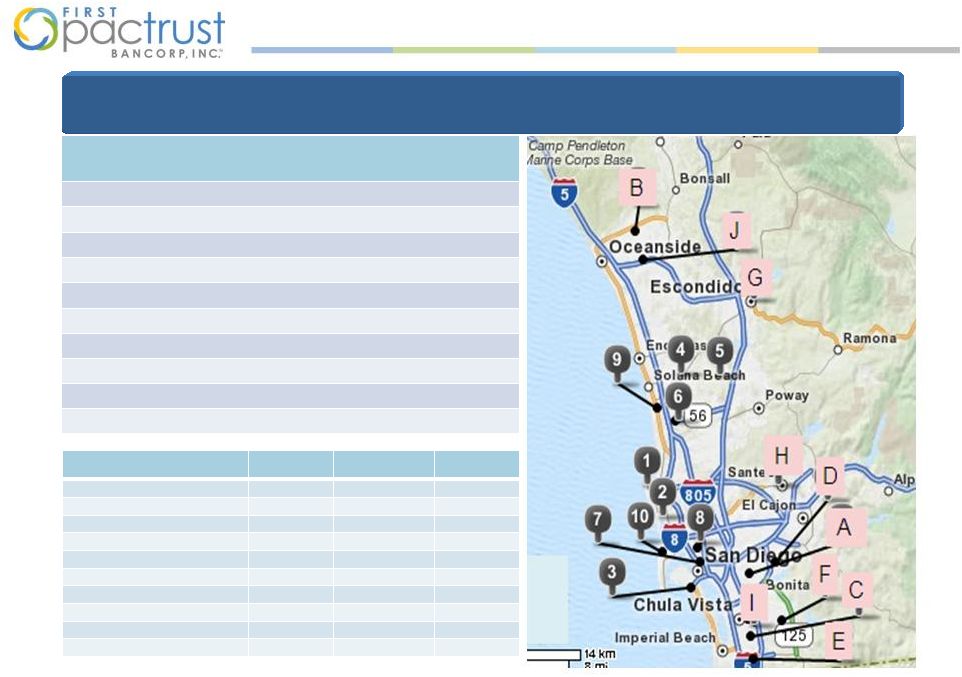
 17
Chula Vista Main Branch
Chula Vista Admin Center
El Cajon Branch
Balboa Branch
Rancho Bernardo Branch
Temecula Branch
Riverside Branch
Chula Vista
Riverside
Mini Branches
Franchise Map and Branches |
 18
Loan Breakdown as of 3/31/11
Pacific Trust Bank’s
loan portfolio consists predominantly of 1-4 family loans making up 83% of the Bank’s gross loans. $676
million of gross loans Loans were originated at an average 58% LTV
All underwritings used full appraisals and were
reviewed by senior management
Delinquency rate of watch list loans is low and
declining
100% of SFR portfolio is revalued twice per year
1-4 Unit Residential
Balance
1
st
TD
$341,421,568
1
st
TD “Green”
Accts
$221,168,034
2
nd
TD
$657,548
Total
$562,589,602
Non-Residential
$54,556,989
Multifamily
$32,594,522
Consumer
$19,629,646
Land
$6,038,750
C&I
$904,432
Pacific Trust Bank Loan
Composition |
 19
A
large
concentration
of
Bank
SFR
loans
are
secured
by
collateral
located
in
highly
desirable
beach
communities
,
whereas
the
majority
of
foreclosure
activity
in
San
Diego
County
has
taken
place
in
southern
or
eastern
parts
of
the
County
away
from
the coast.
Pacific Trust Bank Location of SFR
Loans
Area
# of
Loans
Bal
Avg Bal
WA LTV
1. La Jolla
74
$106.8M
$1.4M
48%
2. Pacific Beach
75
$55.2M
$735K
55%
3. Coronado
40
$41.4M
$1.0M
46%
4. Rancho Santa Fe (92067)
13
$19.2M
$1.5M
59%
5. Rancho Bernardo (92127)
14
$12.1M
$867K
70%
6. North City West
19
$9.7M
$513K
61%
7. Downtown
18
$9.2M
$512K
80%
8. Hillcrest
18
$9.1M
$504K
62%
9. Del Mar
10
$8.2M
$821K
28%
10. Ocean Beach
13
$7.7M
$594K
75%
City
# Foreclosure
Avg Mortgage
Mkt %
A. Encanto
336
$237K
3.45%
B. Oceanside (92057)
280
$262K
2.88%
C. Chula Vista (91911)
279
$254K
2.87%
D. Spring Valley
276
$249K
2.84%
E. S. San Diego (92154)
266
$262K
2.73%
F. Chula Vista (91913)
254
$329K
2.61%
G. Escondido (92027)
251
$271K
2.58%
H. Santee
220
$273K
2.26%
I. Chula Vista (91910)
219
$300K
2.25%
J. Oceanside (92056)
217
$298K
2.20% |
 20
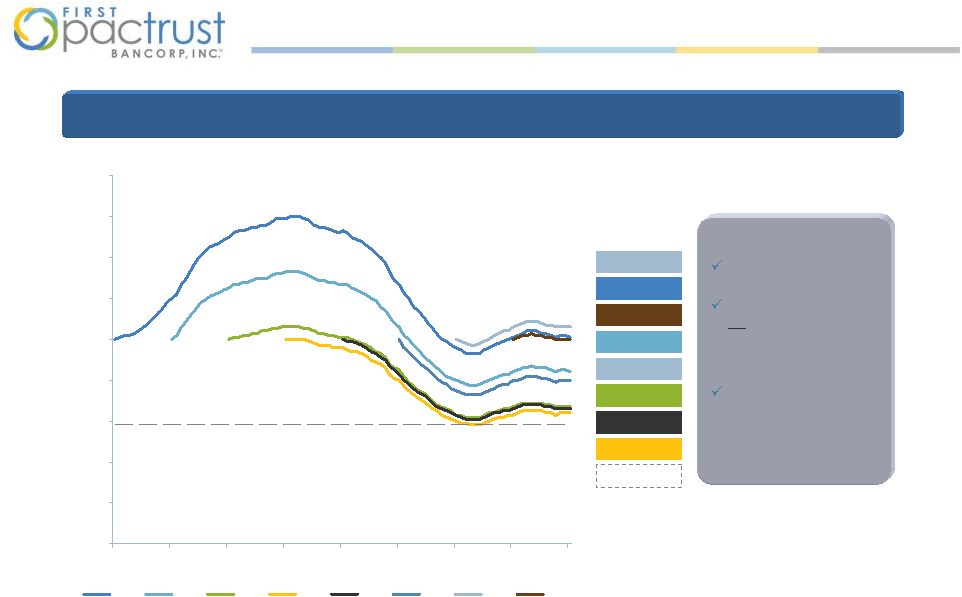
San Diego Market
Leading Southern
California recovery
Home price increase
9%
since 2009 as
measured by S&P Case
Shiller Home Price
index
Stable economy with
vast and growing
military presence and
robust tech industry
(1) Source: S&P Case Shiller Home Price Index for San Diego County.
0%
20%
40%
60%
80%
100%
120%
140%
160%
180%
2003
2004
2005
2006
2007
2008
2009
2010
2011
2003
2004
2005
2006
2007
2008
2009
2010
2009: 106%
2003: 101%
2008: 80%
2004: 84%
2007: 66%
2005: 67%
2006: 64%
58% Avg LTV
San
Diego
County
Home
Prices
(1)
Bank’s Primary Market Area
Recovering
First
PacTrust’s
primary
market
area
of
San
Diego
has
exhibited
strong
recovery
rates
in
home
prices.
2010: 100% |
 21
Pacific
Trust
Bank
has
$11.9
million
of
loan
loss
reserves
which
provide
strong
coverage
against
$26
million in Core NPLs The $2.5 million in REOs consist of 6 properties.
*
(1)
Numbers are Bank level gross of SVA
(2)
An additional $8.3M in NPA held at FPTB including 2 land loans
totaling $4.4M and 2 REO totaling $3.9M (3)
Gross Non-performing Assets (NPA) = Non-performing Loans (NPLs) +
OREOs. (4)
Core NPL= Loans including TDR +90 Days DQ. Core NPL is $26
million at March 31, 2011. (5)
Allowance for Loan Losses includes $8.0M of GVA and $3.9M in SVA.
Non-Performing Asset Overview-
PACIFIC TRUST BANK* |
 22
Pacific Trust Bank’s
60-89 Day DQs declined for the third consecutive quarter while 90+ Day DQs increased due
to delayed restructurings of a number of loans *
Delinquent Mortgages-
PACIFIC TRUST BANK*
*Non-performing loans increased by $7.7 million, to $27.6 million, or 3.31% of total assets during
the first quarter of 2011. The increase was largely due to the following loans: a $3.7
million multi-family loan and related $1.0 million HELOC, and a
$1.8 million land loan |
 23
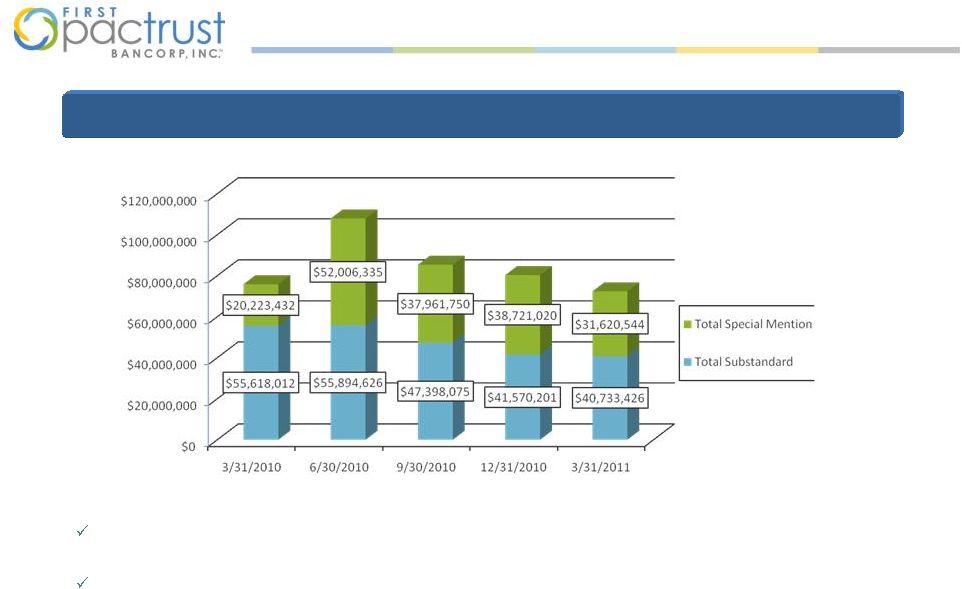
Total classified loans totaled $72.3MM at March 31, 2011 compared to $80.2M in 4Q10.
Reduction reflects to transfer of 2 loans totaling $4.4 million to Bancorp.
Loans rated Substandard include loans on non-accrual and impaired TDR.
Classified Loans-
PACIFIC TRUST BANK
Pacific Trust Bank’s
classified loans decreased in 3Q10 and 4Q10 from its peak in 2Q10. |
 24
Most of the Bank’s Classified Loans are performing and earning interest
income. •
82% of Special Mention loans are performing.
•34% of Substandard loans are performing.
•18% of classified loans are TDR that are performing and earning interest
income Reason for SM
Classification
# of
Loans
Balance
% of SM
Loans
60 Days DQ
9
$5,813,499
18%
Current but past due 1
or more times in past 6
months
10
$4,037,359
13%
BK with LTV >80%
2
$775,060
2%
DSC under 1.0
1
$3,765,950
12%
DQ Property Taxes (two
installments)
14
$10,912,810
35%
Performing TDR on
accrual
12
$3,810,156
12%
Performing TDR on
non-accrual
3
$2,505,710
8%
Total SM Loans :
51
$31,620,544
Reason for Sub
Classification
# of Loans
Balance
% of Sub
Non-Performing
35
$25,965,589
64%
Performing:
TDR on non-accrual (not
yet made 6 consecutive
payments)
6
$3,791,710
9%
Impaired TDR on accrual
1
$3,090,050
8%
Rated Sub due to borrower
relationship to distressed
loan
13
$7,886,079
19%
Total Performing:
20
$14,767,839
36%
Total Sub Loans
55
$40,733,428
Summary of Classified Loans-PACIFIC TRUST BANK
|
 25
25 TDRs valued at $14.3 million
are performing and earning
interest income
6 TDRs with balance of $9.9 million
are nonperforming
17 TDR valued at $16 million are
on non-accrual and interest
income is recognized on a cash
basis until they perform for 6
consecutive months
Weighted average interest rate of
performing TDR is 4.61%
(1) All balances are gross of SVA
TDR-
PACIFIC TRUST BANK
Payments
# of Loans
Book Value
Avg Loan Size
Weighted
Avg Int Rate
1 Payment
2
$1,447,574
$723,787
3.03%
2 Payments
0
$0
N/A
N/A
3 Payments
0
$0
N/A
N/A
4 Payments
3
$3,103,712
$1,034,571
3.69%
5 Payments
0
$0
N/A
N/A
6 Payments
1
$547,200
$547,200
5.20%
7 Payments
0
$0
N/A
N/A
8 Payments
3
$3,370,143
$1,123,381
5.93%
9 Payments
1
$320,000
$320,000
5.60%
10 Payments
1
$511,500
$511,500
5.13%
11 Payments
4
$1,477,439
$369,360
5.55%
12+ Payments
10
$4,107,275
$410,728
5.28%
Total
25
$14,884,843
$595,394
4.61%
Performing TDR are well seasoned with solid yields |
 26
Call
Report
data
shows
$214
million
of
“HELOCS”
which
are
primarily
1st TD mortgages to high net worth borrowers.
1st TD HELOCs have:
—
Average FICO score at origination of 743
—
Weighted average original LTV ratio of 56%
—
Average Debt-to-Income ratio of 34.9%
Pacific Trust Bank’s quarterly risk management practices for 1st TD HELOC include:
—
A reduction in credit limits if a loan’s refreshed LTV ratio exceeds 100%
—
Suspension of credit line if net advances exceed principal pay downs
Most of our “HELOCS”
are FIRST TRUST DEED
“GREEN”
ACCOUNTS
HELOC-
PACIFIC TRUST BANK |
 27
All OREO is carried at levels
no more than 91% of the most
recent appraised value.
Pacific Trust Bank holds 6 OREO assets (all single-
family homes) with a net value of $2.5 million
Bancorp holds 2 OREO assets including 1 land loan
and 1 SFR with an aggregate value of $4.0 million
OREOs-
BANCORP AND BANK
As of 3/31/2011 |
 28
This presentation contains certain financial information determined by methods
other than in accordance with accounting principles generally accepted in
the United States (“GAAP”). These non-GAAP financial measures include tangible common equity, tangible
common equity per share and core earnings.
Tangible
common
equity
and
tangible
common
equity
per
share
are
calculated
by
excluding
preferred
equity
from
stockholders’
equity
(of
which
we
currently
have
none)
and
excluding
any
intangible
assets
(of
which
we
currently
have
none)
from
assets.
We
believe
that
this is consistent with the treatment by the Office of Thrift Supervision, our
regulatory agency, which excludes any intangible assets from the
calculation of risk-based capital ratios. Accordingly, management believes that these non-GAAP financial measures provide
information to investors that is useful in understanding the basis of our
risk-based capital ratios. Management also believes that core earnings
is a useful measure of assessing our operating performance. Reconciliations
of the non-GAAP measures to the comparable GAAP measures are provided below. Non-GAAP
Financial Information 3/31/11
Stockholders’
equity
$
135,650
Less: Intangible assets
0
Tangible common equity
135,650
3/31/11
Stockholders’
equity
per
share
$
13.94
Less: Effect of intangible assets
0.00
Tangible common equity per share
13.94
The
following
table
presents
a
reconciliation
of
tangible
common
equity
per
share
to
stockholders’
equity
per
share:
The
following
table
presents
a
reconciliation
of
tangible
common
equity
to
stockholders’
equity
(dollars
in
thousands): |
 29
3/31/11
Net income
$
693
Add: Change of Control expense (net of tax)
541
Add: Non-core problem loan expenses (net of tax)
745
Core earnings
1,979
The following table presents a reconciliation of core earnings to net income
(dollars in thousands): Non-GAAP Financial Information
(Continued) |