Attached files
| file | filename |
|---|---|
| 8-K - FORM 8-K - CIVISTA BANCSHARES, INC. | c15884e8vk.htm |
Exhibit 99

| First Citizens Banc Corp |
| First Citizens Banc Corp |
| First Citizens Banc Corp Let’s start with a look at the operating performance for 2010. |
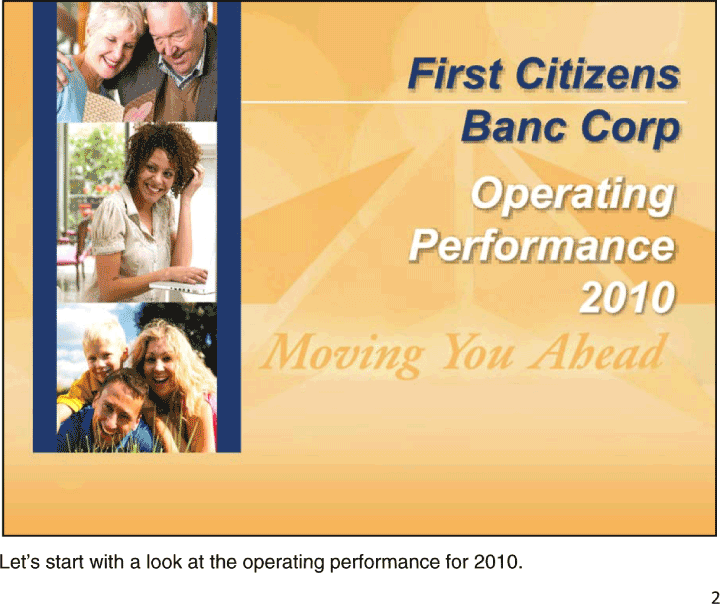
| First Citizens Banc Corp Net Income Earnings Before Economic Issues $ 2.06 $ 1.89 $ 2.36 $ 2.39 Provision for Loan Losses $ 0.19 $ 1.06 $ 1.73 $ 2.33 FDIC Insurance Premiums $ 0.01 $ 0.01 $ 0.26 $ 0.20 Collection and Repossession Expenses $ 0.07 $ 0.08 $ 0.19 $ 0.19 Investment Security Impairment $ 0.00 $ 0.00 $ 0.00 $ 0.07 Net Income $ 1.25 $ 0.56 $ 0.21 ($ 0.16) Here is a chart of our net income and the impact of expenses that are directly related to the economy. |
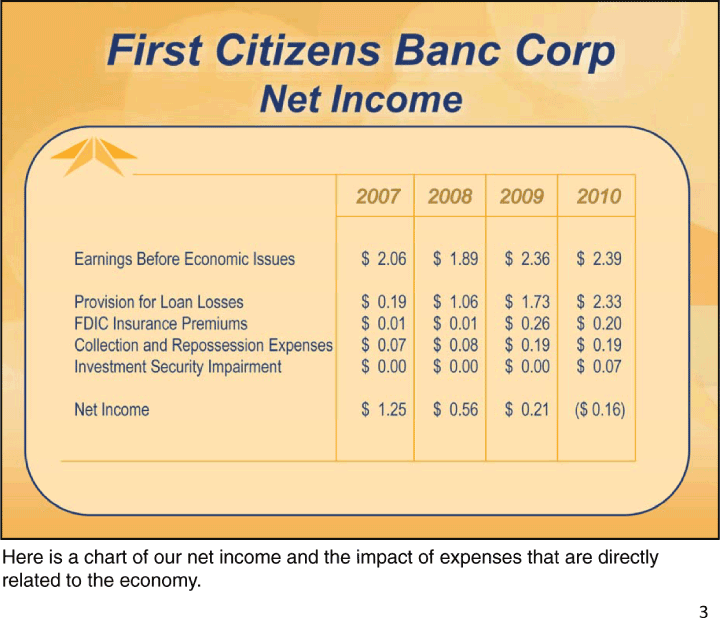
| First Citizens Banc Corp Earnings Compared to Peer Returns $8,000,000 $6,000,000 Our $4,000,000 Corporate Earnings $2,000,000 $- What if we matched Peer $(2,000,000) $(4,000,000) 2007 2008 2009 2010 We have seen the trend of our earnings and the impact of the economic related items, but how does the bottom line compare to our peer group of 297 banks in the country our size. Here is a chart of our net income and what our income would have been if we had performed to peer levels. You can see that in 2007 we were right in line with our peers. In 2008 and 2009 we performed better than peer. This is a result of the recession having a strong initial impact in Florida, Nevada, and Arizona. The economy struck those markets before the full impact hit Ohio. If you recall my letter from last year, we felt that 2010 would have more issues than 2009 – which was certainly the case. |
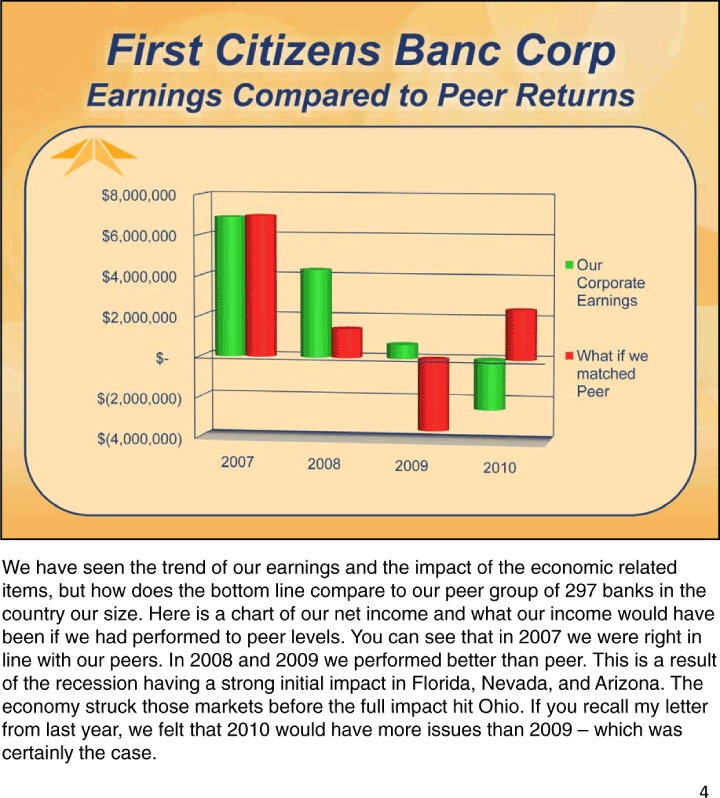
| First Citizens Banc Corp 2007-2010 Earnings Compared to Peer Return $10,000,000 $9,000,000 $8,000,000 Our $7,000,000 Corporate $6,000,000 Earnings $5,000,000 $4,000,000 What if we $3,000,000 matched Peer $2,000,000 $1,000,000 $- 2007-2010 If we take the cumulative bottom line performance for 2007 through 2010, we can see that overall we have performed better than our peers. Our work to maximize our interest margin and the steps to control as many non interest expenses that we could control resulted in a performance that was $2,000,000 better than had we performed at our peer levels. |
| First Citizens Banc Corp Elements of Core Performance The components of our income continue to be the basics. Interest margin plus non interest income less non interest expenses. |
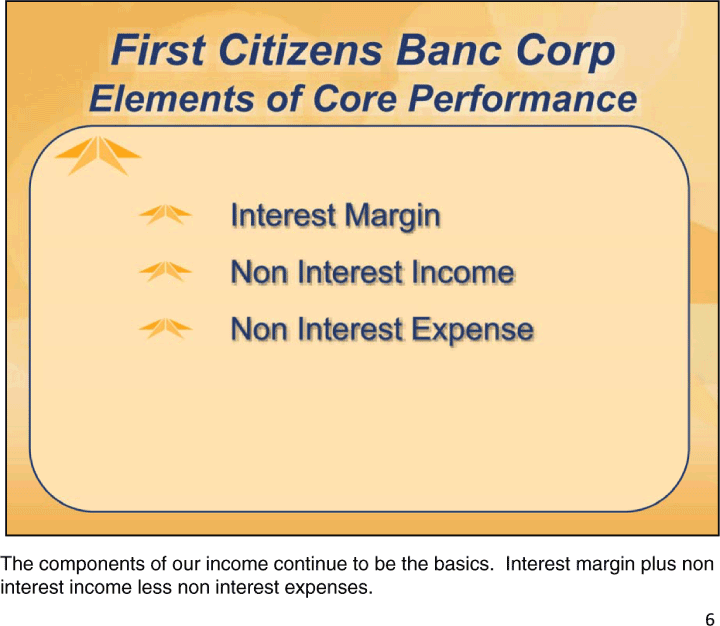
| First Citizens Banc Corp Interest Margin Compared to Peer 4.50% 4.22% 4.00% 4.07% 4 .00% 3.59% 3.70% 3.50% 3.50% 3.00% 2.50% FCBC 2.00% Peer 1.50% 1.00% 0.50% 0.00% 2008 2009 2010 Our interest margin continues to outperform our peers. For 2011 our margin was 4.07% compared to our peers of 3.70% |
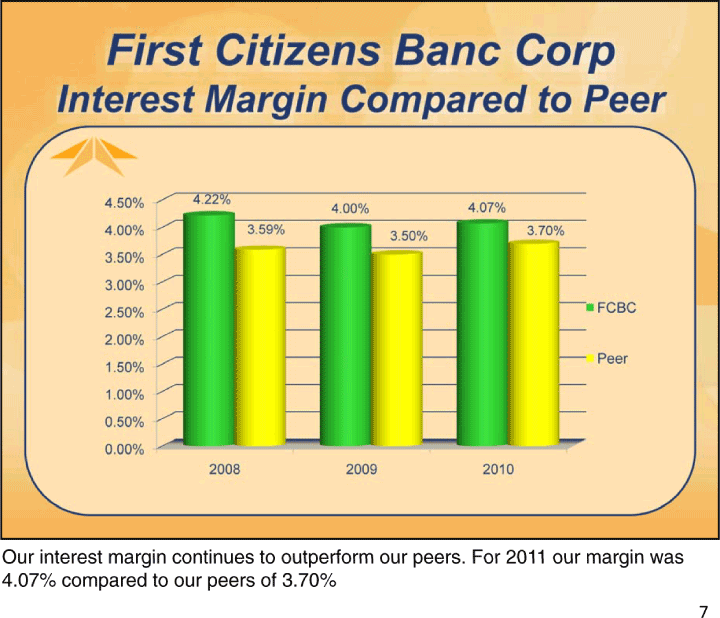
| First Citizens Banc Corp Margin * Interest Income Earning Assets 5.08% 5.03% Interest Expense Earning Assets 1.01% 1.33% Margin 4.07% 3.70% * Fully Taxable Equivalent December 2010 Uniform Bank Performance Report Looking at the detail of the margin calculation, you can see that our return on loans and investments is very close to peer — 5.08% compared to 5.03%. Our margin benefit comes from our low cost of deposits. We attract low cost checking and savings accounts in non urban areas. The cost of funding our loans and investments was 1.01% compared to our peers of 1.33%. While it does cost us a bit more in general expenses to operate more branches, the differential in funding cost is a benefit of over $3,000,00 0. |
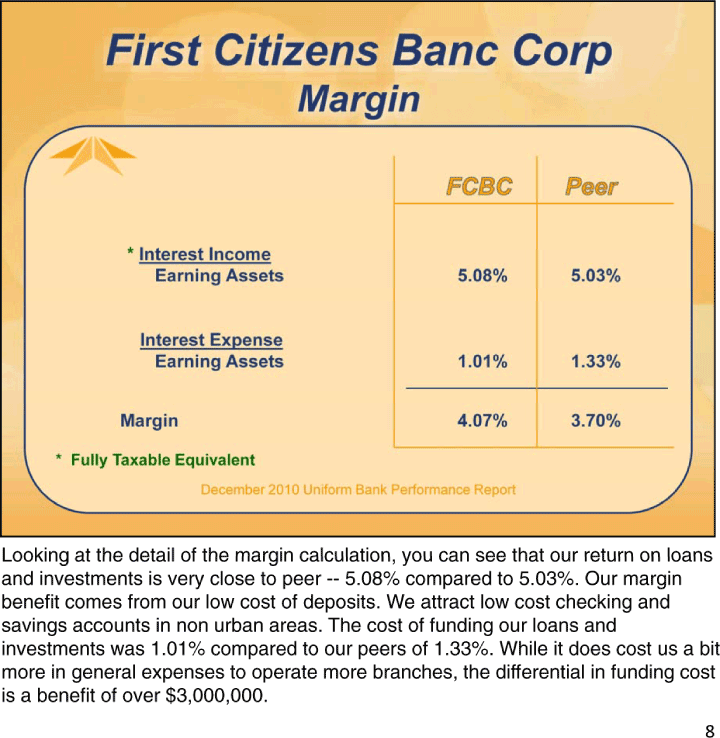
| First Citizens Banc Corp Non Interest Income Total $ 10,106,000 $ 10,147,000 $ 9,481,000 Core Items Service Charges $ 4,779,000 $ 4,829,000 $ 4,556,000 ATM Fees $ 1,368,000 $ 1,634,000 $ 1,752,000 Trust Income $ 1,904,000 $ 1,588,000 $ 1,864,000 Investment Impairment $ — $ — $ (575,000) For 2010 our non interest income was down $666,000. The main driver of this was a $575,000 write down for a troubled investment. You would think that this item would be an expense, but the rules of accounting required it to be recognized as a negative income. I would welcome anyone to explain that logic. Looking at selective items, we are pleased with our improvement in ATM fees which were up slightly more than $100,000 and our trust income which was up almost $300,000. We did see a decrease in service charge income of $273,000. This is related to changes in consumer regulations on our overdraft protection product. Most banks have seen a decrease in this income and we are not an exception. |
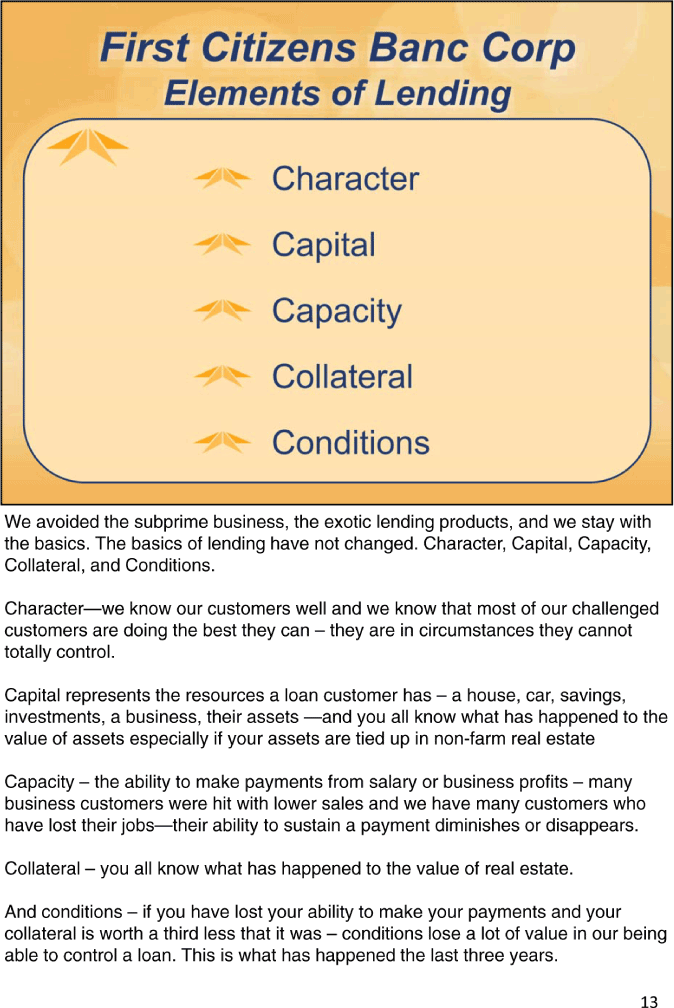
| First Citizens Banc Corp Non Interest Expense Total $ 36,704,000 $ 35,679,000 $ 36,101,000 Core Items Salaries $ 14,388,000 $ 13,020,000 $ 13,923,000 Benefits $ 2,785,000 $ 2,611,000 $ 3,289,000 Equipment $ 2,285,000 $ 1,884,000 $ 1,522,000 Data Processing $ 1,208,000 $ 1,091,000 $ 929,000 Telephone $ 932,000 $ 612,000 $ 534,000 Courier $ 679,829 $ 558,002 $ 362,600 FDIC Insurance $ 191,000 $ 1,971,000 $ 1,580,000 Collection Expense $ 604,000 $ 1,500,000 $ 1,463,000 For 2010 our non interest expenses, while still below 2008 levels, were up $422,000. You can see the results of our cost containment in equipment, data processing, courier, and telephone expense. These expenses are down over $1,700,000 from 2008. Taking advantage of technology has really helped to bring these costs down. FDIC was down because in 2009 all banks had a special assessment. Collection expenses were down slightly but they remain much higher than we would like to see. We did have increases in sala ries and benefits. While there were modest increases to non executive salaries, we did add to staff. Over the last three years we have added significant strength to the credit analysis and asset workout areas and we have continued adding strength to lending staff. Benefits were up $678,000. While we continually review our medical insurance program I am certain you are all familiar with the increases in those costs. Our employees do pay approximately 26% of their insurance costs. |
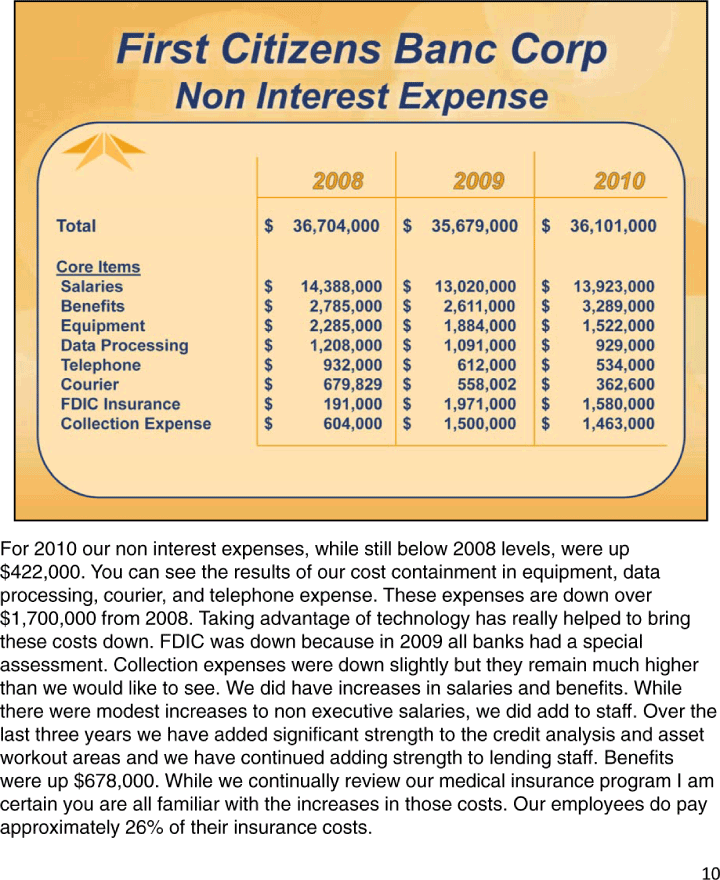
| First Citizens Banc Corp Immediate Liquidity Day to Day Operating Liquidity Federal Home Loan Borrowing Capacity $ 30,215,000 5.2% Bank of America Fed Funds Line $ 10,000,000 1.7% Federal Reserve Discount Window $ 9,100,000 1.6% Fed Funds Sold $ 57,000,000 9.9% Total Overnight Resources $ 106,315,000 18.4% Total Demand and Savings Deposits $ 577,275,000 Looking at our areas of focus – capital, liquidity, and asset quality-— here is a view of liquidity. At year end we had readily accessible liquidity resources of $106,315,000. With a phone call we could obtain these funds to make loans or cover withdrawals. This equals over 18% of our checking and savings account deposits. As we have stated before, the lack of liquidity can bring a bank to the brink of failure quicker than loan problems -— so we are very focused on maintaining high levels of liquidity and we are very comfortable with our liquidity position. |
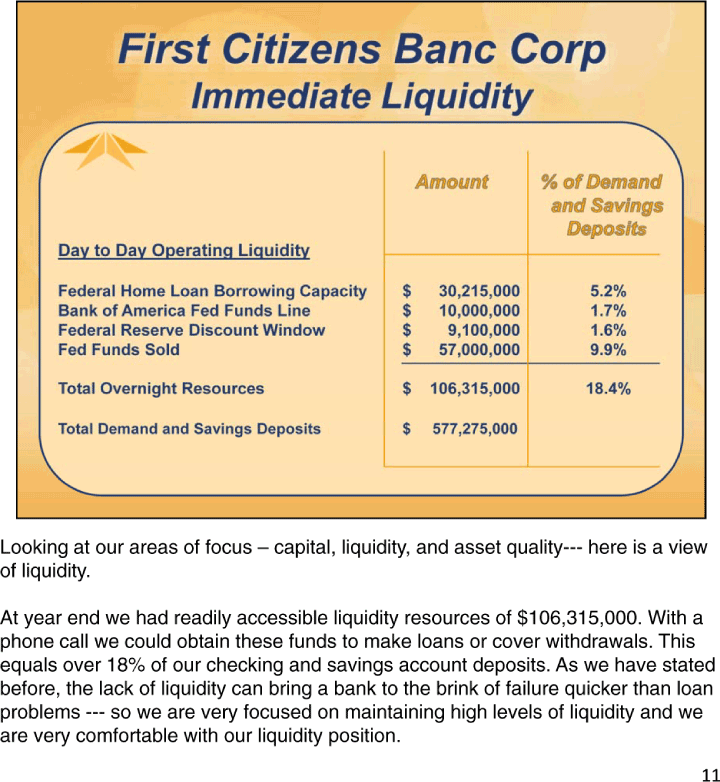
| First Citizens Banc Corp End of Year Loan Recap Year End 2010 2010 Percent Balances _____ Charge Offs _____ Charge Offs Commercial and Agriculture $ 84,913,000 $ 2,710,000 3.2% Commercial Real Estate $ 336,251,000 $ 4,653,000 1.4% Residential Real Estate $ 295,038,000 $ 4,029,000 1.4% Real Estate Construction $ 39,341,000 $ 799,000 2.0% Consumer and Other $ 11,780,000 $ 460,000 3.9% $ 767,323,000 $ 12,651,000 1.6% Turning to Asset Quality and recalling the first chart, this is the largest single issue holding back the net earnings of the company. For the year 2010 we charged off over $12,600,000. While this is a small percentage when compared to our total loan portfolio, it is a huge amount of money when it has to be supported from earnings. You can see that the loan issues are not isolated, but spread across the whole loan portfolio. I will pose the question you may wonder – how did you make these loans? |
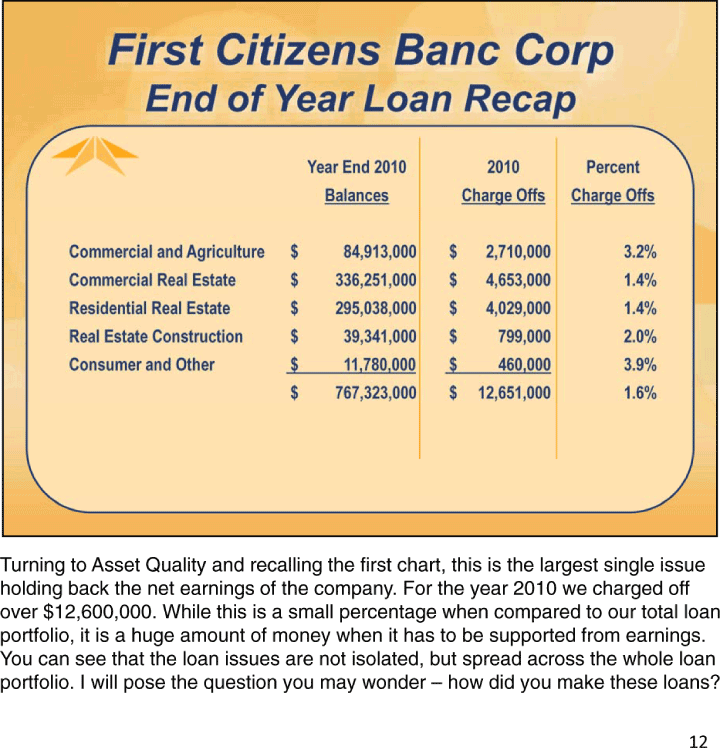
| First Citizens Banc Corp Elements of Lending Character Capital Capacity Collateral Conditions We avoided the subprime business, the exotic lending products, and we stay with the basics. The basics of lending have not changed. Character, Capital, Capacity, Collateral, and Conditions. Character—we know our customers well and we know that most of our challenged customers are doing the best they can – they are in circumstances they cannot totally control. Capital represents the resources a loan customer has – a house, car, savings, investments, a business, their assets —and you all know what has happened to the value of assets especially if your assets are tied up in non-farm real estate Capacity – the ability to make payments from salary or business profits – many business customers were hit with lower sales and we have many customers who have lost their jobs—their ability to sustain a payment diminishes or disappears. Collateral – you all know what has happened to the value of real estate. And conditions – if you have lost your ability to make your payments and your collateral is worth a third less that it was – conditions lose a lot of value in our being able to control a loan. This is what has happened the last three years. |
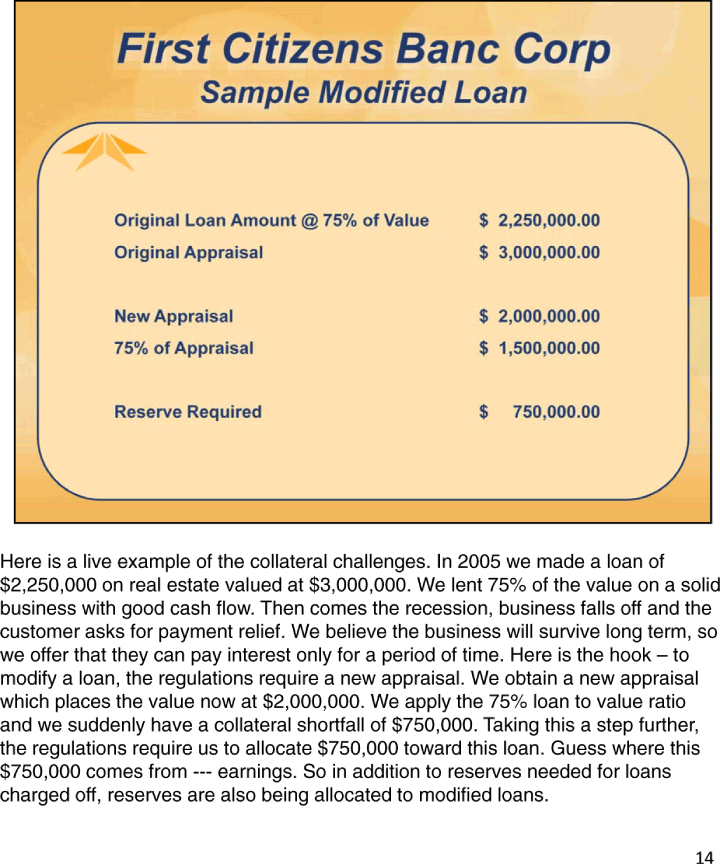
| First Citizens Banc Corp Sample Modified Loan Original Loan Amount @ 75% of Value $ 2,250,000.00 Original Appraisal $ 3,000,000.00 New Appraisal $ 2,000,000.00 75% of Appraisal $ 1,500,000.00 Reserve Required $ 750,000.00 Here is a live example of the collateral challenges. In 2005 we made a loan of $2,250,000 on real estate valued at $3,000,000. We lent 75% of the value on a solid business with good cash flow. Then comes the recession, business falls off and the customer asks for payment relief. We believe the business will survive long term, so we offer that they can pay interest only for a period of time. Here is the hook – to modify a loan, the regulations require a new appraisal. We obtain a new appraisal which pla ces the value now at $2,000,000. We apply the 75% loan to value ratio and we suddenly have a collateral shortfall of $750,000. Taking this a step further, the regulations require us to allocate $750,000 toward this loan. Guess where this $750,000 comes from -— earnings. So in addition to reserves needed for loans charged off, reserves are also being allocated to modified loans. |
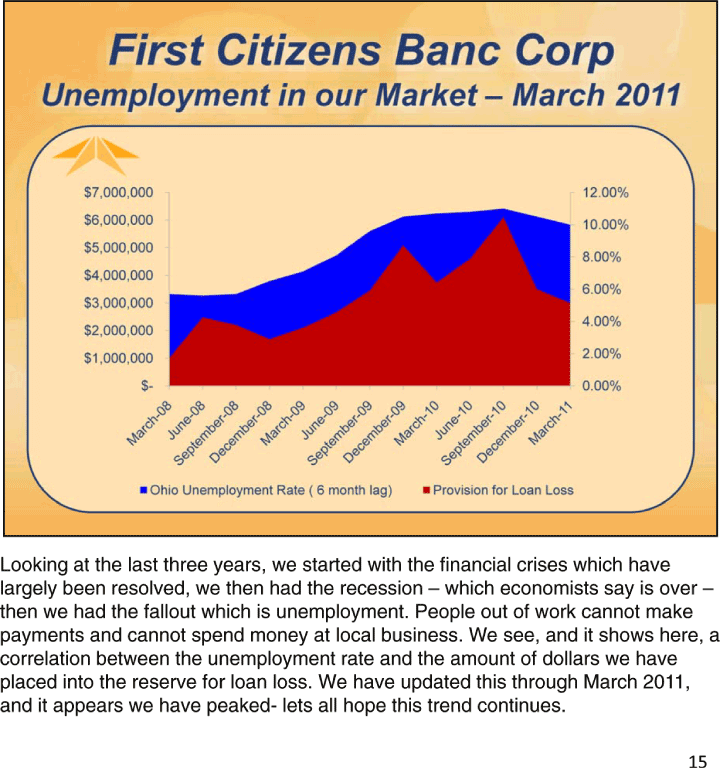
| First Citizens Banc Corp Unemployment in our Market – March 2011 $7,000,000 12.00% $6,000,000 10.00% $5,000,000 8.00% $4,000,000 6.00% $3,000,000 4.00% $2,000,000 $1,000,000 2.00% $- 0.00% Ohio Unemployment Rate ( 6 month lag) Provision for Loan Loss Looking at the last three years, we started with the financial crises which have largely been resolved, we then had the recession – which economists say is over – then we had the fallout which is unemployment. People out of work cannot make payments and cannot spend money at local business. We see, and it shows here, a correlation between the unemployment rate and the amount of dollars we have placed into the reserve for loan loss. We have updated this through March 2011, and it appears we ha ve peaked- lets all hope this trend continues. |
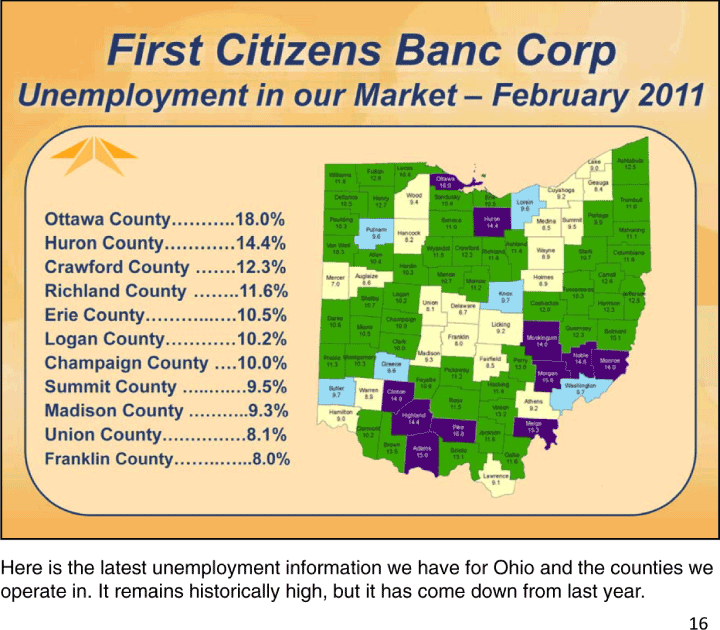
| First Citizens Banc Corp Unemployment in our Market – February 2011 Ottawa County..18.0% Huron County 14.4% Crawford County .......12.3% Richland County ........11.6% Erie County 10.5% Logan County 10.2% Champaign County ....10.0% Summit County 9.5% Madison County ...........9.3% Union County 8.1% Franklin County 8.0% Here is the latest unemployment information we have for Ohio and the counties we operate in. It remains historically high, but it has come down from last year. |
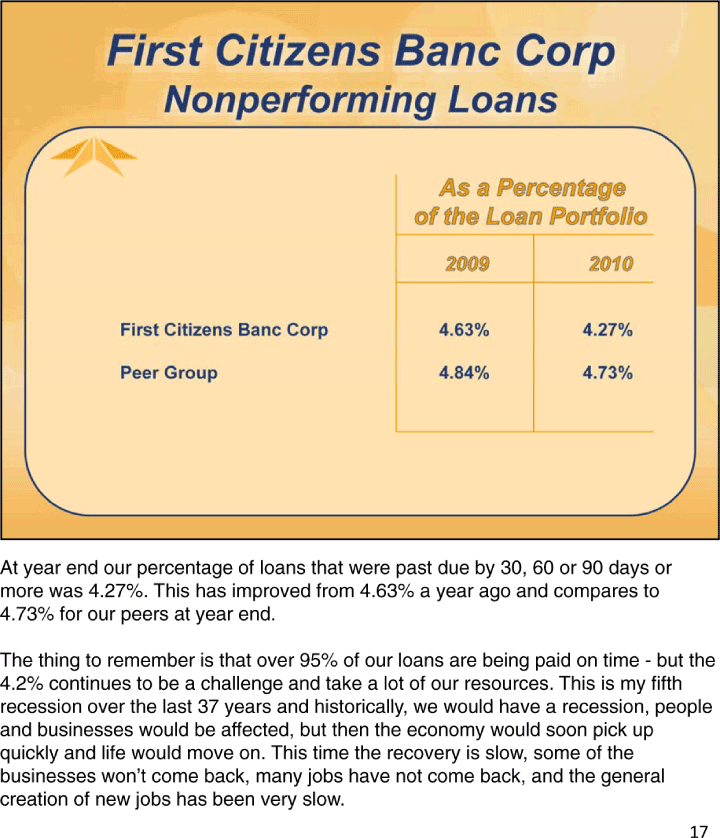
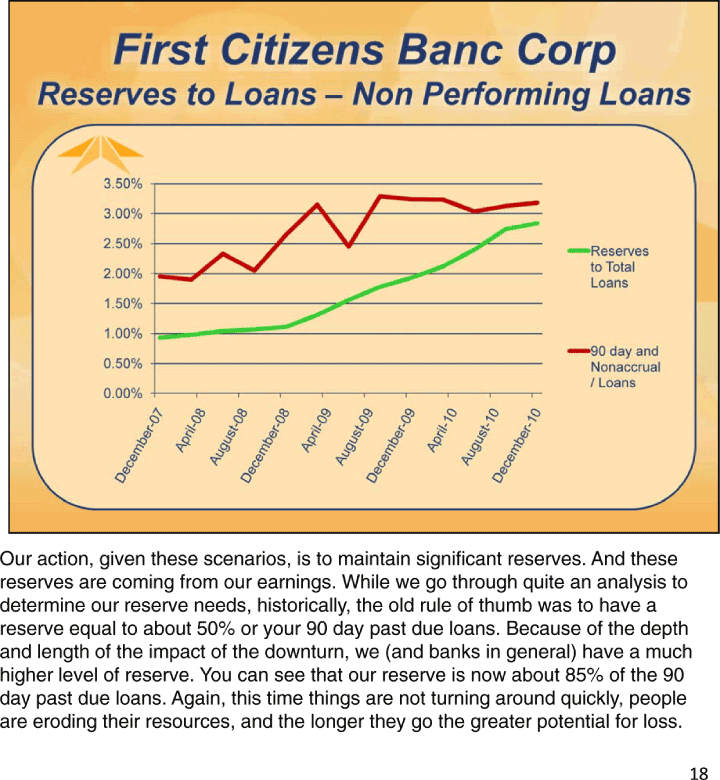
| First Citizens Banc Corp Nonperforming Loans First Citizens Banc Corp 4.63% 4.27% Peer Group 4.84% 4.73% At year end our percentage of loans that were past due by 30, 60 or 90 days or more was 4.27%. This has improved from 4.63% a year ago and compares to 4.73% for our peers at year end. The thing to remember is that over 95% of our loans are being paid on time — but the 4.2% continues to be a challenge and take a lot of our resources. This is my fifth recession over the last 37 years and historically, we would have a recession, people and businesses would be affected, but then the economy would soon pick up quickly and life would move on. This time the recovery is slow, some of the businesses won’t come back, many jobs have not come back, and the general creation of new jobs has been very slow. |
| First Citizens Banc Corp Reserves to Loans – Non Performing Loans 3.50% 3.00% 2.50% Reserves to Total 2.00% Loans 1 .50% 1.00% 90 day and 0.50% Nonaccrual / Loans 0.00% Our action, given these scenarios, is to maintain significant reserves. And these reserves are coming from our earnings. While we go through quite an analysis to determine our reserve needs, historically, the old rule of thumb was to have a reserve equal to about 50% or your 90 day past due loans. Because of the depth and length of the impact of the downturn, we (and banks in general) have a much higher level of reserve. You can see that our reserve is now about 85% of the 90 day past due loans. A gain, this time things are not turning around quickly, people are eroding their resources, and the longer they go the greater potential for loss. |
| First Citizens Banc Corp The third item we have closely monitored is Capital. Capital is going to be a topic long after liquidity and asset quality disappear from the hot topic list. |

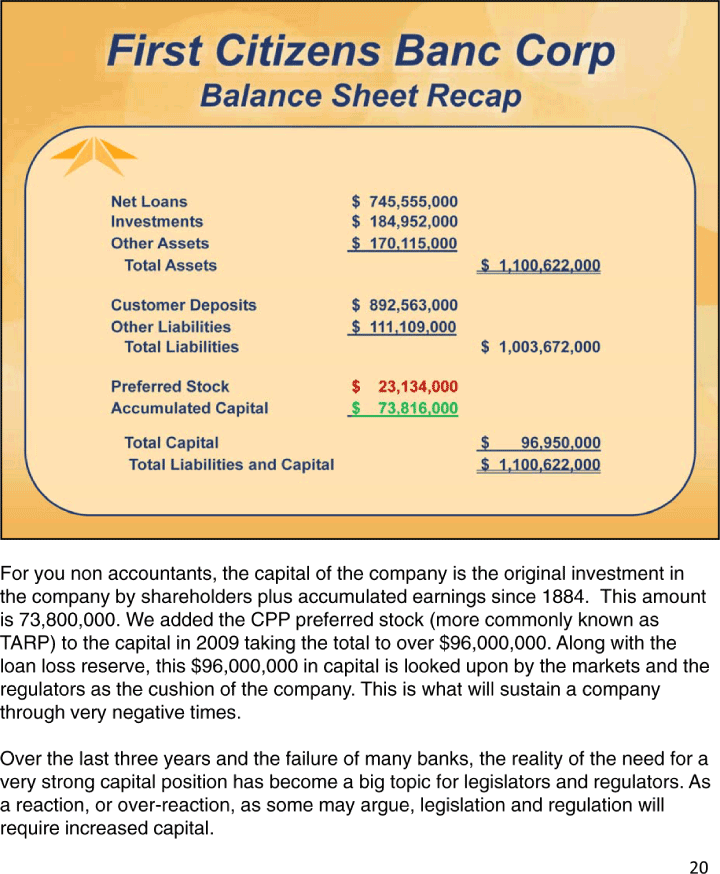
| First Citizens Banc Corp Balance Sheet Recap Net Loans $ 745,555,000 Investments $ 184,952,000 Other Assets $ 170,115,000 Total Assets $ 1,100,622,000 Customer Deposits $ 892,563,000 Other Liabilities $ 111,109,000 Total Liabilities $ 1,003,672,000 Preferred Stock $ 23,134,000 Accumulated Capital $ 73,816,000 Total Capital $ 96,950,000 Total Liabilities and Capital $ 1,100,622,000 For you non accountants, the capital of the company is the original investment in the company by shareholders plus accumulated earnings since 1884. This amount is 73,800,000. We added the CPP preferred stock (more commonly known as TARP) to the capital in 2009 taking the total to over $96,000,000. Along with the loan loss reserve, this $96,000,000 in capital is looked upon by the markets and the regulators as the cushion of the company. This is what will sustain a company through very negative times. Over the last three years and the failure of many banks, the reality of the need for a very strong capital position has become a big topic for legislators and regulators. As a reaction, or over-reaction, as some may argue, legislation and regulation will require increased capital. |
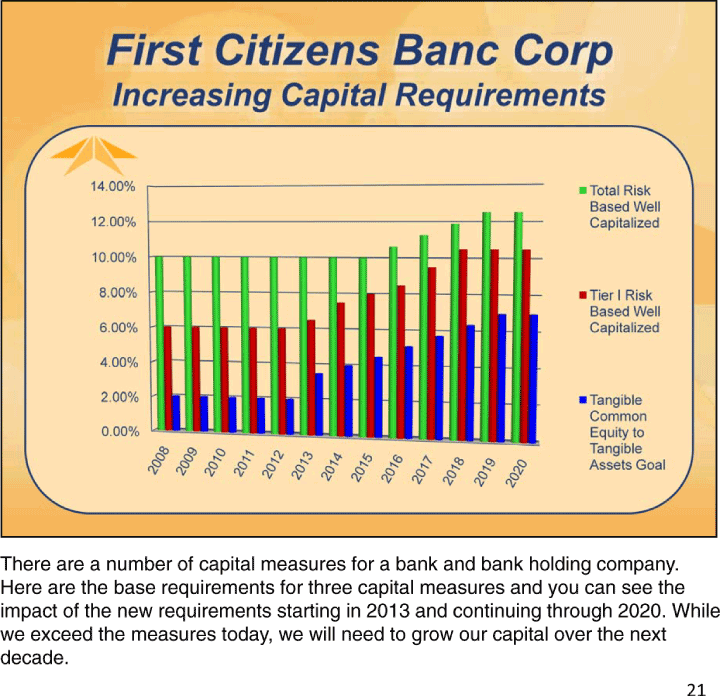
| First Citizens Banc Corp Increasing Capital Requirements 14.00% Total Risk Based Well 12.00% Capitalized 10.00% 8.00% Tier I Risk Based Well 6.00% Capitalized 4.00% 2.00% Tangible Common 0.00% Equity to Tangible Assets Goal There are a number of capital measures for a bank and bank holding company. Here are the base requirements for three capital measures and you can see the impact of the new requirements starting in 2013 and continuing through 2020. While we exceed the measures today, we will need to grow our capital over the next decade. |
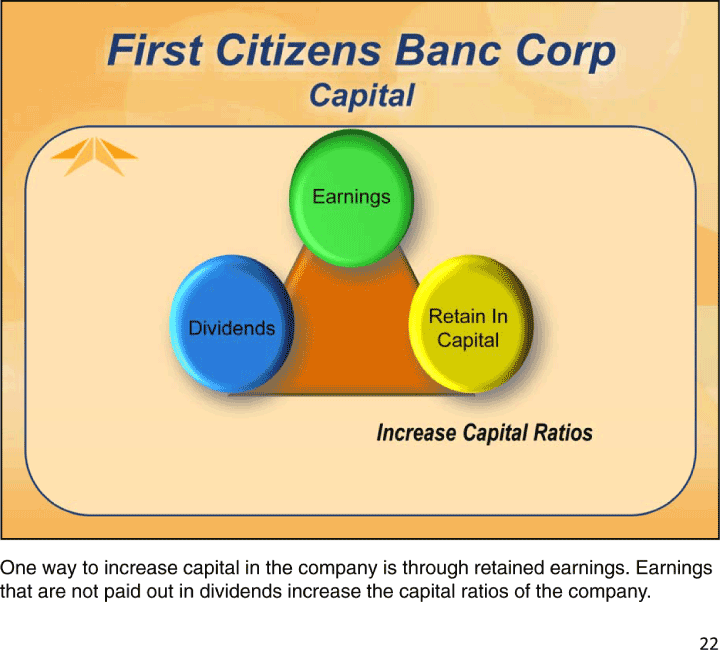
| First Citizens Banc Corp Capital Earnings Retain In Dividends Capital Increase Capital Ratios One way to increase capital in the company is through retained earnings. Earnings that are not paid out in dividends increase the capital ratios of the company. |
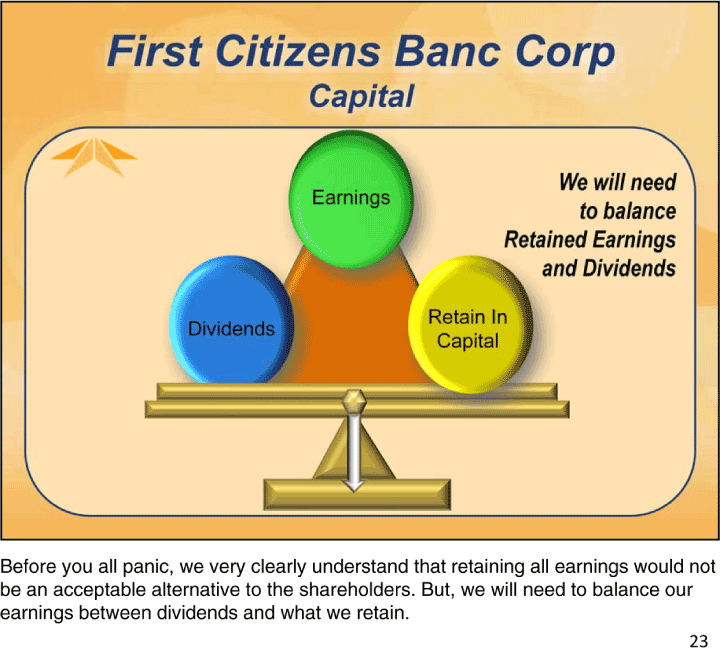
| First Citizens Banc Corp Capital We will need Earnings to balance Retained Earnings and Dividends Retain In Dividends Capital Before you all panic, we very clearly understand that retaining all earnings would not be an acceptable alternative to the shareholders. But, we will need to balance our earnings between dividends and what we retain. |
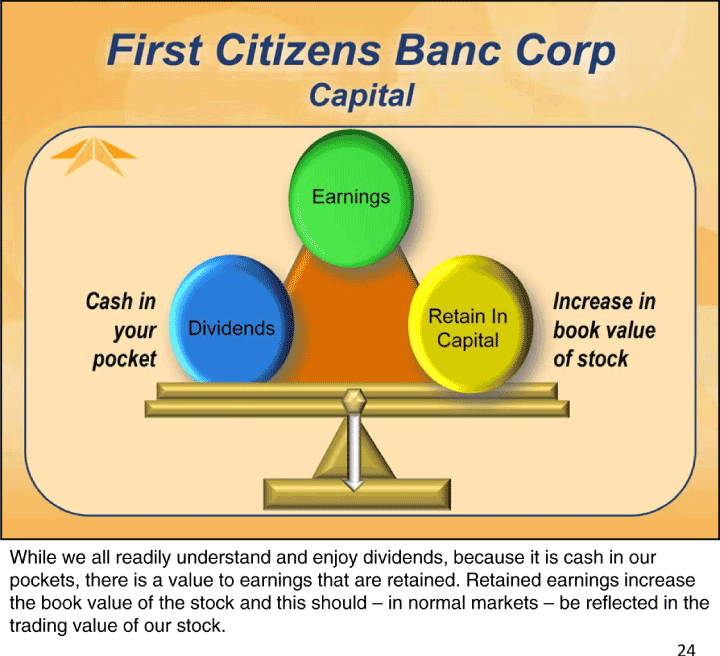
| First Citizens Banc Corp Capital Earnings Cash in _____ Increase in Retain In your _____ Dividends _____ book value Capital pocket _____ of stock While we all readily understand and enjoy dividends, because it is cash in our pockets, there is a value to earnings that are retained. Retained earnings increase the book value of the stock and this should – in normal markets – be reflected in the trading value of our stock. |
| First Citizens Banc Corp Capital Conversation TARP Capital Dividends I am often asked when are we getting rid of the TARP. There are a lot of variables to that question – return of earnings, regulatory capital requirements, and continued improvement in the economy. To get rid of the TARP we need cash at the holding company. We cannot use deposits to pay off TARP. Cash at the holding company can come from three sources:Earnings from the bank paid up to the holding company. Earnings and cash paid to the holding company can, after dividend considerations, be used to pay down TARP. This would be earning our way out of it and would take time. We can borrow the money from other sources and pay off the TARP. The challenge with this today – borrowed money – debt is not considered capital – we would be reducing capital ratios at a time when capital requirements are increasing. We can issue stock or stock rights. This would raise the cash and would maintain capital ratios, but in today’s market and current price of our stock, the dilutive impact to you by issuing several million shares would not be at all attractive. Increased earnings and reflection of increased earnings in our market price may make this a consideration at a future time. |
| First Citizens Banc Corp Capital Conversation TARP Capital Dividends One alternative we are examining today is the Small Business Lending Fund, which is considered capital, has limited restrictions, provides opportunity to reduce the cost through business lending, and will pay off the TARP. The Board reviews capital information regularly. The actions that will eventually be taken regarding capital will evolve based on returning earnings, continued improvement of the economy, and what is in the best long term interest of the shareholders. The end result could be any one or blend of all the alternatives. There is a similar process with regard to dividends. Dividend considerations will hinge on return of consistent earnings and consistency of economic indicators because, when reintroduced, we want consistent dividend payments. |
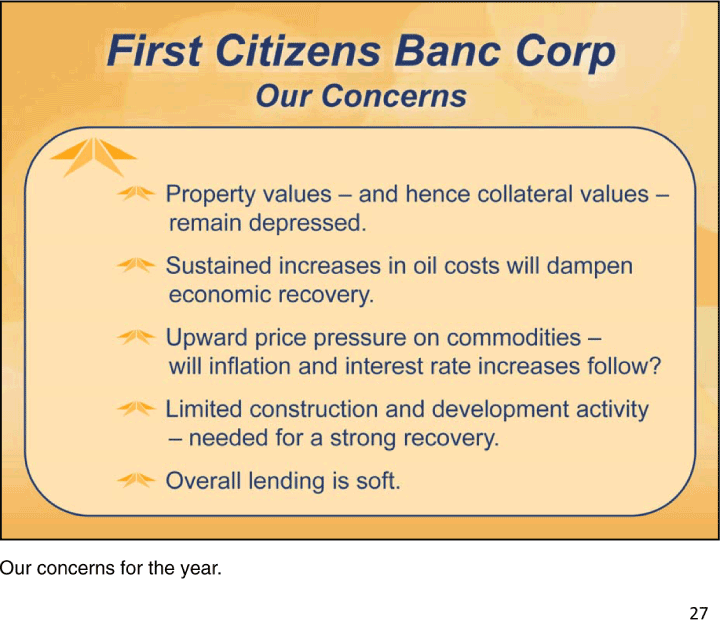
| First Citizens Banc Corp Our Concerns Property values – and hence collateral values –remain depressed. Sustained increases in oil costs will dampen economic recovery. Upward price pressure on commodities –will inflation and interest rate increases follow? Limited construction and development activity – needed for a strong recovery. Overall lending is soft. Our concerns for the year. |
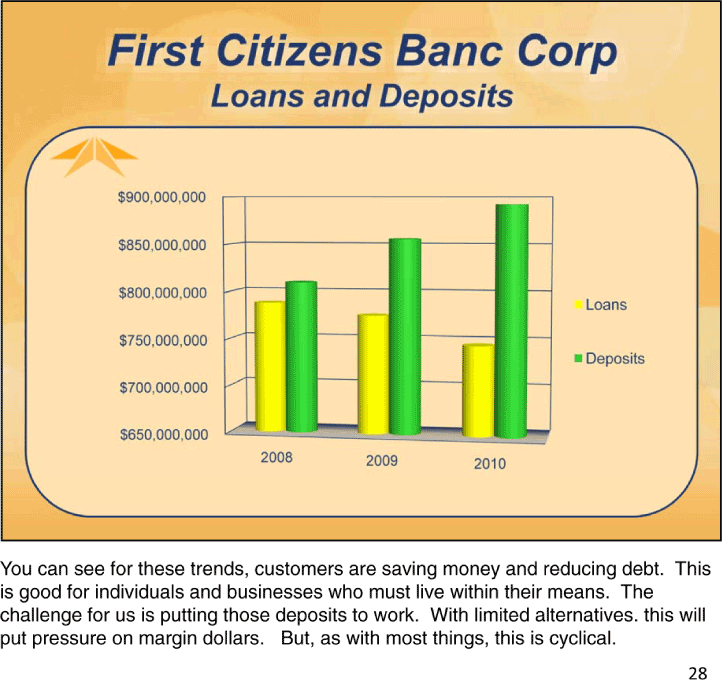
| First Citizens Banc Corp Loans and Deposits $900,000,000 $850,000,000 $800,000,000 Loans $750,000,000 Deposits _____ , , $650,000,000 2008 2009 2010 You can see for these trends, customers are saving money and reducing debt. This is good for individuals and businesses who must live within their means. The challenge for us is putting those deposits to work. With limited alternatives. this will put pressure on margin dollars. But, as with most things, this is cyclical. |
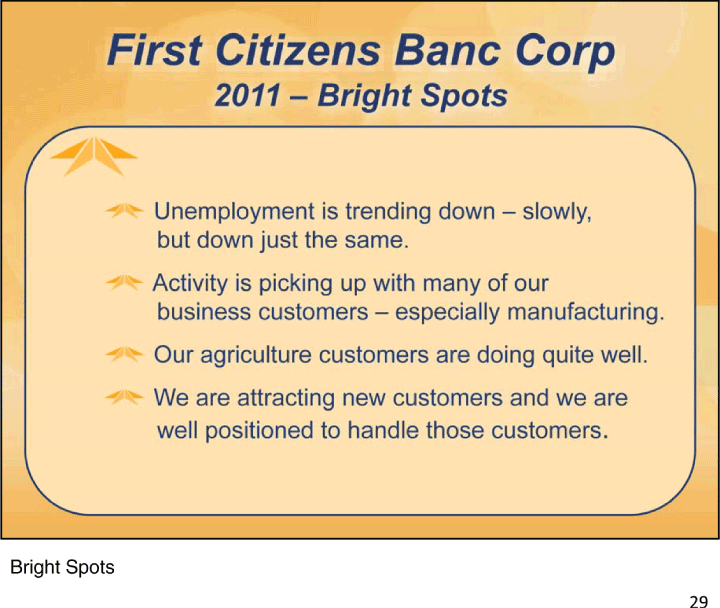
| First Citizens Banc Corp 2011 – Bright Spots Unemployment is trending down – slowly, but down just the same. Activity is picking up with many of our business customers – especially manufacturing. Our agriculture customers are doing quite well. We are attracting new customers and we are well positioned to handle those customers. Bright Spots |
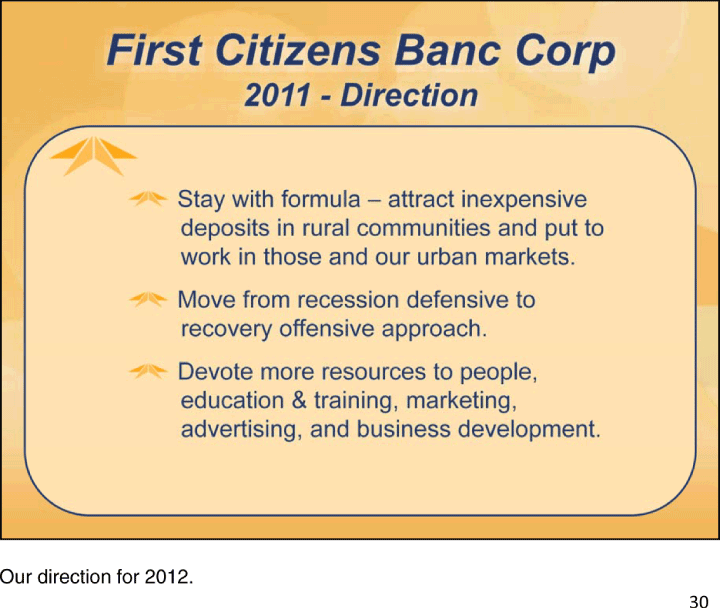
| First Citizens Banc Corp 2011 — Direction Stay with formula – attract inexpensive deposits in rural communities and put to work in those and our urban markets. Move from recession defensive to recovery offensive approach. Devote more resources to people, education & training, marketing, advertising, and business development. Our direction for 2012. |
| First Citizens Banc Corp |

