Attached files
| file | filename |
|---|---|
| EX-99.1 - PRESS RELEASE DATED APRIL 21, 2011 - ManpowerGroup Inc. | exhibit_99-1.htm |
| 8-K - FORM 8-K - ManpowerGroup Inc. | form_8-k.htm |
Exhibit 99.2

ManpowerGroup
2011 1st Quarter
April 21, 2011

ManpowerGroup 2011 1st Quarter Results April 2011
Forward-Looking Statement
This presentation includes forward-looking statements,
including earnings projections which are subject to risks and
uncertainties. Actual results might differ materially from those
projected in the forward-looking statements. Additional
information concerning factors that could cause actual results
to materially differ from those in the forward-looking statements
is contained in the Manpower Inc. Annual Report on Form 10-K
dated December 31, 2010, which information is incorporated
herein by reference, and such other factors as may be
described from time to time in the Company’s SEC filings.
ManpowerGroup 2011 1st Quarter Results April 2011
N/A
Operating Income $86M
OP Margin 1.7%
Revenue $5.1B
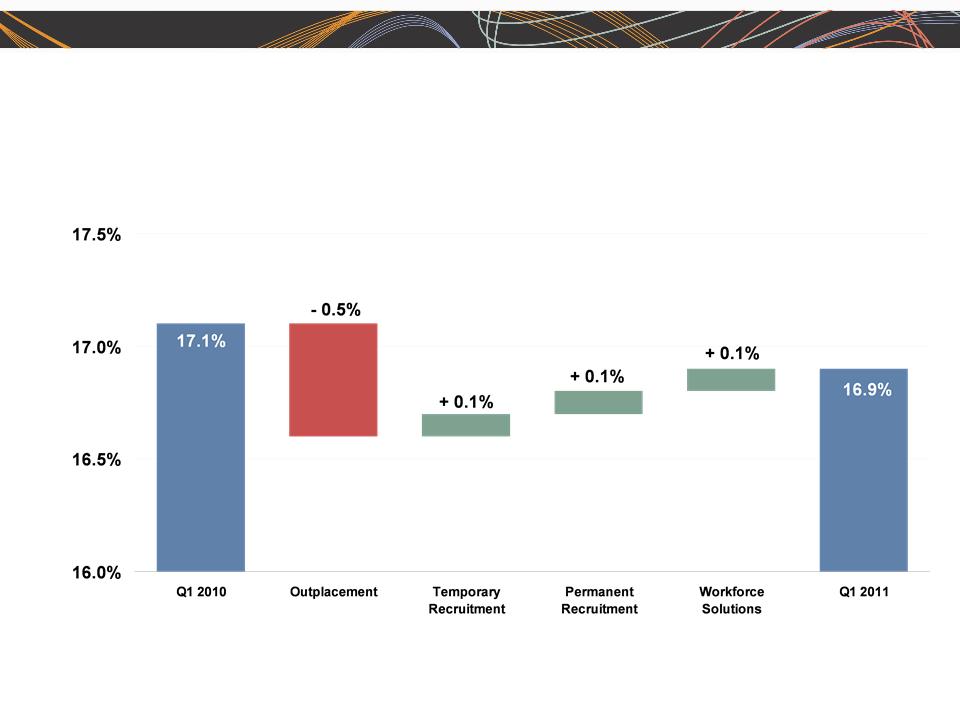
Gross Margin 16.9%
EPS $0.43
Q1 Highlights
Throughout this presentation, the difference between reported variances and Constant Currency (CC) variances
represents the impact of currency on our financial results. Constant Currency is further explained on our Web site.
represents the impact of currency on our financial results. Constant Currency is further explained on our Web site.
Consolidated Financial Highlights
24%
22% CC
20 bps
163%
152% CC
90 bps
N/A
3
ManpowerGroup 2011 1st Quarter Results April 2011
Consolidated Gross Margin Change
4
ManpowerGroup 2011 1st Quarter Results April 2011
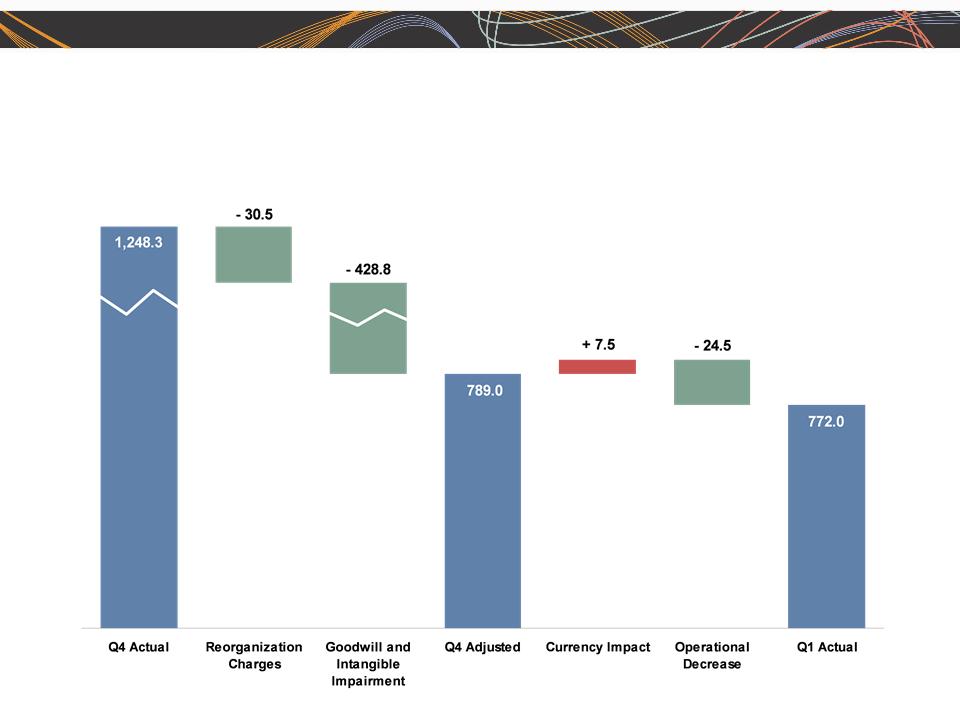
SG&A Expense Sequential Bridge - Q1 vs. Q4
(in millions of USD)
(in millions of USD)
5

ManpowerGroup 2011 1st Quarter Results April 2011
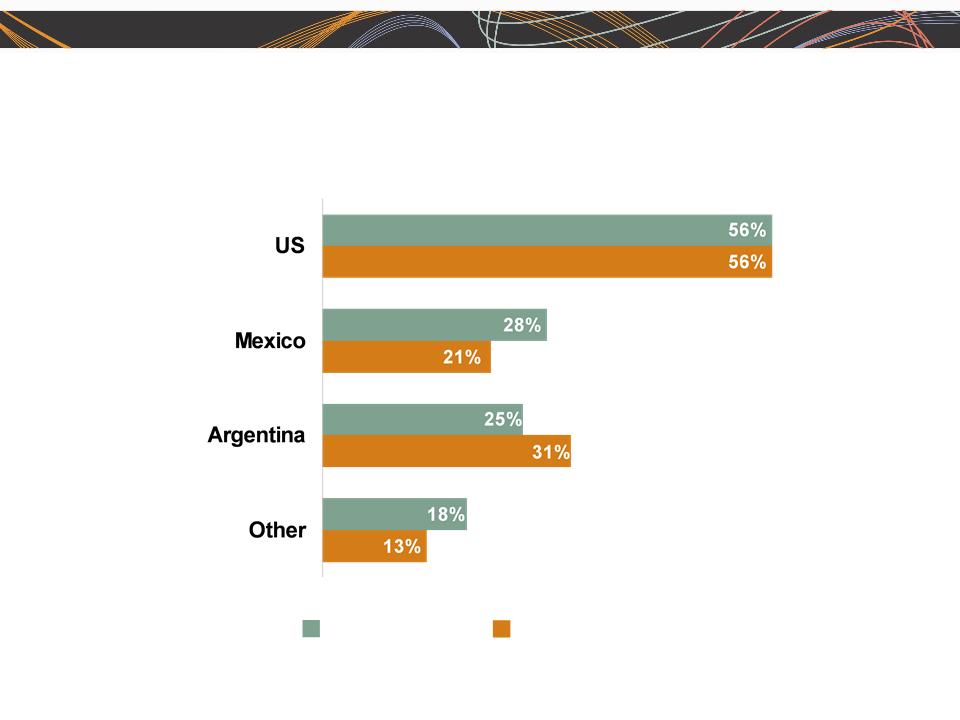
(1) Included in these amounts is the US, which had revenue of $751M (+56%) and OUP of $9M.
42% CC
Americas Segment
(22% of Revenue)
(22% of Revenue)
Q1 Financial Highlights
43%
OUP Margin
1.9%
220 bps
Revenue
$1.1B
OUP
$22M
Operating Unit Profit (OUP) is the measure that we use to evaluate segment performance.
OUP is equal to segment revenues less direct costs and branch and national
headquarters operating costs.
OUP is equal to segment revenues less direct costs and branch and national
headquarters operating costs.
(1)
N/A
N/A
6
ManpowerGroup 2011 1st Quarter Results April 2011
Americas - Q1 Revenue Growth YoY
Revenue Growth - CC
Revenue Growth
% of Segment
Revenue
68%
11%
7%
14%
7

ManpowerGroup 2011 1st Quarter Results April 2011
Southern Europe Segment
(36% of Revenue)
(36% of Revenue)
Q1 Financial Highlights
OUP Margin
1.5%
Revenue
$1.8B
OUP
$27M
21%
22% CC
110 bps
344%
339% CC
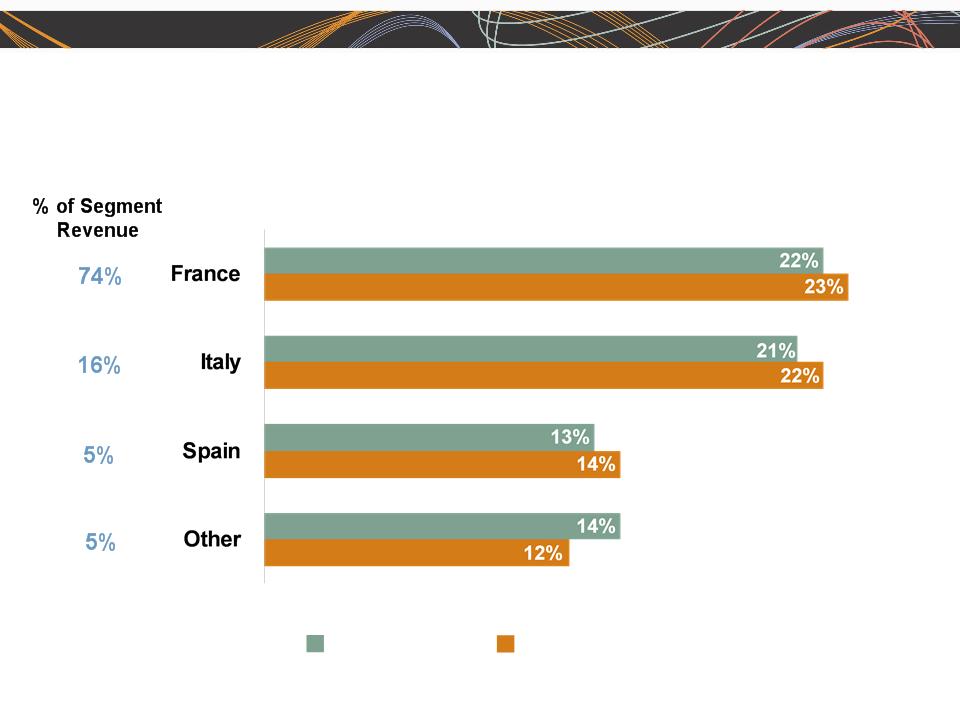
(1) Included in these amounts is France, which had revenue of $1.4B (+23% CC) and OUP of $12M.
(1)
8
ManpowerGroup 2011 1st Quarter Results April 2011
Southern Europe - Q1 Revenue Growth YoY
Revenue Growth - CC
Revenue Growth
9
ManpowerGroup 2011 1st Quarter Results April 2011
Northern Europe Segment
(28% of Revenue)
(28% of Revenue)
Q1 Financial Highlights
OUP Margin
2.9%
Revenue
$1.5B
OUP
$42M
19%
17% CC
130 bps
121%
112% CC
10
ManpowerGroup 2011 1st Quarter Results April 2011
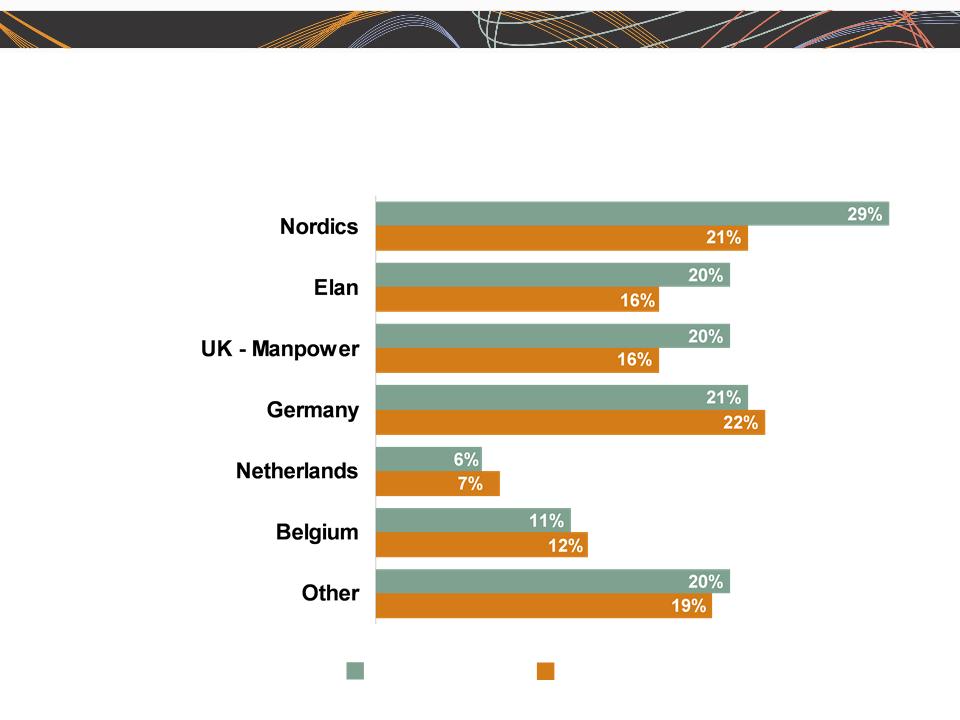
Northern Europe - Q1 Revenue Growth YoY
Revenue Growth - CC
Revenue Growth
% of Segment
Revenue
20%
18%
14%
13%
10%
18%
7%
11

ManpowerGroup 2011 1st Quarter Results April 2011
APME Segment
(12% of Revenue)
(12% of Revenue)
Q1 Financial Highlights
OUP Margin
2.7%
Revenue
$603M
OUP
$17M
21%
11% CC
20 bps
32%
21% CC
12
ManpowerGroup 2011 1st Quarter Results April 2011
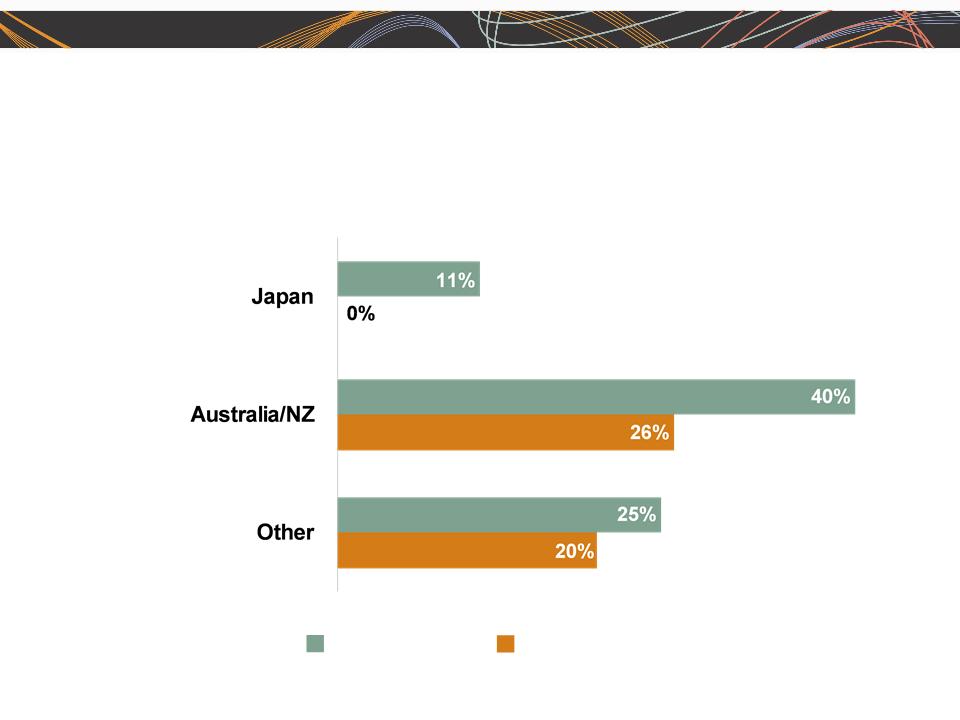
APME - Q1 Revenue Growth YoY
Revenue Growth - CC
Revenue Growth
% of Segment
Revenue
48%
28%
24%
13

ManpowerGroup 2011 1st Quarter Results April 2011
74%
74% CC
Right Management Segment
(2% of Revenue)
(2% of Revenue)
Q1 Financial Highlights
OUP Margin
4.0%
Revenue
$82M
OUP
$3M
21%
23% CC
810 bps
14

ManpowerGroup 2011 1st Quarter Results April 2011
Cash Flow Summary - Q1
2011
2010
Cash from Operations
(160)
(43)
Capital Expenditures
(11)
(8)
Free Cash Flow
(171)
(51)
($ in millions)
Other
7
Change in Cash
(123)
(71)
5
Change in Debt
1
Effect of Exchange Rate Changes
31
(26)
10
15
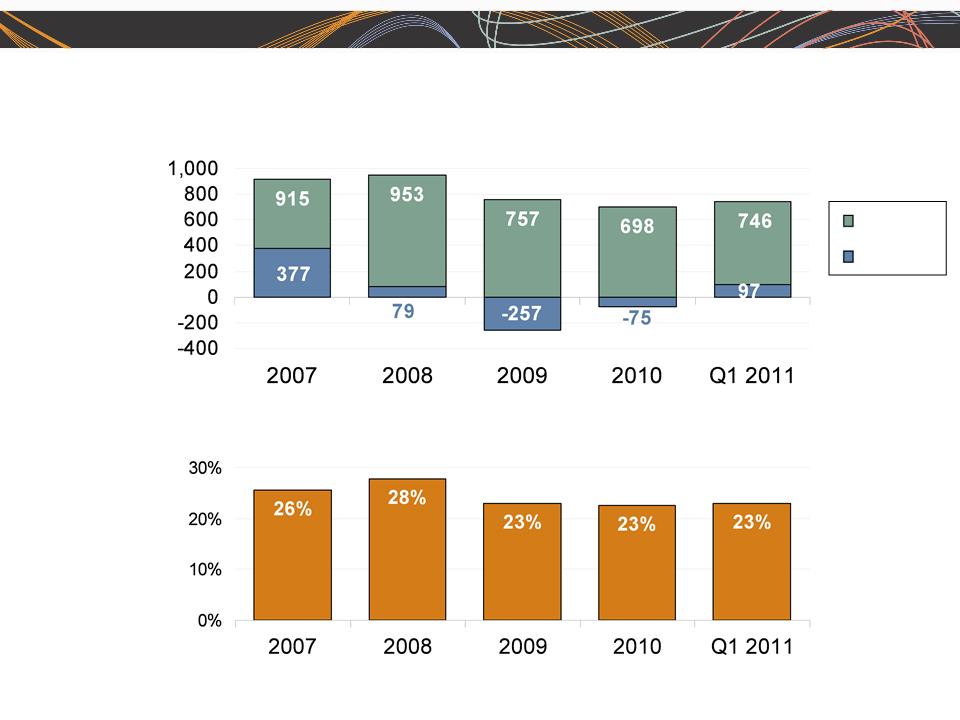
ManpowerGroup 2011 1st Quarter Results April 2011
Balance Sheet Highlights
Total Debt
($ in millions)
Total Debt to
Total Capitalization
Total Debt
Net Debt
16

ManpowerGroup 2011 1st Quarter Results April 2011
(b)
(b)
Credit Facilities as of March 31, 2011
($ in millions)
($ in millions)
(a)
(a)
This $400M agreement requires, as of March 31, 2011 that we comply with a Debt-to-EBITDA ratio of less than 4.50 to 1 and a fixed charge
coverage ratio of greater than 1.25 to 1. As defined in the agreement, we had a Debt-to-EBITDA ratio of 1.52 and a fixed charge coverage
ratio of 2.61 as of March 31, 2011. As of March 31, 2011 there were $2.2M of standby letters of credit issued under the agreement.
coverage ratio of greater than 1.25 to 1. As defined in the agreement, we had a Debt-to-EBITDA ratio of 1.52 and a fixed charge coverage
ratio of 2.61 as of March 31, 2011. As of March 31, 2011 there were $2.2M of standby letters of credit issued under the agreement.
Represents subsidiary uncommitted lines of credit & overdraft facilities, which total $415.6M. Total subsidiary borrowings are limited to $300M
due to restrictions in our Revolving Credit Facility, with the exception of Q3 when subsidiary borrowings are limited to $600M.
due to restrictions in our Revolving Credit Facility, with the exception of Q3 when subsidiary borrowings are limited to $600M.
Interest
Rate
Maturity
Date
Total
Outstanding
Remaining
Available
Euro Notes:
- Euro 200M
4.86%
Jun 2013
283
-
- Euro 300M
4.58%
Jun 2012
424
-
Revolving Credit Agreement
2.79%
Nov 2012
-
398
378
Uncommitted lines and Other
Various
Various
39
Total Debt
746
776
17

ManpowerGroup 2011 1st Quarter Results April 2011
Down 13-15%
(Down 10-12% CC)
Up 23-25%
(Up 10-12% CC)
Up 17-19%
(Up 7-9% CC)
Up 25-27%
(Up 11-13% CC)
Up 13-15%
(Up 12-14% CC)
Up 20-22%
(Up 10-12% CC)
Second Quarter Outlook
Revenue
Americas
Southern Europe
APME
Right Management
Total
Gross Profit Margin
17.0-17.2%
Operating Profit Margin
2.4-2.6%
Tax Rate
48% (38% excl. reclassification of
France business tax)
France business tax)
EPS
$0.74-$0.82 (Favorable $.08 Currency)
Northern Europe
18

ManpowerGroup 2011 1st Quarter Results April 2011
The Human Age is Creating Complexity
• There are new demands for:
ØProductivity
ØInnovation
ØTalent
19

ManpowerGroup 2011 1st Quarter Results April 2011
The Human Age
• Our Opportunity
– ManpowerGroup is uniquely qualified to help our
clients and candidates navigate this new
complexity to win in the world of work with:
clients and candidates navigate this new
complexity to win in the world of work with:
• Our differentiated competitive position
• Our trusted brand and strong values
• Our unmatched global footprint
• Our unparalleled thought leadership position
• Our deep understanding of talent and business
20
ManpowerGroup 2011 1st Quarter Results April 2011
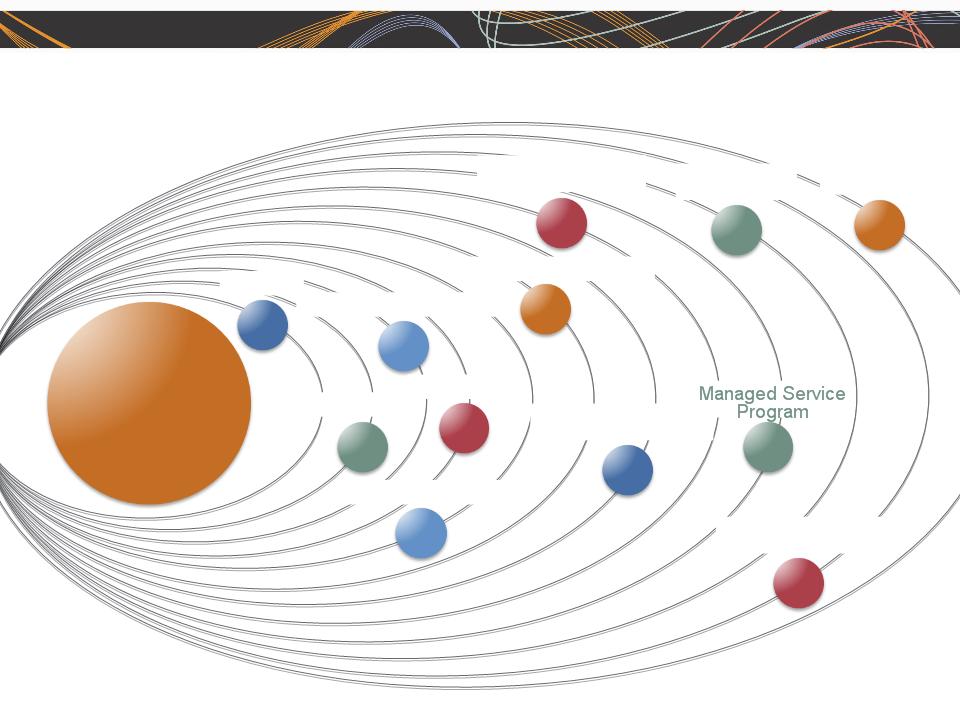
21
Core
Staffing
Staffing
On-Site
Specialty Services
Consulting
Assessment
Career Management
Human Resource
Services
Services
Talent Based
Outsourcing
Outsourcing
Permanent Recruitment
Sophistication of Offerings Increasing Exponentially
Recruitment Process
Outsourcing
Outsourcing
Talent
Management
Management
Borderless Talent
Solutions
Solutions
ManpowerGroup 2011 1st Quarter Results April 2011
We Are ManpowerGroup
22
ManpowerGroupTM is the world leader in innovative workforce solutions. We leverage our
global reach and local expertise of tens of thousands of people across more than 80
countries, making it possible for businesses to access the talent they need when they need it.
global reach and local expertise of tens of thousands of people across more than 80
countries, making it possible for businesses to access the talent they need when they need it.
ManpowerGroupTM Solutions provides clients with human resources outsourcing services
primarily in the areas of large-scale recruiting and outcome-based workforce-intensive
initiatives, thereby sharing in the risk and reward with our clients.
primarily in the areas of large-scale recruiting and outcome-based workforce-intensive
initiatives, thereby sharing in the risk and reward with our clients.
ExperisTM is the global leader in professional resourcing and project-based workforce
solutions. With operations in more than 50 countries, we deliver 53 million hours of
professional talent specializing in IT, Finance and Engineering to accelerate clients’
businesses each year.
solutions. With operations in more than 50 countries, we deliver 53 million hours of
professional talent specializing in IT, Finance and Engineering to accelerate clients’
businesses each year.
Right Management® is the global leader in talent and career management workforce
solutions. Through our innovative and proprietary process, we leverage our expertise to
successfully increase productivity and optimize business performance..
solutions. Through our innovative and proprietary process, we leverage our expertise to
successfully increase productivity and optimize business performance..
Manpower® is the global leader in contingent and permanent recruitment workforce
solutions. We provide the personal flexibility and agility businesses need with a continuum of
staffing solutions.
solutions. We provide the personal flexibility and agility businesses need with a continuum of
staffing solutions.

ManpowerGroup 2011 1st Quarter Results April 2011
Ù One Global Operating Model with Fixed &
Flexible Components
Flexible Components
Ù Deep Vertical Expertise at the Global &
Local Levels
Local Levels
Ù Efficiencies Driven through a Research and
Sourcing Center (RSC)
Sourcing Center (RSC)
Ù Consolidation of Existing Brands and Global
Best Practices
Best Practices
23
Key Differentiators

Questions