Attached files
| file | filename |
|---|---|
| 8-K - POLARIS INDUSTRIES INC. 8-K - Polaris Inc. | a6690883.htm |
| EX-99.1 - EXHIBIT 99.1 - Polaris Inc. | a6690883ex99_1.htm |
Exhibit 99.2

First Quarter 2011 Earnings Results April 20, 2011
Title:Safe Harbor Body:Except for historical information contained herein, the matters set forth in this document, including but not limited to management’s expectations regarding 2011 sales, shipments, net income, cash flow, and manufacturing realignment transition costs and savings, are forward-looking statements that involve certain risks and uncertainties that could cause actual results to differ materially from those forward-looking statements. Potential risks and uncertainties include such factors as product offerings, promotional activities and pricing strategies by competitors; manufacturing realignment transition costs; acquisition integration costs; warranty expenses; impact of changes in Polaris stock prices on incentive compensation; foreign currency exchange rate fluctuations; environmental and product safety regulatory activity; effects of weather; commodity costs; uninsured product liability claims; uncertainty in the retail and wholesale credit markets; changes in tax policy and overall economic conditions, including inflation, consumer confidence and spending and relationships with dealers and suppliers. Investors are also directed to consider other risks and uncertainties discussed in our 2009 annual report and Form 10-K filed by the Company with the Securities and Exchange Commission. The Company does not undertake any duty to any person to provide updates to its forward-looking statements.The data source for retail sales figures included in this presentation is registration information provided by Polaris dealers in North America and compiled by the Company or Company estimates. The Company must rely on information that its dealers supply concerning retail sales, and other retail sales data sources and this information is subject to revision. April 2011

First Quarter 2011 Earnings Results April 20, 2011 Scott WineCEO
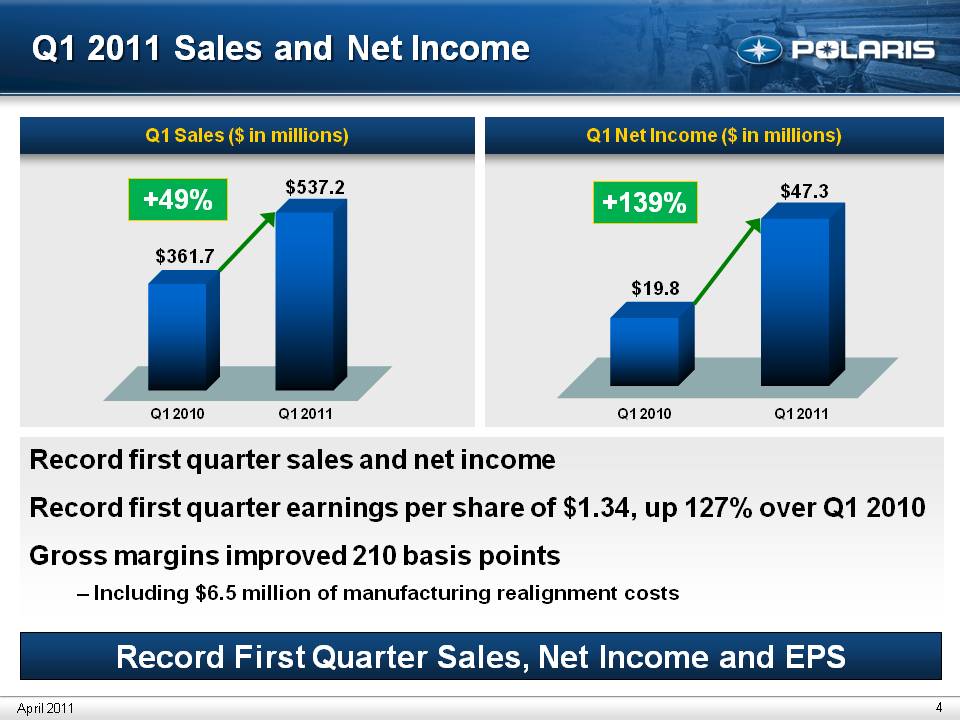
Title:Q1 2011 Sales and Net Income Q1 Net Income ($ in millions)Q1 Sales ($ in millions)$19.8$47.3+139%$361.7$537.2+49%Q1 2011Q1 2010Q1 2011Q1 2010Record first quarter sales and net income Record first quarter earnings per share of $1.34, up 127% over Q1 2010 Gross margins improved 210 basis points – Including $6.5 million of manufacturing realignment costs Record First Quarter Sales, Net Income and EPS April 2011
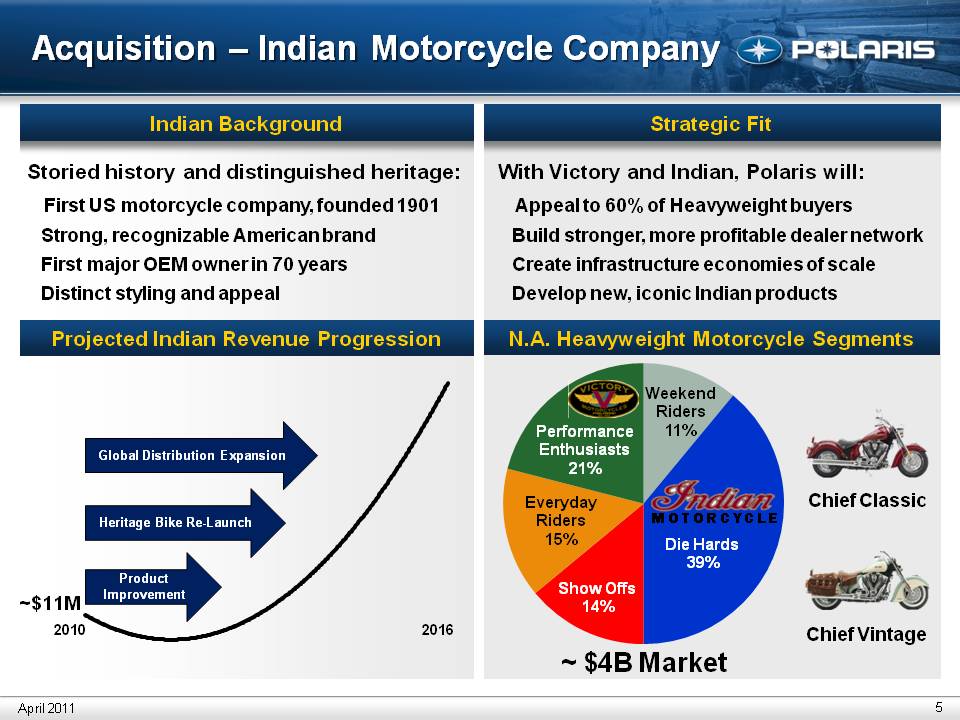
Title: Acquisition – Indian Motorcycle Company Storied history and distinguished heritage: First US motorcycle company, founded 1901 Strong, recognizable American brand First major OEM owner in 70 years Distinct styling and appeal Strategic Fit With Victory and Indian, Polaris will: Appeal to 60% of Heavyweight buyers Build stronger, more profitable dealer network Create infrastructure economies of scale Develop new, iconic Indian products April 2011 Chief Classic Chief Vintage N.A. Heavyweight Motorcycle Segments Indian Background Projected Indian Revenue Progression Product Improvement Heritage Bike Re-Launch Global Distribution Expansion (Gp:) M O T O R C Y C L E ~ $4B Market
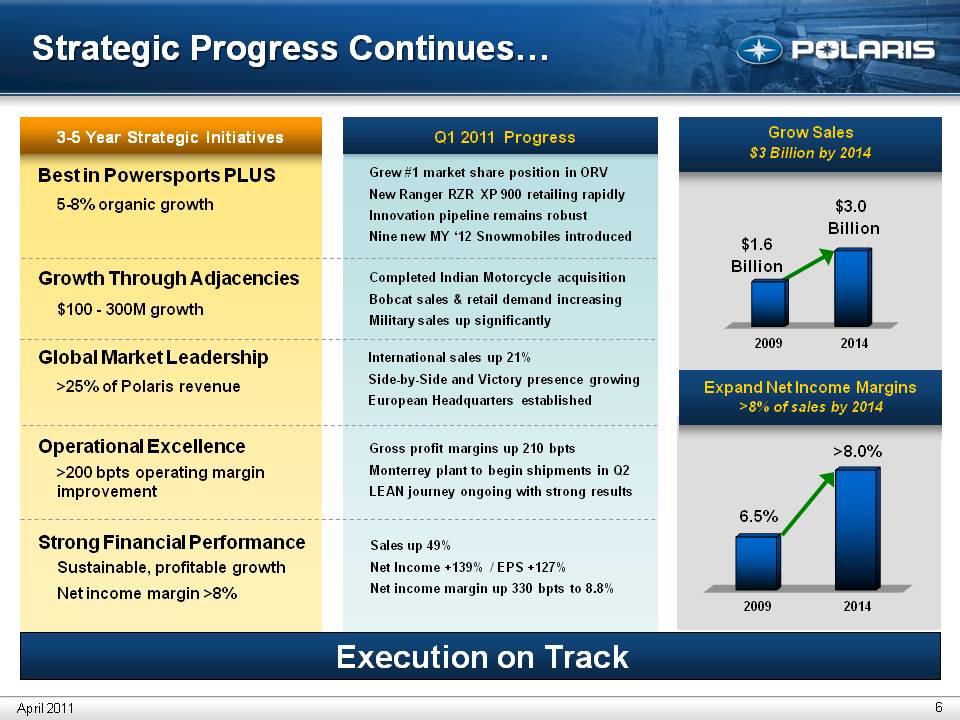
Title:Strategic Progress Continues…$1.6 Billion $3.0 Billion Grow Sales $3 Billion by 2014 Expand Net Income Margins>8% of sales by 2014 Execution on Track Q1 2011 Progress 3-5 Year Strategic Initiatives Best in Powersports PLUS 5-8% organic growth Growth Through Adjacencies$100 - 300M growth Global Market Leadership>25% of Polaris revenueOperational Excellence>200 bpts operating margin improvementStrong Financial PerformanceSustainable, profitable growth Net income margin >8% Sales up 49% Net Income +139% / EPS +127% Net income margin up 330 bpts to 8.8% Grew #1 market share position in ORVNew Ranger RZR XP 900 retailing rapidlyInnovation pipeline remains robustNine new MY ‘12 Snowmobiles introduced Completed Indian Motorcycle acquisitionBobcat sales & retail demand increasingMilitary sales up significantly International sales up 21% Side-by-Side and Victory presence growingEuropean Headquarters established Gross profit margins up 210 bpts Monterrey plant to begin shipments in Q2LEAN journey ongoing with strong results 6.5% >8.0% 2009 2009 2014 2014 April 2011
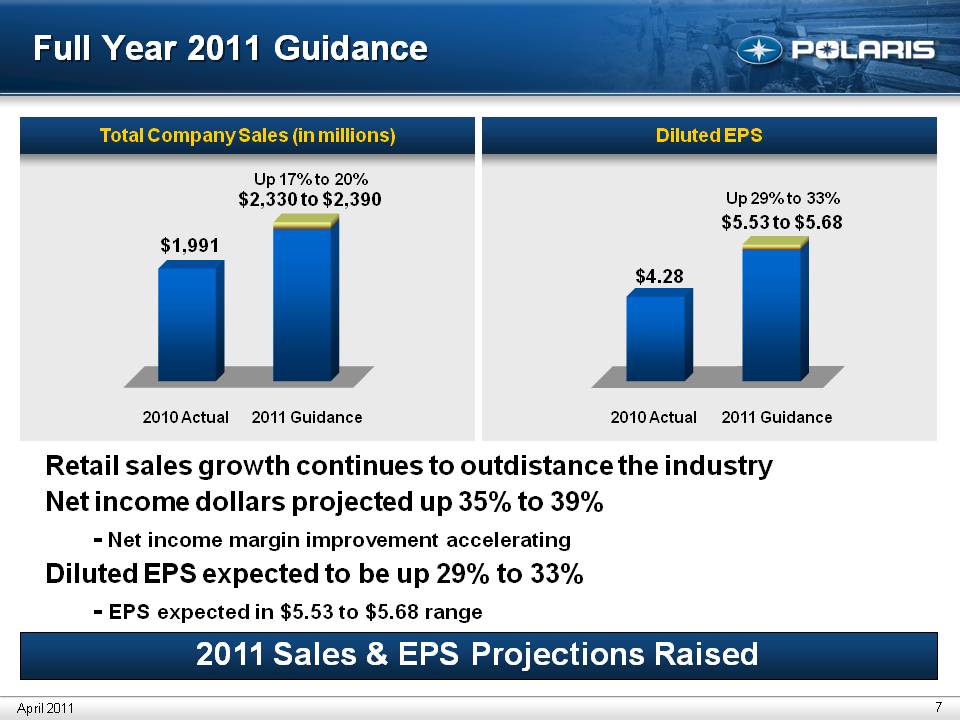
Total Company Sales (in millions) Diluted EPS Title:Full Year 2011 Guidance $1,991 Up 17% to 20% $2,330 to $2,3902010 Actual2011 Guidance$4.28Up 29% to 33%$5.53 to $5.682010 Actual2011 Guidance2011 Sales & EPS Projections RaisedRetail sales growth continues to outdistance the industry Net income dollars projected up 35% to 39% - Net income margin improvement accelerating Diluted EPS expected to be up 29% to 33% - EPS expected in $5.53 to $5.68 range April 2011
First Quarter 2011 Earnings ResultsApril 20, 2011 Bennett MorganPresident & COO
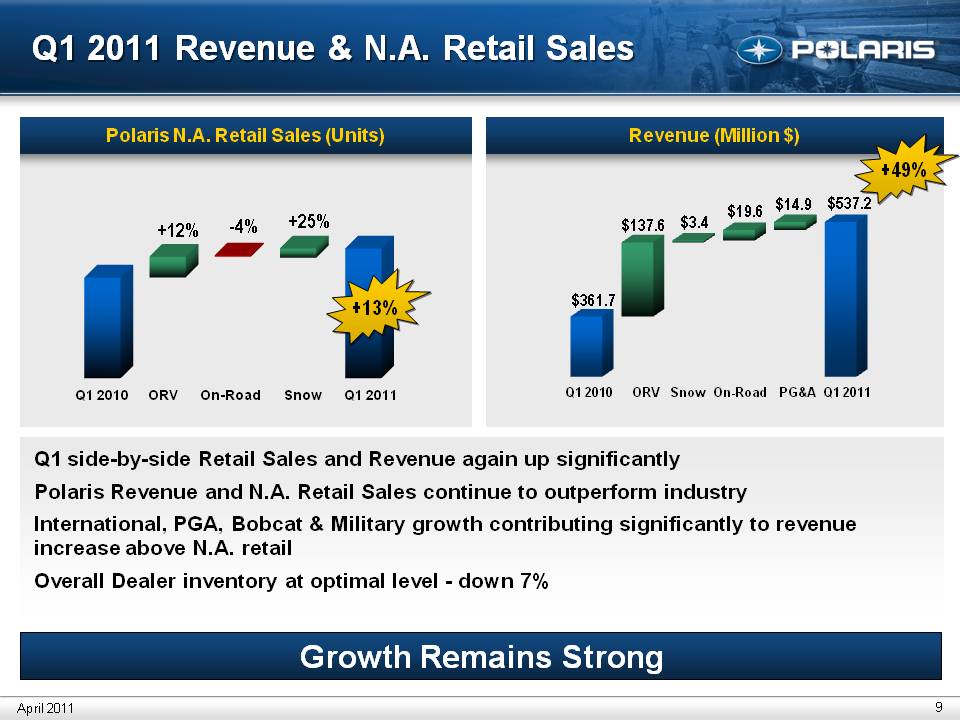
Title: Q1 2011 Revenue & N.A. Retail Sales Growth Remains Strong Revenue (Million $)Polaris N.A. Retail Sales (Units) $361.7$137.6$3.4$19.6 $14.9$537.2+13%+12%-4%+25%+49%Q1 side-by-side Retail Sales and Revenue again up significantly Polaris Revenue and N.A. Retail Sales continue to outperform industry International, PGA, Bobcat & Military growth contributing significantly to revenue increase above N.A. retail Overall Dealer inventory at optimal level - down 7% April 2011
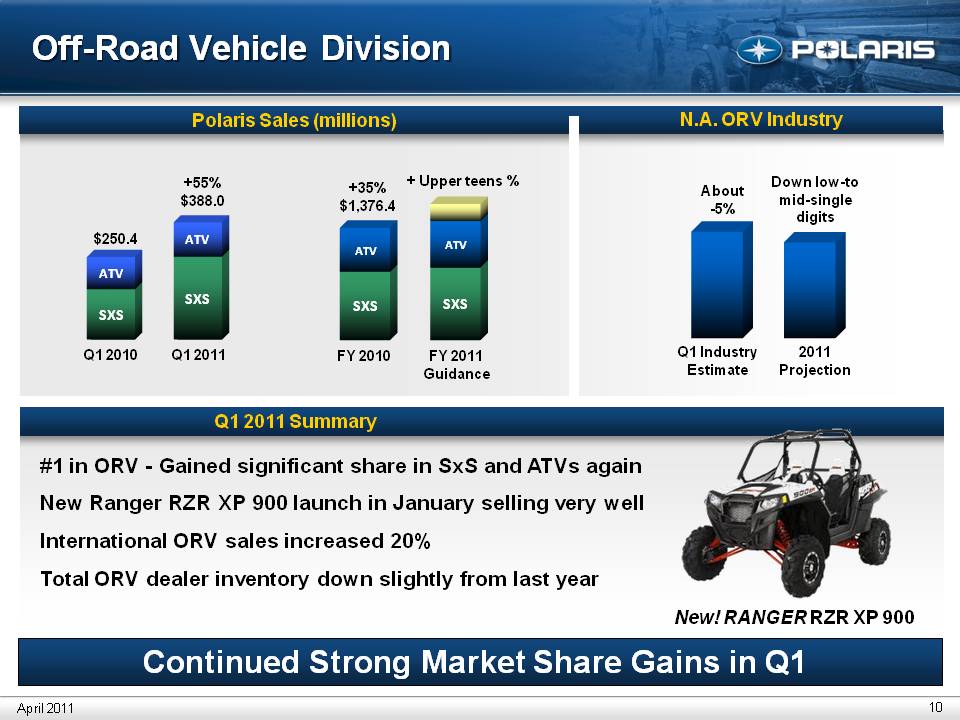
Title: Off-Road Vehicle Division New! RANGER RZR XP 900Polaris Sales (millions)FY 2011 Guidance FY 2010Q1 2011Q1 2010 $250.4+35% $1,376.4+55% $388.0#1 in ORV - Gained significant share in SxS and ATVs again New Ranger RZR XP 900 launch in January selling very well International ORV sales increased 20% Total ORV dealer inventory down slightly from last year2011 ProjectionQ1 Industry Estimate Down low-to mid-single digits N.A. ORV Industry Continued Strong Market Share Gains in Q1 April 2011+ Upper teens %About-5%Q1 2011 Summary

Title: Adjacencies Bobcat vehicle retail momentum increasingCo-developed vehicle on-track to push further into work side-by-sides Bobcat Strategic Alliance Military Bobcat Partnership – Progressing well Polaris Defense –Gaining momentum April 2011 Shipped initial vehicles under $67M National Guard contract in Q1Received 1st Air Guard orderGaining traction in International markets with military productsReceived $5M order for Afghan National Security Forces – shipping in Q2
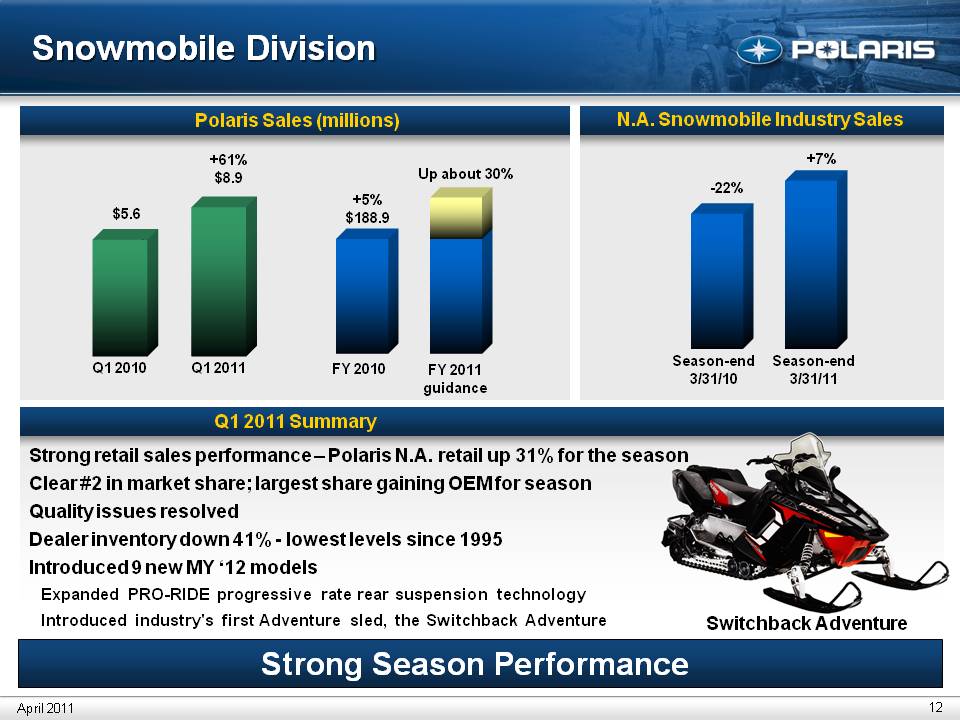
Title: Snowmobile Division $5.6+61%$8.9FY 2011guidance +5%$188.9Up about 30%FY 2010Q1 2011Q1 2010Polaris Sales (millions) Strong retail sales performance – Polaris N.A. retail up 31% for the seasonClear #2 in market share; largest share gaining OEM for seasonQuality issues resolvedDealer inventory down 41% - lowest levels since 1995Introduced 9 new MY ‘12 models Expanded PRO-RIDE progressive rate rear suspension technologyIntroduced industry's first Adventure sled, the Switchback Adventure Strong Season Performance April 2011 Season-end3/31/10 Season-end3/31/11 +7% Switchback Adventure N.A. Snowmobile Industry Sales Q1 2011 Summary
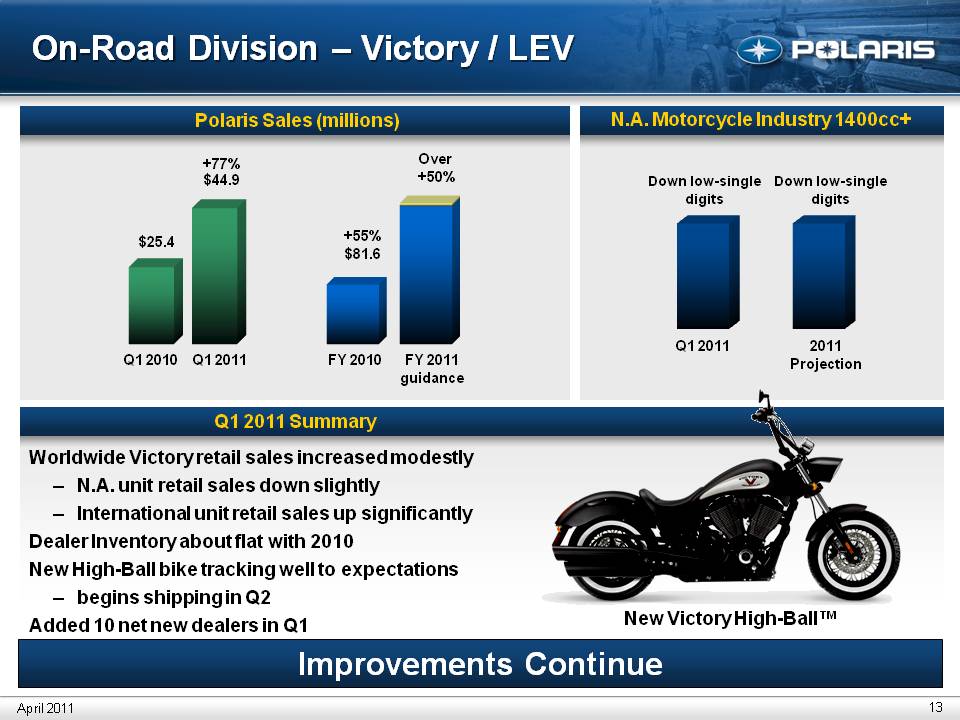
Title:On-Road Division – Victory / LEV Polaris Sales (millions) Improvements Continue April 2011 N.A. Motorcycle Industry 1400cc+ Q1 2011 Summary Worldwide Victory retail sales increased modestlyN.A. unit retail sales down slightlyInternational unit retail sales up significantlyDealer Inventory about flat with 2010New High-Ball bike tracking well to expectations begins shipping in Q2Added 10 net new dealers in Q1 New Victory High-Ball™ $25.4 +77% $44.9 +55% $81.6 Over +50% FY 2011guidance Q1 2011 Q1 2010 FY 2010 2011Projection Q1 2011 Down low-single digits Down low-single digits
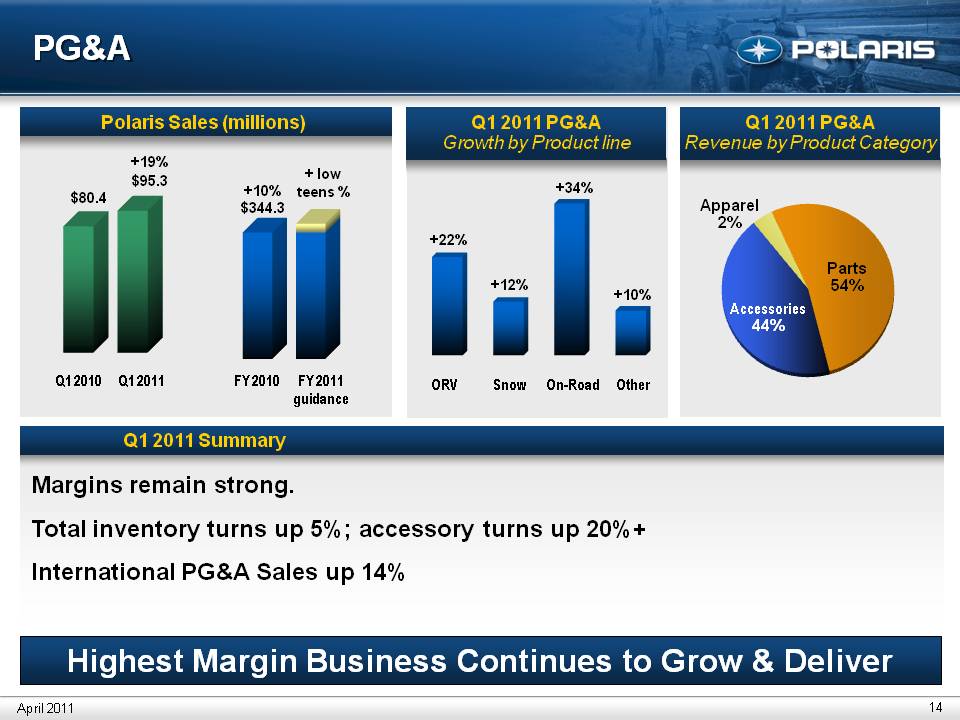
Title: PG&A Highest Margin Business Continues to Grow & Deliver Polaris Sales (millions) Q1 2011 PG&A Growth by Product line Q1 2011 PG&A Revenue by Product Category Aus/NZ 13% Parts 54% Accessories 44% Apparel 2% $80.4 +19% $95.3 FY 2011 guidance FY 2010 Q1 2011 Q1 2010 +10% $344.3 Margins remain strong. Total inventory turns up 5%; accessory turns up 20%+ International PG&A Sales up 14% + low teens % April 2011 ORV Snow On-Road Other +22% +12% +34% +10% Q1 2011 Summary
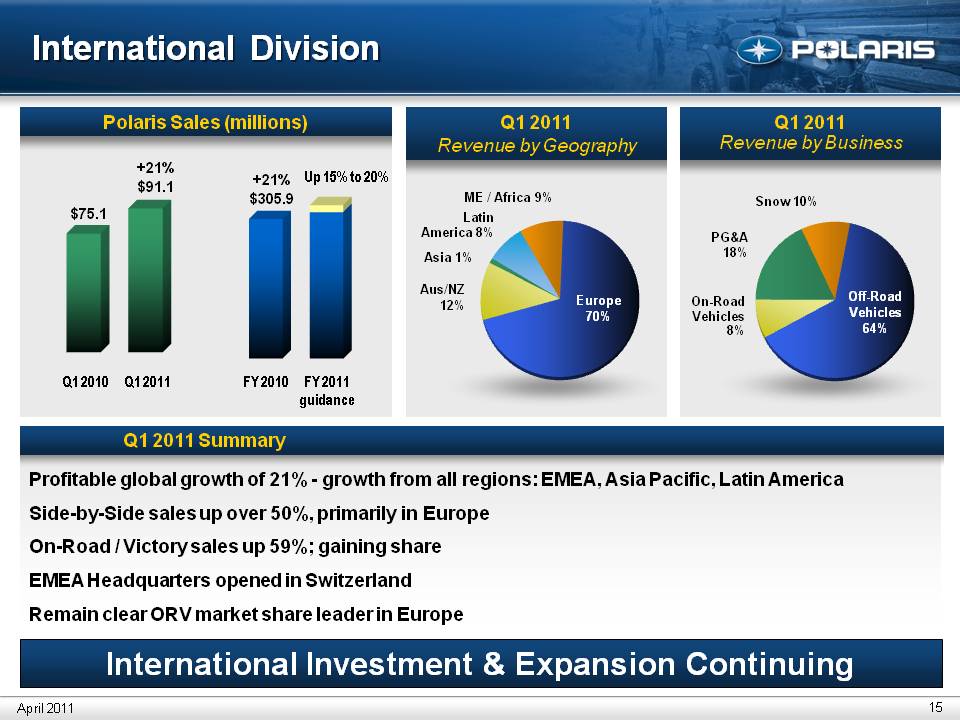
Title: International Division International Investment & Expansion Continuing $75.1 +21% $91.1 +21%$305.9 Polaris Sales (millions) Q1 2011Revenue by Geography Q1 2011 Revenue by Business FY 2011guidance FY 2010 Q1 2011 Q1 2010 ME / Africa 9% Latin America 8% Asia 1% Aus/NZ 12% Europe 70% Off-Road Vehicles 64% On-Road Vehicles 8% PG&A 18% Snow 10% Profitable global growth of 21% - growth from all regions: EMEA, Asia Pacific, Latin AmericaSide-by-Side sales up over 50%, primarily in EuropeOn-Road / Victory sales up 59%; gaining shareEMEA Headquarters opened in SwitzerlandRemain clear ORV market share leader in Europe Up 15% to 20% April 2011 Q1 2011 Summary
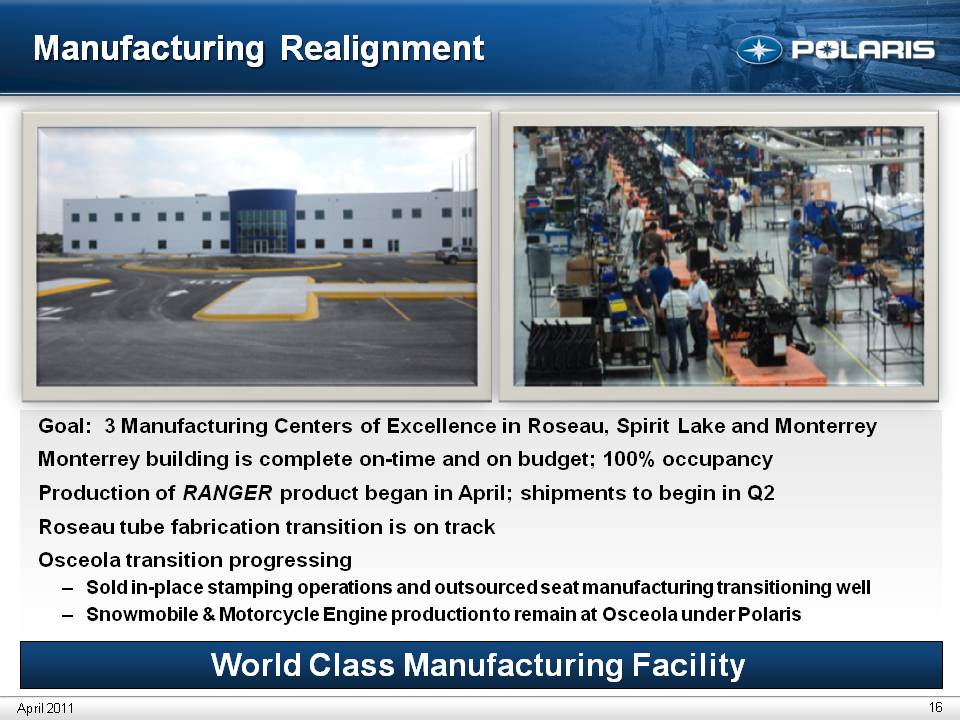
Title: Manufacturing Realignment Goal: 3 Manufacturing Centers of Excellence in Roseau, Spirit Lake and MonterreyMonterrey building is complete on-time and on budget; 100% occupancyProduction of RANGER product began in April; shipments to begin in Q2Roseau tube fabrication transition is on trackOsceola transition progressingSold in-place stamping operations and outsourced seat manufacturing transitioning wellSnowmobile & Motorcycle Engine production to remain at Osceola under Polaris World Class Manufacturing Facility April 2011
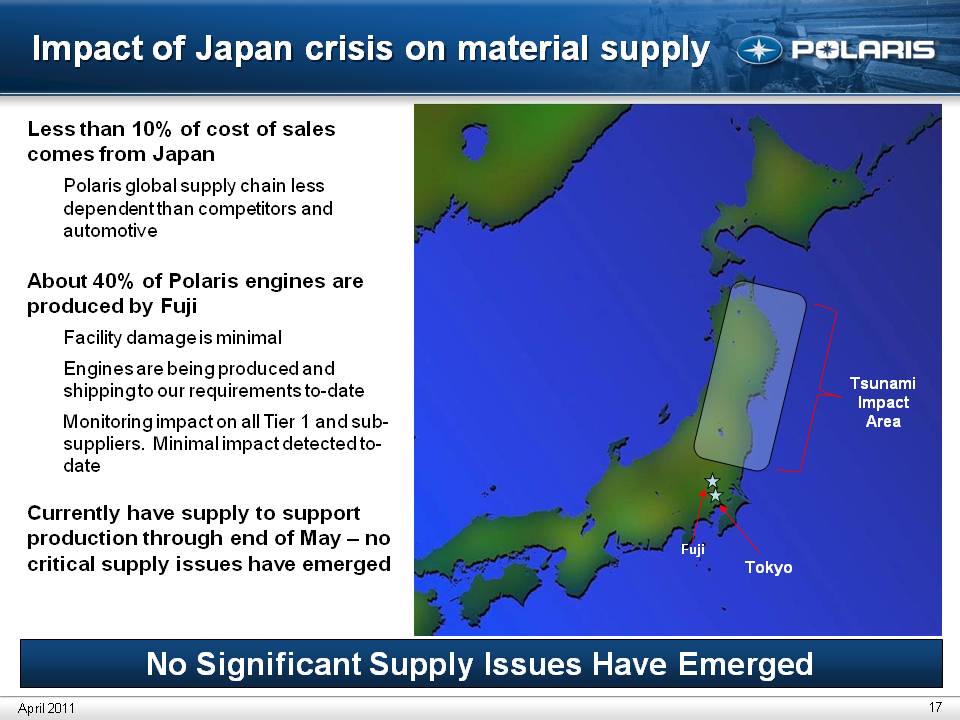
Title: Impact of Japan crisis on material supply Fuji Tokyo Less than 10% of cost of sales comes from JapanPolaris global supply chain less dependent than competitors and automotiveAbout 40% of Polaris engines are produced by Fuji Facility damage is minimalEngines are being produced and shipping to our requirements to-dateMonitoring impact on all Tier 1 and sub-suppliers. Minimal impact detected to-dateCurrently have supply to support production through end of May – no critical supply issues have emerged Map not to scale Tsunami Impact Area No Significant Supply Issues Have Emerged April 2011
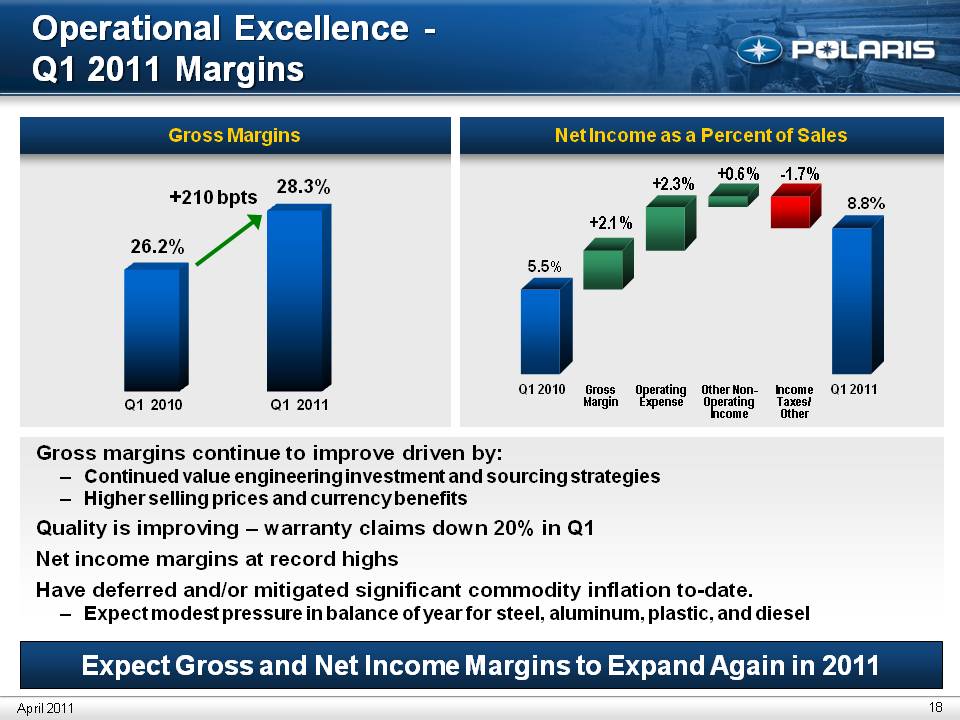
Title: Operational Excellence - Q1 2011 Margins Net Income as a Percent of Sales Gross Margins GrossMargin OperatingExpense Other Non-Operating Income IncomeTaxes/Other Q1 2010 Q1 2011 26.2% 28.3% 5.5% 8.8% +210 bpts Gross margins continue to improve driven by:Continued value engineering investment and sourcing strategiesHigher selling prices and currency benefitsQuality is improving – warranty claims down 20% in Q1Net income margins at record highsHave deferred and/or mitigated significant commodity inflation to-date. Expect modest pressure in balance of year for steel, aluminum, plastic, and diesel Expect Gross and Net Income Margins to Expand Again in 2011 April 2011

First Quarter 2011 Earnings ResultsApril 20, 2011 Mike MaloneV.P. Finance and CFO
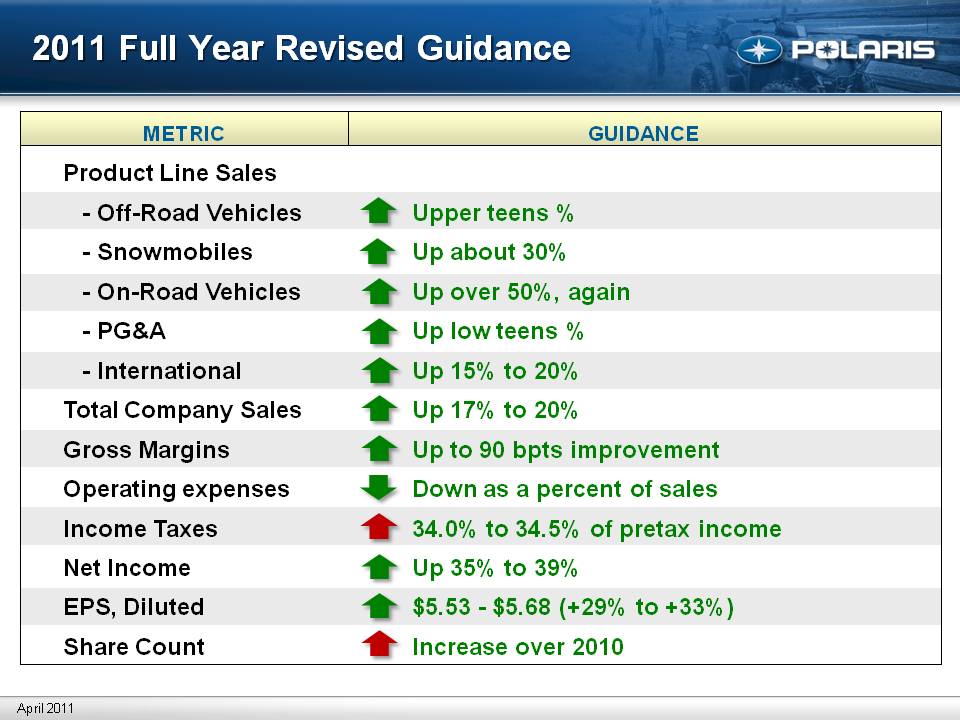
Title:2011 Full Year Revised Guidance METRIC GUIDANCE Product Line Sales - Off-Road Vehicles - Snowmobiles - On-Road Vehicles - PG&A - InternationalTotal Company SalesGross MarginsOperating expensesIncome TaxesNet IncomeEPS, DilutedShare Count Upper teens %Up about 30%Up over 50%, againUp low teens %Up 15% to 20%Up 17% to 20% Up to 90 bpts improvement Down as a percent of sales34.0% to 34.5% of pretax income Up 35% to 39% $5.53 - $5.68 (+29% to +33%)Increase over 2010 April 2011
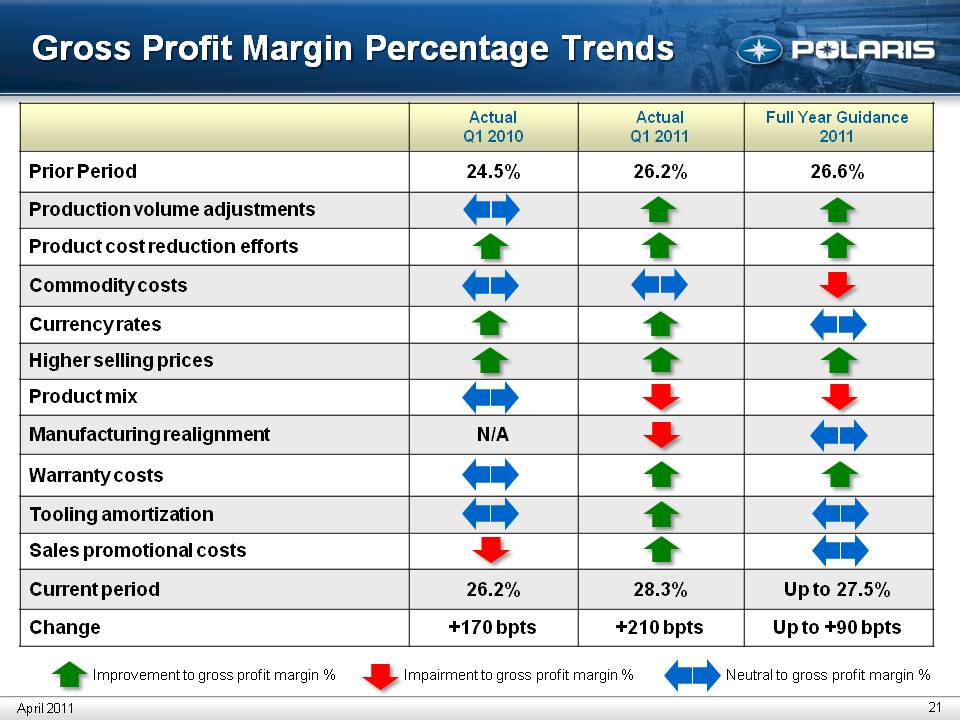
Title: Gross Profit Margin Percentage Trends Actual Q1 2010 Actual Q1 2011 Full Year Guidance 2011 Prior Period 24.5% 26.2% 26.6% Production volume adjustments Product cost reduction efforts Commodity costs Currency rates Higher selling prices Product mix Manufacturing realignment N/A Warranty costs Tooling amortization Sales promotional costs Current period 26.2% 28.3% Up to 27.5% Change +170 bpts +210 bpts Up to +90 bpts Improvement to gross profit margin % Impairment to gross profit margin % Neutral to gross profit margin % April 2011
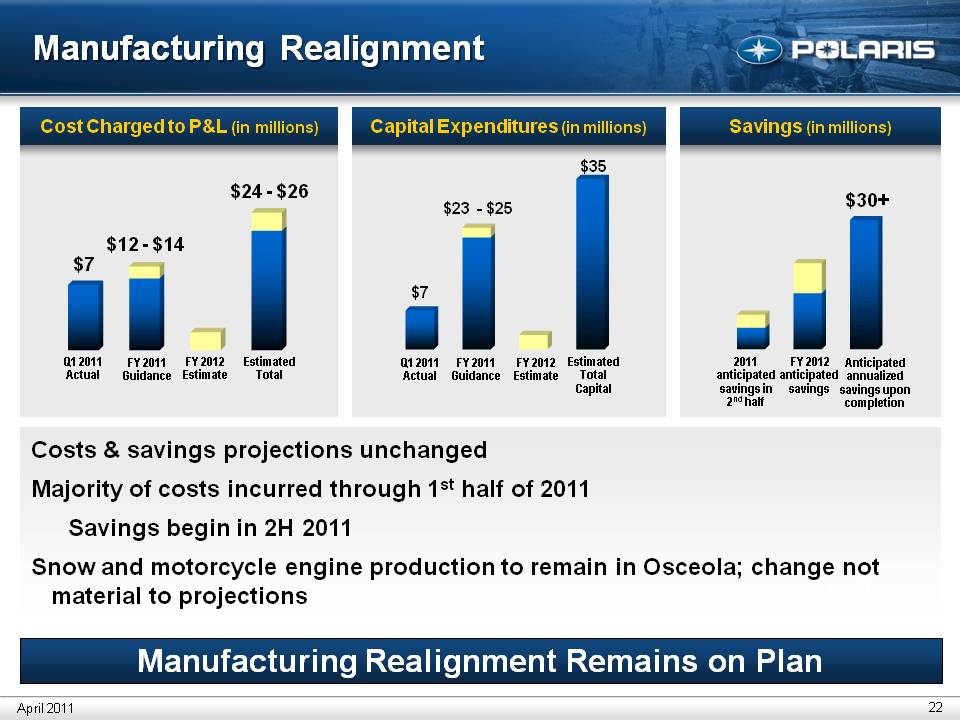
Title: Manufacturing Realignment Cost Charged to P&L (in millions) Aus/NZ 13% Capital Expenditures (in millions) Savings (in millions) Anticipated annualized savings upon completion 2011 anticipated savings in 2nd half $24 - $26 $12 - $14 $7 $35 $7 $30+ Estimated Total FY 2011 Guidance Q1 2011Actual $23 - $25 FY 2012 Estimate FY 2012 anticipated savings Estimated Total Capital FY 2011 Guidance FY 2012 Estimate April 2011 Q1 2011Actual Costs & savings projections unchanged Majority of costs incurred through 1st half of 2011 Savings begin in 2H 2011Snow and motorcycle engine production to remain in Osceola; change not material to projections Manufacturing Realignment Remains on Plan April 2011
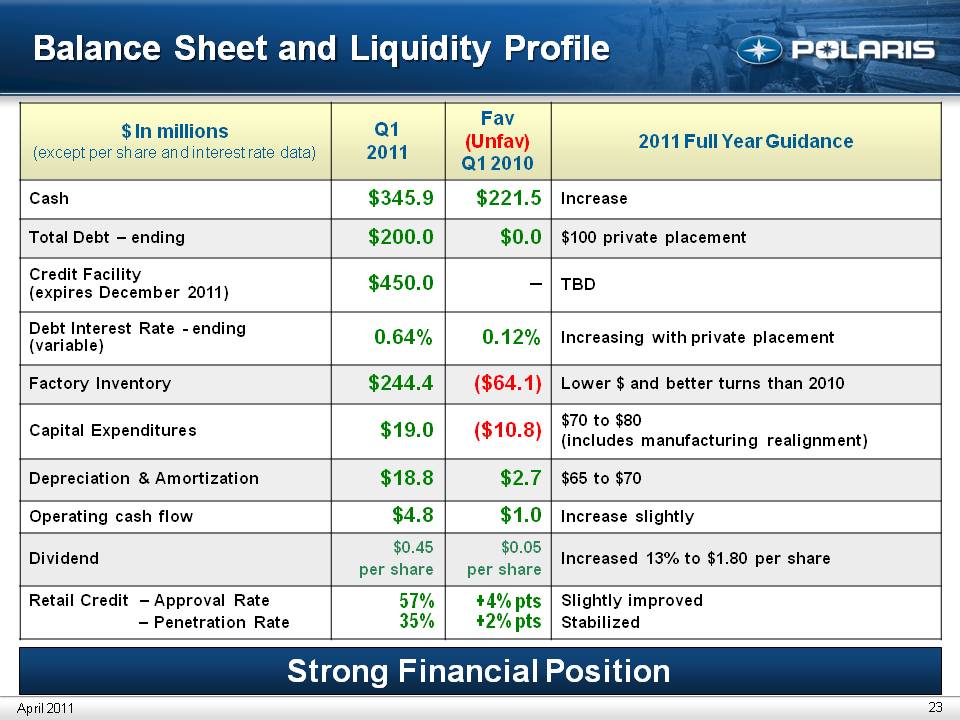
Title: Balance Sheet and Liquidity Profile $ In millions (except per share and interest rate data) Q1 2011 Fav (Unfav) Q1 2010 2011 Full Year Guidance Cash $345.9 $221.5 Increase Total Debt – ending $200.0 $0.0 $100 private placement Credit Facility (expires December 2011) $450.0 -- TBD Debt Interest Rate - ending (variable) 0.64% 0.12% Increasing with private placement Factory Inventory $244.4 ($64.1) Lower $ and better turns than 2010 Capital Expenditures $19.0 ($10.8) $70 to $80 (includes manufacturing realignment) Depreciation & Amortization $18.8 $2.7 $65 to $70 Operating cash flow $4.8 $1.0 Increase slightly Dividend $0.45 per share $0.05 per share Increased 13% to $1.80 per share Retail Credit – Approval Rate– Penetration Rate 57% 35% +4% pts +2% pts Slightly improved Stabilized Strong Financial Position April 2011
First Quarter 2011 Earnings Results April 20, 2011 Scott WineCEO
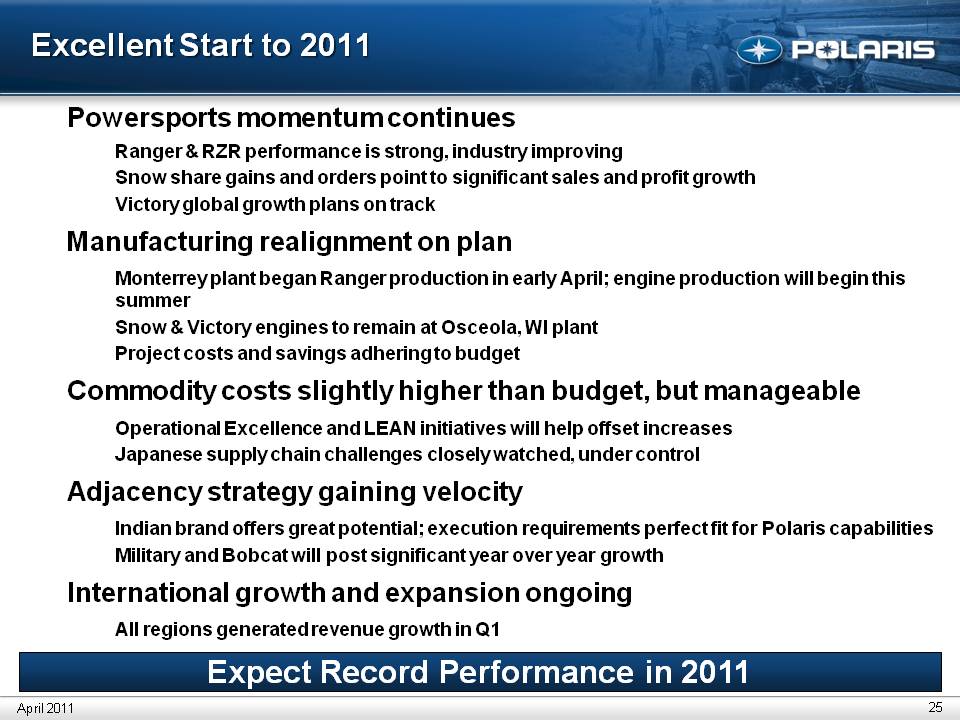
Title: Excellent Start to 2011 Powersports momentum continuesRanger & RZR performance is strong, industry improvingSnow share gains and orders point to significant sales and profit growthVictory global growth plans on trackManufacturing realignment on planMonterrey plant began Ranger production in early April; engine production will begin this summer Snow & Victory engines to remain at Osceola, WI plantProject costs and savings adhering to budgetCommodity costs slightly higher than budget, but manageableOperational Excellence and LEAN initiatives will help offset increasesJapanese supply chain challenges closely watched, under controlAdjacency strategy gaining velocityIndian brand offers great potential; execution requirements perfect fit for Polaris capabilitiesMilitary and Bobcat will post significant year over year growth International growth and expansion ongoingAll regions generated revenue growth in Q1Margin expansion accelerating Expect Record Performance in 2011 April 2011
Thank you. Q & A Polaris Industries Inc. April 2011