Attached files
Table of Contents
U.S. SECURITIES AND EXCHANGE COMMISSION
WASHINGTON, D.C. 20549
FORM 10-K
Annual Report under Section 13 or 15(d) of the
Securities Exchange Act of 1934
For the Fiscal Year ended December 31, 2010
OR
Transition Report under Section 13 or 15(d) of the
Securities Exchange Act of 1934
For the Transition Period from ___________ to ___________
Commission File Number: 000-49898
North State Bancorp
(Exact name of registrant as specified in its charter)
| North Carolina | 65-1177289 | |
| (State or other jurisdiction of | (I.R.S. Employer | |
| incorporation or organization) | Identification No.) |
6204 Falls of the Neuse Road
Raleigh, North Carolina 27609
(Address of principal executive offices, including zip code)
(919) 787-9696
(Issuer’s telephone number)
Securities Registered under Section 12(b) of the Act: None
Securities Registered under Section 12(g) of the Act:
| Title of Each Class |
Name of Each Exchange On Which Registered | |
| Common Stock, No Par Value | None |
Indicate by check mark if the registrant is a well-known seasoned issuer, as defined in Rule 405 of the Securities Act. Yes ¨ No x
Indicate by check mark if the registrant is not required to file reports to Section 13 or Section 15(d) of the Act. Yes ¨ No x
Indicate by check mark whether the registrant (1) has filed all reports required to be filed by Section 13 or 15(d) of the Exchange Act during the past 12 months (or for such shorter period that the registrant was required to file such reports), and (2) has been subject to such filing requirements for the past 90 days. Yes x No ¨
Indicate by check mark whether the registrant has submitted electronically and posted on its corporate Web site, if any, every Interactive Data File required to be submitted and posted pursuant to Rule 405 of Regulation S-T during the preceding 12 months (or for such shorter period that the registrant was required to submit and post such files).
Yes ¨ No ¨
Indicated by check mark if disclosure of delinquent filers in response to Item 405 of Regulation S-K is not contained herein, and will not be contained, to the best of the registrant’s knowledge, in definitive proxy or information statements incorporated by reference in Part III of this Form 10-K or any amendment to this Form 10-K. ¨
Indicate by check mark whether the registrant is a shell company (as defined in Rule 12b-2 of the Exchange Act). Yes ¨ No x.
Indicate by check mark whether the registrant is a large accelerated filer, an accelerated filer, a non-accelerated filer or a smaller reporting company. See definitions of “large accelerated filer,” “accelerated filer,” and “smaller reporting company” in Rule 12b-2 of the Exchange Act:
| Large accelerated filer | ¨ | Accelerated filer | ¨ | |||
| Non-accelerated filer | ¨ (Do not check if a smaller reporting company) | Smaller reporting company | x | |||
The aggregate market value of the common stock held by non-affiliates was approximately $14.3 million as of June 30, 2010, based on the closing price of the common stock as quoted on the over-the-counter Bulletin Board on that day.
As of March 28, 2011, the registrant had outstanding 7,427,976 shares of Common Stock, no par value.
DOCUMENTS INCORPORATED BY REFERENCE
Portions of the registrant’s definitive proxy statement to be filed for its 2011 Annual Meeting of Shareholders to be held on June 2, 2011 to be filed with the Securities and Exchange Commission within 120 days of December 31, 2010 are incorporated by reference into Part III of this report.
Table of Contents
NORTH STATE BANCORP
ANNUAL REPORT ON FORM 10-K
Table of Contents
NOTE REGARDING FORWARD-LOOKING STATEMENTS
Statements contained in this report, which are not historical facts, are forward-looking statements, as that term is defined in the Private Securities Litigation Reform Act of 1995. Amounts herein could vary as a result of market and other factors. Such forward-looking statements are subject to risks and uncertainties which could cause actual results to differ materially from those currently anticipated due to a number of factors, which include, but are not limited to, factors discussed in documents we file with the U.S. Securities and Exchange Commission from time to time. Such forward-looking statements may be identified by the use of such words as “believe,” “expect,” “anticipate,” “should,” “might,” “planned,” “estimated,” and “potential.” Examples of forward-looking statements include, but are not limited to, estimates with respect to our financial condition, expected or anticipated revenue, results of operations and business that are subject to various factors which could cause actual results to differ materially from these estimates. These factors include, but are not limited to: local, regional and national economies; substantial changes in financial markets; changes in real estate values and real estate markets; changes in interest rates; changes in legislation or regulation; our ability to manage growth; loss of deposits and loan demand to other savings and financial institutions; changes in accounting principles, policies, or guidelines; and other economic competitive, governmental, regulatory, and technological factors affecting our operations, pricing, products and services.
PART I
| Item 1. | Business. |
Overview
We are a commercial bank holding company that was incorporated on June 5, 2002. We have one corporate subsidiary, North State Bank, which we acquired on June 28, 2002 as part of the Bank’s holding company reorganization. Our primary business is the ownership and operation of North State Bank. We also have three trust subsidiaries that we established to issue trust preferred securities.
North State Bank was incorporated under the laws of the State of North Carolina in May 2000 and opened for business on June 1, 2000. The Bank is not a member of the Federal Reserve System. Our main office and that of the Bank is located at 6204 Falls of the Neuse Road in north Raleigh, North Carolina. The Bank also operates offices at 4270 The Circle at North Hills, Raleigh, 2413 Blue Ridge Road in west Raleigh, 14091 New Falls of Neuse Road in the Wakefield area of north Raleigh, 835 Highway 70 West in Garner, North Carolina, 230 Fayetteville Street in downtown Raleigh and 1411 Commonwealth Drive, Wilmington, North Carolina. The term “we” in this report refers interchangeably to North State Bancorp and North State Bank.
We focus on serving the total banking needs of professional firms, professionals, property management companies, churches, non-profits and individuals who highly value a mutually beneficial banking relationship in the cities of Raleigh, Garner and Wilmington and the greater Wake County and New Hanover County market areas, by providing banking services including checking, savings and investment accounts; commercial, installment, mortgage, and personal loans; safe deposit boxes; savings bonds; wire transfer; and other associated services. We offered limited services in the Carteret County market area through a loan production office in Morehead City until April 2010 when we closed the office and combined its loan production with our Wilmington office. Although we have offered services specific to community association management firms throughout our history, we furthered our commitment to this industry in February 2009 by launching a new division, “CommunityPLUS”. This division is dedicated to serving the specialized needs of community association management firms. In November 2009 we sold our 5.6% interest in Beacon Title Agency, LLC, a title insurance agency, which we acquired in October 2007. Through the Bank’s subsidiary, North State Bank Financial Services, Inc., we offer wealth management and brokerage services. North State Bank Mortgage, a division of the Bank, began operations during February 2010 for the purpose of originating and selling single family, residential first mortgage loans.
Supervision and Regulation
Regulation of North State Bank
North State Bank is a North Carolina banking corporation whose deposits are insured by the Federal Deposit Insurance Corporation, or FDIC. As a commercial bank, we are subject to extensive regulation by the FDIC and the North Carolina Commissioner of Banks. The North Carolina Commissioner of Banks and the FDIC periodically examine our operations and require us to submit periodic reports regarding our financial condition and operations.
1
Table of Contents
We are subject to various state and federal laws and regulations that restrict or otherwise apply to our lending, deposit-taking and other business activities. Additionally, federal law generally prohibits us from engaging as principal in activities that are not permitted for national banks unless the FDIC determines that the activity would pose no significant risk to the deposit insurance fund, and we are, and continue to be, in compliance with all applicable capital standards. In addition, we generally are not able to acquire or retain equity investments of a type, or in an amount, that is not permissible for a national bank.
A bank must obtain the prior approval of the North Carolina Commissioner of Banks for any of the following events:
| • | the merger with or purchase of substantially all the assets or assumption of liabilities of another financial institution; |
| • | the establishment of a branch office; and |
| • | the establishment or acquisition of a subsidiary corporation. |
The North Carolina Commissioner of Banks or the FDIC may sanction any insured bank not operated in accordance with or not conforming to applicable regulations, policies, and directives. Proceedings may be instituted against an insured bank or any director, officer or employee of a bank that engages in unsafe and unsound practices, including the violation of applicable laws and regulations. The FDIC can terminate insurance of accounts of any insured bank not operated in accordance with or not conforming to its regulations, policies, and directives.
All FDIC-insured banks must maintain average daily reserves against their transaction accounts. Because required reserves must be maintained in the form of vault cash or in a non-interest-bearing account at a Federal Reserve Bank, the effect of the reserve requirement is to reduce the amount of the Bank’s interest-earning assets.
The Bank is subject to the provisions of Section 23A of the Federal Reserve Act. Section 23A places limits on the amount of certain transactions with affiliate entities. The total amount of the transactions by the Bank with a single affiliate is limited to 10% of the Bank’s capital and surplus and, for all affiliates, to 20% of the Bank’s capital and surplus. Each of the transactions among affiliates must also meet specified collateral requirements and must comply with other provisions of Section 23A designed to avoid transfers of low-quality assets between affiliates. The Bank also is subject to the provisions of Section 23B of the Federal Reserve Act which, among other things, prohibits transactions with affiliates that are subject to Section 23A unless the transactions are on terms substantially the same, or at least as favorable to the Bank or its subsidiaries, as those prevailing at the time for comparable transactions with nonaffiliated companies.
The USA Patriot Act of 2001 is intended to strengthen the ability of U.S. law enforcement and the intelligence community to work cohesively to combat terrorism on a variety of fronts. The Patriot Act contains sweeping anti-money laundering and financial transparency laws which require various regulations, including standards for verifying customer identification at account opening, and rules to promote cooperation among financial institutions, regulators, and law enforcement entities in identifying parties that may be involved in terrorism or money laundering. The Patriot Act requires financial institutions to adopt policies and procedures to combat money laundering, and it grants the Secretary of the Treasury broad authority to establish regulations and impose requirements and restrictions on financial institutions’ operations.
Community Reinvestment Act
We are subject to the provisions of the Community Reinvestment Act of 1977, which requires financial institutions to meet the credit needs of their local communities, including low and moderate income communities. In accordance with the Community Reinvestment Act, the FDIC periodically assesses our record of meeting the credit needs of our local communities by assigning one of the following ratings to our performance in that regard:
| • | outstanding; |
| • | satisfactory; |
| • | needs to improve; or |
| • | substantial noncompliance. |
In addition, the FDIC will strongly consider our performance under the Community Reinvestment Act as a factor upon any application by us for any of the following:
| • | the establishment of a branch; |
| • | the relocation of a main office or branch; and |
2
Table of Contents
| • | the merger or consolidation with or the acquisition of assets or assumption of liabilities of an insured depository institution. |
Capital Requirements
We must comply with the capital requirements imposed by the FDIC. Under the FDIC’s regulations, state-chartered, nonmember banks that receive the highest rating during the examination process have the following characteristics:
| • | no anticipated or significant current growth; |
| • | well-diversified risk (including no undue interest rate risk exposure), excellent asset quality, high liquidity and good earnings; and |
| • | in general, are considered strong banking organizations. |
The FDIC requires banks to maintain a minimum leverage ratio of 3% of Tier 1 capital, which is common stockholders’ equity less intangible assets, identified losses and other adjustments, to average total consolidated assets. The FDIC can require banks to maintain a ratio of 100 to 200 basis points above the stated minimum, and has generally set a minimum leverage ratio of not less than 4% for most banks.
To provide measurement of capital adequacy that is more sensitive to the individual risk profiles of financial institutions, the FDIC’s risk-based capital regulations provide that, in addition to maintaining their required leverage ratio, banks are expected to maintain a level of capital commensurate with risk profiles assigned to their assets. The regulations generally require a minimum ratio of Tier 1 capital to risk-weighted assets of 4%, and a minimum ratio of total capital to risk-weighted assets of 8%, of which at least one-half must be in the form of Tier 1 capital.
Dividends
The payment of any cash dividend is subject to the Bank’s board of directors’ evaluation of its operating results, financial condition, future growth plans, general business conditions, and to tax and other relevant considerations and regulatory limitations, including our minimum capital requirements. The Bank might not declare and pay any cash dividends, and if it were to do so, it might not continue to declare them or maintain them at the same level. As North State Bancorp owns all of the stock of North State Bank, any dividend declared would be paid to it.
In addition, statutory and regulatory restrictions apply to the payment of cash dividends on our common stock. Under North Carolina law applicable to banks, our directors may declare a cash dividend in an amount equal to our undivided profits, as they deem appropriate, subject to the limitation that the Bank’s capital surplus is at least 50% of its paid-in capital. Cash dividends may only be paid out of retained earnings. We cannot pay a cash dividend at any time that we are “undercapitalized” or insolvent, or when payment of the dividend would render us insolvent. Also, a FDIC-insured bank cannot pay a cash dividend while it is in default on any assessment due the FDIC.
Insurance Assessments
The FDIC insures our customers’ deposits. Under the Federal Deposit Insurance Reform Act of 2005, as amended (the “Reform Act”), the FDIC uses a risk-based assessment system to determine the amount of a bank’s deposit insurance assessment based on an evaluation of the probability that the deposit insurance fund will incur a loss with respect to that bank. The evaluation considers risks attributable to different categories and concentrations of the bank’s assets and liabilities and other factors the FDIC considers to be relevant, including information obtained from the bank’s federal and state banking regulators. The FDIC is responsible for maintaining the adequacy of the deposit insurance fund, and the amount paid by a bank for deposit insurance is influenced not only by the assessment of the risk it poses to the deposit insurance fund, but also by the adequacy of the insurance fund to cover the risk posed by all insured institutions.
The FDIC amended its risk-based assessment system for 2007 to implement authority granted by the Reform Act. Under the revised system, insured institutions are assigned to one of four risk categories based on supervisory evaluations, regulatory capital levels and certain other factors. An institution’s assessment rate depends upon the category to which it is assigned. Risk Category I is the lowest risk category while Risk Category IV is the highest risk category. For 2009 and 2010, the Bank qualified for Risk Category I. For banks under $10 billion in total assets in Risk Category I, the 2009 and 2010 deposit assessment ranged from five to seven basis points of total qualified deposits. The actual assessment is dependent upon certain risk measures as defined in the final rule.
3
Table of Contents
In an effort to restore capitalization levels and to ensure the Deposit Insurance Fund will adequately cover projected losses from future bank failures, the FDIC, in late 2008, adopted a rule that alters the way in which it differentiates for risk in the risk-based assessment system and to revise deposit insurance assessment rates, including base assessment rates. For the first quarter of 2009 only, the FDIC increased all FDIC deposit assessment rates by seven basis points. These new rates range from 12 to 14 basis points for Risk Category I institutions to 50 basis points for Risk Category IV institutions. Under the FDIC’s restoration plan, the FDIC established new initial base assessment rates that are subject to adjustment as described below. Beginning April 1, 2009, the base assessment rates range from 12 to 14 basis points for Risk Category I institutions to 45 basis points for Category IV institutions. Changes in the risk-based assessment system include increasing premiums for institutions that rely on excessive amounts of brokered deposits, including CDARS, increasing premiums for excessive use of secured liabilities, including Federal Home Loan Bank advances, and lowering premiums for smaller institutions with very high capital levels.
In May 2009, the FDIC passed amendments to the restoration plan for the Deposit Insurance Fund. The amendment imposed a 20 basis point emergency special assessment on insured depository institutions as of June 30, 2009. The assessment was collected on September 30, 2009. On March 17, 2009, the FDIC adopted changes to the Temporary Liquidity Guarantee Program or TLGP which may provide for reduction of the emergency special assessment by up to four basis points. An interim rule proposed on February 27, 2009 would also permit the FDIC to impose an emergency special assessment after June 30, 2009, of up to 10 basis points if necessary to maintain public confidence in federal deposit insurance.
In late 2009, the Board of Directors of the FDIC adopted a rule to require insured institutions to prepay their estimated quarterly risk-based insurance deposit premiums for the fourth quarter of 2009 and for all of 2010, 2011 and 2012. The assessment rate was based on the third quarter of 2009 and assumed a 5% annual growth rate in deposits each year with a three-basis point increase in assessment rates effective on January 1, 2011. The entire assessment is accounted for as a prepaid expense on our consolidated balance sheet, as of December 30, 2009. For each quarter in 2010, we have expensed the portion of the prepaid expense applicable for each quarter and will continue to charge as an expense to our earnings the portion of the applicable prepaid expense for each quarter of 2011 and 2012. The results of the special assessment and increased regular assessments will continue to have a significant impact on our results of operations for 2011 and in the future.
The Dodd-Frank Wall Street Reform and Consumer Protection Act, passed in July 2010, also imposes additional assessments and costs with respect to deposits, requiring the FDIC to impose deposit insurance assessments based on total assets rather than total deposits. Based on rules passed pursuant to the Dodd-Frank Act, which rules become effective in April, 2011, the FDIC revised the deposit insurance assessment system to base assessments on the average total consolidated assets of the institution, rather than upon deposits payable in the U.S. as was previously the case. The FDIC also adopted a comprehensive, long-range “restoration” plan for the deposit insurance fund to ensure that the ratio of the fund’s reserves to insured deposits reaches 1.35 percent by 2020, as required by the Dodd-Frank Act. Based upon updated projections for the fund, the new restoration plan would forgo the uniform 3 basis point assessment rate increase previously scheduled to go into effect on January 1, 2011, and would keep the current rate schedule in effect. The FDIC’s rule also envisions eventually building the fund’s reserve ratio to 2.0 percent. Base assessment rates would adjust downward over time as the fund reached specified reserve levels. At this time, the ultimate effect of these legislative and regulatory developments, including the new assessment rules, cannot be predicted with any certainty.
See additional discussion in Item 7 “Management’s Discussion and Analysis of Financial Condition and Results of Operations.” FDIC insurance assessments could be further increased in the future if the FDIC finds it necessary to adequately maintain the Deposit Insurance Fund.
Insurance of an institution’s deposits may be terminated by the FDIC upon a finding that the institution has engaged in unsafe or unsound practices, is in an unsafe or unsound condition to continue operations or has violated any applicable law, regulation, rule, order or condition imposed by the FDIC. Management of the Bank does not know of any practice, condition or violation that might lead to termination of the Bank’s deposit insurance.
Interstate Banking and Branching
Subject to state law, federal law permits adequately capitalized and managed bank holding companies to acquire control of a bank in any state. In addition, federal law permits banks to merge with banks located in other states and allows states to adopt legislation permitting out-of-state banks to open branch offices within that state’s borders. The North Carolina Reciprocal Interstate Banking Act permits banking organizations in any state with similar reciprocal legislation to acquire North Carolina banking organizations. In addition, subject to another state having similar laws, the North Carolina Interstate Branch Banking Act:
| • | permits North Carolina banks and out-of-state banks to merge; |
4
Table of Contents
| • | authorizes North Carolina banks to establish or acquire branch offices in any other state; and |
| • | permits out-of-state banks to establish or acquire branch offices in North Carolina. |
Prompt Corrective Action
The Federal Deposit Insurance Corporation Improvement Act of 1991 establishes a system of prompt corrective action to resolve the problems of undercapitalized institutions. Under this system, the federal banking regulators must rate supervised institutions on a basis of five capital categories. The federal banking regulators also must take certain mandatory supervisory actions and are authorized to take all other discretionary actions with respect to institutions in the three undercapitalized categories, the severity of which will depend upon the capital category in which the institution is placed. Generally, subject to narrow exception, the Federal Deposit Insurance Corporation Improvement Act requires the primary or appropriate banking regulator to appoint a receiver or conservator for an institution that is critically undercapitalized. The federal banking agencies have specified by regulation the relevant capital level for each category.
Under the Federal Deposit Insurance Corporation Improvement Act, the FDIC adopted regulations setting forth a five-tier scheme for measuring the capital adequacy of FDIC-insured commercial banks. Under the regulations, a bank is placed in one of the following capital categories:
| • | Well Capitalized – a bank which has a total capital ratio of at least 10%, a Tier 1 capital ratio of at least 6%, and a Tier 1 leverage ratio of at least 5%; |
| • | Adequately Capitalized – a bank which has a total capital ratio of at least 8%, a Tier 1 capital ratio of at least 4%, and a Tier 1 leverage ratio of at least 4%; |
| • | Undercapitalized – a bank that has a total capital ratio of under 8%, a Tier 1 capital ratio of under 4%, or a Tier 1 leverage ratio of under 4%; |
| • | Significantly Undercapitalized – a bank that has a total capital ratio of under 6%, a Tier 1 capital ratio of under 3%, or a Tier 1 leverage ratio of under 3%; and |
| • | Critically Undercapitalized – a bank whose tangible equity is not greater than 2% of total tangible assets. |
The regulations permit the FDIC to downgrade a bank to the next lower category if the FDIC determines after notice and opportunity for hearing or response that the bank is in an unsafe or unsound condition or that the bank has received and not corrected a less-than-satisfactory rating for any of the categories of asset quality, management, earnings, or liquidity in its most recent examination. Supervisory actions by the appropriate federal banking regulator depend upon an institution’s classification within the five categories.
The Federal Deposit Insurance Corporation Improvement Act generally prohibits a depository institution from making any capital distribution including payment of a cash dividend if the depository institution would thereafter be undercapitalized. Undercapitalized depository institutions are subject to restrictions on borrowing from the Federal Reserve System. In addition, undercapitalized depository institutions are subject to growth limitations and are required to submit capital restoration plans. If a depository institution fails to submit an acceptable plan, it is treated as if it is significantly undercapitalized.
Significantly undercapitalized depository institutions might be subject to a number of requirements and restrictions including orders to sell sufficient voting stock to become adequately capitalized, requirements to reduce total assets, and cessation of receipt of deposits from correspondent banks. Critically undercapitalized depository institutions are subject to appointment of a receiver or conservator.
Safety and Soundness Standards
The Federal Deposit Insurance Act requires the federal bank regulatory agencies to prescribe standards relating to internal controls, information systems and internal audit systems, loan documentation, credit underwriting, interest rate risk exposure, asset growth, asset quality, earnings, stock valuation, and compensation, fees and benefits, and such other operational and managerial standards as the agencies deem appropriate. The federal bank regulatory agencies have adopted a set of guidelines prescribing safety and soundness standards under the Federal Deposit Insurance Corporation Improvement Act. In general, the guidelines require appropriate systems and practices to identify and manage the risks and exposures specified in the guidelines. The guidelines prohibit excessive compensation as an unsafe and unsound practice and describe compensation as excessive when the amounts paid are
5
Table of Contents
unreasonable or disproportionate to the services performed by the executive officer, employee, director or principal shareholder. In addition, the agencies adopted regulations that authorize, but do not require, an agency to order an institution that has been given notice by an agency that is not satisfying any of such safety and soundness standards to submit a compliance plan. If, after being so notified, an institution fails to submit an acceptable compliance plan, the agency must issue an order directing action to correct the deficiency and may issue an order directing other actions of the types to which an undercapitalized institution is subject under the prompt correction action provisions of the Federal Deposit Insurance Corporation Improvement Act. If an institution fails to comply with such an order, the agency may seek to enforce such order in judicial proceedings and to impose civil money penalties.
Financial Modernization Legislation
The Gramm-Leach-Bliley Act of 1999 permits bank holding companies meeting management, capital and Community Reinvestment Act standards, and that register as a “financial holding company,” to engage in a broad range of non-banking activities, including insurance underwriting and investment banking. The Act allows insurance companies and other financial services companies to acquire banks and allows bank holding companies to acquire securities firms and mutual fund advisory companies. The Act requires appropriate safeguards if a bank holding company wishes to engage in any of these activities. The Act also contains extensive customer privacy protection provisions which require banks to adopt and implement policies and procedures for the protection of the financial privacy of their customers, including procedures that allow customers to elect that certain financial information not be disclosed to certain persons.
A bank holding company may become a financial holding company under the Gramm-Leach-Bliley Act if each of its subsidiary banks is “well capitalized” under the Federal Deposit Insurance Corporation Improvement Act prompt corrective action provisions, is well managed and has at least a satisfactory rating under the Community Reinvestment Act. In addition, the bank holding company must file a declaration with the Federal Reserve Board that the bank holding company wishes to become a financial holding company. A bank holding company that falls out of compliance with these requirements may be required to cease engaging in some of its activities. We registered as a financial holding company in September 2007 in order to invest in Beacon Title Agency, LLC, a title insurance agency, as a means to generate non-interest income. In November 2009, we sold our interest in Beacon Title Agency, LLC and terminated our financial holding company registration.
Regulation of North State Bancorp
As a bank holding company, we are subject to the supervision of, and to regular inspection by, the Board of Governors of the Federal Reserve System.
The Federal Reserve is authorized to adopt regulations affecting various aspects of bank holding companies. As a bank holding company, our activities, and those of companies which we control or in which we hold more than 5% of the voting stock, are limited to banking or managing or controlling banks or furnishing services to or performing services for our subsidiaries, or any other activity which the Federal Reserve determines to be so closely related to banking or managing or controlling banks as to be a proper incident thereto. In making such determinations, the Federal Reserve is required to consider whether the performance of such activities by a bank holding company or its subsidiaries can reasonably be expected to produce benefits to the public such as greater convenience, increased competition or gains in efficiency that outweigh possible adverse effects, such as undue concentration of resources, decreased or unfair competition, conflicts of interest or unsound banking practices.
Generally, bank holding companies are required to obtain prior approval of the Federal Reserve to engage in any new activity not previously approved by the Federal Reserve or acquire more than 5% of any class of voting stock of any company. Bank holding companies also must obtain the prior approval of the Federal Reserve before acquiring more than 5% of any class of voting stock of any bank that is not already majority-owned by the bank holding company. Similarly, an entity seeking to acquire more than 5% of the voting securities of a bank holding company such as our company must first receive Federal Reserve approval.
Bank holding companies are required to give the Federal Reserve Board prior written notice of any purchase or redemption of outstanding equity securities if the gross consideration for the purchase or redemption, when combined with the net consideration paid for all such purchases or redemptions during the preceding 12 months, is equal to 10% or more of the holding company’s consolidated net worth. The Federal Reserve Board may disapprove such a purchase or redemption if it determines that the proposal would constitute an unsafe and unsound practice, or would violate any law, regulation, Federal Reserve Board order or directive, or any condition imposed by, or written agreement with, the Federal Reserve Board. Such notice and approval is not required for a bank holding company that would be treated as “well capitalized” under applicable regulations of the Federal Reserve Board, that has received a composite “1” or “2” rating at its most recent bank holding company inspection by the Federal Reserve Board, and that is not the subject of any unresolved supervisory issues.
6
Table of Contents
Bank holding companies are required to serve as a source of financial strength for their depository institution subsidiaries, and, if their depository institution subsidiaries become undercapitalized, bank holding companies may be required to guarantee the subsidiaries’ compliance with capital restoration plans filed with their bank regulators, subject to certain limits.
Bank holding companies must meet minimum capital requirements imposed by the Federal Reserve. These capital requirements are the same as those for banks imposed by the FDIC.
Dividends
As a bank holding company that does not, as an entity, currently engage in separate business activities of a material nature, our ability to pay cash dividends depends upon the cash dividends we receive from our subsidiary, North State Bank. At present, our only sources of income are cash dividends paid by the Bank. We must pay all of our operating expenses from funds we receive from the Bank. Therefore, shareholders may receive cash dividends from us only to the extent that funds are available after payment of our operating expenses and only in the event that the board decides to declare a dividend. In addition, the Federal Reserve Board generally prohibits bank holding companies from paying cash dividends except out of operating earnings where the prospective rate of earnings retention appears consistent with the bank holding company’s capital needs, asset quality and overall financial condition. To date, we have retained our earnings for use in the development of our business. As a relatively young bank holding company that expects to continue to expand its operations in Wake County, and other markets in North Carolina, we might or might not pay cash dividends on our common stock in the foreseeable future. We might not declare and pay any cash dividends, and if we were to do so, we might not continue to declare them or maintain them at the same level. We expect that, for the foreseeable future, any cash dividends paid by the Bank to us will likely be limited to amounts needed to pay any separate expenses or to make required payments on our debt obligations, including the interest payments on our junior subordinated debt.
Recent Legislation
On July 21, 2010, the Dodd-Frank Wall Street Reform and Consumer Protection Act, or the Dodd-Frank Act, was signed into law. The Dodd-Frank Act implements far-reaching regulatory reform. Some of the more significant implications of the Dodd-Frank Act are summarized below:
| • | Established centralized responsibility for consumer financial protection by creating a new agency, the Consumer Financial Protection Bureau, responsible for implementing, examining and enforcing compliance with federal consumer financial laws; |
| • | Established the same leverage and risk-based capital requirements that apply to insured depository institutions to most bank holding companies; |
| • | Required financial holding companies to be well-capitalized and well managed as of July 21, 2011; bank holding companies and banks must also be both well-capitalized and well managed in order to acquire banks located outside their home state; |
| • | Disallowed the ability of holding companies with more than $15 billion in assets to include trust preferred securities as Tier 1 capital; this provision will be applied over a three-year period beginning January 1, 2013; |
| • | Changed the assessment base for federal deposit insurance from the amount of insured deposits to consolidated assets less tangible capital; |
| • | Eliminated the ceiling on the size of the Deposit Insurance Fund and increased the floor on the size of the Deposit Insurance Fund; |
| • | Required implementation of corporate governance revisions, affecting areas such as executive compensation and proxy access by shareholders; |
| • | Repealed the federal prohibition on the payment of interest on demand deposits, thereby permitting depository institutions to pay interest on business transaction and other accounts; |
| • | Amended the Electronic Fund Transfer Act to, among other things, give the Federal Reserve the authority to establish rules regarding interchange fees charged for electronic debit transactions by payment card issuers having assets over $10 billion and to enforce a new statutory requirement that such fees be reasonable and proportional to the actual cost of a transaction to the issuer; and |
| • | Increased the authority of the Federal Reserve to examine financial institutions including non-bank subsidiaries. |
Many aspects of the Dodd-Frank Act are subject to rulemaking and will take effect over several years, making it difficult to anticipate the overall financial impact to financial institutions and consumers. Provisions in the legislation that affect the payment of interest on demand deposits are likely to increase the costs associated with deposits.
7
Table of Contents
The Dodd-Frank Act instituted significant changes to the overall regulatory framework for financial institutions including our company and the Bank. Many of the specific provisions of the Act have yet to be fully implemented, and the impact on us cannot be accurately predicted until regulations are enacted. The Dodd-Frank Act will likely cause a decline in certain revenues from consumer and mortgage products that are significant to our overall financial performance, and create additional compliance costs that we will incur.
Competition
The banking laws of North Carolina allow banks located in North Carolina to develop branches throughout the state. In addition, out-of-state institutions may open branches in North Carolina as well as acquire or merge with institutions located in North Carolina. As a result of such laws, banking in North Carolina is highly competitive.
We have six full-service banking offices located in Wake County and one full-service banking office in Wilmington, New Hanover County. These counties have numerous branches and corporate headquarters of money-center, super-regional, regional and statewide institutions, some of which have a major presence in Raleigh and Wilmington. In our market areas, we face competition from other banks, savings and loan associations, savings banks, credit unions, finance companies and major retail stores that offer competing financial services. Many of these competitors have greater resources, broader geographic coverage and higher lending limits than we do. We focus our efforts on selective customer groups including professional firms, professionals, churches, property management companies, non-profits and individuals who value a mutually beneficial banking relationship. We believe our efforts in attracting and keeping relationships with our chosen customers, helps to provide us with a competitive advantage. As of June 30, 2010, we held 2.86% and 1.29%, respectively, of deposits at bank offices in Wake and New Hanover County.
Employees
As of December 31, 2010, we had 118 full-time equivalent employees. We believe that our future success will depend in part on our continued ability to attract, hire, and retain qualified personnel. None of our employees are represented by a labor union. We have not experienced any work stoppages and consider our relations with our employees to be good.
Available Information
Our web site address is www.northstatebank.com. Information on our web site is not incorporated by reference herein. We make available free of charge through our web site our annual report on Form 10-K, quarterly reports on Form 10-Q, current reports on Form 8-K, and all amendments to those reports as soon as reasonably practicable after such material is electronically filed with or furnished to the Securities and Exchange Commission, or SEC.
| Item 1A. | Risk Factors |
Ownership of shares of our securities involves certain risks. Holders of our securities and prospective investors in our securities should carefully consider the following risk factors and uncertainties described below together with all of the other information included and incorporated by reference in this report in evaluating an investment in our securities. If any of the risks and uncertainties discussed below actually occurs, our business, financial condition and results of operations could be materially adversely affected. In addition, other risks and uncertainties of which we are not currently aware, including those relating to the banking and financial services industries in general, or which we do not now believe are material, may cause earnings to be lower, or impair our future financial condition or results of operations. The value or market price of our common stock or any of our other securities could decline due to any of these identified or other risks, and you could lose all or part of your investment.
Risks Related to Our Business
Our Business May Be Adversely Affected by Conditions in the Financial Markets and Economic Conditions Generally.
The United States is still suffering the effects of the prolonged recession that began in 2007 and was officially declared over in June 2009. However, all indications show signs of a very slow recovery if not arguably the possibility of an ongoing recession. Business activity across a wide range of industries and regions remains greatly reduced compared to pre-2007 recession standards. Although there have been recent indications of increased consumer activity, local governments and many businesses are continuing to experience serious financial difficulty due to lower levels of consumer spending and the continued lack of liquidity in the credit markets. Unemployment has only declined slightly, remaining significantly higher than pre-recession levels with indications of continued high levels over the next several years. Since mid-2007 the financial services industry and the securities markets generally have been, and continue to be materially and adversely affected by significant declines in the values of nearly all asset classes and by a serious lack of liquidity and a lack of financing for many investors.
8
Table of Contents
Market conditions have also led to the failure or merger of a number of prominent financial institutions. In addition, declining asset values, defaults on mortgages and consumer loans, and the lack of market and investor confidence, as well as other factors, have all combined to cause rating agencies to lower credit ratings, and to otherwise increase the cost and decrease the availability of liquidity, despite very significant declines in Federal Reserve borrowing rates and other government actions.
Some banks and other lenders have suffered significant losses and have become reluctant to lend, even on a secured basis, due to the increased risk of default and the impact of reduced or declining asset values on the value of collateral. The foregoing has significantly weakened the strength and liquidity of some financial institutions. Since September 2008, the U.S. government, the Federal Reserve and other regulators have taken numerous steps to increase liquidity and to restore investor confidence, including significant investment in the equity of other banking organizations, but asset values generally have either continued to decline or remain low and access to liquidity continues to be very limited.
Our financial performance generally, and in particular the ability of our borrowers to pay interest on and repay principal of outstanding loans and the value of collateral securing those loans, is highly dependent upon the business environment in the markets where we operate in Wake and New Hanover counties, in North Carolina and in the United States as a whole.
Overall, during 2010, the business environment has continued to be adverse for many households and businesses in the United States. The business environment in North Carolina and the markets in which we operate has been less adverse than in the United States generally but remains weak and could deteriorate further. It is expected that the business environment in North Carolina and the United States will continue to be sluggish for the foreseeable future. There can be no assurance that these conditions will greatly improve in the near term. Such conditions could adversely affect the credit quality of our loans, the value of our investment securities, and our overall results of operations and financial condition.
The FDIC Deposit Insurance assessments that we are required to pay will increase, possibly materially, in the future, which would have an adverse affect on our earnings.
As a member institution of the FDIC, we are required to pay quarterly deposit insurance premium assessments to the FDIC. During the year ended December 31, 2010, we expensed $1.3 million in deposit insurance assessments and we paid $1.8 million in 2009. Due to the turmoil in 2008, 2009 and to a lesser extent in 2010 in the financial system, including the failure of several unaffiliated FDIC-insured depository institutions, the deposit insurance premium assessments paid by all banks have increased. Prior to 2009, banks paid anywhere from five basis points to 43 basis points for deposit insurance. The FDIC increased the assessment rate schedule by seven basis points (annualized) beginning on January 1, 2009. In May 2009, the FDIC passed amendments to the restoration plan for the Deposit Insurance Fund. This amendment imposed a five basis point emergency special assessment on insured depository institutions as of June 30, 2009. The assessment was collected on September 30, 2009. On March 17, 2009, the FDIC adopted changes to the Temporary Liquidity Guarantee Program, or TLGP, which may provide the possibility for reduction in the emergency special assessment by up to four basis points. An interim rule proposed on February 27, 2009 would also permit the FDIC to impose an emergency special assessment after June 30, 2009, of up to 10 basis points if necessary to maintain public confidence in federal deposit insurance. The FDIC also required insured institutions to prepay on December 30, 2009 their estimated quarterly risk-based insurance deposit premiums for the fourth quarter of 2009 and for all of 2010, 2011 and 2012. The assessment rate was based on the third quarter of 2009 and assumed a 5% annual growth rate in deposits each year with a three-basis point increase in assessment rates effective on January 1, 2011. The entire assessment is accounted for as a prepaid expense on our balance sheet, as of December 30, 2009. For each quarter in 2010, we have expensed the portion of the prepaid expense applicable for each quarter and will continue to charge as an expense to our earnings the portion of the applicable prepaid expense for each quarter of 2011 and 2012. The results of the special assessment and increased regular assessments will continue to have a significant impact on our results of operations for 2011 and in the future. Additional or increased assessments in the future also would impact our results of operations, perhaps significantly depending on the assessment.
The effects of the U.S. government’s plans to stabilize the financial system and the economy are unknown at this time.
In response to the 2008 – 2009 financial crisis affecting the financial markets and the banking system, the U.S. Congress on October 3, 2008 adopted the Emergency Economic Stabilization Act of 2008, or EESA, which established the Troubled Asset Relief Program, or TARP. Pursuant to the EESA, the Treasury was initially authorized to use $350 billion for the TARP. Of this amount, Treasury allocated $250 billion to the TARP Capital Purchase Program, or CPP. On January 15, 2009, the second $350 billion of TARP was released to the Treasury. The Secretary of the Treasury’s authority under TARP, which originally was set to expire on December 31, 2009, was extended to October 3, 2010. On February 17, 2009, the American Recovery and Reinvestment Act of 2009, or ARRA, was enacted as a sweeping economic recovery package intended to stimulate the economy and provide for extensive
9
Table of Contents
infrastructure, energy, health, and education needs. There can be no assurance as to the actual impact that EESA or its programs, including the CPP, and ARRA or its programs, will have on the national economy or financial markets. The failure of these significant legislative measures to help stabilize the financial markets and a continuation or worsening of current financial market conditions could materially and adversely affect our financial condition and results of operation.
Our profitability depends significantly on economic conditions in our market areas.
Our success depends to a large degree on the general economic conditions in Wake and New Hanover counties and adjoining markets. As of December 31, 2010, approximately 90.7% of our total loan portfolio was secured by real estate located in Wake and New Hanover Counties. The local economic conditions in these areas have a significant impact on the amount of loans that we make to our borrowers, the ability of our borrowers to repay these loans and the value of the collateral securing these loans. The recession affecting the nation as a whole began to affect North Carolina in the latter half of 2008. If the value of real estate in our market areas were to decline materially, a significant portion of our loan portfolio could become under collateralized despite our underwriting efforts to minimize risk, which could have a material adverse effect on us. A significant decline in general economic condition caused by the recession, unemployment and other factors beyond our control could impact our market areas, perhaps significantly, and could negatively affect our financial condition and performance. As an example, we increased our provision for loan losses in 2010 by $2.4 million, an increase of 41.8% over 2009. In addition, we charged off, net of recoveries, an aggregate of $6.7 million in loans in 2010, an increase of 92.3% from the aggregate amount charged off in 2009.
Our loan loss reserves may be insufficient.
We attempt to maintain an appropriate allowance for loan losses to provide for probable losses in our loan portfolio. We periodically determine the amount of the allowance based on consideration of several factors, including:
| • | Historical loss rates through internal historical data; |
| • | Evaluation of general economic factors such as unemployment, inflation and interest rate environment; |
| • | Regulatory examination results and asset quality rating; |
| • | Regular reviews of loan delinquencies and overall loan portfolio quality; and |
| • | The levels of construction, development and non-owner occupied commercial real estate lending, the amount and quality of collateral, including guarantees, securing those loans and the levels of highly leveraged transactions. |
There is no precise method of predicting credit losses, however, since any estimate of loan losses is necessarily subjective and the accuracy depends on the outcome of future events. Because a portion of our loan portfolio is relatively new due to rapid loan growth during the years 2006 through 2008, the current level of delinquencies and defaults may continue or increase in the future. If the economy continues to deteriorate, our borrowers could be negatively impacted which could result in higher charge-offs which could require us to increase our allowance for loan losses.
We make and hold in our loan portfolio a significant number of commercial real estate loans, including construction and development loans, which pose more credit and regulatory risk than other types of loans typically made by financial institutions.
At December 31, 2010, commercial real estate loans, including construction and development loans, comprised approximately 58.8% of our loan portfolio. The amount of commercial construction and development loans in our portfolio approximately doubled between 2007 and 2009, however, by the end of 2010 these loans had returned to near 2007 levels as we returned to our historic niche lending to our chosen customer groups with relationship deposit accounts while minimizing builder/developer lending activities. Real estate values are generally affected by changes in economic conditions, fluctuations in interest rates, the availability of loans to potential purchasers, changes in tax and other laws and acts of nature. Our concentration in commercial real estate exposes us to risk should the economy in our market areas continue to stagnate or further decline. Borrowers may not be able to make current payments on or repay commercial real estate loans and the value of the properties securing these loans may decline, which would reduce the security for these loans. A continuation of the stagnation or a further downturn in the real estate markets where we have loans could have a material adverse effect on our business, financial condition and results of operations. Further, banks’ concentration in commercial real estate loans have become a focal point of the federal banking regulators; our concentration in these loans subject us to adverse comment or action by our federal banking regulators, including the FDIC and the Federal Reserve.
10
Table of Contents
If we experience greater loan losses than anticipated, it would have an adverse effect on our net income.
While the risk of nonpayment of loans is inherent in banking, if we experience greater nonpayment levels than we anticipate, our earnings would be adversely impacted, which could adversely affect our overall financial condition. We cannot assure you that our monitoring procedures and policies will reduce certain lending risks or that our allowance for loan losses will be adequate to cover actual losses. In addition, as a result of the rapid growth in our loan portfolio between 2007 and 2008, loan losses may be greater than management’s estimates of the appropriate level for the allowance. Our net loan charge-offs in 2010 were $6.7 million and our provision for loan losses was $8.1 million, up 41.8% over the prior year. Loan losses can cause insolvency and failure of a financial institution. In addition, future provisions for loan losses could materially and adversely affect our profitability. Any loan losses will reduce our loan loss allowance. A reduction in our loan loss allowance may require an increase in our provision for loan losses, which would reduce our earnings.
Liquidity is essential to our business and we rely, in part, on external sources to finance a significant portion of our operations.
Liquidity is essential to our business. Our liquidity could be substantially negatively affected by our inability to attract sufficient deposits, access secured lending markets, brokered deposit markets or raise funding in the long-term or short-term capital markets. Factors that we cannot control, such as disruption of the financial markets or negative views about the financial services industry generally, could impair our ability to raise funding. In addition, our ability to raise funding could be impaired if the Federal Home Loan Bank or deposit brokers develop a negative perception of our long-term or short-term financial prospects. Such negative perceptions could be developed if we suffer a decline in the level of our business activity, regulatory authorities take significant action against us, or we discover employee misconduct or illegal activity, among other things. If we were unable to raise funds using the methods described above, we would likely need to liquidate unencumbered assets, such as our investment and loan portfolios, to meet maturing liabilities. We may be unable to sell some of our assets, or we may have to sell assets at a discount from market value, either of which could adversely affect our operations.
We may not be able to maintain and manage our growth, which may adversely affect our results of operations and financial condition and the value of our common stock.
Our strategy has been to increase the size of our company by opening new offices and pursuing business relationship opportunities within our chosen niches. We have grown rapidly since we began operations in 2000. We can provide no assurance that we will continue to be successful in increasing the volume of loans and deposits at acceptable risk levels and upon acceptable terms while managing the costs and implementation risks associated with our growth strategy. As anticipated, slower loan growth during 2010 coupled with higher loan charge-offs decreased loans by $22.3 million. We further anticipate continued slow growth in our volume of loans in 2011 as compared to our growth in previous years due to continued sluggish economic conditions and our focus on our historic customer groups. There can be no assurance that any further expansion will be profitable or that we will continue to be able to sustain our historic rate of growth, either through internal growth or through expansion in our existing markets or into new markets, or that we will be able to maintain capital sufficient to support our continued growth. If we grow too quickly, however, and are not able to control costs and maintain asset quality, rapid growth also could adversely affect our financial performance. There are considerable costs involved in opening new banking offices. New banking offices generally do not generate sufficient revenues to offset their costs until they have been in operation for at least a year or more. Also, we have no assurance these new or any future banking offices will be successful even after they are established.
Interest rate volatility could significantly harm our business.
Our results of operations may be significantly affected by the monetary and fiscal policies of the federal government and the regulatory policies of government authorities. A significant component of our earnings is our net interest income. Net interest income is the difference between income from interest-earning assets, such as loans, and the expense of interest-bearing liabilities, such as deposits and our borrowings. We may not be able to effectively manage changes in what we charge as interest on our earning assets and the expense we must pay on interest-bearing liabilities, which may significantly reduce our earnings. The Federal Reserve has made significant changes in interest rates during the last few years, and especially during 2008. The decline in market interest rates that occurred throughout 2008 and in particular in the fourth quarter of 2008 and the continued low rates in 2009 and 2010 negatively impacted our net interest income, net interest spread, net interest margin, and overall results of operations in those years. Since rates charged on loans often tend to react to market conditions faster than do rates paid on deposit accounts, these rate changes, especially decreasing rates, are expected to have a negative impact on our earnings until we can make appropriate adjustments in our deposit rates. Fluctuations in interest rates are not predicable or controllable and therefore there can be no assurances of our ability to continue to maintain a consistent positive spread between the interest earned on our earning assets and the interest paid on our interest-bearing liabilities. In addition, increases in interest rates could increase the interest we owe on our long-term debt which would have a negative effect on our results of operations.
11
Table of Contents
We rely heavily on the services of key personnel.
Larry D. Barbour, our president and chief executive officer, has substantial experience with our operations and has contributed significantly to our growth since our founding. The loss of the services of Mr. Barbour or of one or more members of our executive management team may have a material adverse effect on our operations. If Mr. Barbour or other members of our executive management team were no longer employed by us, our ability to implement our growth strategy could be impaired.
Our ability to retain and attract qualified employees is critical to the success of our business and the failure to do so may materially adversely affect our performance.
Our people are our most important resource and competition for qualified employees is intense. We may expand our banking network over the next several years, not just in our existing core market areas, but also in other community markets throughout central and eastern North Carolina and other contiguous markets. To expand into new markets successfully, we must identify and retain experienced key management members with local expertise and relationships in these markets. In order to attract and retain qualified employees, we must compensate such employees at market levels. Those levels have caused employee compensation to be our greatest noninterest expense as compensation is highly variable and moves with performance. If we are unable to continue to attract and retain qualified employees, or if compensation costs required to attract and retain employees become more expensive, our performance, including our competitive position, could be materially adversely affected.
We are subject to operational risk and an operational failure could materially adversely affect our businesses.
Operational risk refers to the risk of loss arising from inadequate or failed internal processes, people and/or systems. Operational risk also refers to the risk that external events, such as external changes (e.g., natural disasters, terrorist attacks and/or health epidemics), failures or frauds, will result in losses to our businesses.
Our business is highly dependent on our ability to process, on a daily basis, a large number of transactions and the transactions we process have become increasingly complex. We perform the functions required to operate our business either by ourselves or through agreements with third parties. We rely on the ability of our employees, our internal systems and systems at technology centers operated by third parties to process high numbers of transactions. In the event of a breakdown or improper operation of our own or our third-party’s systems or improper action by third parties or employees, we could suffer financial loss, impairment to our liquidity, a disruption of our businesses, regulatory sanctions and damage to our reputation.
In order to be profitable, we must compete successfully with other financial institutions which have greater resources and capabilities than we do.
The banking business in North Carolina in general and in Wake and New Hanover Counties in particular, in which we operate, is extremely competitive. Most of our competitors are larger and have greater resources than we do and have been in existence a longer period of time. We will have to overcome historical bank-customer relationships to attract customers away from our competition. We compete with other commercial banks, savings banks, thrifts, credit unions and securities brokerage firms.
Some of our competitors are not regulated as extensively as we are and, therefore, may have greater flexibility in competing for business. Some of these competitors are subject to similar regulation but have the advantages of larger established customer bases, higher lending limits, extensive branch networks, numerous automated teller machines, greater advertising-marketing budgets or other factors.
Our legal lending limit is determined by law and is based on our capital levels. The size of the loans that we offer to our customers may be less than the size of the loans that larger competitors are able to offer. This limit may affect our success in establishing relationships with the larger businesses in our markets.
12
Table of Contents
We are subject to extensive regulation that could limit or restrict our activities.
We operate in a highly regulated industry and are subject to examination, supervision, and comprehensive regulation by the North Carolina Office of the Commissioner of Banks, the FDIC, and the Federal Reserve Board. Our compliance with these regulations is costly and restricts certain of our current and possible future activities, including, investments, loans and interest rates charged, interest rates paid on deposits, locations of offices, payment of cash dividends, and mergers and acquisitions. We must also meet regulatory capital requirements. If we fail to meet these capital and other regulatory requirements, our financial condition, liquidity, and results of operations would be materially and adversely affected. Our failure to remain “well capitalized” and “well managed” for regulatory purposes could affect customer confidence, our ability to grow, the cost of our funds and FDIC insurance, our ability, should we decide, to pay cash dividends on our common stock, and our ability to make acquisitions. Further, a “critically undercapitalized” institution (even if it has a positive net worth) may not, beginning 60 days after becoming “critically undercapitalized,” make any payment of principal or interest on subordinated debt (subject to certain limited exceptions). Accordingly, if we were to become “critically undercapitalized,” we would generally be prohibited from making payments on the subordinated notes we issued in May and July 2008. In addition, “critically undercapitalized” institutions are subject to the appointment of a receiver or conservator with specified time frames. The regulators have discretion to impose additional restrictions on undercapitalized, significantly undercapitalized and critically undercapitalized institutions which could restrict our operations and our ability to make payments on our subordinated notes were we to fall under any undercapitalized category.
The Dodd-Frank Act will add to our compliance obligations and increase our cost of compliance, as well as likely adversely impact our revenues from consumer and mortgage products and could possibly adversely impact other parts of our business, financial condition and results of operations. Many provisions of the Act are subject to rulemaking and will take effect over several years, making it difficult for us to anticipate the overall financial impact on our business.
The laws and regulations applicable to the banking industry could change at any time, and we cannot predict the effects of these changes on our business and profitability. For example, new legislation or regulation could limit the manner in which we may conduct our business, including our ability to obtain financing, attract deposits, and make loans. Many of these regulations are intended to protect depositors, the public, and the FDIC, not shareholders. In addition, the burden imposed by these regulations may place us at a competitive disadvantage compared to competitors who are larger or who are less regulated. The laws, regulations, interpretations, and enforcement policies that apply to us have been subject to significant change in recent years, sometimes retroactively applied, and may change significantly in the future, including as part of the EESA. Any future legislation or regulation enacted into law could significantly alter the current regulatory scheme. Our cost of compliance with new legislation or regulation could adversely affect our ability to operate profitably.
Our growth or any future losses may require us to raise additional capital that may not be available when it is needed, or at all.
We are required by regulatory authorities to maintain adequate levels of capital to support our operations. We anticipate that our capital resources will satisfy our capital requirements for the foreseeable future. We may at some point, however, need to raise additional capital to support our continued growth, to offset operating losses, if any, or in response to regulatory changes. Our ability to raise additional capital, if needed, will depend in part on conditions in the capital markets at that time, which are outside our control, and on our financial performance. Accordingly, we may be unable to raise additional capital, if and when needed, on terms acceptable to us, or at all. If we cannot raise additional capital when needed, our ability to further expand our operations through internal growth and acquisitions could be materially impaired. In addition, if we issue additional equity capital, the interests of existing shareholders would be diluted.
Declines in value in investment securities held by us could require write-downs, which would reduce our earnings.
The securities in our investment portfolio primarily consist of U.S. Government securities and obligations of U.S. Government agencies as well as government-sponsored residential mortgage-backed securities, or MBSs, where mortgages are the underlying collateral. As a result of the national downturn in real estate markets and the rising mortgage delinquency and foreclosure rates, investors are increasingly concerned about these types of securities, which have negatively impacted the prices of such securities in the marketplace. The MBSs included in our investment portfolio are all agency-guaranteed with fixed rate mortgage securities underwritten and guaranteed by Freddie Mac (FHLMC) and Fannie Mae (FNMA) with Treasury funding commitment under the Treasury Senior Preferred Stock Purchase Agreement. We monitor the value of our investment portfolio regularly, including the ratings of securities in the portfolio and the dealer price quotes. Based upon these and other factors, the investment portfolio may experience impairment, which could harm our earnings and financial condition. If we were to conclude there were unrealized losses which were other than temporary, we would be required under U.S. generally accepted accounting principles, or GAAP, to reduce the carrying amount of the security to fair value and record a corresponding charge to earnings, which would also reduce our regulatory
13
Table of Contents
capital and negatively impact our capital ratios. These negative impacts could significantly impair our ability to borrow funds under credit arrangements, as well as various material depository arrangements and relationships. Temporary impairments on available for sale securities also reduce our book value per share as the changes in the value reduce shareholders’ equity. Currently, all of our available for sale securities in our investment portfolio are rated AAA by the three major rating agencies.
We are subject to security and operational risks relating to the use of our technology that could damage our reputation and business.
Security breaches in our internet banking activities could expose us to possible liability and damage our reputation. Any compromise of our security also could deter customers from using our internet banking services that involve the transmission of confidential information. We rely on standard internet security systems to provide the security and authentication necessary to effect secure transmission of data and access to bank informational systems. These precautions may not protect our systems from compromises or breaches of our security measures that could result in damage to our reputation and business. Additionally, we outsource our data processing to a third party. If our third party provider encounters difficulties or if we have difficulty in communicating with such a third party, it will significantly affect our ability to adequately process and account for customer transactions, which would significantly affect our business operations.
Volatile and illiquid financial markets resulting from a significant event in the market may hinder our ability to increase or maintain our current liquidity position.
Financial concerns in broad based financial sectors such as mortgage banking or home building may result in a volatile and illiquid bond market and may reduce or eliminate our ability to pledge certain types of assets to increase or maintain our liquidity position. A decline in our liquidity position may hinder our ability to grow the balance sheet through internally generated loan growth or otherwise.
Changes in the federal or state tax laws may negatively impact our financial performance.
We are subject to changes in tax law that could increase the effective tax rate payable to the state or federal government. These changes may be retroactive to previous periods and, as a result, could negatively affect our current and future financial performance.
Changes in accounting standards or interpretation of new or existing standards could materially affect our financial results.
From time to time the Financial Accounting Standards Board, or FASB, and the SEC change accounting regulations and reporting standards that govern the preparation of our consolidated financial statements. In addition, the FASB, the SEC, bank regulators and our outside independent auditors may revise their previous interpretations regarding existing accounting regulations and the application of these accounting standards. Revisions to these interpretations are beyond our control and may have a material impact on our results of operations.
Acts or threats of terrorism and political or military actions taken by the United States or other governments could adversely affect general economic or industry conditions.
Geopolitical conditions might affect our earnings. Acts or threats of terrorism and political or military actions taken by the United States or other governments in response to terrorism, or similar activity, could adversely affect general economic or industry conditions.
Unpredictable catastrophic events could have a material adverse effect on our operations.
The occurrence of catastrophic events such as hurricanes, earthquakes, pandemic disease, floods, other severe weather, fires or other catastrophes could adversely affect our financial condition or results of operations. Unpredictable natural and other disasters could have an adverse effect on us in that such events could materially disrupt our operations or the ability or willingness of our customers to access the financial services offered by us. The incidence and severity of catastrophes are inherently unpredictable. Although we carry insurance to mitigate our exposure to certain catastrophic events, these events could nevertheless reduce our earnings and cause volatility in our financial results for any fiscal quarter or year and have a material adverse effect on our financial condition and results of operations.
14
Table of Contents
Risks Related to Owning Our Common Stock
We have implemented anti-takeover devices that could make it more difficult for another company to acquire us, even though such an acquisition may increase shareholder value.
If we were to be acquired by another company, our shareholders may receive a premium for their shares. However, provisions in our articles of incorporation and bylaws could make it difficult for anyone to acquire us. Our articles of incorporation require a supermajority vote of two-thirds of our outstanding common stock in order to affect a sale or merger of our company that has not been approved by our board of directors. Our articles of incorporation also provide for “blank check” preferred stock, which allows our board of directors, without shareholder approval, to issue preferred shares with rights and preferences superior to those of our common stock, including superior rights on voting and to cash dividends and liquidation proceeds. In addition, our articles of incorporation permit our board to consider constituents other than our shareholders in deciding on a merger or sale of the company. These constituents are our employees, depositors, customers, creditors and the communities in which we conduct business. This provision also allows the board to consider the competence, experience and integrity of any proposed acquirer as well as the prospects of success of any merger or sale proposal. All of these provisions may make a merger or sale of our company more difficult or prevent a merger or sale altogether even if the merger or sale is supported by our shareholders and would provide them a premium for their shares.
Our bylaws divide the board of directors into three classes of directors serving staggered three-year terms with approximately one-third of the board of directors elected at each annual meeting of shareholders. The classification of directors makes it more difficult for shareholders to change the composition of the board of directors. As a result, at least two annual meetings of shareholders would be required for the shareholders to change a majority of the directors, whether or not a change in the board of directors would be beneficial and whether or not a majority of shareholders believe that such a change would be desirable. Consequently, a takeover attempt may prove difficult, and shareholders may not realize the highest possible price for their shares.
Our common stock is quoted on the Over-the-Counter Bulletin Board and is not quoted on a stock exchange, the trading volume is low and the sale of a substantial amount of our common stock in the public market could depress the price of our common stock.
Our common stock is not traded on a national stock exchange, such as the NASDAQ. It is only quoted on the Over-the-Counter Bulletin Board. Consequently, our common stock is not as liquid as most stocks traded on an exchange. In addition, the average daily trading volume of our shares as quoted on the Over-the-Counter Bulletin Board for all trading days in 2010 on which there were trades in our stock, were approximately 641 shares, which means our stock is thinly traded. Thinly traded stock can be more volatile than stock trading on an exchange. We cannot predict the extent to which an active public market for our common stock will develop or be sustained. Since mid-2008, the stock market has experienced an unprecedented level of price and volume volatility, and market prices for the stock of many companies have experienced wide price fluctuations that have not necessarily been related to their operating performance. Therefore, our shareholders may not be able to sell their shares at the volumes, prices, or times that they desire. We cannot predict the effect, if any, that future sales of our common stock in the market, or availability of shares of our common stock for sale in the market, will have on the market price of our common stock. We therefore can give no assurance that sales of substantial amounts of our common stock in the market, or the potential for large amounts of sales in the market, would not cause the price of our common stock to decline or impair our ability to raise capital through sales of our common stock.
We have never paid cash dividends and may not ever pay cash dividends.
We have never paid cash dividends on our common stock and may never do so. Consequently, any returns on an investment in our common stock in the foreseeable future will have to come from an increase in the value of the stock itself. As noted above, the lack of an active trading market for our common stock could make it difficult to sell shares of our common stock. The payment of cash dividends would be dependent on our operations, capital levels and needs and other factors.
Our securities are not FDIC insured.
None of our securities, including our common stock, is a savings or deposit account or other obligation of North State Bank, and none is insured by the FDIC or any other governmental agency and our securities are subject to investment risk, including the possible loss of principal.
15
Table of Contents
The holders of our junior subordinated debentures have rights that are senior to those of our common shareholders.
We have supported our past growth in part through the issuance of trust preferred securities from three special purpose trusts and an accompanying sale of an aggregate of $15.5 million junior subordinated debentures to these trusts. Payments of the principal and interest on the preferred securities of the trusts are conditionally guaranteed by us. Further, the accompanying junior subordinated debentures that we issued to the trusts are senior to our shares of common stock. As a result, we must make payments on the junior subordinated debentures before any cash dividends can be paid on our common stock and, in the event of our bankruptcy, dissolution or liquidation, the holder of the junior subordinated debentures must be satisfied before any distributions can be made on our common stock. We have the right to defer distributions on the junior subordinated debentures (and the related trust preferred securities) for up to five years, during which time no cash dividends may be paid on our common stock.
| Item 1B. | Unresolved Staff Comments |
None.
| Item 2. | Properties. |
Our headquarters and our main office are located in north Raleigh, North Carolina, where we occupy approximately 22,635 square feet of office space in a stand-alone building which we own. We have an operations center in north Raleigh that consists of approximately 9,773 square feet of office space under a lease extending through April 2017. Beginning in May 2008, we added another 1,756 square feet under lease in the same building. We have an office in North Hills Raleigh where we occupy approximately 12,000 square feet of office space under a lease extending through March 2015. We own an office in west Raleigh that consists of approximately 10,000 square feet, approximately 5,200 square feet of which we occupy and the remainder of which is under tenant lease. We have an office in Garner, North Carolina, where we own a building that has approximately 5,000 square feet of office space. We own an office in the Wakefield area of Raleigh, which has approximately 10,000 square feet of office space. We have an office in Wilmington where we occupy the entire first floor, approximately 9,440 square feet of office space, in a stand-alone building under lease. This lease runs through December 31, 2022. We moved our downtown Raleigh office in August 2010 where we lease 4,300 square feet of office space on the first floor. This lease runs through June 2020. We continue to lease approximately 3,700 square feet of office space in downtown Raleigh which is currently unoccupied. The rent expense on the unoccupied space is reimbursed monthly by our new landlord until the lease expires at the end of October 2011.
| Item 3. | Legal Proceedings. |
From time to time, we are party to various legal proceedings or claims, either asserted or unasserted, which arise in the ordinary course of business. Although the ultimate outcome of these matters cannot be determined until final resolution of the matter, we do not believe that the resolution of any of these matters will have a material effect upon our financial condition or results of operations in any interim or annual period.
| Item 4. | Reserved. |
PART II
| Item 5. | Market for Registrant’s Common Equity, Related Stockholder Matters and Issuer Purchases of Equity Securities. |
Stock Information
Our common stock is not traded on any exchange. Our stock is listed on the Over-the-Counter Bulletin Board under the symbol “NSBC.OB.” Set forth below for each quarter in 2010 and 2009 is information on the high and low bid and asked prices of our common stock as reported on the Over-the-Counter Bulletin Board.
16
Table of Contents
| High | Low | |||||||
| Fiscal Year Ended December 31, 2010 |
||||||||
| January 1 through March 31, 2010 |
$ | 5.00 | $ | 3.90 | ||||
| April 1 through June 30, 2010 |
4.50 | 3.50 | ||||||
| July 1 through September 30, 2010 |
4.40 | 3.58 | ||||||
| October 1 through December 31, 2010 |
4.25 | 2.75 | ||||||
| Fiscal Year Ended December 31, 2009 |
||||||||
| January 1 through March 31, 2009 |
$ | 8.00 | $ | 5.45 | ||||
| April 1 through June 30, 2009 |
6.50 | 4.75 | ||||||
| July 1 through September 30, 2009 |
7.99 | 5.10 | ||||||
| October 1 through December 31, 2009 |
6.95 | 2.76 | ||||||
As of March 17, 2011, there were approximately 538 shareholders of record. We estimate that there were approximately 1,078 beneficial owners on March 17, 2011.
Dividends
To date, we have not paid any cash dividends. Our ability to pay cash dividends is dependent on the earnings of our subsidiary, North State Bank. Pursuant to the order of the North Carolina Commissioner of Banks approving the organization of North State Bank in 2000, North State Bank could not pay cash dividends for its first three years of operation. In the future, we expect that any earnings will be used for the development of our business as we seek to expand our operations in North Carolina. Subject to these restrictions, the Board of Directors will consider the payment of cash dividends when it is deemed prudent to do so. Further, our ability to declare and pay cash dividends depends upon, among other things, restrictions imposed by the reserve and capital requirements of North Carolina and federal law, our income and fiscal condition, tax considerations, and general business conditions. Therefore, we might or might not pay cash dividends on our common stock in the foreseeable future, and it is possible we might never pay cash dividends.
On March 17, 2004, our trust subsidiary issued preferred securities in a private placement. On December 15, 2005 and on November 28, 2007, our second and third trust subsidiaries, respectively, issued preferred securities in a private placement. In each instance, we, in turn, issued $5.0 million unsecured subordinated debentures to each trust to serve as the income source for the trust’s payment of interest on its preferred securities. Pursuant to the terms of the indentures that govern our debentures, we are prohibited from paying cash dividends on our stock in the event we are in default on the terms of the debentures or the indentures.
Equity Compensation Plans
Set forth below is information on our equity compensation plans as of December 31, 2010.
| Plan Category |
Number of securities to be issued upon exercise of outstanding options, warrants and rights |
Weighted-average exercise price of outstanding options, warrants and rights |
Number of
securities remaining available for future issuance under equity compensation plans |
|||||||||
| Equity compensation plans approved by our shareholders |
140,498 | $ | 8.51 | 497,498 | ||||||||
| Equity compensation plans not approved by our shareholders |
— | — | — | |||||||||
| Total |
140,498 | $ | 8.51 | 497,498 | ||||||||
Our equity compensation plans consist of the 2000 Stock Option Plan for Employees, the 2000 Stock Option Plan for Non-Employee Directors and the 2003 Stock Plan, all of which were approved by our shareholders. The 2003 Stock Plan replaced the two prior plans. We do not have any equity compensation plans or arrangements that have not been approved by our shareholders.
17
Table of Contents
Comparison of Cumulative Total Return
The following graph compares the cumulative total shareholder return on our common stock over the five-year period ended December 31, 2010, with the cumulative total return for the same period on the Russell 2000 Index, the SNL $500M—$1B and SNL Bank Pink Banks Index. The graph assumes that at the beginning of the period indicated $100 was invested in our common stock and the stock of the companies comprising the Russell 2000 Index, the SNL $500M—$1B and SNL Bank Pink Sheets Index, and that all dividends, if any, were reinvested. Prices are based on quotations for our common stock on the Over-the-Counter Bulletin Board.
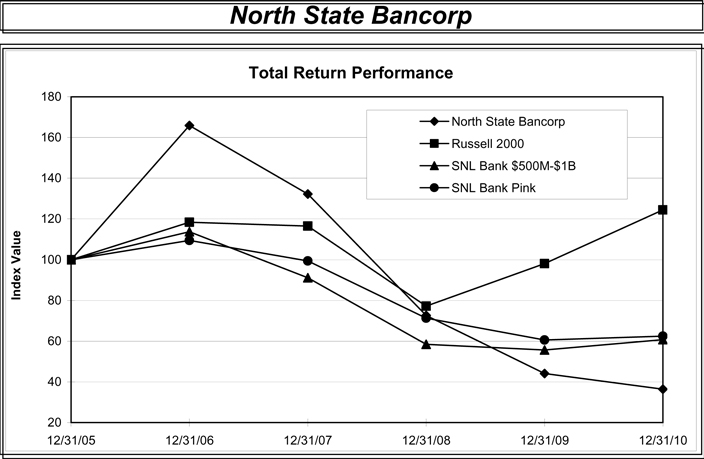
| Period Ending | ||||||||||||||||||||||||
| Index |
12/31/05 | 12/31/06 | 12/31/07 | 12/31/08 | 12/31/09 | 12/31/10 | ||||||||||||||||||
| North State Bancorp |
100.00 | 165.89 | 132.20 | 72.58 | 44.07 | 36.39 | ||||||||||||||||||
| Russell 2000 |
100.00 | 118.37 | 116.51 | 77.15 | 98.11 | 124.46 | ||||||||||||||||||
| SNL Bank $500M-$1B |
100.00 | 113.73 | 91.14 | 58.40 | 55.62 | 60.72 | ||||||||||||||||||
| SNL Bank Pink |
100.00 | 109.49 | 99.37 | 71.28 | 60.58 | 62.46 | ||||||||||||||||||
| Item 6. | Selected Financial Data. |
The following table sets forth selected consolidated financial information for our company as of and for the years ended December 31, 2010, 2009, 2008, 2007 and 2006. The data has been derived from our audited consolidated financial statements. The consolidated financial statements as of December 31, 2010 and 2009 and for the years ended December 31, 2010, 2009 and 2008 and the independent registered public accounting firm’s report thereon are included elsewhere in this report. The following should also be read in conjunction with “Management’s Discussion and Analysis of Financial Condition and Results of Operations” included in Item 7 of this report.
18
Table of Contents
| As of or for the Year Ended December 31, | ||||||||||||||||||||
| 2010 | 2009 | 2008 | 2007 | 2006 | ||||||||||||||||
| (Dollars in thousands, except per share data) | ||||||||||||||||||||
| Operating Data: |
||||||||||||||||||||
| Total interest income |
$ | 30,962 | $ | 33,440 | $ | 36,075 | $ | 32,738 | $ | 26,412 | ||||||||||
| Total interest expense |
7,488 | 11,846 | 15,817 | 15,439 | 11,587 | |||||||||||||||
| Net interest income |
23,474 | 21,594 | 20,258 | 17,299 | 14,825 | |||||||||||||||
| Provision for loan losses |
8,095 | 5,710 | 2,755 | 1,339 | 69 | |||||||||||||||
| Net interest income after provision for loan losses |
15,379 | 15,884 | 17,503 | 15,960 | 14,756 | |||||||||||||||
| Noninterest income |
4,476 | 1,168 | 1,226 | 1,121 | 1,174 | |||||||||||||||
| Noninterest expense |
18,036 | 15,137 | 14,809 | 12,033 | 10,743 | |||||||||||||||
| Income before income taxes |
1,819 | 1,915 | 3,920 | 5,048 | 5,187 | |||||||||||||||
| Provision for income taxes |
795 | 817 | 1,555 | 1,953 | 1,915 | |||||||||||||||
| Net income |
$ | 1,024 | $ | 1,098 | $ | 2,365 | $ | 3,095 | $ | 3,272 | ||||||||||
| Per Share Data: (1) |
||||||||||||||||||||
| Earnings per share - basic |
$ | 0.14 | $ | 0.15 | $ | 0.33 | $ | 0.45 | $ | 0.49 | ||||||||||
| Earnings per share - diluted |
0.14 | 0.15 | 0.32 | 0.42 | 0.46 | |||||||||||||||
| Market price: |
||||||||||||||||||||
| High |
5.00 | 8.00 | 14.35 | 21.75 | 16.66 | |||||||||||||||
| Low |
2.75 | 2.76 | 5.25 | 12.00 | 9.55 | |||||||||||||||
| Close |
3.51 | 4.25 | 7.00 | 12.75 | 16.00 | |||||||||||||||
| Tangible book value |
5.03 | 5.02 | 4.96 | 4.52 | 3.90 | |||||||||||||||
| Weighted average shares outstanding: |
||||||||||||||||||||
| Basic |
7,363,618 | 7,179,744 | 7,158,545 | 6,917,365 | 6,617,228 | |||||||||||||||
| Diluted |
7,389,397 | 7,316,292 | 7,356,364 | 7,301,377 | 7,162,121 | |||||||||||||||
| Selected Year-End Balance Sheet Data: |
||||||||||||||||||||
| Total assets |
$ | 633,865 | $ | 679,429 | $ | 687,581 | $ | 547,520 | $ | 455,477 | ||||||||||
| Loans - held for sale |
51,472 | — | — | — | — | |||||||||||||||
| Loans |
499,523 | 521,809 | 546,357 | 469,228 | 345,943 | |||||||||||||||
| Allowance for loan losses |
9,935 | 8,581 | 6,376 | 5,020 | 3,983 | |||||||||||||||
| Deposits |
562,748 | 606,888 | 612,678 | 457,310 | 402,078 | |||||||||||||||
| Short-term borrowings |
3,615 | 6,103 | 7,782 | 37,886 | 10,670 | |||||||||||||||
| Long-term debt |
27,269 | 27,290 | 27,311 | 16,332 | 11,196 | |||||||||||||||
| Shareholders’ equity |
37,502 | 36,166 | 35,546 | 31,557 | 26,597 | |||||||||||||||
| Selected Average Balances: |
||||||||||||||||||||
| Total assets |
$ | 656,006 | $ | 695,908 | $ | 594,532 | $ | 472,827 | $ | 398,097 | ||||||||||
| Loans - held for sale |
30,726 | — | — | — | — | |||||||||||||||
| Loans |
510,000 | 541,576 | 520,075 | 393,927 | 316,620 | |||||||||||||||
| Total interest-earning assets |
613,103 | 658,549 | 571,615 | 454,005 | 382,899 | |||||||||||||||
| Deposits |
582,154 | 618,242 | 512,855 | 412,125 | 349,070 | |||||||||||||||
| Short-term borrowings |
5,804 | 9,236 | 16,130 | 14,681 | 10,784 | |||||||||||||||
| Long-term debt |
27,271 | 27,291 | 26,927 | 11,666 | 11,205 | |||||||||||||||
| Total interest-bearing liabilities |
500,302 | 563,999 | 476,414 | 349,144 | 284,504 | |||||||||||||||
| Shareholders’ equity |
37,896 | 36,974 | 34,526 | 29,219 | 23,944 | |||||||||||||||
| Selected Performance Ratios: |
||||||||||||||||||||
| Return on average assets |
0.16 | % | 0.16 | % | 0.40 | % | 0.65 | % | 0.82 | % | ||||||||||
| Return on average equity |
2.70 | % | 2.97 | % | 6.85 | % | 10.59 | % | 13.67 | % | ||||||||||
| Net interest spread (4) |
3.55 | % | 2.98 | % | 2.99 | % | 2.79 | % | 2.83 | % | ||||||||||
| Net interest margin (4) |
3.83 | % | 3.28 | % | 3.54 | % | 3.81 | % | 3.87 | % | ||||||||||
| Noninterest income to total revenue |
16.01 | % | 5.13 | % | 5.71 | % | 6.09 | % | 7.34 | % | ||||||||||
| Noninterest income to average assets |
0.68 | % | 0.17 | % | 0.21 | % | 0.24 | % | 0.29 | % | ||||||||||
| Noninterest expense to average assets |
2.75 | % | 2.18 | % | 2.49 | % | 2.54 | % | 2.70 | % | ||||||||||
| Efficiency ratio |
64.53 | % | 66.50 | % | 68.83 | % | 65.33 | % | 67.15 | % | ||||||||||
| Asset Quality Ratios: |
||||||||||||||||||||
| Nonaccrual loans to period-end loans |
2.30 | % | 3.61 | % | 0.93 | % | 0.66 | % | 0.11 | % | ||||||||||
| Allowance for loan losses to period-end loans |
1.99 | % | 1.64 | % | 1.17 | % | 1.07 | % | 1.15 | % | ||||||||||
| Ratio of allowance for loan losses to nonaccrual loans |
0.86 x | 0.46 x | 1.26 x | 1.62 x | 10.03 x | |||||||||||||||
| Nonperforming assets to total assets |
2.65 | % | 3.26 | % | 1.07 | % | 0.57 | % | 0.09 | % | ||||||||||
| Net charge-offs/(recoveries) to average loans |
1.32 | % | 0.65 | % | 0.27 | % | 0.08 | % | -0.07 | % | ||||||||||
19
Table of Contents
| As of or for the Year Ended December 31, | ||||||||||||||||||||
| 2010 | 2009 | 2008 | 2007 | 2006 | ||||||||||||||||
| (Dollars in thousands, except per share data) | ||||||||||||||||||||
| Capital Ratios (2): |
||||||||||||||||||||
| Total risk-based capital |
12.99 | % | 12.64 | % | 11.99 | % | 10.32 | % | 10.21 | % | ||||||||||
| Tier 1 risk-based capital |
9.64 | % | 9.34 | % | 8.85 | % | 9.25 | % | 9.09 | % | ||||||||||
| Leverage ratio |
8.04 | % | 7.31 | % | 7.39 | % | 8.50 | % | 7.58 | % | ||||||||||
| Equity to assets ratio |
5.92 | % | 5.32 | % | 5.17 | % | 5.76 | % | 5.84 | % | ||||||||||
| Average equity to average assets |
5.78 | % | 5.31 | % | 5.81 | % | 6.18 | % | 6.01 | % | ||||||||||
| Other Data (3): |
||||||||||||||||||||
| Number of banking offices |
7 | 8 | 8 | 7 | 6 | |||||||||||||||
| Number of full time equivalent employees |
118 | 96 | 100 | 99 | 75 | |||||||||||||||
| (1) | Adjusted for the 3-for-2 stock splits in 2007 and 2006. |
| (2) | Capital ratios are for bank only. |
| (3) | Includes one loan production office for the years 2009, 2008, 2007, and 2006. |
| (4) | Excludes average nonaccrual loans in the calculation for the years 2010, 2009 and 2008. |
| Item 7. | Management’s Discussion and Analysis of Financial Condition and Results of Operations. |
Management’s Discussion and Analysis
The following discussion and analysis is presented to assist in understanding our consolidated financial condition and results of operations for the years ended December 31, 2010 and 2009. You should read this discussion and the related financial data in conjunction with the information set forth under Item 1A “Risk Factors,” and our audited consolidated financial statements and the related footnotes, which are included elsewhere in Item 8 in this report. Because we have no operations and our only significant business is the ownership of North State Bank, the following discussion concerns primarily the business of the Bank. However, for ease of reading and because the financial statements are presented on a consolidated basis, this discussion makes no distinction between our company and the Bank unless otherwise noted.
Recent Market Developments in the Banking Industry
Although recent news indicates the recession ended in June of 2009, the economy continues to experience reduced business activity as a result of the prolonged recession which began in 2007. Although there has been some stability in real estate prices in some areas, in others declines continue due to falling real estate prices on homes and commercial real estate, a continued high level of unemployment as well as continued increases in foreclosures.
Our financial performance generally, and in particular the ability of our borrowing customers to pay interest on and repay principal of outstanding loans and the value of collateral securing those loans, is highly dependent upon the business environment in the markets where we operate in Wake and New Hanover Counties, in North Carolina. Due to the state of the economy in our market areas and the resultant potential impact on our loan portfolio, we continue to closely monitor our loan portfolio, nonperforming assets and allowance for loan losses. See the discussions on “Provision for Loan Losses” and “Allowance for Loan Losses and Asset Quality.” The business environment in North Carolina and the markets in which we operate may continue to see some deterioration for the foreseeable future which could continue to adversely impact our earnings in the future.
The resulting effects of the deep and prolonged recession on the real estate market and economy could adversely affect the credit quality of our loans and our overall results of operations and financial condition in the future. Further, the U.S. government’s response to the recession and the financial crisis could significantly impact our operations, including the recent and potential imposition of new laws and regulations and regulatory assessments.
The FDIC required insured institutions to prepay on December 30, 2009 their estimated quarterly risk-based insurance deposit premiums for the fourth quarter of 2009 and for all of 2010, 2011 and 2012. The assessment rate was based on the third quarter of 2009 and assumed a 5% annual growth rate in deposits each year with a three-basis point increase in assessment rates effective on January 1, 2011. The $4.9 million assessment we paid was accounted for as a prepaid expense on our balance sheet, as of December 30, 2009. Our earnings for the year ended December 31, 2010 include the applicable portion of the prepaid expense for the period. We generally are unable to control the amount of premiums that we are required to pay for FDIC insurance. Additional bank or financial institution failures may require payment of even higher FDIC premiums than the recently increased levels. Any future changes in the calculation or assessment of FDIC insurance premiums may have a material adverse effect on our results of operations and financial condition.
20
Table of Contents
In response to the financial crisis affecting the banking system and financial markets and going concern threats to investment banks and other financial institutions, the U.S. Government adopted in the fourth quarter of 2008 the Emergency Economic Stabilization Act, or EESA, and authorized the Department of the Treasury to establish the Troubled Asset Relief Program, or TARP, to purchase equity stakes in a wide variety of banks and thrifts through TARP’s Capital Purchase Program, or CPP. After careful and complete evaluation, our Board of Directors chose not to participate in the CPP. Also, the FDIC adopted the Temporary Liquidity Guarantee Program, or TLGP, as an initiative to counter the system-wide crisis in the nation’s financial sector. We elected to participate in the TLGP, in part, through full FDIC insurance coverage of all non-interest bearing deposit transaction accounts regardless of dollar amount. The Dodd-Frank Wall Street Reform and Consumer Protection Act, enacted in August 2010, permanently sets the deposit insurance limit for banks at $250,000 which was scheduled to expire December 31, 2013. We also elected to participate in the Transaction Account Guarantee, or TAG, program which was recently extended for an additional six months through December 31, 2010 and also provides for an additional extension of the program, without further rulemaking, for a period of time not to exceed December 31, 2011. Under TAG, customers of participating insured depository institutions are provided full coverage on qualifying transaction accounts. The rule requires that interest rates on qualifying NOW accounts be reduced to .25%. On November 9, 2010 the FDIC issued a final rule implementing Section 343 of the Dodd-Frank Wall Street Reform and Consumer Protection Act. Section 343 provides unlimited deposit insurance for noninterest-bearing transaction accounts from December 31, 2010 through December 31, 2012. This rule is similar to the FDIC’s TAG program and is set to replace the TAG program once that program expires at the end of 2010. Initially Section 343 excluded low interest bearing Negotiable Order of Withdrawal, or NOW, accounts, and Interest on Lawyers Trust Account, or IOLTA. These accounts under Section 343 would be insured under the general insurance rules up to the standard maximum insurance amount of $250,000. During February 2011, Section 343 was modified to provide unlimited FDIC coverage to IOLTA accounts through December 31, 2010. We will continue to monitor and evaluate the Dodd-Frank Act and its effect on our bank and the banking industry in general.
Description of Business
We are a commercial bank holding company that was incorporated on June 5, 2002. We have one subsidiary, North State Bank, which we acquired on June 28, 2002 as part of our bank holding company reorganization. In March 2004, we established a subsidiary trust, North State Statutory Trust I, which we refer to as Trust I, to issue trust preferred securities. In December 2005, we established a second subsidiary trust, North State Statutory Trust II, which we refer to as Trust II and in November 2007 we established a third subsidiary trust, North State Statutory Trust III, which we refer to as Trust III. Our only business is the ownership and operation of North State Bank and its three subsidiary trusts.
North State Bank is a North Carolina chartered banking corporation. The Bank, which offers a full array of commercial and retail banking services, opened for business on June 1, 2000. Through the Bank, we currently operate six full-service banking offices located in Raleigh and Garner, North Carolina and one full-service banking office located in Wilmington, North Carolina. Our principal customers consist of professional firms, professionals, churches, property management companies, non-profits and individuals who value a mutually beneficial banking relationship. The Bank has a subsidiary, North State Financial Services, Inc., which offers brokerage services and wealth management. In February 2010, we acquired the operations of a Raleigh-based mortgage lender, Affiliated Mortgage, LLC, creating North State Bank Mortgage, or NSB Mortgage, as a division of the Bank for the purpose of originating and selling single-family residential first mortgages.
Financial Condition at December 31, 2010 and 2009
Overview
Total assets as of December 31, 2010 were $633.9 million, a decrease of $45.6 million or 6.7% over December 31, 2009. The decrease in assets is primarily due to a decrease in our loan portfolio. Our loan portfolio decreased $22.3 million to $499.5 million from $521.8 million as of December 31, 2009. Our loan portfolio continues to decline from 2008 levels primarily due to lower loan demand, higher levels of loan charge-offs and transfers to foreclosed assets. Other interest-earning deposits with banks and certificates of deposits invested in other insured banking institutions decreased $7.1 million and $50.0 million, respectively, from December 31, 2009. Funds from these accounts were reinvested into the loan pipeline of NSB Mortgage, our new mortgage division. Emphasis on building core deposits coupled with lower loan demand provided the opportunity to reduce non-traditional funding sources and jumbo certificates of deposit throughout the year. Overall our deposits were down $44.1 million or 7.3% to $562.7 million as of December 31, 2010, compared to total deposits of $606.9 million as of December 31, 2009 due to the elimination or decrease in nontraditional deposit funds.
We continue to utilize our Federal Reserve account for our overnight excess funds. Our interest-earning deposits with banks as of December 31, 2010 included $42.4 million in excess overnight funds in our Federal Reserve account and $1.5 million held at correspondent banks compared to $49.9 million and $1.1 million, respectively, as of December 31, 2009. Certificates of deposit with federally insured banking institutions decreased $50.0 million to $198,000 as of December 31, 2010. These certificates of deposit are fully insured by the FDIC with an average remaining maturity of less than one month as of December 31, 2010. Excess funds from our Federal Reserve account and maturing certificates of deposit were primarily re-deployed into our mortgage loan pipeline.
21
Table of Contents
Substantially all of our investments are accounted for as available for sale and are presented at their fair market value. Our available for sale investment portfolio decreased $14.2 million to $9.2 million as of December 31, 2010. As part of our investment portfolio management, we strategically sold $21.0 million of our U.S. Treasury notes and Government-sponsored residential mortgage-backed securities for gains of $741,000 during 2010. Maturities were $17.1 million during the year. Proceeds from these sales and maturities were in part utilized by our mortgage loan pipeline as well as for new purchases of U.S. Treasury notes and Government-sponsored residential mortgage-backed securities. We own $250,000 in corporate bonds that are accounted for as held to maturity and are carried at book value.
Our portfolio loans decreased to $499.5 million as of December 31, 2010 compared to $521.8 million as of December 31, 2009. The decline in the loan portfolio reflects a higher level of loan payoffs over new loan volume, $6.7 million of net loan charge-offs and transfers to foreclosed assets of $9.2 million. New loan demand remains slow due to the continued effects of the recession coupled with our strategic focus on lending to our targeted customer groups. Our loan portfolio continues to represent our largest earning asset component at 78.8% of total assets. With our new mortgage division, NSB Mortgage, we also originate single-family, residential first mortgage loans that have been approved for purchase by secondary investors and are sold in the secondary market. As of December 31, 2010, mortgage loans held for sale were $51.5 million.
The allowance for loan losses was $9.9 million as of December 31, 2010 compared to $8.6 million as of December 31, 2009, representing 1.99% and 1.64% of loans outstanding, respectively, at each balance sheet date. The allowance is increased by provisions charged to operations and reduced by loans charged off, net of recoveries. The level of the allowance relative to gross loans increased primarily due to higher charge-off and other risk factors applied to the loan portfolio as of December 31, 2010 over the prior year-end. We established the allowance for loan losses at a level management considers adequate to provide for probable loan losses based on our assessment of our loan portfolio as of December 31, 2010. We monitor the allowance monthly.
Our premises and equipment remained substantially unchanged from year-end 2009 at $14.8 million. Foreclosed assets increased to $5.3 million as of December 31, 2010 from $3.3 million as of December 31, 2009, reflecting $9.2 million of additional properties, sales of foreclosed properties of $6.0 million, capital expenditures on foreclosed properties of $169,000 and valuation adjustments on foreclosed properties of $1.1 million during the year ended December 31, 2010. Additional discussion regarding foreclosed assets is included in the section “Allowance for Loan Losses and Asset Quality.”
As of December 31, 2010 our deposits were $562.7 million, a decrease of $44.1 million from $606.9 million as of December 31, 2009, substantially in non-relationship deposits. Traditional core deposits grew $24.9 million providing the opportunity to eliminate in January 2010 all of the $20.1 million of wholesale brokered certificates of deposit included on our balance sheet at December 31, 2009. In addition, non-relationship, non-brokered internet deposits, which are certificates of deposit issued by means of an internet subscription service, were reduced to $5.2 million as of December 31, 2010, down $28.3 million from December 31, 2009. Our core deposit growth is a result of our efforts to seek opportunities to develop banking relationships with our targeted customer groups throughout all our markets in general and through the success of our property management division “CommunityPLUS.” As of December 31, 2010, deposits in this division represented approximately 35.6% of our total deposits, up from 24.7% of total deposits as of December 31, 1009 and 18.4% as of December 31, 2008.
Improvement in our deposit mix also resulted from our efforts to strengthen our relationship deposits. Noninterest-bearing demand deposits and low-cost interest-bearing transaction accounts increased to 20.9% and 44.5%, respectively, of total deposits as of December 31, 2010 compared to 17.3% and 38.3%, respectively, as of December 31, 2009. Simultaneously, higher costing time deposits declined to 34.6% of total deposits compared to 44.4% for the prior year period. In total, our core deposits continued to increase, up $24.9 million to $437.8 million from $412.9 million as of December 31, 2009, representing 77.8% compared to 68.0%, respectively, of our total deposits as of December 31, 2010 and December 31, 2009. As noted above, our “CommunityPLUS” division, dedicated to growing deposits specifically in the property management industry, was a key factor to our core deposit growth, increasing approximately $50.7 million to $200.4 million as of December 31, 2010 compared to $149.7 million as of December 31, 2009.
Short-term borrowings of $3.6 million as of December 31, 2010 consisted entirely of securities sold under repurchase agreements, down $2.5 million from December 31, 2009. We utilize short-term borrowings to support our balance sheet management, however our strong core deposit growth during 2010 reduced the need for this funding source. Long-term borrowings were essentially unchanged from December 31, 2009 at $27.3 million, consisting primarily of $11.0 million of subordinated notes and $15.5 million in junior subordinated debentures.
Total shareholders’ equity increased $1.3 million to $37.5 million as of December 31, 2010. The increase was primarily provided by net income of $1.0 million and the conversion of 229,463 stock options held by directors and employees into common stock which contributed $671,000 to our total shareholders’ equity. Other comprehensive income components decreased shareholders’ equity as of December 31, 2010 by $459,000.
22
Table of Contents
Investments
Our investment portfolio primarily consists of U.S. Treasury notes and U.S. Government agency securities, including residential mortgage-backed securities, or MBSs. The MBSs consist of fixed-rate mortgage securities underwritten and guaranteed by Freddie Mac (FHLMC) and Fannie Mae (FNMA) with Treasury funding commitment under the EESA. Currently, all of our available for sale securities in our investment portfolio are rated AAA by the three major rating agencies. We continue to have no holdings in Fannie Mae or Freddie Mac preferred stock and no holdings in non-agency mortgage-backed securities. Most all of the securities held in our investment portfolio are available for sale. In addition to economic and market conditions, our overall management strategy for our investment portfolio is determined by, among other factors, loan demand, deposit mix, liquidity and collateral needs, our interest rate risk position and the overall structure of our balance sheet.
Available for sale securities are reported at fair value and consist of debt instruments not classified as trading securities or as held to maturity securities. Unrealized holding gains and losses on available for sale securities are reported, net of related tax effect, in other comprehensive income. Gains and losses on the sale of available for sale securities are determined using the specific-identification method. Premiums and discounts are recognized in interest income using the interest method over the period to maturity. During 2010 we strategically sold $21.0 million of our U.S. Treasury notes and Government-sponsored residential mortgage-backed securities for gains of $741,000 during 2010. Maturities were $17.1 million during the year. Proceeds from these sales and maturities were in part utilized by our mortgage loan pipeline as well as for $24.0 million in new purchases of U.S. Treasury notes and Government-sponsored residential mortgage-backed securities. As of December 31, 2010 we own $250,000 in corporate bonds that are accounted for as held to maturity and are carried at book value. During 2008, the Bank purchased $750,000 of corporate bonds accounted for as held to maturity and are carried at book value. During June 2010, $500,000 of the corporate bonds were transferred for collateral on a community reinvestment loan. Declines in the fair value of individual held to maturity and available for sale securities below their cost that are other than temporary would result in permanent write-downs of the individual securities to their fair value. If we do not intend to sell the security prior to recovery and it is more likely than not we will not be required to sell the impaired security prior to recovery, the credit loss portion of the impairment is recognized in earnings and the remaining impairment is recognized in other comprehensive income. Otherwise, the full impairment loss is recognized in earnings. The classification of securities is generally determined at the date of purchase.
The tables below present information on our investment portfolio at the dates indicated.
23
Table of Contents
| As of December 31, 2010 | ||||||||||||||||
| Amortized cost |
Gross unrealized gains |
Gross unrealized losses |
Fair value |
|||||||||||||
| (Dollars in thousands) | ||||||||||||||||
| Securities available for sale: |
||||||||||||||||
| U. S. government securities and obligations of U.S. government agencies |
$ | 5,500 | $ | — | $ | — | $ | 5,500 | ||||||||
| Government-sponsored residential mortgage-backed securities |
3,829 | 28 | 123 | 3,734 | ||||||||||||
| Total securities available for sale |
$ | 9,329 | $ | 28 | $ | 123 | $ | 9,234 | ||||||||
| Securities held to maturity: |
||||||||||||||||
| Corporate securities |
$ | 250 | $ | — | $ | 39 | 211 | |||||||||
| Total securities held to maturity |
$ | 250 | $ | — | $ | 39 | $ | 211 | ||||||||
| As of December 31, 2009 | ||||||||||||||||
| Amortized cost |
Gross unrealized gains |
Gross unrealized losses |
Fair value |
|||||||||||||
| (Dollars in thousands) | ||||||||||||||||
| Securities available for sale: |
||||||||||||||||
| Government-sponsored residential mortgage-backed securities |
$ | 22,745 | $ | 686 | $ | 33 | $ | 23,398 | ||||||||
| Total securities available for sale |
$ | 22,745 | $ | 686 | $ | 33 | $ | 23,398 | ||||||||
| Securities held to maturity: |
||||||||||||||||
| Corporate securities |
$ | 750 | $ | — | $ | 57 | 693 | |||||||||
| Total securities held to maturity |
$ | 750 | $ | — | $ | 57 | $ | 693 | ||||||||
| As of December 31, 2008 | ||||||||||||||||
| Amortized cost |
Gross unrealized gains |
Gross unrealized losses |
Fair value |
|||||||||||||
| (Dollars in thousands) | ||||||||||||||||
| Securities available for sale: |
||||||||||||||||
| U. S. government securities and obligations of U.S. government agencies |
$ | 15,271 | $ | 573 | $ | — | $ | 15,844 | ||||||||
| State and municipal securities |
1,434 | 10 | 1 | 1,443 | ||||||||||||
| Government-sponsored residential mortgage-backed securities |
18,721 | 407 | 9 | 19,119 | ||||||||||||
| Total securities available for sale |
$ | 35,426 | $ | 990 | $ | 10 | $ | 36,406 | ||||||||
| Securities held to maturity: |
||||||||||||||||
| Corporate securities |
$ | 750 | $ | — | $ | 14 | $ | 736 | ||||||||
| Total securities held to maturity |
$ | 750 | $ | — | $ | 14 | $ | 736 | ||||||||
The amortized cost, fair value and weighted average yield of securities available for sale at December 31, 2010 by contractual maturity are shown below. Expected maturities will differ from contractual maturities because borrowers may have the right to call or prepay obligations with or without call or prepayment penalties.
24
Table of Contents
| As of December 31, 2010 | ||||||||||||
| Amortized Cost |
Fair Value |
Weighted Average Yield |
||||||||||
| (Dollars in thousands) | ||||||||||||
| Securities available for sale: |
||||||||||||
| U. S. government securities and obligations of U.S. government agencies |
||||||||||||
| Due within one year |
$ | 5,500 | $ | 5,500 | 0.12 | % | ||||||
| 5,500 | 5,500 | 0.12 | % | |||||||||
| Government-sponsored residential mortgage-backed securities |
||||||||||||
| Due within one year |
195 | 200 | 4.72 | % | ||||||||
| Due after one but within five years |
440 | 458 | 4.38 | % | ||||||||
| Due after ten years |
3,194 | 3,076 | 2.70 | % | ||||||||
| 3,829 | 3,734 | 2.99 | % | |||||||||
| Total Securities available for sale: |
||||||||||||
| Due within one year |
$ | 5,695 | $ | 5,700 | 0.28 | % | ||||||
| Due after one but within five years |
440 | 458 | 4.38 | % | ||||||||
| Due after ten years |
3,194 | 3,076 | 2.70 | % | ||||||||
| $ | 9,329 | $ | 9,234 | 1.30 | % | |||||||
| Securities held to maturity: |
||||||||||||
| Corporate securities |
||||||||||||
| Due after five but within ten years |
$ | 250 | $ | 211 | 4.26 | % | ||||||
| $ | 250 | $ | 211 | 4.26 | % | |||||||
Loan Portfolio
Our loan policies and procedures establish the basic guidelines governing lending operations. Generally, the guidelines address the type of loans that we seek, target markets, underwriting and collateral requirements, terms, interest rate and yield considerations and compliance with laws and regulations. The policies are reviewed and approved at least annually by the board of directors. Responsibility for loan review, underwriting, compliance and document monitoring resides with the chief credit officer and his staff and are responsible for loan processing and approval. All loans and credit lines are subject to approval procedures and amount limitations. Depending upon the loan requested, approval may be granted by the individual commercial banker, our credit administration officers or, for the largest relationships, the loan committee of our Board of Directors. Any loan exposure in the aggregate greater than $3 million requires the approval of the loan committee. All individual loan authorities are reviewed and approved annually by the chief credit officer, chief executive officer and the loan committee.
Our current loan portfolio includes loans provided to customers outside our established groups such as builders and developers in the residential and commercial real-estate industry. We transitioned our lending strategy beginning in late 2008 back to our original objective to lend to specific customer groups that we originally defined and set out to provide unique and competitive service choosing customers such as professional firms, professionals, property management companies, non-profits, churches and individuals seeking a mutually beneficial banking relationship. Throughout 2010, loan growth continued to slow and decline due to the continued downturn in the economy and our re-focus on lending to relationship customers within our targeted customer groups. Over 90.0% of our loan portfolio is secured by real estate. Our loan portfolio consists of commercial and residential real estate loans including construction and land development, business loans and loans to individuals. Our current long-term strategy is to minimize activities in construction and land development lending in the future.
Our loan portfolio as of December 31, 2010 was $499.5 million, a decrease of $22.3 million from $521.8 million, as of December 31, 2009. Our New Hanover County market experienced a reduction of $10.4 million in loans from December 31, 2009, $4.6 million of which was due to loans charged off. Loans in this market area represent approximately 13.2% of total loans outstanding as of December 31, 2010. The prolonged effects of the recession have continued to affect market conditions in the New Hanover market and increasingly more during 2010 within the Wake County market. Both markets are still experiencing deterioration in real estate market conditions and significantly reduced business activity as a whole. The ability of our borrowers to pay interest on and repay principal of outstanding loans and the value of collateral securing those loans is highly dependent upon the business environment in the markets where we operate in Wake and New Hanover counties, in North Carolina.
25
Table of Contents
The following table is a summary of our loans outstanding by major category for the total Bank, New Hanover County and Wake County.
| December 31, 2010 | New Hanover County December 31, 2010 |
Wake County December 31, 2010 |
||||||||||||||||||||||
| Amount | % of Total Loans |
Amount | % of Total Bank Loans |
Amount | % of Total Bank Loans |
|||||||||||||||||||
| (Dollars in thousands) | ||||||||||||||||||||||||
| Real estate loans: |
||||||||||||||||||||||||
| Construction, land development and other land loans |
$ | 133,194 | 26.6 | % | $ | 27,612 | 5.5 | % | $ | 105,582 | 21.1 | % | ||||||||||||
| Farmland |
3,254 | 0.7 | % | — | — | 3,254 | 0.7 | % | ||||||||||||||||
| One to four family residential |
98,450 | 19.7 | % | 11,902 | 2.4 | % | 86,548 | 17.3 | % | |||||||||||||||
| Multifamily residential |
6,618 | 1.3 | % | 1,204 | 0.2 | % | 5,414 | 1.1 | % | |||||||||||||||
| Non-farm nonresidential |
211,732 | 42.4 | % | 19,331 | 3.9 | % | 192,401 | 38.5 | % | |||||||||||||||
| 453,248 | 90.7 | % | 60,049 | 12.0 | % | 393,199 | 78.7 | % | ||||||||||||||||
| Non-real estate loans: |
||||||||||||||||||||||||
| Commercial and industrial |
42,884 | 8.6 | % | 5,113 | 1.0 | % | 37,771 | 7.5 | % | |||||||||||||||
| Consumer and other |
3,644 | 0.7 | % | 777 | 0.2 | % | 2,867 | 0.6 | % | |||||||||||||||
| 46,528 | 9.3 | % | 5,890 | 1.2 | % | 40,638 | 8.1 | % | ||||||||||||||||
| 499,776 | 100.0 | % | 65,939 | 13.2 | % | 433,837 | 86.8 | % | ||||||||||||||||
| Unamortized net deferred loan fees |
(253 | ) | (37 | ) | (216 | ) | ||||||||||||||||||
| Total loans |
$ | 499,523 | $ | 65,902 | $ | 433,621 | ||||||||||||||||||
Commercial real-estate construction and land development loans decreased approximately $33.1 million from December 31, 2009 as construction projects were paid off or completed and moved to longer-term commercial real-estate-secured loans which increased $31.4 million over December 31, 2009. Combined, commercial real-estate remains the largest component of our loan portfolio comprising approximately 58.9% and 56.6%, respectively, of the loan portfolio as of December 31, 2010 and 2009. Commercial loans secured by real estate are principally secured by owner-occupied buildings including professional practices, office, and church properties; and single family rental properties, residential building lots, commercially-zoned land and residential homes. Properties securing these loans are located primarily within our markets of Wake and New Hanover County, North Carolina. During the year 2010 our variable rate loan portfolio averaged approximately 33.6% of our total average loans, up slightly from 32.3% during 2009. The prime interest rate remained at 3.25% throughout the year 2010. Our concentration in commercial real estate exposes us to more credit and regulatory risk than other types of loans.
As of December 31, 2010, real-estate-secured one-to-four family construction, residential loans and home equity lines of credit, combined, represented 29.9% of the loan portfolio at $149.5 million, down from 32.2% or $167.8 million as of December 31, 2009. These loans are typically secured by the primary residence of the borrower and the combined loan-to-value ratio is usually 90% or less. Non-real estate secured commercial and industrial loans declined minimally by $2.8 million to 8.6% from 8.7% of the loan portfolio as of December 31, 2010 and December 31, 2009, respectively. Installment and other consumer loans to individuals decreased $1.3 million from December 31, 2009 and remains at less than one percent of the loan portfolio outstanding. We do not service loans for other financial institutions. We have no foreign loans and we do not engage in lease financing or loan financing in highly leveraged transactions used for buyouts, acquisitions and recapitalizations.
Through NSB Mortgage we originate single-family, residential first mortgage loans that have been approved for purchase by secondary investors and are sold in the secondary market. As of December 31, 2010, mortgage loans held for sale were $51.5 million. Prior to February 2010, we on occasion originated and retained a small number of mortgage loans in our loan portfolio. We continue to have no exposure to subprime loans in our loan portfolio including our newly formed NSB Mortgage division which offers only traditional mortgage products underwritten to Freddie Mac guidelines.
The table below presents information on our loan portfolio by major category at the dates indicated.
26
Table of Contents
| As of December 31, | ||||||||||||||||||||||||||||||||||||||||
| 2010 | 2009 | 2008 | 2007 | 2006 | ||||||||||||||||||||||||||||||||||||
| Amount | % of Total Loans |
Amount | % of Total Loans |
Amount | % of Total Loans |
Amount | % of Total Loans |
Amount | % of Total Loans |
|||||||||||||||||||||||||||||||
| (Dollars in thousands) | ||||||||||||||||||||||||||||||||||||||||
| Real estate loans: |
||||||||||||||||||||||||||||||||||||||||
| Construction, land development and other land loans |
$ | 133,194 | 26.7 | % | $ | 174,764 | 33.5 | % | $ | 177,979 | 32.6 | % | $ | 132,254 | 28.2 | % | $ | 70,273 | 20.3 | % | ||||||||||||||||||||
| Farmland |
3,254 | 0.7 | % | 2,398 | 0.5 | % | 2,510 | 0.5 | % | 2,634 | 0.6 | % | 1,578 | 0.5 | % | |||||||||||||||||||||||||
| One to four family residential |
98,450 | 19.6 | % | 108,229 | 20.7 | % | 105,869 | 19.4 | % | 86,262 | 18.4 | % | 63,474 | 18.3 | % | |||||||||||||||||||||||||
| Multifamily residential |
6,618 | 1.3 | % | 5,713 | 1.1 | % | 5,993 | 1.1 | % | 4,753 | 1.0 | % | 7,977 | 2.3 | % | |||||||||||||||||||||||||
| Non-farm nonresidential |
211,732 | 42.4 | % | 180,284 | 34.5 | % | 190,950 | 34.8 | % | 183,951 | 39.1 | % | 149,861 | 43.3 | % | |||||||||||||||||||||||||
| 453,248 | 90.7 | % | 471,388 | 90.3 | % | 483,301 | 88.4 | % | 409,854 | 87.3 | % | 293,163 | 84.7 | % | ||||||||||||||||||||||||||
| Non-real estate loans: |
||||||||||||||||||||||||||||||||||||||||
| Commercial and industrial |
42,884 | 8.6 | % | 45,713 | 8.7 | % | 57,306 | 10.5 | % | 53,052 | 11.3 | % | 46,168 | 13.3 | % | |||||||||||||||||||||||||
| Consumer and other |
3,644 | 0.7 | % | 4,986 | 1.0 | % | 6,166 | 1.1 | % | 6,703 | 1.4 | % | 6,853 | 2.0 | % | |||||||||||||||||||||||||
| 46,528 | 9.3 | % | 50,699 | 9.7 | % | 63,472 | 11.6 | % | 59,755 | 12.7 | % | 53,021 | 15.3 | % | ||||||||||||||||||||||||||
| 499,776 | 100.0 | % | 522,087 | 100.0 | % | 546,773 | 100.0 | % | 469,609 | 100.0 | % | 346,184 | 100.0 | % | ||||||||||||||||||||||||||
| Unamortized net deferred loan fees |
(253 | ) | (278 | ) | (416 | ) | (381 | ) | (261 | ) | ||||||||||||||||||||||||||||||
| Total loans |
$ | 499,523 | $ | 521,809 | $ | 546,357 | $ | 469,228 | $ | 345,923 | ||||||||||||||||||||||||||||||
The table below presents as of December 31, 2010 (i) the aggregate maturities of loans in the named categories of our loan portfolio and (ii) the aggregate amounts of such loans, by variable and fixed rates.
| As of December 31, 2010 | ||||||||||||||||||||||||||||||||
| Due within one year |
Due after one year but within 5 |
Due after five years |
Total | |||||||||||||||||||||||||||||
| Amount | Yield | Amount | Yield | Amount | Yield | Amount | Yield | |||||||||||||||||||||||||
| (Dollars in thousands) | ||||||||||||||||||||||||||||||||
| Variable rate loans: |
||||||||||||||||||||||||||||||||
| Real estate - construction |
$ | 14,561 | 4.63 | % | $ | 21,784 | 4.41 | % | $ | 3,854 | 5.00 | % | $ | 40,199 | 4.57 | % | ||||||||||||||||
| Real estate - commercial |
52,423 | 4.34 | % | 28,659 | 3.83 | % | 3,353 | 3.97 | % | 84,435 | 4.15 | % | ||||||||||||||||||||
| Commercial and industrial loans |
16,531 | 4.32 | % | 2,070 | 4.19 | % | 704 | 3.95 | % | 19,305 | 4.29 | % | ||||||||||||||||||||
| Installment loans |
335 | 3.87 | % | 39 | 3.75 | % | 93 | 3.75 | % | 467 | 3.84 | % | ||||||||||||||||||||
| Equity lines |
3,015 | 3.18 | % | 27,783 | 3.57 | % | 470 | 4.10 | % | 31,268 | 3.54 | % | ||||||||||||||||||||
| Total at variable rates |
86,865 | 4.34 | % | 80,335 | 3.91 | % | 8,474 | 4.44 | % | 175,674 | 4.15 | % | ||||||||||||||||||||
| Fixed rate loans: |
||||||||||||||||||||||||||||||||
| Real estate - construction |
9,681 | 5.97 | % | 36,281 | 6.52 | % | 12,350 | 6.57 | % | 58,312 | 6.41 | % | ||||||||||||||||||||
| Real estate - residential |
1,801 | 5.69 | % | 13,119 | 6.12 | % | 12,959 | 5.66 | % | 27,879 | 5.86 | % | ||||||||||||||||||||
| Real estate - commercial |
51,688 | 6.16 | % | 124,302 | 6.36 | % | 19,101 | 6.48 | % | 195,091 | 6.32 | % | ||||||||||||||||||||
| Commercial and industrial loans |
7,102 | 6.38 | % | 17,932 | 6.43 | % | 3,337 | 6.16 | % | 28,371 | 6.01 | % | ||||||||||||||||||||
| Installment loans |
1,338 | 5.40 | % | 698 | 6.56 | % | 668 | 7.61 | % | 2,704 | 5.81 | % | ||||||||||||||||||||
| Total at fixed rates |
71,610 | 6.13 | % | 192,332 | 6.38 | % | 48,415 | 6.28 | % | 312,357 | 6.26 | % | ||||||||||||||||||||
| Subtotal |
158,475 | 5.15 | % | 272,667 | 5.65 | % | 56,889 | 6.00 | % | 488,031 | 5.50 | % | ||||||||||||||||||||
| Nonaccrual loans |
11,492 | — | — | 11,492 | ||||||||||||||||||||||||||||
| Loans, gross |
$ | 169,967 | $ | 272,667 | $ | 56,889 | $ | 499,523 | ||||||||||||||||||||||||
The above table is based on contractual scheduled maturities. Early repayment of loans or renewals at maturity is not considered in this table. Demand loans and loans having no stated schedule of repayments and no stated maturity are reported as due in one year or less.
Asset Quality and the Allowance for Loan Losses
We prepare our consolidated financial statements on the accrual basis of accounting, including the recognition of interest income on our loan portfolio, unless a loan is placed on a non-accrual basis. We generally place loans on a non-accrual basis when a loan becomes 90 days past due and/or in management’s opinion the borrower may be unable to meet payments as they become due. Amounts received on non-accrual loans generally are applied first to principal and then to interest only after all principal has been collected. Restructured loans considered troubled debt restructurings, or TDRs, occur when for economic or legal reasons related to the borrower’s financial difficulties, a concession is granted to the borrower that would not otherwise be considered, including the reduction of interest rates below a rate otherwise available to that borrower or the forgiveness of interest or principal due to the borrower’s weakened financial condition. Interest on restructured loans is accrued at the restructured rate when it is anticipated that no loss of
27
Table of Contents
original principal will occur. Potential problem loans are loans that are currently performing in accordance with the original terms of the loan and are not a component of nonperforming assets but are closely monitored as a result of information regarding possible credit problems of the related borrowers. The $1.2 million potential problem loans as of December 31, 2010 consisted of approximately $522,000 of commercial real estate construction loans in our New Hanover County market, approximately $461,000 of non-real estate commercial and industrial loans located within our Wake County market and approximately $200,000 of residential real estate primarily located within our Wake County market. Our nonperforming assets as of December 31, 2010 were comprised of $11.5 million in nonaccrual loans and foreclosed assets of $5.3 million. Included in the nonaccrual loans were $520,000 loans considered TDRs. Not included in nonperforming assets as of December 31, 2010, were $131,000 of accruing loans past due 90 days or more, accruing potential problem loans of $1.2 million and accruing TDRs of $11.7 million. Concessions we have granted to customers experiencing cash flow difficulties resulting in a TDR includes reduction in interest rate, forgiveness of interest or modification of payment terms.
We have increased our level of review and monitoring of our real estate secured loans due to the weakened real estate market and the substantial portion of our loan portfolio consisting of real-estate-secured construction and real-estate-secured residential and commercial loans. We began increasing our credit administration staff in early 2007 to assist in the management and review of our growing loan portfolio, particularly real estate loans, and higher levels of nonperforming assets.
Nonaccrual loans have declined to $11.5 million or 2.30% of period-end loans as of December 31, 2010, from $18.8 million or 3.61% of period-end loans as of December 31, 2009. Primarily due to charge-offs and transfers to foreclosed assets, nonaccrual loans have declined throughout 2010, from $17.2 million as of March 31, 2010, to $15.6 million as of June 30, 2010 and $13.5 million as of September 30, 2010. This trend however, could reverse as the continued effects of the prolonged recession could cause continued reduction in business activity in the markets we serve, which could result in higher nonaccrual loans in the future. Our borrowers tied to the residential and commercial real estate industry continue to be impacted from the recession. Specifically, those involved in residential real estate may have restricted or more pressure on cash-flows due to seasonality in real estate sales and consequently our levels of past due and nonaccrual loans could increase during this time. Our 2010 trend of nonaccrual loans mirrored this real estate sales cycle during 2010.
The table below presents for the dates indicated information regarding our non-performing assets.
28
Table of Contents
| As of December 31, | ||||||||||||||||||||
| 2010 | 2009 | 2008 | 2007 | 2006 | ||||||||||||||||
| (Dollars in thousands) | ||||||||||||||||||||
| Nonaccrual loans |
$ | 10,972 | $ | 17,009 | $ | 5,057 | $ | 3,103 | $ | 397 | ||||||||||
| Restructured and nonaccrual loans |
520 | 1,839 | — | — | — | |||||||||||||||
| Total nonaccrual loans |
11,492 | 18,848 | 5,057 | 3,103 | 397 | |||||||||||||||
| Foreclosed assets |
5,296 | 3,271 | 2,276 | — | — | |||||||||||||||
| Total nonperforming assets |
$ | 16,788 | $ | 22,119 | $ | 7,333 | $ | 3,103 | $ | 397 | ||||||||||
| Accruing loans past due 90 days or more |
$ | 131 | $ | 200 | $ | — | $ | 492 | $ | — | ||||||||||
| Restructured accruing loans |
11,741 | — | — | — | — | |||||||||||||||
| Potential problem loans |
1,184 | 1,433 | 3,494 | 327 | 242 | |||||||||||||||
| Allowance for loan losses |
9,935 | 8,581 | 6,376 | 5,020 | 3,983 | |||||||||||||||
| Nonaccrual loans to period end loans |
2.30 | % | 3.61 | % | 0.93 | % | 0.66 | % | 0.11 | % | ||||||||||
| Allowance for loan losses to period end loans |
1.99 | % | 1.64 | % | 1.17 | % | 1.07 | % | 1.15 | % | ||||||||||
| Nonperforming assets to loans and foreclosed assets |
5.65 | % | 4.21 | % | 1.34 | % | 0.66 | % | 0.11 | % | ||||||||||
| Nonperforming assets to total assets |
4.50 | % | 3.26 | % | 1.07 | % | 0.57 | % | 0.09 | % | ||||||||||
| Ratio of allowance for loan losses to nonaccrual (x) |
0.86 x | 0.46 x | 1.26 x | 1.62 x | 10.03 x | |||||||||||||||
| As of December 31, | ||||||||||||||||||||
| 2010 | 2009 | 2008 | 2007 | 2006 | ||||||||||||||||
| (Dollars in thousands) | ||||||||||||||||||||
| Nonaccrual loans by major category: |
||||||||||||||||||||
| Real estate loans: |
||||||||||||||||||||
| Construction, land development and other land loans |
$ | 6,931 | $ | 14,484 | $ | 4,223 | $ | 133 | $ | — | ||||||||||
| One to four family residential |
2,697 | 1,738 | 16 | — | — | |||||||||||||||
| Non-farm nonresidential |
255 | 2,152 | 480 | 1,958 | — | |||||||||||||||
| Non-real estate loans: |
||||||||||||||||||||
| Commercial and industrial |
1,598 | 438 | 288 | 1,012 | 397 | |||||||||||||||
| Consumer and other |
11 | 36 | 50 | — | — | |||||||||||||||
| Total nonaccrual loans |
$ | 11,492 | $ | 18,848 | $ | 5,057 | $ | 3,103 | $ | 397 | ||||||||||
| Foreclosed assets by major category: |
||||||||||||||||||||
| Construction, land development and other land |
$ | 2,297 | $ | 1,647 | $ | 210 | $ | — | $ | — | ||||||||||
| One to four family residential |
1,131 | — | — | — | — | |||||||||||||||
| Non-farm nonresidential |
1,868 | 1,624 | 2,066 | — | — | |||||||||||||||
| Total foreclosed assets |
$ | 5,296 | $ | 3,271 | $ | 2,276 | $ | — | $ | — | ||||||||||
As of December 31, 2010, 86.0% of our nonaccrual loans were real-estate secured with 10.5% represented within our New Hanover County market. Real-estate secured construction and land development loans comprised 60.3% of nonaccrual loans, all of which were represented in our Wake County market. Non-real estate commercial and industrial and consumer loans comprised 14.0% of which 2.1% were represented in our New Hanover market. In total, $1.4 million or 12.6% of the $11.5 million nonaccrual loans as of December 31, 2010 were in our New Hanover County market area with the remaining 87.4% represented throughout our offices in Wake County.
An aggregate of $7.6 million of the nonaccrual loans as of December 31, 2010 is attributable to nine borrowers with an average loan balance of approximately $448,000 for various construction, commercial real estate and one-to-four family real estate and commercial and industrial loans, all of which are located in our Wake County market areas. The average loan exposure for these borrowers is approximately $ 846,000 with the largest exposure to any one borrower included in our nonaccrual loans at $1.8 million. Each specific loan in these customer relationships was analyzed for impairment and our management concluded specific impairment reserves aggregating $1.1 million on these loans were necessary in addition to $464,000 of partial charge-offs. Our impairment analysis of the remaining $3.9 million of nonaccrual loans consisted of 32 loans to 22 borrowers with an average loan balance of less than $122,000. These loans were also analyzed for impairment resulting in additional impairment reserves of $1.0 million. Included in the above nonaccrual loans are six residential real estate loans or commercial non-real estate loans totaling $520,000 which were restructured
29
Table of Contents
to forgive all accrued interest due to financial difficulties of the borrower. The restructured loans remain on nonaccrual status as of December 31, 2010. See Note D to our consolidated financial statements for additional detail regarding loans, nonaccrual loans and credit quality.
The following table is a summary of our nonaccrual loans by major category for the total Bank, New Hanover County and Wake County as of December 31, 2010.
| Total Bank | New Hanover County | Wake County | ||||||||||||||||||||||
| December 31, 2010 | December 31, 2010 | December 31, 2010 | ||||||||||||||||||||||
| Amount | % of Total Nonaccrual Loans |
Amount | % of Total Bank Nonaccrual Loans |
Amount | % of Total Bank Nonaccrual Loans |
|||||||||||||||||||
| (Dollars in thousands) | ||||||||||||||||||||||||
| Real estate loans: |
||||||||||||||||||||||||
| Construction, land development and other land loans |
$ | 6,931 | 60.3 | % | $ | — | — | $ | 6,931 | 60.3 | % | |||||||||||||
| One to four family residential |
2,697 | 23.5 | % | 1,004 | 8.8 | % | 1,693 | 14.7 | % | |||||||||||||||
| Non-farm nonresidential |
255 | 2.2 | % | 200 | 1.7 | % | 54 | 0.5 | % | |||||||||||||||
| 9,883 | 86.0 | % | 1,204 | 10.5 | % | 8,678 | 75.5 | % | ||||||||||||||||
| Non-real estate loans: |
||||||||||||||||||||||||
| Commercial and industrial |
1,598 | 13.9 | % | 231 | 2.0 | % | 1,368 | 11.9 | % | |||||||||||||||
| Consumer and other |
11 | 0.1 | % | 11 | 0.1 | % | — | — | ||||||||||||||||
| 1,609 | 14.0 | % | 242 | 2.1 | % | 1,368 | 11.9 | % | ||||||||||||||||
| Total nonaccrual loans |
$ | 11,492 | 100.0 | % | $ | 1,446 | 12.6 | % | $ | 10,046 | 87.4 | % | ||||||||||||
As of December 31, 2010, we also identified and evaluated $1.2 million of potential problem loans, primarily as a result of information regarding possible, although not probable, credit problems of the related borrowers. These loans were performing in accordance with the original terms of the loans as of December 31, 2010. Management considered these loans in assessing the adequacy of our allowance for loan losses. These loans were represented by four individual loans and borrowers with an average loan balance under $300,000. Approximately $723,000 of these potential problem loans are secured by real estate and the remainder are secured with receivables, equipment or are unsecured.
As of December 31, 2009, the recorded investment in loans that management considered impaired totaled $18.8 million including $1.8 million in restructured loans. Impaired loans of $17.1 million had a corresponding allowance of $2.6 million. There was no corresponding allowance with the remaining $1.7 million of loan balances analyzed for impairment after recording approximately $437,000 in related charge-offs. We also identified $1.4 million of potential problem loans as of December 31, 2009 of which $264,000 were charged-off during 2010, $705,000 are on nonaccrual status and $176,000 continue to be classified as a potential problem loans as of December 31, 2010. The remaining December 31, 2009 potential problem loans have been paid off during 2010 or are currently performing at year end 2010.
Foreclosed assets of $5.3 million as of December 31, 2010 consisted of 31 properties acquired through foreclosure of which approximately 43.4% or $2.3 million of the properties represented residential or commercial construction or land development properties. Approximately 21.4% or $1.1 million represented one-to-four family residential properties and approximately 35.3% or $1.9 million represented commercial real estate properties. The largest of these properties in terms of dollar value is $623,000 in commercial real estate located in our New Hanover County market area.
Assets acquired through, or in lieu of, foreclosure are held for sale and are initially recorded at fair value less cost to sell at the date of foreclosure, establishing a new cost basis. Subsequent to foreclosure, the initial recorded value may be reduced by additional valuation allowances which are charged to earnings if the estimated fair value of the property less estimated costs to sell declines below the initial recorded value. Approximately 73.4% of the foreclosed real estate properties as of December 31, 2010 were in the New Hanover market area. Due to the continued downturn in real estate for this market as well as increased deterioration in the Wake County real estate market, the foreclosed properties underwent periodic revaluations throughout 2010, resulting in additional valuation losses on various foreclosed properties of $1.1 million. These write-downs are in our consolidated statements of operations included in this report. During the year 2010, sales of 30 foreclosed properties with a carrying value of approximately $6.2 million were sold net of selling costs for $6.0 million resulting in net losses of $183,000. Fair value of foreclosed assets is based on recent appraisals or discounted collateral values for properties for which recent appraisals were not available. After review of these foreclosed assets, we believe the fair values, less estimated costs to sell, equal their current carrying value as of December 31, 2010. Foreclosed assets as of December 31, 2009 consisted of 16 properties totaling $3.3 million with the largest dollar value of $1.6 million representing a commercial building acquired from the settlement of a loan attributable to a single-practice physician who died unexpectedly. The property was sold in March 2010 at approximately its carrying value and is included in the 2010 sales of foreclosed property discussed above.
30
Table of Contents
The following table presents for the dates indicated, information about foreclosed assets.
| Year Ended December 31, | ||||||||||||
| 2010 | 2009 | 2008 | ||||||||||
| (Dollars in thousands) | ||||||||||||
| Foreclosed assets beginning of year |
$ | 3,271 | $ | 2,276 | $ | — | ||||||
| Loans transferred to foreclosed assets |
9,183 | 2,376 | 2,276 | |||||||||
| Expenditures on foreclosed assets |
169 | 135 | — | |||||||||
| Proceeds from sales, net of selling expenses |
(5,996 | ) | (781 | ) | — | |||||||
| Net loss on sale of foreclosed assets |
(183 | ) | (38 | ) | — | |||||||
| 6,444 | 3,968 | 2,276 | ||||||||||
| Valuation allowance for foreclosed assets |
(1,148 | ) | (697 | ) | — | |||||||
| Foreclosed assets end of year |
$ | 5,296 | $ | 3,271 | $ | 2,276 | ||||||
Our allowance for loan losses is maintained at a level that our management considers adequate to provide for probable loan losses based on our assessment of various factors affecting our loan portfolio, including a review of problem loans, business conditions and loss experience and an overall evaluation of the quality of the underlying collateral.
Management evaluates the adequacy of our allowance for loan losses on a monthly basis. The evaluation of the allowance for loan losses is divided into two components. A general reserve allowance is calculated on the current loan portfolio for the homogeneous or general pool of loans and a separate reserve is determined for loans that are individually analyzed for impairment. In evaluating the allowance for loan losses, we prepare on a monthly basis an analysis of our current homogeneous group of loans using historical loss rates, other identified factors, and data from our loan portfolio. Beginning in the fourth quarter of 2009, we adopted a factor methodology to apply a charge-off rate to our performing loan portfolio. This methodology utilizes three components to determine factors to apply to this section of our loan loss model which is subdivided by nine categories of loans. The factors applied to the nine loan categories include charge-off history, current impairments and management’s judgment. The charge-off history review results in a determination by loan category of where our charge-offs have historically occurred which allows us to determine a risk factor for the historical charge-off risk of each given loan category. We review the current impairments by loan category as we consider these as a predictor of future charge-offs to determine a risk factor for each given loan category. Management’s determination of the charge-off history and current impairments determines a range of factors for each loan category. The individual ranges from charge-off history and current impairments are added together to arrive at a final factor range. Management then uses its judgment based on internal and external items to determine the final factor. An estimated reserve allowance for the performing portfolio is then calculated from the final risk factors for each category of loan applied to the five-year weighted average annual charge-off rate.
We also have identified seven qualitative factors that are considered indicators of changes in the level of risk of loss inherent in our loan portfolio. These factors consider the risk of payment performance, overall portfolio quality (utilizing weighted average risk rating), general economic factors such as unemployment, delinquency and charge-off rates, regulatory examination results, interest rate environment, levels of highly leveraged transactions (as defined in Section 365.2 of the FDIC regulations) and levels of construction, development and non-owner occupied commercial real estate lending. These factors are examined for trends and the risk that they represent to our loan portfolio. Each of these factors is assigned a level of risk and this risk factor is applied to only the general pool of loans to calculate the appropriate allowance.
In addition to the general reserve, all loans risk rated “substandard”, “doubtful” and “loss” are reviewed for probable losses and if management determines a loan to be impaired it is removed from its homogeneous group and individually analyzed for impairment. A loan is considered impaired when it is considered probable that all amounts due under the contractual terms of the loan will not be collected when due. We have established policies and procedures for identifying loans that should be considered for impairment such as credit risk reviews, a watch list, delinquency monitoring and specific market, product and concentration reviews. Other groups of loans may be selected for impairment review. For loans determined to be impaired, the specific allowance is based on the present value of expected cash flows or the fair value of the collateral or the loan’s observable market price. Using the combined data gathered during this monthly evaluation process, the model calculates an estimated reserve amount.
While we believe that our management uses the best information available to determine the allowance for loan losses, unforeseen market conditions could result in adjustments to the allowance for loan losses, and net income could be significantly affected, if circumstances differ substantially from the assumptions used in making the final determination. Because these factors and management’s assumptions are subject to change, the allocation is not necessarily indicative of future loan portfolio performance. Also, as an important component of their periodic examination process, regulatory agencies review our allowance for loan losses and may require additional provisions for estimated losses based on judgments that differ from those of management.
31
Table of Contents
The table below provides information on our allocation of our allowance for loan losses among various loan categories for the dates presented.
| As of December 31, | ||||||||||||||||||||||||||||||||||||||||
| 2010 | 2009 | 2008 | 2007 | 2006 | ||||||||||||||||||||||||||||||||||||
| Amount | % of Total Loans (1) |
Amount | % of Total Loans (1) |
Amount | % of Total Loans (1) |
Amount (2) | % of Total Loans (1) |
Amount (2) | % of Total Loans (1) |
|||||||||||||||||||||||||||||||
| (Dollars in thousands) | ||||||||||||||||||||||||||||||||||||||||
| Real estate loans: |
||||||||||||||||||||||||||||||||||||||||
| Construction, land development and other land loans |
$ | 3,744 | 26.7 | % | $ | 4,357 | 33.5 | % | $ | 1,953 | 32.6 | % | $ | 1,414 | 28.2 | % | $ | 809 | 20.3 | % | ||||||||||||||||||||
| Farmland |
27 | 0.7 | % | 19 | 0.5 | % | 10 | 0.5 | % | 28 | 0.6 | % | 18 | 0.5 | % | |||||||||||||||||||||||||
| One to four family residential |
2,339 | 19.7 | % | 1,276 | 20.7 | % | 1,019 | 19.4 | % | 922 | 18.4 | % | 730 | 18.3 | % | |||||||||||||||||||||||||
| Multifamily residential |
55 | 1.3 | % | 46 | 1.1 | % | 22 | 1.1 | % | 51 | 1.0 | % | 92 | 2.3 | % | |||||||||||||||||||||||||
| Non-farm nonresidential |
2,382 | 42.4 | % | 1,958 | 34.5 | % | 1,288 | 34.9 | % | 1,966 | 39.2 | % | 1,724 | 43.3 | % | |||||||||||||||||||||||||
| Non-real estate loans: |
||||||||||||||||||||||||||||||||||||||||
| Commercial and industrial |
1,354 | 8.6 | % | 870 | 8.8 | % | 2,005 | 10.5 | % | 567 | 11.3 | % | 531 | 13.3 | % | |||||||||||||||||||||||||
| Consumer and other |
34 | 0.6 | % | 55 | 0.9 | % | 79 | 1.0 | % | 72 | 1.3 | % | 79 | 2.0 | % | |||||||||||||||||||||||||
| $ | 9,935 | 100.0 | % | $ | 8,581 | 100.0 | % | $ | 6,376 | 100.0 | % | $ | 5,020 | 100.0 | % | $ | 3,983 | 100.0 | % | |||||||||||||||||||||
| (1) | Represents the percent of total loans outstanding by loan type. This allowance for loan and lease losses is calculated on an approximate basis and is not necessarily indicative of future losses. |
| (2) | Represents an estimated allocation of the allowance for loan losses based on loans outstanding in each category as a percent of total loans outstanding. |
The table below presents information regarding the changes in our allowance for loan losses as of or for the years indicated.
| As of or for the Year Ended December 31, | ||||||||||||||||||||
| 2010 | 2009 | 2008 | 2007 | 2006 | ||||||||||||||||
| (Dollars in thousands) | ||||||||||||||||||||
| Loan outstanding at the end of the year |
$ | 499,523 | $ | 521,809 | $ | 546,357 | $ | 469,228 | $ | 345,943 | ||||||||||
| Average loans outstanding during the year |
$ | 510,000 | $ | 541,576 | $ | 520,075 | $ | 393,927 | $ | 316,620 | ||||||||||
| Allowance for loan losses at beginning of year |
$ | 8,581 | $ | 6,376 | $ | 5,020 | $ | 3,983 | $ | 3,679 | ||||||||||
| Provision for loan losses |
8,095 | 5,710 | 2,755 | 1,339 | 69 | |||||||||||||||
| 16,676 | 12,086 | 7,775 | 5,322 | 3,748 | ||||||||||||||||
| Loans charged off: |
||||||||||||||||||||
| Real estate loans: |
||||||||||||||||||||
| Construction, land development and other land loans |
4,445 | 1,694 | 123 | — | — | |||||||||||||||
| One to four family residential |
765 | 896 | 148 | — | — | |||||||||||||||
| Non-farm nonresidential |
364 | 178 | 45 | — | — | |||||||||||||||
| Non-real estate loans: |
||||||||||||||||||||
| Commercial and industrial |
1,224 | 636 | 805 | 299 | — | |||||||||||||||
| Consumer and other |
34 | 106 | 284 | 3 | 5 | |||||||||||||||
| Total charge-offs |
6,832 | 3,510 | 1,405 | 302 | 5 | |||||||||||||||
| Recoveries of loans previously charged off: |
||||||||||||||||||||
| Real estate loans: |
||||||||||||||||||||
| Construction, land development and other land loans |
68 | — | — | — | — | |||||||||||||||
| One to four family residential |
7 | 1 | — | — | 230 | |||||||||||||||
| Non-farm nonresidential |
10 | — | — | — | — | |||||||||||||||
| Non-real estate loans: |
||||||||||||||||||||
| Commercial and industrial |
6 | 4 | 6 | — | 2 | |||||||||||||||
| Consumer and other |
— | — | — | — | 8 | |||||||||||||||
| Total recoveries |
91 | 5 | 6 | — | 240 | |||||||||||||||
| Net charge-offs/(recoveries) |
6,741 | 3,505 | 1,399 | 302 | (235 | ) | ||||||||||||||
| Allowance for loan losses at end of year |
$ | 9,935 | $ | 8,581 | $ | 6,376 | $ | 5,020 | $ | 3,983 | ||||||||||
| Ratios: |
||||||||||||||||||||
| Nonaccrual loans to period-end loans |
2.30 | % | 3.61 | % | 0.93 | % | 0.66 | % | 0.11 | % | ||||||||||
| Allowance for loan losses as a percent of loans at end of year |
1.99 | % | 1.64 | % | 1.17 | % | 1.07 | % | 1.15 | % | ||||||||||
| Net charge-offs/(recoveries) as a percent of average loans |
1.32 | % | 0.65 | % | 0.27 | % | 0.08 | % | -0.07 | % | ||||||||||
As of December 31, 2010, the allowance for loan losses was $9.9 million, $1.4 million above the prior year-end. The general reserve as of December 31, 2010 increased by approximately $2.3 million over the prior year-end primarily due to overall higher charge-off and other risk factors applied to the general non-impaired pool of loans. A decline of $22.3 million of loans outstanding
32
Table of Contents
decreased the general reserve by approximately $343,000. Including reserves for potential problem loans, the specific reserve allocated to impaired loans was down $642,000 from December 31, 2009 due to charge-offs on impaired loans. We provided for probable losses through specific impairment reserve allowances of $2.1 million on $6.5 million of non-performing loans. Our allowance for loan loss model also provided approximately $147,000 of reserves for $637,000 of potential problem loans. Detail regarding impaired and potential problem loans is discussed above. As a result, the increase in the level of the allowance relative to gross loans resulted primarily from the increase in charge-off and other risk factors applied to our general non-impaired pool of loans. Risk factors are examined for trends and the risk that they represent to our loan portfolio and have increased overall due to changes in general economic trends such as payment performance, loan delinquency and charge-off rates, unemployment and changes in risk ratings. As a percent of loans outstanding the allowance for loans losses increased 35 basis points to 1.99% as of December 31, 2010 compared to 1.64% as of December 31, 2009.
Our loan loss allowance is increased by provisions charged to operations and reduced by loans charged off, net of recoveries. Net charge-offs were $6.7 million for the year-ended December 31, 2010, $3.2 million higher than the $3.5 million of net charge-offs for the prior year. Approximately $5.5 million or 81.4% of the loans charged off during 2010 were for real estate secured loans of which construction and land development loans represented $4.4 million. A substantial portion, $4.0 million or 60.1% of the real estate secured charge-offs were located in our New Hanover County market. The real-estate secured net charge-offs were comprised of $3.9 million one-to-four family construction and residential loans and $1.6 million commercial construction and real-estate secured loans. Additional information regarding our allowance for loan losses and loan loss experience is presented in Notes D and E to our consolidated financial statements included in this report. If the economy continues to languish or deteriorate, our borrowers could be negatively impacted which could result in continued increased charge-offs and non-performing loans, which could require us to increase our allowance for loan losses.
The following table is a summary of our net charge-offs as of December 31, 2010 by major category for the total Bank, New Hanover County and Wake County.
| Net Charge-off Composition as of December 31, 2010 | ||||||||||||||||||||||||
| Total Bank December 31, 2010 |
New Hanover County December 31, 2010 |
Wake County December 31, 2010 |
||||||||||||||||||||||
| Amount | % of Net Charge-offs |
Amount | % of Total Bank Net Charge-offs |
Amount | % of Total Bank Net Charge-offs |
|||||||||||||||||||
| (Dollars in thousands) | ||||||||||||||||||||||||
| Net charge-offs, real estate loans: |
||||||||||||||||||||||||
| Construction, land development and other land loans |
$ | 4,377 | 65.0 | % | $ | 3,325 | 49.3 | % | $ | 1,052 | 15.6 | % | ||||||||||||
| One to four family residential |
758 | 11.1 | % | 483 | 7.1 | % | 274 | 4.1 | % | |||||||||||||||
| Non-farm nonresidential |
354 | 5.3 | % | 240 | 3.6 | % | 114 | 1.7 | % | |||||||||||||||
| 5,489 | 81.4 | % | 4,048 | 60.0 | % | 1,440 | 21.4 | % | ||||||||||||||||
| Net charge-offs, non-real estate loans: |
||||||||||||||||||||||||
| Commercial and industrial |
1,218 | 18.1 | % | 513 | 7.6 | % | 706 | 10.5 | % | |||||||||||||||
| Consumer and other |
34 | 0.5 | % | 24 | 0.4 | % | 10 | 0.1 | % | |||||||||||||||
| 1,252 | 18.6 | % | 537 | 8.0 | % | 716 | 10.6 | % | ||||||||||||||||
| Total net charge-offs |
$ | 6,741 | 100.0 | % | $ | 4,585 | 68.0 | % | $ | 2,156 | 32.0 | % | ||||||||||||
Deposits
Our deposits are the primary source of our funds for our portfolio loans, mortgage pipeline and investments. Our deposit strategy is to obtain deposit funds from within our market areas through relationship banking wherein we do not lend to a customer without a deposit relationship. We believe that the great majority of our deposits are from individuals and entities located in our market areas with an increasing concentration of deposits from our “Community PLUS” division where we have deposit relationships with property management customers located within and outside of our market areas. As of December 31, 2010, deposits from our “Community PLUS” division represented approximately 35.6% of our total deposits.
Our decision to slow loan growth coupled with our success at building and retaining deposit relationships provided the opportunity to substantially reduce non-traditional internet deposits during 2010 and eliminate completely generally more volatile wholesale brokered certificates of deposit in January 2010.
In total, our deposits decreased $44.1 million to $562.7 million as of December 31, 2010 from $606.9 million as of December 31, 2009 predominately in non-traditional funding sources. Traditional core deposits generally include noninterest-bearing demand deposits, interest-bearing transaction accounts, which are savings, money market and interest checking accounts as well as relationship-oriented certificates of deposit less than $100,000. These relationship-oriented core deposits increased $24.6 million to $437.8 million from $412.9 million as of December 31, 2009, representing 77.8% compared to 68.0%, respectively, of our total deposits as of December 31, 2010 and 2009.
33
Table of Contents
In addition to reducing our reliance on non-core deposits, our efforts to focus on maintaining and developing our core deposit relationships has also benefited our deposit mix as well. Non-interest bearing deposits increased $12.9 million, or 12.3%, to $117.8 million as of December 31, 2010 over $104.9 million as of December 31, 2009. Interest-bearing transaction deposits grew to $250.5 million as of December 31, 2010, an increase of $17.8 million or 7.6% over December 31, 2009. Deposit funds in non-interest bearing and money market and interest checking accounts from our “CommunityPLUS” division contributed approximately $9.7 million and $22.9 million, respectively, of the increases in these deposit funds. Overall, noninterest-bearing demand deposits have increased to 20.9% of total deposits as of December 31, 2010 compared to 17.3% as of December 31, 2009. Similarly, interest-bearing transaction deposits have increased to 44.5% of total deposits compared to 38.3% for the 2009 period.
Conversely, time deposits decreased to 34.6% of total deposits as of December 31, 2010 compared to 44.4% as of December 31, 2009. The decline in these deposits were, for the most part, intentional as part of our strategic decision to reduce or eliminate non-relationship time deposits. Time deposits overall declined to $194.4 million, a decrease of $74.8 million or 27.8% from $269.3 million as of December 31, 2009. Non-core wholesale brokered certificates of deposit were eliminated entirely in January 2010, a decrease of $20.1 million from year-end 2009. Non-brokered internet deposits, which are non-core certificates of deposit issued by means of an internet subscription service, were reduced to $5.2 million as of December 31, 2010, a decrease of $28.3 million or 84.5% from $33.4 million as of year-end 2009. Also, strategic decisions regarding profitability and/or non-relationship accounts, led to the intentional reduction in generally more volatile time deposits over $100,000. Excluding internet deposits, time deposits over $100,000 decreased $25.1 million or 21.2% to $93.7 million as of December 31, 2010. Time deposits through participation in the Certificate of Deposit Account Registry Service, or CDARS, program increased $4.5 million to $26.1 million as of December 3, 2010 from $21.6 million as of December 31, 2009. The CDARS program provides full FDIC insurance on deposit balances greater than posted FDIC limits by exchanging larger depository relationships with other CDARS members. Traditional core time deposits less than $100,000 declined $5.9 million to $69.5 million from $74.4 million as of December 31, 2009. We did experience growth in core time deposits through our “CommunityPLUS” division which grew to approximately $52.9 million, an increase of $18.1 million or 52.1% over the prior year-end.
Continued success in eliminating non-core and generally more volatile deposits such as internet deposits and time deposits to single service customers will continue to be a priority in the future while we maintain our focus on growing traditional core deposits with our customers with whom we aim to obtain the customers’ primary borrowing and deposit relationship as well as our continued success through our property management division “CommunityPLUS”.
The table below presents information on our average deposits for the years presented.
| For the Year Ended December 31, | ||||||||||||||||||||||||
| 2010 | 2009 | 2008 | ||||||||||||||||||||||
| Average Amount |
Average Rate |
Average Amount |
Average Rate |
Average Amount |
Average Rate |
|||||||||||||||||||
| (Dollars in thousands) | ||||||||||||||||||||||||
| Savings, NOW and money market |
$ | 242,359 | 0.85 | % | $ | 229,016 | 0.90 | % | $ | 212,885 | 2.18 | % | ||||||||||||
| Time deposits over $100,000 |
110,325 | 2.20 | % | 141,852 | 2.98 | % | 98,494 | 4.59 | % | |||||||||||||||
| Other time deposits |
114,543 | 1.79 | % | 156,604 | 2.83 | % | 121,978 | 3.96 | % | |||||||||||||||
| Total interest-bearing deposits |
467,227 | 1.40 | % | 527,472 | 2.04 | % | 433,357 | 3.23 | % | |||||||||||||||
| Noninterest-bearing deposits |
114,927 | 90,770 | 79,498 | |||||||||||||||||||||
| Total deposits |
$ | 582,154 | 1.12 | % | $ | 618,242 | 1.74 | % | $ | 512,855 | 2.73 | % | ||||||||||||
34
Table of Contents
The following table presents the amounts and maturities of deposits with balances of $100,000 or more:
| As of December 31, 2010 |
||||
| (Dollars in thousands) | ||||
| Remaining maturity: |
||||
| Less than three months |
$ | 24,159 | ||
| Three to six months |
9,915 | |||
| Six to twelve months |
35,451 | |||
| Over twelve months |
29,308 | |||
| Total |
$ | 98,833 | ||
Borrowings
Securities sold under agreements to repurchase generally mature within one to four days from the transaction date and are collateralized by U.S. Government Agency obligations. These repurchase agreements are classified as short-term borrowings in the accompanying balance sheets. As of December, 31, 2010, we had available lines of credit totaling approximately $163.7 million with various financial institutions and the Federal Reserve for borrowing on a short-term basis. These lines are subject to annual renewals with varying interest rates. We had no outstanding borrowings on these lines of credit as of December 31, 2010 except a long-term FHLB advance for approximately $804,000, maturing in 2025.
The following table sets forth certain information regarding our short-term borrowings for the periods indicated.
| For the Year Ended December 31, | ||||||||||||
| 2010 | 2009 | 2008 | ||||||||||
| (Dollars in thousands) | ||||||||||||
| Short-term borrowings: |
||||||||||||
| Repurchase agreements and federal funds purchased |
||||||||||||
| Balance outstanding at end of period |
$ | 3,615 | $ | 6,103 | $ | 7,782 | ||||||
| Maximum amount outstanding at any month end during the period |
7,444 | 16,754 | 22,342 | |||||||||
| Average balance outstanding |
5,803 | 9,236 | 11,089 | |||||||||
| Weighted-average interest rate during the period |
0.33 | % | 0.36 | % | 1.94 | % | ||||||
| Weighted-average interest rate at end of period |
0.11 | % | 0.36 | % | 0.37 | % | ||||||
| Federal Home Loan Bank advances - < 1Yr |
||||||||||||
| Balance outstanding at end of period |
$ | — | $ | — | $ | — | ||||||
| Maximum amount outstanding at any month end during the period |
— | — | 23,000 | |||||||||
| Average balance outstanding |
— | — | 5,041 | |||||||||
| Weighted-average interest rate during the period |
— | — | 2.80 | % | ||||||||
| Weighted-average interest rate at end of period |
— | — | — | |||||||||
| Total Short-term borrowings: |
||||||||||||
| Balance outstanding at end of period |
$ | 3,615 | $ | 6,103 | $ | 7,782 | ||||||
| Maximum amount outstanding at any month end during the period |
7,444 | 16,754 | 31,988 | |||||||||
| Average balance outstanding |
5,803 | 9,236 | 16,130 | |||||||||
| Weighted-average interest rate during the period |
0.33 | % | 0.36 | % | 2.21 | % | ||||||
| Weighted-average interest rate at end of period |
0.11 | % | 0.05 | % | 0.05 | % | ||||||
35
Table of Contents
Long-term trust preferred securities and related junior subordinated debentures outstanding as well as subordinated notes are included in long-term borrowings in the accompanying balance sheets. Long-term borrowings as of December 31, 2010 are as follows:
| As of December 31, | ||||||||
| 2010 | 2009 | |||||||
| (Dollars in thousands) | ||||||||
| Long-term borrowings |
||||||||
| FHLB advances |
$ | 804 | $ | 825 | ||||
| Subordinated debentures |
11,000 | 11,000 | ||||||
| Junior subordinated debentures |
15,465 | 15,465 | ||||||
| $ | 27,269 | $ | 27,290 | |||||
Results of Operations For the Years Ended December 31, 2010 and 2009
Overview. The prolonged effects of the recession on real estate and business activity in the markets we serve and the overall economy in general continue to restrain our overall results of operations compared to pre-recession results. Net income for the year ended December 31, 2010 was $1.0 million compared to $1.1 million for the year ended December 31, 2009, a decrease of $74,000 or 6.7%. Diluted net income per share of common stock was $0.14 in 2010 compared to $0.15 in 2009. The decrease in earnings can be directly attributed to a higher provision for loan losses and increases in expenses related to foreclosed assets. The increase in loan loss provision was as a result of increased loan charge-offs, additional reserves on impaired loans and increases in risk factors to the loan portfolio in general. Additional foreclosed properties and continued deterioration in real-estate prices resulted in higher operating expenses related to foreclosed properties as well as additional write-downs on re-valuations and losses on sales of foreclosed properties during the year. The overall decrease in earnings was minimized through favorable changes in deposit mix, mortgage income generated from our new mortgage division and the continuation of several cost savings initiatives such as the temporary suspension to our company’s 401(k) match, fees to our corporate board members, the elimination of incentive bonuses and merit increases for the year and other cost savings in general. For the year ended 2010 return on average assets remained at 0.16% while return on average equity declined to 2.70% from 2.97% for 2009.
Net Interest Income. Interest income for the year ended December 31, 2010 decreased $2.5 million or 7.4% over the prior year period while for the same period interest expense decreased $4.4 million or 36.8% resulting in an increase of $1.9 million in net interest income for the year. Net interest income was $23.5 million for the year ended December 31, 2010 compared to $21.6 million for the year ended December 31, 2009, up 8.7%. Our focus on developing and maintaining our core deposit relationships while simultaneously reducing non-core deposits brought beneficial changes to our deposit mix with a corresponding decrease in interest expense. The favorable change in deposit mix was the primary factor for the increase in net interest income coupled with the redeployment of lower yielding interest-earning deposits into higher yielding mortgage loans held for sale.
Interest income is affected by changes in the mix and volume of average-earning assets, interest rates and also by the level of loans on nonaccrual status. Interest income for the year ended December 31, 2010 was $31.0 million compared to $33.4 million for the prior year, a decrease of $2.5 million. The overall decrease in interest income over the prior year was attributable to a decrease in volume of our average-earning assets, primarily loans, lower yields as well as the effect of a higher level of average nonaccrual loans over the prior year. Our loan portfolio, our highest yielding asset, declined $33.8 million on average from 2009, effectively reducing interest income by approximately $2.0 million. Lower loan yields effectively decreased interest income by approximately $1.0 million. In addition a higher average of nonaccrual loans resulted in additional lost interest income of approximately $171,000 over the prior year. Mortgage loans held for sale averaged $30.7 million for the year 2010 providing additional income of $1.5 million, offsetting declines in other lower-yielding interest-earning assets including investments and certificates of deposits with banks. The yield on mortgage loans held for sale averaged 4.79% compared to 2.94%, and .89%, respectively, for available for sale investments and other interest-earning deposits and certificates of deposit.
Our intentional change in deposit mix and repricing of time deposits at lower rates, were the primary factors for the overall decrease in interest expense. Interest expense for the year ended December 31, 2010 was $7.5 million compared to $11.8 million for the prior year, a $4.4 million decrease. Average time deposits decreased $73.6 million from the previous year primarily in non-core wholesale brokered, internet and single-service certificates of deposit. These higher-costing and generally more volatile deposits were replaced with lower costing interest checking, money market and non-interest-bearing transaction deposits which grew in total an average of $37.5 million, of which $24.2 million were in non-interest-bearing demand deposits. The decrease in average time deposits decreased interest expense by approximately $1.8 million while lower interest rates as a result of repricing reduced total interest expense by approximately $2.4 million. Interest expense on average short-term and long-term borrowings decreased $14,000 and $157,000, respectively, over the prior year due substantially to lower interest rates on these borrowings.
The yield on our earning assets averaged 5.05% during 2010 compared to 5.08% during 2009. During the same period, the cost of our interest-bearing liabilities averaged 1.50% compared to 2.10%. Overall our net interest margin, excluding average nonaccrual loans, increased 55 basis points to 3.83% during 2010 compared to 3.28% during 2009.
Provision for Loan Losses. The provision for loan losses increased $2.4 million or 41.8% to $8.1 million for the year ended December 31, 2010, compared with $5.7 million for the prior year. Provisions for loan losses are charged to income to bring the allowance for loan losses to a level considered appropriate by our management. The increase in the provision for year 2010 is
36
Table of Contents
principally in response to higher charge-offs, additional reserves for impaired loans and overall increases to risk factors to the general reserve. Net charge-offs increased to $6.7 million or 1.32% of average loans for the year ended December 31, 2010 compared to $3.5 million or .65% of average loans the year ended December 31, 2009. The allowance for loan losses was $9.9 million as of December 31, 2010 and $8.6 million as of December 31, 2009, representing 1.99% and 1.64%, respectively, of loans outstanding as of December 31, 2010 and 2009. See “Asset Quality and the Allowance For Loan Losses” above for more detail.
Non-interest Income. For the year ended December 31, 2010, non-interest income increased $3.3 million or over 283% over the prior year primarily due to fee income from our new mortgage division. Fees from mortgage operations were $2.6 million for the year ended 2010 resulting from a high volume of mortgage loan refinances due to lower interest rates. Included in non-interest income for 2010 and 2009 are security gains from our available for sale portfolio of $741,000 and $464,000, respectively. During 2009, non-interest income includes the loss from the write-off of our stock investment in our lead correspondent bank of $134,000. Fees from annuity sales and other fees generated from our wealth management services division provided $439,000 in non-interest income, up $323,000 or 277.0% over the prior year period. We restructured, and hired a new wealth management director for our wealth management services division during the second quarter of 2010 and expect fees generated from this division as well as fees from our new mortgage division to be key sources of noninterest income in the future. Service charges and fees on deposit accounts and merchant and other loan fees were $402,000 and $114,000, respectively, for 2010 compared to $432,000 and $136,000, respectively for 2009. As a percentage of average assets, non-interest income increased to .68% for the year 2010 compared to .17% for the year 2009.
Non-interest Expense. Non-interest expense includes salaries and benefits paid to employees, occupancy and equipment expenses and all other operating costs. Total non-interest expense for the year ended December 31, 2010 increased $2.9 million or 19.2% to $18.0 million from $15.1 million for the prior year period. The increase is primarily attributable to substantially higher net costs related to foreclosed assets, up $780,000, over the prior year period as well as additional personnel costs attributable to our new mortgage division. We continued expense reducing initiatives during 2010 which began in early 2009 in an effort to partially offset unexpected expenses, particularly higher asset quality related costs due to the current and anticipated economic environment. We plan to re-instate fees paid to our corporate board early in 2011 which had been suspended for the past two years. Presently other than corporate board fees we do not anticipate re-instatement of other cost saving initiatives such as incentive bonuses and merit increases or 401k matching contributions in the near future until our asset quality related expenses return to historically low levels.
Salaries and other personnel expense represent our largest expense category at $8.4 million for the year ended December 31, 2010, up $2.0 million or 30.6% from $6.4 million for the year ended December 31, 2009. Approximately $1.9 million of the increase was attributable to our new mortgage division. A high level of mortgage loan refinancing activity throughout the year generated increased personnel costs through commissions paid to mortgage loan originators as well as additional costs for support personnel within this division. Personnel expense within our wealth management services division is also primarily fee driven. Significantly higher fee income resulted in higher commission expense, up approximately $230,000 over the prior year. We continued to temporarily suspend 401k matching benefits, incentive bonuses as well as merit increases as part of the cost savings initiatives we began in 2009. Expense for 401k matching contributions decreased $108,000 from the prior year as these benefits were not suspended until May 2009. As a percentage of average assets, personnel expense increased to 1.28% for the year 2010 compared to .92% for the year 2009.
Occupancy and equipment costs remained substantially unchanged increasing $16,000 to $2.8 million for the year ended December 31, 2010 from the same period last year. Other non-interest expenses increased $913,000 or 15.3% over the prior year period primarily due to increased expenses related to foreclosed assets. Subsequent to foreclosure, valuations are periodically performed on the properties. Due to continued downturn in the New Hanover County and increasingly in the Wake County real estate markets, revaluations of foreclosed properties resulted in valuation losses of $1.1 million for the year ended December 31, 2010, up $451,000 or 64.7% over the prior year. In addition to the valuation write-downs, net losses on sales of foreclosed assets for the period were $183,000 compared to $38,000 for the prior year. General costs on foreclosed properties net of rental income received were $256,000, up $184,000 or 255.6% over 2009 due to a higher number of foreclosed properties maintained during the year. As a percent of average assets, net foreclosed asset costs were .24% for the year ended December 31, 2010 compared to .12% for the prior year period. FDIC insurance premiums were down $420,000 for 2010 from the prior year. The decrease is due to a lower deposit base as well as the inclusion in the prior year period of an emergency special assessment levied against all banks in June 2009 in addition to a higher base assessment. Additional discussion regarding increased insurance assessments is presented in Item 1. Business “Supervision and Regulation-Insurance Assessments.” Our outsourced services expense is related to data processing and other services for our customers’ accounts. These services are primarily volume driven and increase as we add new offices and products with corresponding increases in loan, deposit and other customer-based accounts. In total, outsourced data processing fees were up $266,000 over the prior year, primarily due to outsourced software services to our customers of our “CommunityPLUS” division. Professional fees were up $59,000 over the prior year for legal, audit and tax services and shareholder communications due primarily to higher annual meeting expense, the acquisition of our new mortgage loan division and employment contracts. There were no other significant changes in other noninterest expenses. Including additional net costs related to foreclosed assets and additional personnel expense as a result of our new mortgage division, our non-interest expense as a percent of average assets was 2.75% for the year ended December 31, 2010 compared to 2.18% for the prior year.
Income Taxes. We recorded $795,000 in income tax expense for the year ended December 31, 2010 and $817,000 for the year ended December 31, 2009. Income tax expense as a percentage of pretax income was 43.7% for 2010 and 42.7% for 2009. The effective tax rate was higher in 2010 primarily due to fewer permanent tax differences compared to the prior year. Management has evaluated our tax positions and has concluded that we have no uncertain tax positions.
37
Table of Contents
Results of Operations For the Years Ended December 31, 2009 and 2008
Overview. For the year ended December 31, 2009, our net income was $1.1 million compared to $2.4 million for the year ended December 31, 2008, a decrease of $1.3 million or 53.6%. Diluted net income per share of common stock was $0.15 in 2009 and $0.32 in 2008. The decrease in earnings was primarily attributable to: additional provision for loan losses due to higher levels of impaired loans and increases in risk factors to the loan portfolio in general; significantly higher FDIC assessments in general plus a one-time special assessment levied against all banks in June 2009; losses on the re-valuation and sales of foreclosed assets; operating expenses related to foreclosed assets; and the impact of a $13.8 million increase in nonaccrual loans that required the reversal of recognized interest income at the time of placement on nonaccrual status and loss of future interest income. The overall decrease in earnings was minimized through several cost savings initiatives as well as savings from shifts in deposits; expense reducing initiatives such as the temporary suspension to our company’s 401(k) match, fees to our corporate board members, the elimination of incentive bonuses and merit increases for the year and other cost savings in general; and a change in deposit mix, specifically a higher level of non-interest bearing accounts.
As of December 31, 2009 compared to the prior year, net interest income increased $1.3 million, provision for loan losses increased $3.0 million, noninterest income decreased $692,000 and noninterest expense decreased $306,000. Return on average assets was 0.16% in 2009 versus 0.40% in 2008 and .65% in 2007 while return on average equity was 2.97%, 6.85% and 10.59% for the years ended December 31, 2009, 2008 and 2007, respectively.
Net Interest Income. Net interest income was $21.6 million for the year ended December 31, 2009, an increase of $1.3 million or 6.6% over the year ended December 31, 2008. The increase in net interest income was attributable to overall growth in average interest-earning assets which helped to offset declines in yields; a change in deposit mix; and the impact of the lower interest rate environment on our funding costs. Interest income for the year ended December 31, 2009 decreased $2.6 million or 7.3% over the prior year period while interest expense for the same period decreased $4.0 million or 25.1%.
The overall decrease in interest income over the prior year was primarily due to lower yields on our average earning assets as well as the effect of a substantially higher level of nonaccrual loans over the prior year. The Wall Street Journal prime rate for the year ended December 31, 2009 averaged 184 basis points lower than in 2008. Comparatively, yields on our average interest-earning assets were 129 basis points lower. The lower yields on our average interest-earning assets reduced interest income approximately $4.9 million. Combined with the effect of lower yields, a higher level of loans where interest accrual was discontinued also resulted in lower interest income. Nonaccrual loans increased to $18.8 million as of December 31, 2009 compared to $5.1 million as of December 31, 2008, representing an approximate $704,000 loss in interest income for the year. Average earning asset growth, primarily loans and certificates of deposits with banks, provided approximately $2.3 million of additional interest income. A significant portion of the increase in average earning assets, $49.0 million and $34.9 million, respectively, was in lower yielding earning assets consisting of certificates of deposit with banks and other interest-earning deposits with banks with average yields of approximately 1.76% and 0.25%, respectively. The loan portfolio, our highest yielding asset with an average yield of 5.77%, grew on average $21.5 million over the prior year with most of the growth occurring during the first half of the year. Overall, total interest income decreased $2.6 million.
As with interest income, lower interest rates were the primary factor for the overall decrease in interest expense. Total interest expense decreased $4.0 million from the previous year. Lower interest rates as a result of repricing our interest-bearing deposits to reflect market conditions reduced total interest expense by approximately $7.0 million. Growth in average interest-bearing deposits of $94.1 million, primarily time deposits over $100,000, increased total interest expense by approximately $3.1 million for the year ended December 31, 2009 compared to the prior year. Interest expense on average short-term and long-term borrowings decreased $323,000 and $393,000, respectively, over the prior year primarily due to lower interest rates on these borrowings as they repriced in the declining rate environment and a decrease of $6.9 million in average short-term borrowings.
Other factors affecting our net interest income for the year 2009 include the effect of our average earning assets volume outpacing our average interest-bearing liabilities and an increase in average noninterest-bearing demand deposits. Non-interest-bearing deposits increased to $90.8 million, an increase of $11.3 million over the year 2008. These deposit funds declined on average $9.8 million during 2008 due to a requirement of the North Carolina State Bar for our attorney trust account customers to transition from noninterest-bearing demand deposit accounts to interest-bearing checking accounts by the end of June 30, 2008. The increase in 2009 was in large part due to our “CommunityPlus” division which provided on average an increase of approximately $14.1 million in these funds for the year.
The average yield on our earning assets during 2009 was 4.98% compared to 6.27% during 2008, down 129 basis points. During the same period, the average cost of our interest-bearing liabilities decreased by 122 basis points to 2.10% for the year 2009. The yield and rate decreases primarily reflect rate declines, principally changes to the prime lending rate. For the year 2009, the national prime lending rate averaged 184 basis points lower than the prior year. The national prime lending rate remained at 3.25% for the year 2009. Overall our net interest margin declined 30 basis points to 3.22% during 2009 compared to 3.52% during 2008.
38
Table of Contents
Provision for Loan Losses. The provision for loan losses increased $3.0 million or 107.3% to $5.7 million for the year ended December 31, 2009, compared with $2.8 million for the prior year. Provisions for loan losses are charged to income to bring the allowance for loan losses to a level considered appropriate by our management. The increase in the provision for year 2009 is principally in response to an increase in impaired loans and overall increases to risk factors to the general reserve. Net charge-offs were $3.5 million or .65% of average loans and $1.4 million or .27% of average loans, respectively, for the years ended December 31, 2009 and 2008. The allowance for loan losses was $8.6 million as of December 31, 2009 and $6.4 million as of December 31, 2008, representing 1.64% and 1.17%, respectively, of loans outstanding as of December 31, 2009 and 2008. See “Asset Quality and the Allowance For Loan Losses” above for more detail.
Non-interest Income. For the year ended December 31, 2009, our non-interest income remained substantially unchanged at $1.2 million, down $58,000 from the corresponding prior year. Included in non-interest income for 2009 are net security gains of $464,000 from our available for sale portfolio and the loss from the write-off of our stock investment in our lead correspondent bank of $134,000. Excluding net security gains and stock investment loss, non-interest income decreased $388,000 to $838,000, compared to $1.2 million for the corresponding prior year. Service charges and fees on deposit accounts were substantially unchanged from the prior year at $432,000 compared to $428,000 for the year 2008. Merchant and other loan fees were down $384,000 due to decreased new loan and modified loan activity. We began efforts at the beginning of 2008 to dissolve our mortgage operations by the end of June 2008, resulting in a decrease in mortgage operation fees of $72,000 from the prior year. Fees from annuity sales and other fees generated from wealth management services provided $117,000 in non-interest income, down $51,000 over the prior year period. As a percentage of average assets, non-interest income decreased to .17% for the year 2009 compared to .21% for the year 2008. In late 2009, we sold our 5.6% equity interest in a title insurance agency at a gain of $18,000.
Non-interest Expense. Non-interest expense includes salaries and benefits paid to employees, occupancy and equipment expenses and all other operating costs. Total non-interest expense, including $1.4 million in increased FDIC insurance premiums in 2009, increased $328,000 to $15.1 million for the year ended December 31, 2009 compared to $14.8 million for the year ended December 31, 2008. In addition to higher FDIC premiums, net cost of foreclosed assets was $807,000 for the year ended December 31, 2009 compared to $5,000 for the prior year. Cost savings initiatives we began early in 2009 partially offset increasingly higher regulatory assessments, specifically FDIC insurance premiums, as well as higher costs related to foreclosed assets and any other unexpected changes due to the current economic environment. In the aggregate, total non-interest expense, including FDIC insurance premiums and higher foreclosed asset costs, as a percentage of average total assets decreased to 2.18% for the year 2009 compared to 2.49% for year 2008. FDIC insurance premiums represented .25% and .07%, respectively, of average total assets for the years ended December 31, 2009 and 2008. Net foreclosed asset costs represented .12% and 0%, respectively of average assets for the same periods.
Salaries and other personnel expense represent our largest expense category at $6.4 million for the year 2009, down $1.7 million from $8.1 million for the year 2008. Full time equivalent employees were down four employees from the prior year period due to organizational consolidations. Our efforts to reduce noninterest expense provided much of the decrease in overall personnel expense. For the year ended December 31, 2009 compared to 2008, incentive and other payroll bonuses decreased approximately $192,000, 401(k) retirement expense was down $216,000 while salaries and other related benefits and costs decreased approximately $655,000. The remaining decrease in overall personnel expense is primarily the result of higher per loan origination cost adjustments implemented in late 2008, increasing the amount of deferred personnel-related origination costs on new and modified loans. As a percentage of average assets, personnel expense decreased to .92% for the year 2009 compared to 1.37% for the year 2008.
Occupancy and equipment costs increased $249,000 to $2.8 million for the year ended December 31, 2009 compared to the prior year. The increase reflects additional depreciation and other occupancy costs on our new multi-story building for our north Raleigh banking office and new corporate offices which opened on June 8, 2009.
Other non-interest expenses increased $1.1 million over the prior year primarily due to increased regulatory expenses. FDIC insurance assessments increased $1.4 million or 346.0% over the prior year due to higher regulatory rate requirements. The FDIC increased the base assessment insurance premiums and also imposed a special assessment of five basis points that was levied against all banks in June 2009. Additional discussion regarding increased insurance assessments is presented in Item 1. Business “Supervision and Regulation-Insurance Assessments.” Our outsourced services expense is related to data processing and other services for our customers’ accounts. These services are primarily volume driven and increase as we add new offices and products with corresponding increases in loan, deposit and other customer-based accounts. Additional costs for 2009 include outsourced software services for our customers in the “CommunityPLUS” division, approximately $285,000 for the year ended December 31, 2009. In total, outsourced data processing fees were up $346,000 over the prior year. Fees for directors were down $182,000 compared to the prior year as a result of a decision to suspend corporate director fees for 2009. An increased emphasis on reducing other noninterest expense wherever possible resulted in decreases in postage, printing and office supplies of $49,000, advertising and promotion expense of $195,000 and donations of $56,000. Net expenses related to foreclosed assets added $802,000, of which $697,000 were valuation write-downs, non-interest expense over the prior year. There were no other significant changes in other noninterest expenses.
39
Table of Contents
Income Taxes. We recorded $817,000 in income tax expense for the year ended December 31, 2009 and $1.6 million for the year ended December 31, 2008. Income tax expense as a percentage of pretax income was 42.7% for 2009 and 39.7% for 2008. The effective tax rate was higher in 2009 primarily due to fewer permanent tax differences compared to the prior year. Management has evaluated our tax positions and has concluded that we have no uncertain tax positions.
Net Interest Income
Like most financial institutions, the primary component of our earnings is net interest income. Net interest income is the difference between interest income, principally from loan and investment securities portfolios, and interest expense, principally on customer deposits and borrowings. Changes in net interest income result from changes in volume, spread and margin. For this purpose, volume refers to the average dollar level of interest-earning assets and interest-bearing liabilities, spread refers to the difference between the average yield on interest-earning assets and the average cost of interest-bearing liabilities, and margin refers to net interest income divided by average interest-earning assets and is influenced by the level and relative mix of interest-earning assets and interest-bearing liabilities, as well as levels of non-interest-bearing liabilities. The following table sets forth, for the periods indicated, information with regard to average balances of assets and liabilities, as well as the total dollar amounts of interest income from interest-earning assets and interest expense on interest-bearing liabilities, resultant yields or costs, net interest income, net interest spread, net interest margin and ratio of average interest-earning assets to average interest-bearing liabilities. Non-accrual loans are excluded in determining average loans outstanding. Accretion of net deferred loan fees is included in interest income in the table below.
40
Table of Contents
| Year Ended December 31, 2010 | Year Ended December 31, 2009 | Year Ended December 31, 2008 | ||||||||||||||||||||||||||||||||||
| Average Balance |
Interest | Average Rate |
Average Balance |
Interest | Average Rate |
Average Balance |
Interest | Average Rate |
||||||||||||||||||||||||||||
| (Dollars in thoursands) | ||||||||||||||||||||||||||||||||||||
| Interest-earning assets: |
||||||||||||||||||||||||||||||||||||
| Loans (1) |
$ | 494,706 | $ | 28,288 | 5.72 | % | $ | 528,476 | $ | 31,257 | 5.91 | % | $ | 516,288 | $ | 34,318 | 6.65 | % | ||||||||||||||||||
| Loans held for sale |
30,726 | 1,472 | 4.79 | % | — | — | — | — | — | — | ||||||||||||||||||||||||||
| Investment securities available for sale |
19,970 | 587 | 2.94 | % | 25,725 | 1,113 | 4.33 | % | 29,492 | 1,349 | 4.57 | % | ||||||||||||||||||||||||
| Investment securities held to maturity |
420 | 16 | 3.81 | % | 750 | 38 | 5.07 | % | 285 | 20 | 7.02 | % | ||||||||||||||||||||||||
| Other interest-earning assets |
67,281 | 599 | 0.89 | % | 103,598 | 1,032 | 1.00 | % | 25,550 | 388 | 1.52 | % | ||||||||||||||||||||||||
| Total interest-earning assets |
613,103 | 30,962 | 5.05 | % | 658,549 | 33,440 | 5.08 | % | 571,615 | 36,075 | 6.31 | % | ||||||||||||||||||||||||
| Other assets |
42,903 | 37,359 | 22,917 | |||||||||||||||||||||||||||||||||
| Total assets |
$ | 656,006 | $ | 695,908 | $ | 594,532 | ||||||||||||||||||||||||||||||
| Interest-bearing liabilities: |
||||||||||||||||||||||||||||||||||||
| Deposits: |
||||||||||||||||||||||||||||||||||||
| Savings, NOW and money market |
$ | 242,359 | 2,066 | 0.85 | % | $ | 229,016 | 2,062 | 0.90 | % | $ | 212,885 | 4,644 | 2.18 | % | |||||||||||||||||||||
| Time deposits over $100,000 |
110,325 | 2,431 | 2.20 | % | 141,852 | 4,234 | 2.98 | % | 98,494 | 4,520 | 4.59 | % | ||||||||||||||||||||||||
| Other time deposits |
114,543 | 2,051 | 1.79 | % | 156,604 | 4,439 | 2.83 | % | 121,978 | 4,826 | 3.96 | % | ||||||||||||||||||||||||
| Borrowings: |
||||||||||||||||||||||||||||||||||||
| Short-term borrowings |
5,804 | 19 | 0.33 | % | 9,236 | 33 | 0.36 | % | 16,130 | 356 | 2.21 | % | ||||||||||||||||||||||||
| Long-term debt |
27,271 | 921 | 3.38 | % | 27,291 | 1,078 | 3.95 | % | 26,927 | 1,471 | 5.46 | % | ||||||||||||||||||||||||
| Total interest-bearing liabilities |
500,302 | 7,488 | 1.50 | % | 563,999 | 11,846 | 2.10 | % | 476,414 | 15,817 | 3.32 | % | ||||||||||||||||||||||||
| Noninterest-bearing deposits |
114,927 | 90,770 | 79,498 | |||||||||||||||||||||||||||||||||
| Other liabilities |
2,881 | 4,165 | 4,094 | |||||||||||||||||||||||||||||||||
| Shareholders’ equity |
37,896 | 36,974 | 34,526 | |||||||||||||||||||||||||||||||||
| Total liabilities and shareholders’ equity |
$ | 656,006 | $ | 695,908 | $ | 594,532 | ||||||||||||||||||||||||||||||
| Net interest income and interest rate spread |
$ | 23,474 | 3.55 | % | $ | 21,594 | 2.98 | % | $ | 20,258 | 2.99 | % | ||||||||||||||||||||||||
| Net interest margin |
3.83 | % | 3.28 | % | 3.54 | % | ||||||||||||||||||||||||||||||
| Ratio of average interest-earning assets to average interest-bearing liabilities |
122.55 | % | 116.76 | % | 119.98 | % | ||||||||||||||||||||||||||||||
| Net interest margin including nonaccrual loans |
3.74 | % | 3.22 | % | 3.52 | % | ||||||||||||||||||||||||||||||
| (1) | Nonaccrual loans are excluded in loan amounts. |
41
Table of Contents
Rate/Volume Analysis
The following table analyzes the dollar amount of changes in interest income and interest expense for major components of interest-earning assets and interest-bearing liabilities. The table distinguishes between (i) changes attributable to volume (changes in volume multiplied by the prior period’s rate), (ii) changes attributable to rate (changes in rate multiplied by the prior period’s volume), and (iii) net change (the sum of the previous columns). The change attributable to both rate and volume (changes in rate multiplied by changes in volume) has been allocated equally to both the changes attributable to volume and the changes attributable to rate.
| Year Ended December 31, 2010 vs. 2009 | Year Ended December 31, 2009 vs. 2008 | |||||||||||||||||||||||
| Increase (Decrease) Due to | Increase (Decrease) Due to | |||||||||||||||||||||||
| Volume | Rate | Total | Volume | Rate | Total | |||||||||||||||||||
| (Dollars in thousands) | ||||||||||||||||||||||||
| Interest income: |
||||||||||||||||||||||||
| Loans |
$ | (1,964 | ) | $ | (1,005 | ) | $ | (2,969 | ) | $ | 1,330 | $ | (4,391 | ) | $ | (3,061 | ) | |||||||
| Loans held for sale |
1,472 | — | 1,472 | — | — | — | ||||||||||||||||||
| Investment securities available for sale |
(209 | ) | (317 | ) | (526 | ) | (168 | ) | (68 | ) | (236 | ) | ||||||||||||
| Investment securities held to maturity |
(15 | ) | (7 | ) | (22 | ) | 28 | (10 | ) | 18 | ||||||||||||||
| Other interest-earning assets |
(393 | ) | (40 | ) | (433 | ) | 1,116 | (472 | ) | 644 | ||||||||||||||
| Total interest income |
(1,109 | ) | (1,369 | ) | (2,478 | ) | 2,306 | (4,941 | ) | (2,635 | ) | |||||||||||||
| Interest expense: |
||||||||||||||||||||||||
| Deposits: |
||||||||||||||||||||||||
| Savings, NOW and money market |
114 | (110 | ) | 4 | 246 | (2,828 | ) | (2,582 | ) | |||||||||||||||
| Time deposits over $100,000 |
(818 | ) | (985 | ) | (1,803 | ) | 1,642 | (1,928 | ) | (286 | ) | |||||||||||||
| Other time deposits |
(973 | ) | (1,415 | ) | (2,388 | ) | 1,176 | (1,563 | ) | (387 | ) | |||||||||||||
| Borrowings: |
||||||||||||||||||||||||
| Short-term borrowings |
(12 | ) | (2 | ) | (14 | ) | (88 | ) | (235 | ) | (323 | ) | ||||||||||||
| Long-term debt |
(1 | ) | (156 | ) | (157 | ) | 18 | (411 | ) | (393 | ) | |||||||||||||
| Total interest expense |
(1,690 | ) | (2,668 | ) | (4,358 | ) | 2,994 | (6,965 | ) | (3,971 | ) | |||||||||||||
| Net interest income increase (decrease) |
$ | 581 | $ | 1,299 | $ | 1,880 | $ | (688 | ) | $ | 2,024 | $ | 1,336 | |||||||||||
Liquidity
Our liquidity is a measure of our ability to fund loans, withdrawals and maturities of deposits, and other cash outflows in a cost effective manner. Our principal sources of liquidity are deposits, scheduled payments and prepayments of loan principal, maturities of investment securities, access to liquid assets, and funds provided by operations. While scheduled loan payments and maturing investments are relatively predictable sources of funds, deposit flows and loan prepayments are greatly influenced by general interest rates, economic conditions and competition. Liquid assets (consisting of cash and due from banks, interest-earning deposits with other banks, certificates of deposit with banks, Federal funds sold, investment securities and loans classified as held for sale) comprised $110.7 million or 17.5% and $132.7 million or 19.5%, respectively, of our total assets as of December 31, 2010 and December 31, 2009.
As a member of the FHLB, we may obtain advances of up to 10% of our Bank’s assets. We are also authorized to borrow from the Federal Reserve Bank’s “discount window”. As of December 31, 2010, we had pledged specific collateral for potential borrowing of up to $150.7 million from the “discount window.” As another source of short-term borrowings, we also utilize securities sold under agreements to repurchase. As of December 31, 2010, our short-term borrowings consisted of securities sold under agreements to repurchase of $3.6 million. As of December 31, 2010, overnight excess funds of $42.4 million were invested in our account at the Federal Reserve. In addition, $198,000 was invested in short-term time deposits with federally insured domestic banking institutions.
Total deposits were $562.7 million and $606.9 million, respectively, as of December 31, 2010 and December 31, 2009. Time deposits, which are the only deposit accounts that have stated maturity dates, are generally considered to be rate sensitive. Time deposits represented 34.6% and 44.4%, respectively, of total deposits as of December 31, 2010 and December 31, 2009. Time deposits of $100,000 or more represented 17.6% and 22.1%, respectively, of our total deposits as of December 31, 2010 and December 31, 2009. As of December 31, 2010, we had eliminated all of our wholesale brokered certificates of deposit, a decrease of $20.1 million from December 31, 2009. Under FDIC regulations governing brokered deposits, well capitalized institutions are not subject to brokered deposit limitations. To be categorized as well capitalized, the Bank must maintain a minimum ratio of total risk-based capital of 10.0% among other ratios. As of December 31, 2010, the Bank was “well capitalized” with a total risk-based capital ratio of 12.99%. Deposits generated through an internet subscription service decreased to $5.2 million as of December 31, 2010 compared to $33.4 million as of December 31, 2009. The internet time deposits are included in time deposits on our December 31, 2010
42
Table of Contents
consolidated balance sheet and both non-traditional deposit sources, wholesale brokered and internet time deposits are included in time deposits on our consolidated balance sheet as of December 31, 2009. Maturities of these accounts are primarily within three months. Other than brokered deposits and internet deposits, we believe that most of our time deposits are relationship-oriented. While we will need to pay competitive rates to retain deposits at their maturities, there are other subjective factors that we believe will determine their continued retention and we will continue to focus on developing full banking relationships with our customers. Based upon prior experience, we anticipate that a substantial portion of outstanding certificates of deposit will renew upon maturity. We closely monitor and evaluate our overall liquidity position on an ongoing basis and adjust our position as management deems appropriate. We believe our liquidity position as of December 31, 2010 is adequate to meet our operating needs.
Asset/Liability Management
Our results of operations depend substantially on our net interest income. Like most financial institutions, our interest income and cost of funds are affected by general economic conditions and by competition in the marketplace.
The purpose of asset/liability management is to provide stable net interest income growth by protecting our earnings from undue interest rate risk, which arises from volatile interest rates and changes in the balance sheet mix, and by managing the risk/return relationships between liquidity, interest rate risk, market risk, and capital adequacy. We maintain, and have complied with, our Board approved asset/liability management policy that provides guidelines for controlling exposure to interest rate risk by utilizing the following ratios and trend analysis: liquidity, equity, volatile liability dependence, portfolio maturities, maturing assets and maturing liabilities. Our policy is to control the exposure of our earnings to changing interest rates by generally endeavoring to maintain a position within a narrow range around an “earnings neutral position,” which is defined as the mix of assets and liabilities that generate a net interest margin that is least affected by interest rate changes.
When suitable lending opportunities are not sufficient to utilize available funds, we have generally invested such funds in securities, primarily securities issued by governmental agencies and mortgage-backed securities. The securities portfolio contributes to our earnings and plays an important part in our overall interest rate management. However, management of the securities portfolio alone cannot balance overall interest rate risk. The securities portfolio must be used in combination with other asset/liability techniques to actively manage the balance sheet. The primary objectives in our overall management of our securities portfolio are safety, liquidity, yield, asset/liability management, which is also known as interest rate risk, and investing in securities that can be pledged for public deposits.
In reviewing our needs with regard to proper management of our asset/liability program, we estimate our future needs, taking into consideration historical periods of high loan demand and low deposit balances, estimated loan and deposit increases (due to increased demand through marketing), and forecasted interest rate changes.
The analysis of an institution’s interest rate gap, which is the difference between the repricing of interest-earning assets and interest-bearing liabilities during a given period of time, is a standard tool for the measurement of exposure to interest rate risk. We currently utilize a process of net interest income simulation where we project future balance sheet levels, interest rates, and noninterest income and noninterest expenses. These projections are then shocked with changes in interest rates to capture any interest rate risk within the base case projections. Beginning in 2009, we began to incorporate Economic Value of Equity, or EVE, as a component of asset/liability management. EVE analysis provides insight into the trends of our Bank’s earning capacity and utilizes a process of determining the present net value of our cash flows. The following table sets forth the amounts of our interest-earning assets and interest-bearing liabilities outstanding at December 31, 2010, which is projected to reprice or mature in each of the future time periods shown. Except as stated below, the amounts of assets and liabilities shown which reprice or mature within a particular period were determined in accordance with the contractual terms of the assets or liabilities. Loans with adjustable rates are shown as being due at the end of the next upcoming adjustment period. Money market deposit accounts and negotiable order of withdrawal or other transaction accounts are assumed to be subject to immediate repricing and depositor availability and have been placed in the shortest period. In making the gap computations, none of the assumptions made regarding prepayment rates and deposit drop off rates have been used for any interest-earning assets or interest-bearing liabilities. In addition, the table does not reflect scheduled principal payments that will be received throughout the lives of the loans. The interest rate sensitivity of our assets and liabilities illustrated in the following table would vary substantially if different assumptions were used or if actual experience differs from that indicated by such assumptions.
43
Table of Contents
| Terms to Repricing as of December 31, 2010 | ||||||||||||||||||||
| 3 Months or Less |
Over 3 Months to 12 Months |
Total Within 12 Months |
Over 12 Months |
Total | ||||||||||||||||
| (Dollars in thousands) | ||||||||||||||||||||
| Interest-earning assets: |
||||||||||||||||||||
| Loans |
$ | 207,186 | $ | 51,661 | $ | 258,847 | $ | 240,676 | $ | 499,523 | ||||||||||
| Loans held for sale |
51,472 | — | 51,472 | — | 51,472 | |||||||||||||||
| Investment securities available for sale |
5,727 | 1,436 | 7,163 | 2,071 | 9,234 | |||||||||||||||
| Investment securities held to maturity |
250 | — | 250 | — | 250 | |||||||||||||||
| Other earning assets |
44,057 | — | 44,057 | 1,273 | 45,330 | |||||||||||||||
| Total interest-earning assets |
$ | 308,692 | $ | 53,097 | $ | 361,789 | $ | 244,020 | $ | 605,809 | ||||||||||
| Percent of total interest-earning assets |
50.96 | % | 8.76 | % | 59.72 | % | 40.28 | % | 100.00 | % | ||||||||||
| Cumulative percent of total interest- earning assets |
50.96 | % | 59.72 | % | 59.72 | % | 100.00 | % | 100.00 | % | ||||||||||
| Interest-bearing liabilities |
||||||||||||||||||||
| Deposits: |
||||||||||||||||||||
| Savings, NOW and money market |
$ | 250,469 | $ | — | $ | 250,469 | $ | — | $ | 250,469 | ||||||||||
| Time deposits |
53,848 | 93,657 | 147,505 | 46,934 | 194,439 | |||||||||||||||
| Borrowings: |
||||||||||||||||||||
| Short-term borrowings |
3,615 | — | 3,615 | — | 3,615 | |||||||||||||||
| Long-term debt |
26,465 | — | 26,465 | 804 | 27,269 | |||||||||||||||
| $ | 334,397 | $ | 93,657 | $ | 428,054 | $ | 47,738 | $ | 475,792 | |||||||||||
| Percent of total interest-bearing liabilities |
70.28 | % | 19.68 | % | 89.97 | % | 10.03 | % | 100.00 | % | ||||||||||
| Cumulative percent of total interest- bearing liabilities |
70.28 | % | 89.97 | % | 89.97 | % | 100.00 | % | 100.00 | % | ||||||||||
| Interest sensitivity gap |
$ | (25,705 | ) | $ | (40,560 | ) | $ | (66,265 | ) | $ | 196,282 | $ | 130,017 | |||||||
| Cumulative interest sensitivity gap |
(25,705 | ) | (66,265 | ) | (66,265 | ) | 130,017 | 130,017 | ||||||||||||
| Cumulative interest sensitivity gap as a percent of total interest-earning assets |
–4.24 | % | –10.94 | % | –10.94 | % | 21.46 | % | 21.46 | % | ||||||||||
| Cumulative ratio of interest-sensitive assets to interest-sensitive liabilities |
92.31 | % | 84.52 | % | 84.52 | % | 127.33 | % | 127.33 | % | ||||||||||
Capital
A significant measure of the strength of a financial institution is its capital base. Federal bank regulators have classified capital into the following components: (1) Tier I capital, which includes common shareholders’ equity (excluding accumulated other comprehensive income) and qualifying preferred equity, and (2) Tier II capital, which includes a portion of the allowance for loan losses, certain qualifying long-term debt and preferred stock that does not qualify as Tier I capital. Minimum capital levels are regulated by risk-based capital adequacy guidelines, which require a financial institution to maintain capital as a percentage of its risk-adjusted assets, which are the institution’s assets and certain off-balance sheet items adjusted for predefined credit risk factors. A financial institution is required to maintain, at a minimum, Tier I capital as a percentage of risk-adjusted assets of 4.0% and combined Tier I and Tier II capital as a percentage of risk-adjusted assets of 8.0%. In addition to the risk-based guidelines, federal regulations require a financial institution to maintain a minimum leverage ratio (Tier I capital as a percentage of tangible assets) of 4.0%. Our equity to assets ratio was 5.92% and 5.32%, respectively, as of December 31, 2010 and December 31, 2009. Based on the current economic and regulatory environment, the Bank’s board of directors has decided to maintain a Tier I leveraged ratio of 8% or more and a total risk based capital ratio of 12% or more. As the following table indicates, as of December 31, 2010 we exceeded our regulatory capital requirements.
44
Table of Contents
| As of December 31, 2010 | ||||||||||||
| Actual Ratio |
Minimum Requirement |
Well Capitalized Requirement |
||||||||||
| Total risk-based captial ratio |
13.37 | % | 8.00 | % | 10.00 | % | ||||||
| Tier I risk-based capital ratio |
9.46 | % | 4.00 | % | 6.00 | % | ||||||
| Tier I leverage ratio |
7.89 | % | 4.00 | % | 5.00 | % | ||||||
In March 2004, we established a trust, North State Statutory Trust I, which sold $5.2 million of its preferred and common securities in a pooled private placement and in turn used these funds to purchase $5.2 million of junior subordinated debentures issued by us. In December 2005, we established a second trust, North State Statutory Trust II, which sold $5.2 million of its preferred and common securities in a pooled private placement and in turn used these funds to purchase $5.2 million of junior subordinated debentures issued by us. In November 2007, we established a third trust, North State Statutory Trust III, which sold $5.2 million of its preferred and common securities in a pooled private placement and in turn used these funds to purchase $5.2 million of junior subordinated debentures issued by us.
Our trust preferred securities presently qualify as Tier 1 regulatory capital subject to a limit of 25% of total core capital elements and are reported in Federal Reserve regulatory reports as a minority interest in a consolidated subsidiary. Accounting pronouncements require the Trusts to be deconsolidated from our financial statements. In March 2005, the Board of Governors of the Federal Reserve adopted a rule affecting the inclusion of trust preferred securities in Tier 1 capital. Effective March 31, 2011, the Federal Reserve rule limits the aggregate amount of restricted core capital elements, including trust preferred securities that can be included in Tier 1 capital to not more than 25% of total core capital elements, net of goodwill, less any associated tax liability. The new rule also limits the aggregate amount of restricted core capital elements (including trust preferred securities), term subordinated debt and limited life preferred stock that can be included in Tier II capital to 50% of Tier 1 capital. We expect the new rules, effective March 31, 2011, will have a minimal effect on our calculation of Tier I capital. There can be no assurance that the Federal Reserve will continue to allow institutions to include trust preferred securities in Tier 1 capital for regulatory capital purposes in these same amounts or at all. In the event of a disallowance, there would be a reduction in our consolidated Tier 1 and leverage capital ratios.
On May 13, 2008, the Bank issued $9.8 million and on July 1, 2008 an additional $1.2 million of floating-rate subordinated notes due June 30, 2018. The Bank may redeem some or all of the notes at any time beginning on June 30, 2013 at a price equal to 100% of the principal amount of the notes redeemed plus accrued but unpaid interest to the redemption date. The subordinated notes are included in long-term debt and qualify as Tier II capital.
We intend that our company and our bank remain “well-capitalized” for regulatory purposes. To do so, we might need additional capital in the future due to greater than expected future growth, any impact on our operations or financial condition caused by the recent prolonged recession and continuing economic stagnation and any governmental and regulatory responses to the recession, or other reasons. If necessary, we will consider all viable alternatives for raising capital including additional issuances of trust preferred securities. After careful and complete evaluation, in November 2008 we chose not to participate in the Capital Purchase Plan of the U.S. Government’s TARP.
Contractual Obligations and Commitments
In the normal course of business, we have various outstanding contractual obligations that will require future cash outflows, as well as commitments and contingent liabilities, such as commitments to extend credit that may or may not require future cash outflows. To meet the financing needs of our customers, we issue various financial instruments, such as lines of credit, loan commitments and standby letters of credit. These instruments either are not recorded on our balance sheet or are recorded on our balance sheet in amounts that differ from the full contract or notional amounts. These instruments involve varying elements of market, credit and liquidity risk.
45
Table of Contents
The following table reflects our expected contractual obligations and future operating lease commitments as of December 31, 2010.
| Payments Due by Period | ||||||||||||||||||||
| Contractual Obligations |
Total | On Demand or Within 1 Year |
2 - 3 Years |
4 - 5 Years |
After 5 Years |
|||||||||||||||
| (Dollars in thousands) | ||||||||||||||||||||
| Short-term borrowings |
$ | 3,615 | $ | 3,615 | $ | — | $ | — | $ | — | ||||||||||
| Long-term debt |
27,269 | — | — | — | 27,269 | |||||||||||||||
| Operating lease payments |
8,568 | 1,102 | 2,072 | 1,712 | 3,682 | |||||||||||||||
| Commitments to fund affordable housing investment |
440 | 316 | 124 | — | — | |||||||||||||||
| Time deposits |
194,439 | 147,506 | 31,083 | 15,850 | — | |||||||||||||||
| Total contractual cash obligations |
$ | 234,331 | $ | 152,539 | $ | 33,279 | $ | 17,562 | $ | 30,951 | ||||||||||
The following table reflects our other commitments outstanding as of December 31, 2010.
| Amount of Commitment Expiration Per Period | ||||||||||||||||||||
| Contractual Obligations |
Total Amounts Committed |
Within 1 Year |
2 - 3 Years |
4 - 5 Years |
After 5 Years |
|||||||||||||||
| (Dollars in thousands) | ||||||||||||||||||||
| Undisbursed portion of home equity credit lines secured by 1-4 family residential properties |
$ | 16,390 | $ | 2,593 | $ | 5,336 | $ | 7,101 | $ | 1,360 | ||||||||||
| Undisbursed portion of commercial real estate, construction and land development loans |
15,023 | 4,590 | 4,846 | 3,181 | 2,406 | |||||||||||||||
| Other commitments and lines of credit |
17,644 | 2,941 | 4,323 | 4,680 | 5,700 | |||||||||||||||
| Commitments to originate mortgage loans, fixed and variable |
70,907 | 70,907 | — | — | — | |||||||||||||||
| Standby letters of credit |
1,799 | 1,751 | 33 | 15 | — | |||||||||||||||
| Total commercial commitments |
$ | 121,763 | $ | 82,782 | $ | 14,538 | $ | 14,977 | $ | 9,466 | ||||||||||
Off-Balance Sheet Arrangements
Information about our off-balance sheet risk exposure is presented in Note L to the consolidated financial statements included in this report. As part of our ongoing business, we do not participate in transactions that generate relationships with unconsolidated entities or financial partnerships, such as entities often referred to as special purpose entities, or SPEs, which generally are established for the purpose of facilitating off-balance sheet arrangements or other contractually narrow or limited purposes. As of December 31, 2010, our sole SPE activity is with North State Statutory Trust I, North State Statutory Trust II and North State Statutory Trust III. We issued $5.2 million of junior subordinated debentures, included in long-term debt on the balance sheet, to each of these trusts on March 17, 2004, December 15, 2005 and November 28, 2007, respectively, in exchange for the proceeds of trust preferred securities issued by these trusts.
Recent Accounting Pronouncements
See Note B to our consolidated financial statements for a discussion of recent accounting pronouncements and management’s assessment of the potential impact on our consolidated financial statements.
Critical Accounting Policies
Our most significant critical accounting policies are the determination of our allowance for loan losses and periodic valuation of foreclosed assets. A critical accounting policy is one that is both very important to the portrayal of our financial condition and results, and requires our most difficult, subjective or complex judgments. What makes these judgments difficult, subjective and/or complex is the need to make estimates about the effects of matters that are inherently uncertain. If the mix and amount of future write-offs differ significantly from those assumptions we use in making our determination, the allowance for loan losses, valuation allowance on foreclosed assets and the provisions for loan losses and foreclosed assets on our income statement could be materially affected. For further discussion of the allowance for loan losses and a detailed description of the methodology we use in determining the adequacy of the allowance, see the section of this discussion titled “Asset Quality and the Allowance for Loan Losses” and Notes B and E to our consolidated financial statements contained in this report.
46
Table of Contents
QUARTERLY FINANCIAL DATA (UNAUDITED)
The following table sets forth, for the periods indicated, certain of our consolidated quarterly financial information. This information is derived from our unaudited financial statements, which include, in the opinion of management, all normal recurring adjustments which management considers necessary for a fair presentation of the results for such periods. This information should be read in conjunction with our consolidated financial statements included elsewhere in this report. The results for any quarter are not necessarily indicative of results for any future period.
| Selected Quarterly Financial Data (Unaudited) | ||||||||||||||||||||||||||||||||
| 2010 | 2009 | |||||||||||||||||||||||||||||||
| Fourth Quarter |
Third Quarter |
Second Quarter |
First Quarter |
Fourth Quarter |
Third Quarter |
Second Quarter |
First Quarter |
|||||||||||||||||||||||||
| (Dollars in thousands, except per share data) | ||||||||||||||||||||||||||||||||
| Operating Data: |
||||||||||||||||||||||||||||||||
| Total interest income |
$ | 7,720 | $ | 7,853 | $ | 7,789 | $ | 7,600 | $ | 7,948 | $ | 8,384 | $ | 8,512 | $ | 8,596 | ||||||||||||||||
| Total interest expense |
1,590 | 1,770 | 1,971 | 2,157 | 2,261 | 2,992 | 3,110 | 3,483 | ||||||||||||||||||||||||
| Net interest income |
6,130 | 6,083 | 5,818 | 5,443 | 5,687 | 5,392 | 5,402 | 5,113 | ||||||||||||||||||||||||
| Provision for loan losses |
3,067 | 2,166 | 1,612 | 1,250 | 2,086 | 1,840 | 899 | 885 | ||||||||||||||||||||||||
| Net interest income after provision |
3,063 | 3,917 | 4,206 | 4,193 | 3,601 | 3,552 | 4,503 | 4,228 | ||||||||||||||||||||||||
| Noninterest income |
1,593 | 1,572 | 725 | 586 | 204 | 194 | 93 | 677 | ||||||||||||||||||||||||
| Noninterest expense |
4,861 | 4,895 | 4,377 | 3,903 | 4,423 | 3,453 | 3,752 | 3,509 | ||||||||||||||||||||||||
| Income (loss) before income taxes |
(205 | ) | 594 | 554 | 876 | (618 | ) | 293 | 844 | 1,396 | ||||||||||||||||||||||
| Provision for income taxes |
(66 | ) | 255 | 244 | 362 | (229 | ) | 132 | 351 | 563 | ||||||||||||||||||||||
| Net income (loss) |
$ | (139 | ) | $ | 339 | $ | 310 | $ | 514 | $ | (389 | ) | $ | 161 | $ | 493 | $ | 833 | ||||||||||||||
| Per Share Data: |
||||||||||||||||||||||||||||||||
| Net income (loss): |
||||||||||||||||||||||||||||||||
| Basic |
$ | (0.02 | ) | $ | 0.05 | $ | 0.04 | $ | 0.07 | $ | (0.05 | ) | $ | 0.02 | $ | 0.07 | $ | 0.12 | ||||||||||||||
| Diluted |
$ | (0.02 | ) | $ | 0.05 | $ | 0.04 | $ | 0.07 | $ | (0.05 | ) | $ | 0.02 | $ | 0.07 | $ | 0.11 | ||||||||||||||
| Common stock price: |
||||||||||||||||||||||||||||||||
| High |
$ | 4.25 | $ | 4.40 | $ | 4.50 | $ | 5.00 | $ | 6.95 | $ | 7.99 | $ | 6.50 | $ | 8.00 | ||||||||||||||||
| Low |
2.75 | 3.58 | 3.50 | 3.90 | 2.76 | 5.10 | 4.75 | 5.45 | ||||||||||||||||||||||||
| Close |
3.51 | 4.25 | 3.50 | 4.40 | 4.25 | 6.00 | 6.50 | 5.75 | ||||||||||||||||||||||||
| Tangible book value |
5.03 | 5.11 | 5.08 | 5.06 | 5.02 | 5.10 | 5.06 | 5.03 | ||||||||||||||||||||||||
| Item 7A. | Quantitative and Qualitative Disclosures About Market Risk. |
Market risk reflects the risk of economic loss resulting from adverse changes in market price and interest rates. This risk of loss can be reflected in diminished current market values and/or reduced potential net interest income in future periods.
The largest component of our earnings is net interest income which can fluctuate widely, directly impacting our overall earnings. Significant interest rate movements occur due to differing maturities or repricing intervals of our interest-earning assets and interest-bearing liabilities and the fact that rates on these financial instruments do not change uniformly. Management is responsible for minimizing our exposure to interest rate risk. This is accomplished by developing objectives, goals and strategies designed to enhance profitability and performance while minimizing our overall interest rate risk.
We use several modeling techniques to measure interest rate risk. Our primary method is the simulation of net interest income under varying interest rate scenarios. We believe this methodology is reliable in that it takes into account the pricing strategies we would undertake in response to rate changes, whereas other methods such as interest rate shock or balance sheet gap analysis do not take these into consideration. Our balance sheet remains asset-sensitive, which means that more assets than liabilities are subject to immediate repricing as market rates change. During periods of rising rates, this should result in increased interest income. The opposite would be expected during periods of declining rates.
In addition to simulation of net interest income, we utilize a discounted net present value of cash flow analysis called Economic Value of Equity or “EVE”. This methodology aids management in identifying long-term interest rate risk. Additional discussion of EVE is presented in Item 7, under “Asset/Liability Management”.
47
Table of Contents
Our hedging strategy is generally intended to take advantage of opportunities to reduce, to the extent possible, unpredictable cash flows. We may use a variety of commonly used derivative products that are instruments used by financial institutions to manage interest rate risk. The products that may be used as part of a hedging strategy include swaps, caps, floors and collars. We previously have used a stand-alone derivative financial instrument, in the form of an interest rate floor, in our asset/liability management program. Additional discussion of derivatives is presented in Note L to our consolidated financial statements included under Item 8 of Part II in this Form 10-K.
| Item 8. | Financial Statements and Supplemental Data. |
The information required by this Item is found beginning at page F-1 of this report.
| Item 9. | Changes in and Disagreements with Accountants on Accounting and Financial Disclosure. |
Not applicable.
| Item 9A. | Controls and Procedures. |
Disclosure Controls and Procedures
Our management, under the supervision and with the participation of our Chief Executive Officer and Chief Financial Officer, carried out an evaluation of our disclosure controls and procedures as defined in Rule 13a-15(e) of the Securities Exchange Act of 1934, as amended, or the Exchange Act. Based on that evaluation, the Chief Executive Officer and Chief Financial Officer concluded that our disclosure controls and procedures were effective as of December 31, 2010.
Management’s Report on Internal Control over Financial Reporting
Our management is responsible for establishing and maintaining adequate internal control over financial reporting as defined in Rule 13a-15(f) of the Exchange Act. Our internal control over financial reporting is a process designed to provide reasonable assurance regarding the reliability of financial reporting and the preparation of financial statements for external purposes in accordance with accounting principles generally accepted in the United States of America.
Under the supervision and with the participation of management, including the Chief Executive Officer and the Chief Financial Officer, we conducted an evaluation of the effectiveness of our internal control over financial reporting based on the framework in “Internal Control — Integrated Framework” promulgated by the Committee of Sponsoring Organizations of the Treadway Commission, commonly referred to as the “COSO” criteria. Based on this evaluation under the COSO criteria, management concluded that our internal control over financial reporting was effective as of December 31, 2010.
Because of its inherent limitations, internal control over financial reporting cannot provide absolute assurance of achieving financial reporting objectives. Internal control over financial reporting is a process that involves human adherence to and compliance with policies and procedures. It is subject to lapses in judgment and breakdowns resulting from human failures. Also, projections of any evaluation of effectiveness to future periods are subject to the risk that controls may become inadequate due to changes in conditions, or that the degree of compliance with the policies and procedures may deteriorate.
This annual report does not include an attestation report of our registered public accounting firm regarding internal control over financial reporting. Management’s report was not subject to attestation by our registered public accounting firm pursuant to rules of the SEC that permit us to provide only management’s report in this annual report.
There was no change in our internal control over financial reporting that occurred during the fourth quarter of 2010 that has materially affected or is likely to materially affect our internal control over financial reporting.
| Item 9B. | Other Information. |
Not applicable.
PART III
| Item 10. | Directors, Executive Officers, and Corporate Governance. |
The information required by this Item concerning our directors and executive officers is incorporated by reference from the sections captioned “Proposal No. 1 - Election of Directors”, “Other Information – Other Directors” and “Other Information - Executive Officers” contained in our proxy statement related to the 2011 Annual Meeting of Shareholders scheduled to be held on
48
Table of Contents
June 2, 2011. The information required by this Item concerning compliance with Section 16(a) of the United States Securities Exchange Act is incorporated by reference from the section of our proxy statement captioned “Section 16(a) Beneficial Ownership Reporting Compliance.”
The information required by this Item concerning our “audit committee financial expert” is contained under the section captioned “Other Information-Report of the Audit Committee” contained in our proxy statement for the 2010 Annual Meeting of Shareholders.
Our Board of Directors has adopted a code of ethics for our Chief Executive Officer, Chief Financial Officer and any other senior accounting officer or other persons performing similar functions. We will provide copies of our code of ethics without charge upon request. To obtain a copy of our code of ethics, please send your written request to North State Bancorp, 6204 Falls of the Neuse Road, Raleigh, North Carolina 27609, Attention: Stacey Koble.
Since the date of our proxy statement for our 2010 Annual Meeting of Shareholders, we have not made any material change to the procedures by which our shareholders may recommend nominees to our Board of Directors. Those procedures are discussed under the section captioned “Director Nominations” in our proxy statement for the 2011 Annual Meeting of Shareholders.
| Item 11. | Executive Compensation. |
The information required by this Item is incorporated by reference to the information under the sections captioned “Executive Compensation”, “Other Information – Compensation Discussion and Analysis”, “Employment and Change in Control Agreements” , “Other Information – Compensation Committee Report”, “Other Information – Compensation Committee Interlocks and Insider Participation”, and “Other Information - Director Compensation” contained in our proxy statement for the 2011 Annual Meeting of Shareholders .
| Item 12. | Security Ownership of Certain Beneficial Owners and Management and Related Stockholder Matters. |
The information required by this Item is incorporated by reference to the information under the section captioned “Security Ownership of Management and Certain Beneficial Owners” contained in our proxy statement for the 2011 Annual Meeting of Shareholders and in Part II, Item 5 of this report.
| Item 13. | Certain Relationships and Related Transactions, and Director Independence. |
The information required by this Item is incorporated by reference to the information under the section captioned “Certain Transactions” contained in our proxy statement for the 2011 Annual Meeting of Shareholders.
| Item 14. | Principal Accountant Fees and Services. |
The information required by this Item is incorporated by reference to the information under the section captioned “Report of the Audit Committee” contained in our proxy statement for the 2011 Annual Meeting of Shareholders.
49
Table of Contents
| Item 15. | Exhibits and Financial Statement Schedules. |
| (A) | Exhibits |
| Exhibit No. |
Exhibit Title | |
| 3.1(a) | Articles of Incorporation, amended as of May 9, 2007 | |
| 3.2(l) | Bylaws adopted June 7, 2002, amended as of March 24, 2010 | |
| 4.1(a) | Form of North State Bancorp stock certificate | |
| 4.2(f) | Amended and Restated Declaration of Trust by and among U.S. Bank National Association, as Institutional Trustee, North State Bancorp, as Sponsor, and Larry D. Barbour and Kirk A. Whorf as administrators, dated as of March 17, 2004 | |
| 4.3(f) | Indenture dated as of March 17, 2004, between North State Bancorp, as Issuer and U.S. Bank National Association, as Trustee | |
| 4.4(b) | Amended and Restated Declaration of Trust by and among Wilmington Trust Company, as Delaware Trustee, Wilmington Trust Company, as Institutional Trustee, North State Bancorp, as Sponsor, and Larry D. Barbour and Kirk A. Whorf as administrators, dated as of December 15, 2005 | |
| 4.5(b) | Indenture dated as of December 15, 2005, between North State Bancorp, as Issuer and Wilmington Trust Company, as Trustee | |
| 4.6(h) | Amended and Restated Declaration of Trust by and among Wells Fargo Delaware Trust Company, as Delaware Trustee, Wells Fargo Bank, N.A., as Property Trustee, North State Bancorp, as Depositor, and Kirk A. Whorf, Sandra A. Temple and David M. Shipp as administrators, dated as of November 28, 2007 | |
| 4.7(h) | Junior Subordinated Indenture dated as of November 28, 2007, between North State Bancorp, as Issuer and Wells Fargo Bank, N.A., as Trustee | |
| 10.1(c) | Stock Option Plan for Non-Employee Directors, assumed as of June 28, 2002 | |
| 10.2(c) | Stock Option Plan for Employees, assumed as of June 28, 2002 | |
| 10.3(l) | Employment Agreement between North State Bank and Larry D. Barbour, dated as of June 1, 2000, as amended on December 30, 2009 | |
| 10.4(l) | Change in Control Agreement between North State Bank and Kirk A. Whorf, dated as of December 30, 2009 | |
| 10.6(l) | Change in Control Agreement between North State Bank and Sandra A. Temple, dated as of December 30, 2009 | |
| 10.7(e) | 2003 Stock Plan | |
| 10.8(f) | Guarantee Agreement dated as of March 17, 2004, by and between North State Bancorp and U.S. Bank National Association | |
| 10.9(b) | Guarantee Agreement dated as of December 15, 2005, by and between North State Bancorp and Wilmington Trust Company | |
50
Table of Contents
| 10.11(f) | Lease dated May 1, 2003 between North State Bancorp and NHM00, LLC. | |
| 10.12(g) | Assignment and Assumption of Lease effective January 14, 2000 among North State Bank, Oberlin Investors Two, LLC and Branch Banking & Trust Company. | |
| 10.13(g) | Office Lease dated April 10, 2000 between North State Bank and Oberlin Investors Two, LLC (including Amendment No. One dated March 29, 2001). | |
| 10.14(i) | Lease agreement dated as of December 29, 2006 by and between North State Bank and Atrium Investments, LLC | |
| 10.15(i) | Lease agreement dated as of November 1, 2006 between North State Bancorp and Capital Club Properties, LLC | |
| 10.16(h) | Guarantee Agreement dated as of November 28, 2007, by and between North State Bancorp and Wells Fargo Bank, N.A. | |
| 10.17(j) | Change in Control Agreement between North State Bank and David M. Shipp, dated September 10, 2007 | |
| 10.18(k) | Fiscal and Paying Agent Agreement, dated May 13, 2008, between North State Bank and Wilmington Trust Company (including form of Floating Rate Subordinated Note due June 30, 2018) | |
| 10.19(l) | Employment Agreement between North State Bank and J. Kenneth Sykes, dated February 12, 2010 | |
| 21.1(l) | List of Subsidiaries | |
| 23 | Consent of Dixon Hughes PLLC | |
| 31.1 | Certification pursuant to Rule 13a-14(a) | |
| 31.2 | Certification pursuant to Rule 13a-14(a) | |
| 32 | Certifications pursuant to 18 U.S.C. Section 1350 as adopted pursuant to Section 906 of the Sarbanes-Oxley Act of 2002 | |
| (a) | Incorporated by reference to exhibits filed with our Quarterly Report of Form 10-Q filed on May 15, 2007. |
| (b) | Incorporated by reference to exhibits filed with our Current Report on Form 8-K filed on December 20, 2005. |
| (c) | Incorporated by reference to exhibits filed with our Registration Statement on Form S-8 filed on July 31, 2002 (Registration Statement No. 333-97419). |
| (d) | Incorporated by reference to exhibits filed with our Annual Report on Form 10-KSB for the year ended December 31, 2002. |
| (e) | Incorporated by reference to exhibits filed with our Registration Statement on Form S-8 filed on July 25, 2003 (Registration Statement No. 333-107337). |
| (f) | Incorporated by reference to exhibits filed with our Annual Report on Form 10-KSB for the year ended December 31, 2005. |
| (g) | Incorporated by reference to exhibits filed with our Quarterly Report on Form 10-QSB for the quarter ended March 31, 2005. |
| (h) | Incorporated by reference to exhibits filed with our Current Report on Form 8-K filed on November 30, 2007. |
| (i) | Incorporated by reference to exhibits filed with our Annual Report on Form 10-KSB for the year ended December 31, 2006. |
| (j) | Incorporated by reference to exhibits filed with our Annual Report on Form 10-K for the year ended December 31, 2007. |
51
Table of Contents
| (k) | Incorporated by reference to exhibits filed with our Quarterly Report on Form 10-Q for the quarter ended June 30, 2008. |
| (l) | Incorporated by reference to exhibits filed with our Annual Report on Form 10-K for the year ended December 31, 2010. |
52
Table of Contents
ITEM 8 – FINANCIAL STATEMENTS
NORTH STATE BANCORP
INDEX TO THE CONSOLIDATED FINANCIAL STATEMENTS
F-1
Table of Contents

REPORT OF INDEPENDENT REGISTERED PUBLIC ACCOUNTING FIRM
To the Shareholders and the Board of Directors
North State Bancorp
Raleigh, North Carolina
We have audited the accompanying consolidated balance sheets of North State Bancorp and subsidiary (the “Company”) as of December 31, 2010 and 2009, and the related consolidated statements of operations, comprehensive income, changes in shareholders’ equity and cash flows for each of the years in the three-year period ended December 31, 2010. These consolidated financial statements are the responsibility of the Company’s management. Our responsibility is to express an opinion on these consolidated financial statements based on our audits.
We conducted our audits in accordance with the standards of the Public Company Accounting Oversight Board (United States). Those standards require that we plan and perform the audit to obtain reasonable assurance about whether the financial statements are free of material misstatement. We were not engaged to perform an audit of the Company’s internal control over financial reporting. Our audit included consideration of internal control over financial reporting as a basis for designing audit procedures that are appropriate in the circumstances, but not for the purpose of expressing an opinion on the effectiveness of the Company’s internal control over financial reporting. Accordingly, we express no such opinion. An audit includes examining, on a test basis, evidence supporting the amounts and disclosures in the financial statements. An audit also includes assessing the accounting principles used and significant estimates made by management, as well as evaluating the overall financial statement presentation. We believe that our audits provide a reasonable basis for our opinion.
In our opinion, the consolidated financial statements referred to above present fairly, in all material respects, the financial position of North State Bancorp and subsidiary at December 31, 2010 and 2009 and the results of their operations and their cash flows for each of the years in the three-year period ended December 31, 2010 in conformity with accounting principles generally accepted in the United States of America.
/s/ Dixon-Hughes PLLC
Greenville, North Carolina
March 31, 2011
F-2
Table of Contents
CONSOLIDATED BALANCE SHEETS
December 31, 2010 and 2009
| 2010 | 2009 | |||||||
| (Dollars in thousands) | ||||||||
| ASSETS |
||||||||
| Cash and due from banks |
$ | 5,974 | $ | 8,096 | ||||
| Interest-earning deposits with banks |
43,859 | 50,987 | ||||||
| Certificates of deposit with banks |
198 | 50,196 | ||||||
| Investment securities available for sale, at fair value |
9,234 | 23,398 | ||||||
| Investment securities held to maturity, at amortized cost |
250 | 750 | ||||||
| Loans held for sale |
51,472 | — | ||||||
| Loans |
499,523 | 521,809 | ||||||
| Less allowances for loan losses |
9,935 | 8,581 | ||||||
| NET LOANS |
489,588 | 513,228 | ||||||
| Accrued interest receivable |
1,654 | 1,811 | ||||||
| Stock in the Federal Home Loan Bank of Atlanta, at cost |
1,273 | 1,275 | ||||||
| Premises and equipment, net |
14,801 | 14,846 | ||||||
| Foreclosed assets |
5,296 | 3,271 | ||||||
| Prepaid FDIC insurance |
3,646 | 4,859 | ||||||
| Other assets |
6,620 | 6,712 | ||||||
| TOTAL ASSETS |
$ | 633,865 | $ | 679,429 | ||||
| LIABILITIES AND SHAREHOLDERS’ EQUITY |
||||||||
| Deposits: |
||||||||
| Demand |
$ | 117,840 | $ | 104,904 | ||||
| Savings, money market and NOW |
250,469 | 232,706 | ||||||
| Time |
194,439 | 269,278 | ||||||
| TOTAL DEPOSITS |
562,748 | 606,888 | ||||||
| Accrued interest payable |
1,181 | 1,724 | ||||||
| Short-term borrowings |
3,615 | 6,103 | ||||||
| Long-term borrowings |
27,269 | 27,290 | ||||||
| Accrued expenses and other liabilities |
1,550 | 1,258 | ||||||
| TOTAL LIABILITIES |
596,363 | 643,263 | ||||||
| Commitments |
||||||||
| Shareholders’ equity: |
||||||||
| Preferred stock, no par value, 1,000,000 shares authorized, none issued |
— | — | ||||||
| Common stock, no par value; 10,000,000 shares authorized |
||||||||
| 7,427,976 and 7,198,513 shares issued and outstanding |
||||||||
| December 31, 2010 and 2009, respectively |
21,636 | 20,865 | ||||||
| Retained earnings |
15,926 | 14,902 | ||||||
| Accumulated other comprehensive income (loss) |
(60 | ) | 399 | |||||
| TOTAL SHAREHOLDERS’ EQUITY |
37,502 | 36,166 | ||||||
| TOTAL LIABILITIES AND SHAREHOLDERS’ EQUITY |
$ | 633,865 | $ | 679,429 | ||||
See accompanying notes.
F-3
Table of Contents
CONSOLIDATED STATEMENTS OF OPERATIONS
Years Ended December 31, 2010, 2009 and 2008
| 2010 | 2009 | 2008 | ||||||||||
| (Dollars in thousands, except per share data) | ||||||||||||
| INTEREST INCOME |
||||||||||||
| Loans |
$ | 28,288 | $ | 31,257 | $ | 34,318 | ||||||
| Loans held for sale |
1,472 | — | — | |||||||||
| Investment securities: |
||||||||||||
| Taxable |
603 | 1,146 | 1,207 | |||||||||
| Tax-exempt |
— | 5 | 162 | |||||||||
| Federal funds sold |
— | — | 129 | |||||||||
| Dividends and interest-earning deposits |
599 | 1,032 | 259 | |||||||||
| TOTAL INTEREST INCOME |
30,962 | 33,440 | 36,075 | |||||||||
| INTEREST EXPENSE |
||||||||||||
| Money market, NOW and savings deposits |
2,066 | 2,062 | 4,644 | |||||||||
| Time deposits |
4,482 | 8,673 | 9,346 | |||||||||
| Short-term borrowings |
19 | 33 | 356 | |||||||||
| Long-term borrowings |
921 | 1,078 | 1,471 | |||||||||
| TOTAL INTEREST EXPENSE |
7,488 | 11,846 | 15,817 | |||||||||
| NET INTEREST INCOME |
23,474 | 21,594 | 20,258 | |||||||||
| PROVISION FOR LOAN LOSSES |
8,095 | 5,710 | 2,755 | |||||||||
| NET INTEREST INCOME AFTER PROVISION FOR LOAN LOSSES |
15,379 | 15,884 | 17,503 | |||||||||
| NON-INTEREST INCOME |
4,476 | 1,168 | 1,226 | |||||||||
| NON-INTEREST EXPENSE |
||||||||||||
| Salaries and employee benefits |
8,400 | 6,430 | 8,131 | |||||||||
| Occupancy and equipment |
2,774 | 2,758 | 2,509 | |||||||||
| Other |
6,862 | 5,949 | 4,169 | |||||||||
| TOTAL NON-INTEREST EXPENSE |
18,036 | 15,137 | 14,809 | |||||||||
| INCOME BEFORE INCOME TAXES |
1,819 | 1,915 | 3,920 | |||||||||
| INCOME TAXES |
795 | 817 | 1,555 | |||||||||
| NET INCOME |
$ | 1,024 | $ | 1,098 | $ | 2,365 | ||||||
| NET INCOME PER COMMON SHARE |
||||||||||||
| Basic |
$ | .14 | $ | .15 | $ | .33 | ||||||
| Diluted |
$ | .14 | $ | .15 | $ | .32 | ||||||
| WEIGHTED AVERAGE COMMON SHARES OUTSTANDING |
||||||||||||
| Basic |
7,363,618 | 7,179,744 | 7,158,545 | |||||||||
| Diluted |
7,389,397 | 7,316,292 | 7,356,364 | |||||||||
See accompanying notes.
F-4
Table of Contents
CONSOLIDATED STATEMENTS OF COMPREHENSIVE INCOME
Years Ended December 31, 2010, 2009 and 2008
| 2010 | 2009 | 2008 | ||||||||||
| (Dollars in thousands) | ||||||||||||
| Net income |
$ | 1,024 | $ | 1,098 | $ | 2,365 | ||||||
| Other comprehensive income (loss): |
||||||||||||
| Securities available for sale: |
||||||||||||
| Unrealized holding gains (losses) on available for sale securities |
(6 | ) | 137 | 873 | ||||||||
| Tax effect |
2 | (53 | ) | (337 | ) | |||||||
| Reclassification of net gain recognized in net income |
(741 | ) | (464 | ) | (7 | ) | ||||||
| Tax effect |
286 | 179 | 3 | |||||||||
| Net of tax amount |
(459 | ) | (201 | ) | 532 | |||||||
| Cash flow hedging activities: |
||||||||||||
| Unrealized holding gains on hedging activities |
— | — | 900 | |||||||||
| Tax effect |
— | — | (370 | ) | ||||||||
| Reclassification of gains recognized in net income |
— | (804 | ) | (777 | ) | |||||||
| Tax effect |
— | 310 | 300 | |||||||||
| Net of tax amount |
— | (494 | ) | 53 | ||||||||
| Total other comprehensive income (loss) |
(459 | ) | (695 | ) | 585 | |||||||
| Comprehensive income |
$ | 565 | $ | 403 | $ | 2,950 | ||||||
See accompanying notes.
F-5
Table of Contents
CONSOLIDATED STATEMENTS OF CHANGES IN SHAREHOLDERS’ EQUITY
Years Ended December 31, 2010, 2009 and 2008
| Accumulated other comprehensive income (loss) |
||||||||||||||||||||
| Total shareholders’ equity |
||||||||||||||||||||
| Common stock | Retained earnings |
|||||||||||||||||||
| Shares | Amount | |||||||||||||||||||
| (Dollars in thousands) | ||||||||||||||||||||
| Balance at December 31, 2007 |
6,974,604 | $ | 19,609 | $ | 11,439 | $ | 509 | $ | 31,557 | |||||||||||
| Net income |
— | — | 2,365 | — | 2,365 | |||||||||||||||
| Other comprehensive income, net of tax |
— | — | — | 585 | 585 | |||||||||||||||
| Stock based compensation |
— | 155 | — | — | 155 | |||||||||||||||
| Stock options exercised including income tax benefit of $341 |
196,664 | 884 | — | — | 884 | |||||||||||||||
| Balance at December 31, 2008 |
7,171,268 | 20,648 | 13,804 | 1,094 | 35,546 | |||||||||||||||
| Net income |
— | — | 1,098 | — | 1,098 | |||||||||||||||
| Other comprehensive loss, net of tax |
— | — | — | (695 | ) | (695 | ) | |||||||||||||
| Stock based compensation |
— | 119 | — | — | 119 | |||||||||||||||
| Stock options exercised including income tax benefit of $9 |
27,245 | 98 | — | — | 98 | |||||||||||||||
| Balance at December 31, 2009 |
7,198,513 | 20,865 | 14,902 | 399 | 36,166 | |||||||||||||||
| Net income |
— | — | 1,024 | — | 1,024 | |||||||||||||||
| Other comprehensive loss, net of tax |
— | — | — | (459 | ) | (459 | ) | |||||||||||||
| Stock based compensation |
— | 100 | — | — | 100 | |||||||||||||||
| Stock options exercised including income tax benefit of $60 |
229,463 | 671 | — | — | 671 | |||||||||||||||
| Balance at December 31, 2010 |
7,427,976 | $ | 21,636 | $ | 15,926 | $ | (60 | ) | $ | 37,502 | ||||||||||
See accompanying notes.
F-6
Table of Contents
CONSOLIDATED STATEMENTS OF CASH FLOWS
Years Ended December 31, 2010, 2009 and 2008
| 2010 | 2009 | 2008 | ||||||||||
| (Dollars in thousands) | ||||||||||||
| CASH FLOWS FROM OPERATING ACTIVITIES |
||||||||||||
| Net income |
$ | 1,024 | $ | 1,098 | $ | 2,365 | ||||||
| Adjustments to reconcile net income to net cash provided (used) by operating activities: |
||||||||||||
| Depreciation and amortization |
927 | 914 | 808 | |||||||||
| Net amortization (accretion) of premiums on investment securities |
(13 | ) | — | 36 | ||||||||
| Amortization of investment accounted for under the cost method |
47 | 19 | — | |||||||||
| Impairment loss on nonmarketable securities |
— | 134 | — | |||||||||
| Provision for loan losses |
8,095 | 5,710 | 2,755 | |||||||||
| Provision for foreclosed assets |
1,148 | 697 | — | |||||||||
| Stock based compensation |
100 | 119 | 155 | |||||||||
| Amortization of gain on termination of derivative instrument |
— | (804 | ) | (777 | ) | |||||||
| Gain on sale of equity interest in investment |
— | (18 | ) | — | ||||||||
| Originations of mortgage loans held for sale |
(363,278 | ) | — | — | ||||||||
| Proceeds from sales of mortgage loans held for sale |
312,634 | — | — | |||||||||
| Net realized gain on call and sale of securities available for sale |
(741 | ) | (464 | ) | (7 | ) | ||||||
| Net loss on sale of foreclosed assets |
183 | 38 | — | |||||||||
| Deferred income taxes |
(987 | ) | (213 | ) | (388 | ) | ||||||
| Change in assets and liabilities: |
||||||||||||
| Decrease (increase) in accrued interest receivable |
157 | 360 | (81 | ) | ||||||||
| Decrease (increase) in other assets |
2,705 | (6,675 | ) | (1,324 | ) | |||||||
| Decrease in accrued interest payable |
(543 | ) | (519 | ) | (268 | ) | ||||||
| Increase (decrease) in accrued expenses and other liabilities |
(208 | ) | (763 | ) | 97 | |||||||
| NET CASH PROVIDED (USED) BY OPERATING ACTIVITIES |
(38,750 | ) | (367 | ) | 3,371 | |||||||
| CASH FLOWS FROM INVESTING ACTIVITIES |
||||||||||||
| Net change in certificates of deposit with banks |
49,998 | (28,354 | ) | (21,842 | ) | |||||||
| Proceeds from maturities and repayments of investment securities available for sale |
17,107 | 6,491 | 8,883 | |||||||||
| Proceeds from call and sales of investment securities available for sale |
21,049 | 17,157 | 5,786 | |||||||||
| Purchase of securities available for sale |
(23,985 | ) | (10,503 | ) | (15,396 | ) | ||||||
| Purchase of investment securities held to maturity |
— | — | (750 | ) | ||||||||
| Net (increase) decrease in loans |
6,862 | 18,667 | (80,804 | ) | ||||||||
| Redemption (purchase) of Federal Home Loan Bank stock |
2 | (252 | ) | 464 | ||||||||
| Purchases of premises and equipment |
(882 | ) | (3,472 | ) | (2,633 | ) | ||||||
| Proceeds from termination of derivative instrument |
— | — | 1,905 | |||||||||
| Proceeds from sales of foreclosed assets |
5,996 | 782 | — | |||||||||
| Proceeds from sale of equity interest in investment |
— | 32 | — | |||||||||
| Capital expenditures on foreclosed assets |
(169 | ) | (136 | ) | — | |||||||
| Purchase of investment accounted for under the cost method |
(500 | ) | — | (447 | ) | |||||||
| NET CASH PROVIDED (USED) BY INVESTING ACTIVITIES |
75,478 | 412 | (104,834 | ) | ||||||||
| CASH FLOWS FROM FINANCING ACTIVITIES |
||||||||||||
| Net increase (decrease) in deposits |
(44,140 | ) | (5,790 | ) | 155,368 | |||||||
| Net change in short term borrowings |
(2,488 | ) | (1,679 | ) | (30,104 | ) | ||||||
| Proceeds from long-term debt borrowings |
— | — | 11,000 | |||||||||
| Repayments in long-term debt |
(21 | ) | (21 | ) | (21 | ) | ||||||
| Excess tax benefits from exercise of stock options |
60 | 9 | 341 | |||||||||
| Proceeds from exercise of stock options |
611 | 89 | 543 | |||||||||
| NET CASH PROVIDED (USED) BY FINANCING ACTIVITIES |
(45,978 | ) | (7,392 | ) | 137,127 | |||||||
See accompanying notes.
F-7
Table of Contents
NORTH STATE BANCORP
CONSOLIDATED STATEMENTS OF CASH FLOWS (Continued)
Years Ended December 31, 2010, 2009 and 2008
| 2010 | 2009 | 2008 | ||||||||||
| (Dollars in thousands) | ||||||||||||
| NET INCREASE (DECREASE) IN CASH AND CASH EQUIVALENTS |
(9,250 | ) | (7,347 | ) | 35,664 | |||||||
| CASH AND CASH EQUIVALENTS, BEGINNING |
59,083 | 66,430 | 30,766 | |||||||||
| CASH AND CASH EQUIVALENTS, ENDING |
$ | 49,833 | $ | 59,083 | $ | 66,430 | ||||||
| SUPPLEMENTAL DISCLOSURES OF CASH FLOW INFORMATION | ||||||||||||
| Interest paid |
$ | 8,030 | $ | 12,365 | $ | 16,085 | ||||||
| Income taxes paid |
551 | 1,535 | 1,723 | |||||||||
| SUPPLEMENTAL DISCLOSURES OF NONCASH INVESTING ACTIVITIES |
||||||||||||
| Unrealized (loss) gain on investment securities available for sale, net of tax |
$ | (459 | ) | $ | (201 | ) | $ | 532 | ||||
| Unrealized gain (loss) on hedging activities, net of tax |
— | (494 | ) | 53 | ||||||||
| Transfer of loans to foreclosed assets |
9,183 | 2,376 | 2,276 | |||||||||
See accompanying notes.
F-8
Table of Contents
NOTES TO CONSOLIDATED FINANCIAL STATEMENTS
Years Ended December 31, 2010, 2009 and 2008
NOTE A - ORGANIZATION AND OPERATIONS
On June 28, 2002, North State Bancorp (the “Company”) was formed as a holding company for North State Bank (the “Bank”). Upon formation, one share of the Company’s $1 par value common stock was exchanged for each of the outstanding shares of the Bank’s $5 par value common stock. On May 9, 2007, the Company’s shareholders approved the decrease of the Company’s par value of common stock from $1.00 per share to no par value per share. The Company currently has no operations and conducts no business on its own other than owning the Bank, North State Statutory Trust I, North State Statutory Trust II and North State Statutory Trust III, all of which are wholly-owned subsidiaries of the Company. The Company is subject to the rules and regulations of the Federal Reserve Bank and the North Carolina Commissioner of Banks.
The Bank was incorporated May 25, 2000 and began banking operations on June 1, 2000. The Bank is engaged in general commercial and retail banking in central North Carolina, principally Wake County, and in southeast North Carolina in New Hanover County, operating under the banking laws of North Carolina and the rules and regulations of the Federal Deposit Insurance Corporation and the North Carolina Commissioner of Banks. The Bank undergoes periodic examinations by those regulatory authorities. The Bank’s wholly-owned subsidiary, North State Bank Financial Services, Inc., offers wealth management and brokerage services. North State Bank Mortgage (“NSB Mortgage”), a division of the Bank, began operations during February 2010 for the purpose of originating and selling single-family, residential first mortgage loans.
NOTE B - SUMMARY OF SIGNIFICANT ACCOUNTING POLICIES
Basis of Presentation
The accompanying consolidated financial statements include the accounts and transactions of North State Bancorp and its wholly owned subsidiary North State Bank. All significant intercompany transactions and balances are eliminated in consolidation. North State Bancorp and its subsidiary are collectively referred to herein as the “Company”.
Under Financial Accounting Standards Board (“FASB”) accounting pronouncement for the consolidation of variable interest entities, North State Statutory Trust I, North State Statutory Trust II and North State Statutory Trust III are not included in the Company’s consolidated financial statements. The junior subordinated debentures issued by the Company to the three Trusts are included in long-term debt and the Company’s equity interest in the three Trusts is included in other assets.
Use of Estimates
The preparation of consolidated financial statements in conformity with accounting principles generally accepted in the United States of America requires management to make estimates and assumptions that affect the reported amounts of assets and liabilities and the disclosure of contingent assets and liabilities at the date of the financial statements and the reported amounts of revenues and expenses during the reporting period. Actual results could differ from those estimates. Material estimates that are particularly susceptible to significant change relate to the determination of the allowance for loan losses.
Cash and Cash Equivalents
For the purpose of presentation in the statement of cash flows, cash and cash equivalents include cash and due from banks, interest-earning deposits with banks and federal funds sold.
Certificates of Deposit with Banks
Certificates of deposits with banks typically have an original maturity of one year or less and currently bear interest at a rate of 1.15% and are all scheduled to mature in January 2011.
Investment Securities
Available for sale securities are reported at fair value and consist of debt instruments not classified as trading securities or as held to maturity securities. Unrealized holding gains and losses on available for sale securities are reported, net of related tax effect, in other comprehensive income. Gains and losses on the sale of available for sale securities are determined using the specific-identification method. Bonds and mortgage-backed securities for which the Company has the positive intent and ability to hold to maturity are reported at cost, adjusted for premiums and discounts that are recognized in interest income using a method that approximates the interest method over the period to maturity. Declines in the fair value of available for sale and held to maturity securities below their cost that are other than temporary would result in write-downs of the individual securities to their fair value. If the Company does not intend to sell the security prior to recovery and it is more likely than not the Company will not be required to sell the impaired security prior to recovery, the credit loss portion of the impairment is recognized in earnings and the remaining impairment is recognized in other comprehensive income. Otherwise, the full impairment loss is recognized in earnings. The classification of securities is generally determined at the date of purchase.
F-9
Table of Contents
NORTH STATE BANCORP
NOTES TO CONSOLIDATED FINANCIAL STATEMENTS
Years Ended December 31, 2010, 2009 and 2008
NOTE B - SUMMARY OF SIGNIFICANT ACCOUNTING POLICIES (Continued)
Investment Securities (Continued)
Certain equity security investments that do not have readily determinable fair values and for which the Company does not exercise significant influence are carried at cost. As a requirement for membership, the Company invests in stock of the Federal Home Loan Bank of Atlanta (“FHLB”). As of December 31, 2010 and 2009, these equity securities totaled $1.3 million. Due to the redemption provisions of the FHLB, the Company estimates that fair value equals cost. All the equity securities are reviewed for impairment at least annually or sooner if events or changes in circumstances indicate the carrying value may not be recoverable. For the year ended December 31, 2009, the Company recorded an impairment loss of $134,000 on stock owned in Silverton Bank.
Loans Held for Sale
Loans held for sale represent single-family, residential first mortgage loans on a pre-sold basis originated by our mortgage division. Generally, commitments to sell these loans are made after the intent to proceed with mortgage applications are initiated with borrowers, and all necessary components of the loan are approved according to secondary market underwriting by the investor that purchases the loan. Upon closing, these loans, together with their servicing rights, are sold to mortgage loan investors under prearranged terms. Loans held for sale are subsequently measured at the lower of cost or fair value on an aggregated basis within the consolidated balance sheet under the caption “loans held for sale. The Company recognizes certain origination and service release fees from the sale, which are included in non-interest income in the consolidated statements of operations. The Company is exposed to certain risks relating to its ongoing mortgage origination business. The Company enters into interest rate lock commitments and forward commitments to sell mortgages. Interest rate lock commitments are entered into to manage interest rate risk associated with the Company’s fixed rate loan commitments. The period of time between the issuance of a loan commitment and the closing and sale of the loan generally ranges from 30 to 60 days. Such interest rate lock commitments and forward-loan-sale commitments represent derivative instruments which are required to be carried at fair value. These derivative instruments do not qualify as hedges under the Derivatives and Hedging topic of the FASB Accounting Standards Codification. The fair value of the Company’s written loan commitments are based on current secondary market pricing and included on the consolidated balance sheet in other assets and in noninterest income on the consolidated statement of operations. Forward loan sale commitments are generally equal and offsetting to interest rate loan commitments. The gains and losses from the future sales of the mortgages are recognized when the Company, the borrower and the investor enter into the loan contract and the resulting gain or loss is recorded on the income statement.
Loans
Loans that management has the intent and ability to hold for the foreseeable future or until maturity are reported at their outstanding principal adjusted for any charge-offs, the allowance for loan losses, and any deferred fees or costs on originated loans and unamortized premiums or discounts on purchased loans. Loan origination fees and certain direct origination costs are capitalized and recognized as an adjustment of the yield of the related loan. Interest income is recorded as earned on an accrual basis.
Unsecured loans are charged-off against the Company’s allowance for loan losses as soon as the loan becomes uncollectible. Unsecured loans are considered uncollectible when no regularly scheduled monthly payment has been made within three months and the analysis of the borrower and any guarantors would indicate no further support can be provided, the loan matured over 90 days ago and has not been renewed or extended or the borrower files for bankruptcy. Secured loans are considered uncollectible when the liquidation of collateral is deemed to be the most likely source of repayment and the collateral or guarantors are deemed unable to repay any shortfall. Once secured loans reach 90 days past due, they are placed into non-accrual status. If the loan is deemed to be solely collateral dependent, the principal balance is written down immediately to reflect the current market valuation based on current independent appraisal. Included in the write-down is the estimated expense to liquidate the property and typically an additional allowance for the foreclosure discount. Generally, if the loan is unsecured the loan must be charged-off in full while if it is secured the loan is charged down to the net liquidation value of the collateral.
Loans, including impaired loans, are generally classified as nonaccrual if they are past due as to maturity or payment of principal or interest for a period of more than 90 days, unless such loans are well-secured and in the process of collection. Loans that are current or past due less than 90 days may also be classified as nonaccrual if repayment in full of principal and/or interest is in doubt (as determined by the contractual terms of the note). Loans may be returned to accrual status when all principal and interest amounts contractually due (including arrearages) are reasonably assured of repayment within an acceptable period of time, and there is a sustained period of repayment performance (generally a minimum of six months) by the borrower, in accordance with the contractual terms.
F-10
Table of Contents
NORTH STATE BANCORP
NOTES TO CONSOLIDATED FINANCIAL STATEMENTS
Years Ended December 31, 2010, 2009 and 2008
NOTE B - SUMMARY OF SIGNIFICANT ACCOUNTING POLICIES (Continued)
Loans (Continued)
While a loan (including an impaired loan) is classified as nonaccrual and the future collectability of the recorded loan balance is doubtful, collections of interest and principal are generally applied as a reduction to the principal outstanding. When the future collectability of the recorded loan balance is not in doubt, interest income may be recognized on a cash basis. In the case where a nonaccrual loan had been partially charged-off, recognition of interest on a cash basis is limited to that which would have been recognized on the recorded loan balance at the contractual interest rate. Receipts in excess of that amount are recorded as recoveries to the allowance for loan losses until prior charge-offs have been fully recovered.
Troubled Debt Restructured loans are loans that have been modified due to deterioration in the borrower’s financial condition, resulting in more favorable terms for the borrower. Accrual of interest is continued for restructured loans when the borrower is performing prior to the loan restructuring and there is reasonable assurance of repayment and continued performance under the modified terms. Accrual of interest on restructured loans in nonaccrual status is resumed when the borrower has established a sustained period of performance under the restructured terms of at least six months.
Allowance for Loan Losses
The provision for loan losses is based upon management’s estimate of the amount needed to maintain the allowance for loan losses at an adequate level. In evaluating the allowance for loan losses, the Company prepares an analysis of its current loan portfolio using historical loss rates, other identified factors, and data from its portfolio to calculate a general reserve for loan losses. The Company applies a charge-off rate based on charge-off history, current impairments and management’s judgment applied to nine categories of its current loan portfolio. In addition, the Company has identified seven factors that are considered as indicators of changes in the level of risk of loss inherent with the Company’s loan portfolio. These factors are payment performance, overall portfolio quality utilizing weighted average risk rating, general economic factors such as unemployment, delinquency and charge-off rates, regulatory examination results, the interest rate environment, levels of highly leveraged transactions and levels of commercial real estate concentrations, which address the risks associated with construction, development and non-owner occupied commercial real estate lending. Each of these factors is assigned a level of risk and this risk factor is applied to only the general pool of loans. In addition to the general reserve calculation, all loans risk rated “substandard”, “doubtful” and “loss” are reviewed for probable losses and if management determines a loan to be impaired it is removed from its homogeneous group and individually analyzed for impairment. Other groups of loans may also be selected for impairment review. A loan is considered impaired when, based on current information and events, it is considered probable that the Company will be unable to collect the scheduled payments of principal and interest when due according to the original contractual terms of the loan agreement. The measurement of impaired loans is generally based on the present value of expected future cash flows discounted at the historical effective interest rate, or upon the fair value of the collateral if the loan is collateral dependent. If the recorded investment in the loan exceeds the measure of fair value, a valuation allowance is established as a component of the allowance for loan losses.
While management uses the best information available to make evaluations, future adjustments to the allowance may be necessary if conditions differ substantially from the assumptions used in making the evaluations. In addition, regulatory examiners may require the Company to recognize adjustments to the allowance for loan losses based on their judgments about information available to them at the time of their examination.
Premises and Equipment
Premises and equipment are stated at cost less accumulated depreciation. Depreciation is calculated on the straight-line method over the estimated useful lives of the assets which are 3 - 10 years for furniture and equipment and 30 - 40 years for buildings. Leasehold improvements are amortized over the terms of the respective leases or the estimated useful lives of the improvements, whichever is shorter. Repairs and maintenance costs are charged to operations as incurred and additions and improvements to premises and equipment are capitalized. Upon sale or retirement, the cost and related accumulated depreciation are removed from the accounts and any gains or losses are reflected in current operations. Long-lived depreciable assets are evaluated periodically for impairment when events or changes in circumstances indicate the carrying amount may not be recoverable.
Foreclosed Assets
Assets acquired through, or in lieu of, foreclosure are held for sale and are initially recorded at fair value less anticipated selling costs at the date of foreclosure, establishing a new cost basis. Principal and interest losses existing at the time of acquisition of such assets are charged against the allowance for loan losses and interest income, respectively. The initial recorded value may be subsequently reduced by additional valuation allowances, which are charged to earnings if the estimated fair value of the property less estimated selling costs declines below the initial recorded value. Costs related to the improvement of the property are capitalized, whereas those
F-11
Table of Contents
NORTH STATE BANCORP
NOTES TO CONSOLIDATED FINANCIAL STATEMENTS
Years Ended December 31, 2010, 2009 and 2008
NOTE B - SUMMARY OF SIGNIFICANT ACCOUNTING POLICIES (Continued)
Foreclosed Assets (Continued)
related to holding the property are expensed. Revenue and expenses from operations and changes in the valuation allowance are included in other expenses.
Income Taxes
Deferred tax assets and liabilities are recognized for the estimated future tax consequences attributable to differences between the tax basis of assets and liabilities and their carrying amounts for financial reporting purposes. Deferred tax assets and liabilities are measured using enacted tax rates in effect for the year in which the temporary differences are expected to be recovered or settled. Deferred tax assets are reduced by a valuation allowance if it is more likely than not that the tax benefits will not be realized.
Tax positions are analyzed in accordance with generally accepted accounting principles. Interest recognized as a result of our analysis of tax positions would be classified as interest expense. Penalties would be classified as noninterest expense.
Stock Compensation Plans
The Company is required to recognize the cost of employee services received in exchange for an award of equity instruments in the financial statements over the period the employee is required to perform the services in exchange for the award (presumptively the vesting period). The Company is also required to measure the cost of employee services received in exchange for an award based on the grant-date fair value of the award as well as to report excess tax benefits as financing cash inflows, rather than as a reduction of taxes paid, which is included within operating cash flows.
As of December 31, 2010, the Company had one stock-based compensation plan, which is more fully described in Note O.
Earnings Per Common Share
Basic earnings per share represent income available to common shareholders divided by the weighted-average number of common shares outstanding during the period. Diluted earnings per share reflect additional common shares that would have been outstanding if dilutive potential common shares had been issued, as well as any adjustment to income that would result from the assumed issuance. Potential common shares that may be issued by the Company relate solely to outstanding stock options. Basic and diluted net income per common share have been computed based upon net income as presented in the accompanying consolidated statements of operations divided by the weighted average number of common shares outstanding or assumed to be outstanding as summarized below:
| 2010 | 2009 | 2008 | ||||||||||
| Weighted average number of common shares used in computing basic net income per share |
7,363,618 | 7,179,744 | 7,158,545 | |||||||||
| Effect of dilutive stock options |
25,779 | 136,548 | 197,819 | |||||||||
| Weighted average number of common shares and dilutive potential common shares used in computing diluted net income per share |
7,389,397 | 7,316,292 | 7,356,364 | |||||||||
For the years ended December 31, 2010, 2009 and 2008 there were 105,787, 76,550, and 70,707, respectively, anti-dilutive shares excluded from the calculation of total dilutive weighted average shares due to the exercise price exceeding the average market price for the year.
Comprehensive Income
The Company reports as comprehensive income all changes in shareholders’ equity during the year from sources other than shareholders. Other comprehensive income refers to all components (revenues, expenses, gains and losses) of comprehensive income that is excluded from net income. The Company’s other comprehensive income includes unrealized gains and losses on investment securities available for sale, net of income taxes and unrealized holding gains on hedge instruments, net of income taxes.
F-12
Table of Contents
NORTH STATE BANCORP
NOTES TO CONSOLIDATED FINANCIAL STATEMENTS
Years Ended December 31, 2010, 2009 and 2008
NOTE B - SUMMARY OF SIGNIFICANT ACCOUNTING POLICIES (Continued)
Comprehensive Income (Continued)
Accumulated other comprehensive income (loss) consists of the following:
| For the Years Ended December 31, | ||||||||||||
| 2010 | 2009 | 2008 | ||||||||||
| (Dollars in thousands) | ||||||||||||
| Accumulated other comprehensive income (loss): |
||||||||||||
| Unrealized holding gains (losses) on available for sale securities |
$ | (94 | ) | $ | 653 | $ | 980 | |||||
| Tax effect |
34 | (254 | ) | (380 | ) | |||||||
| Net unrealized holding gains (losses) on available for sale securities |
(60 | ) | 399 | 600 | ||||||||
| Unrealized holding gains on hedging activities |
— | — | 804 | |||||||||
| Tax effect |
— | — | (310 | ) | ||||||||
| Net unrealized holding gains on hedging activities |
— | — | 494 | |||||||||
| Total accumululated other comprehensive income (loss) |
$ | (60 | ) | $ | 399 | $ | 1,094 | |||||
Derivative Instruments
The Company’s deposit and loan activities are vulnerable to interest rate risk. The associated variability in cash flows may impact the results of operations of the Company. The Company’s hedging strategy is generally intended to take advantage of opportunities to reduce, to the extent possible, unpredictable cash flows. The Company may employ a variety of common derivative products that are instruments used by financial institutions to manage interest rate risk. The financial instruments that may be used as part of a hedging strategy include swaps, caps, floors and collars.
Under accounting guidelines for derivative instruments and hedging activities, derivative financial instruments generally are required to be carried at fair value. Derivative instruments designated in a hedge relationship to mitigate exposure to changes in the fair value of an asset, liability, or firm commitment attributable to a particular risk, such as interest rate risk, are considered fair value hedges.
Derivative instruments designated in a hedge relationship to mitigate exposure to variability in expected future cash flows, or other types of forecasted transactions, are considered cash flow hedges.
The Company does not enter into derivative financial instruments for speculative or trading purposes.
The Company utilized a stand-alone derivative financial instrument, in the form of an interest rate floor, in its asset/liability management program during 2008. The floor was designated as a cash flow hedge of the overall changes in cash flows on the first prime-rate-based interest payments received by the Company each calendar month during the term of the hedge that, in the aggregate for each period, are interest payments on principal from specified loan portfolios greater than or equal to the notional amount of the floor. During the first quarter of 2008, the Company terminated the interest rate floor agreement. The contractual maturity of the floor was November 1, 2009. During the life of the floor, pre-tax gains of approximately $1.5 million were deferred in accumulated other comprehensive income (AOCI) in accordance with cash flow hedge accounting rules. The amounts deferred in AOCI were reclassified out of equity into earnings over the remaining 19 months of the original contract. As required, amounts deferred in AOCI were reclassified into earnings in the same periods during which the originally hedged cash flows (prime-based interest payments on loan assets) effect earnings, as long as the originally hedged cash flows were probable of occurring (i.e. the principal amount of designated prime-based loans match or exceed the notional amount of the terminated floor through November 1, 2009).
Segment Reporting
Management is required by accounting pronouncements governing the disclosures about segments of an enterprise and related information to report selected financial and descriptive information about reportable operating segments. It also establishes standards for related disclosures about products and services, geographic areas, and major customers. Generally, disclosures are required for segments internally identified to evaluate performance and resource allocation. In all material respects, the Company’s operations are entirely within the commercial and retail banking segment and the consolidated financial statements presented herein reflect the results of that segment. Included as a division of the Bank, NSB Mortgage is reported as a separate segment as well as the parent Company. Segment information regarding the Bank, NSB Mortgage and the parent Company are fully described in Note R. Also, the Company has no foreign operations or customers.
Recent Accounting Pronouncements
During the first quarter of 2010, additional guidance was issued under the Fair Value Measurements and Disclosures topic of the Financial Accounting Standards Board, or FASB, Accounting Standards Codification, or ASC, requiring disclosures of significant
F-13
Table of Contents
NORTH STATE BANCORP
NOTES TO CONSOLIDATED FINANCIAL STATEMENTS
Years Ended December 31, 2010, 2009 and 2008
NOTE B - SUMMARY OF SIGNIFICANT ACCOUNTING POLICIES (Continued)
Recent Accounting Pronouncements (Continued)
transfers in and out of Levels 1 and 2 fair value and the reasons for the transfers. Certain additional disclosures are now required in interim and annual periods to discuss the inputs and valuation technique(s) used to measure fair value. The adoption of the new accounting disclosures did not have a material effect on the Company’s financial position or results of operations.
In March 2010, guidance related to derivatives and hedging was amended to exempt embedded credit derivative
features related to the transfer of credit risk from potential bifurcation and separate accounting. Embedded features
related to other types of risk and other embedded credit derivative features are not exempt from potential bifurcation and
separate accounting. The amendments were effective for the Company on July 1, 2010. These amendments had no impact
on the financial statements.
On July 21, 2010, the FASB issued Disclosures about the Credit Quality of Financing Receivables and the Allowance for Credit Losses with the main objective to provide financial statement users with greater transparency about an entity’s allowance for credit losses and the credit quality of its financing receivables. The ASC amends current guidance and requires significant additional disclosures in an entity’s financial statements, including the requirement to provide a greater level of disaggregated data, as it relates to exposure to credit losses. The extensive new disclosures of information is included for both interim and annual reporting periods ending after December 15, 2010. Disclosures about Troubled Debt Restructurings, or TDRs, required by the update have been deferred by an update issued by FASB in early 2011. The TDR disclosures are anticipated to be effective for periods ending after June 15, 2011. See Note D for detail.
In June 2009, the FASB issued an update to the accounting standards for transfers and servicing of financial assets which eliminates the concept of a qualifying special purpose entity, or QSPE, changes the requirements for derecognizing financial assets, and requires additional disclosures, including information about continuing exposure to risks related to transferred financial assets. This update is effective for financial asset transfers occurring after the beginning of fiscal years beginning after November 15, 2009. The disclosure requirements must be applied to transfers that occurred before and after the effective date. The adoption of the new practices did not have an effect on the Company’s financial position or results of operations.
In June 2009, the FASB issued an update to the accounting standards for consolidation which contains new criteria for determining the primary beneficiary, eliminates the exception to consolidating QSPE’s, requires continual reconsideration of conclusions reached in determining the primary beneficiary, and requires additional disclosures. This update for consolidations is effective as of the beginning of fiscal years beginning after November 15, 2009 and is applied using a cumulative effect adjustment to retained earnings for any carrying amount adjustments (e.g., for newly-consolidated variable interest entities). The adoption of the new practices did not have an effect on the Company’s financial position or results of operations.
In December 2010, the FASB issued Intangibles—Goodwill and Other - When to Perform Step 2 of the Goodwill Impairment Test for Reporting Units with Zero or Negative Carrying Amounts. This update modifies Step 1 of the goodwill impairment test for reporting units with zero or negative carrying amounts. For those reporting units, an entity is required to perform Step 2 of the goodwill impairment test if it is more likely than not that a goodwill impairment exists. In determining whether it is more likely than not that a goodwill impairment exists, an entity should consider whether there are any adverse qualitative factors indicating that an impairment may exist such as if an event occurs or circumstances change that would more likely than not reduce the fair value of a reporting unit below its carrying amount. The updates will be effective beginning January 1, 2011 and are not expected to have a material impact on financial condition, results of operations or liquidity.
Other accounting standards that have been issued or proposed by the FASB or other standards-setting bodies are not
expected to have a material impact on the Company’s financial position, results of operations or cash flows.
Reclassification
Certain amounts in the 2009 and 2008 financial statements have been reclassified to conform with the 2010 presentation. The reclassifications had no effect on net income or shareholders’ equity as previously reported.
F-14
Table of Contents
NORTH STATE BANCORP
NOTES TO CONSOLIDATED FINANCIAL STATEMENTS
Years Ended December 31, 2010, 2009 and 2008
NOTE C - INVESTMENT SECURITIES
The amortized cost and fair value of securities available for sale and securities held to maturity with gross unrealized gains and losses, follows:
| As of December 31, 2010 | ||||||||||||||||
| Amortized cost |
Gross unrealized gains |
Gross unrealized losses |
Fair value | |||||||||||||
| (Dollars in thousands) | ||||||||||||||||
| Securities available for sale: |
||||||||||||||||
| U. S. government securities and obligations of U.S. government agencies |
$ | 5,500 | $ | — | $ | — | $ | 5,500 | ||||||||
| Government-sponsored residential mortgage-backed securities |
3,829 | 28 | 123 | 3,734 | ||||||||||||
| Total securities available for sale |
$ | 9,329 | $ | 28 | $ | 123 | $ | 9,234 | ||||||||
| Securities held to maturity: |
||||||||||||||||
| Corporate securities |
$ | 250 | $ | — | $ | 39 | 211 | |||||||||
| Total securities held to maturity |
$ | 250 | $ | — | $ | 39 | $ | 211 | ||||||||
| As of December 31, 2009 | ||||||||||||||||
| Amortized cost |
Gross unrealized gains |
Gross unrealized losses |
Fair value | |||||||||||||
| (Dollars in thousands) | ||||||||||||||||
| Securities available for sale: |
||||||||||||||||
| Government-sponsored residential mortgage-backed securities |
$ | 22,745 | $ | 686 | $ | 33 | $ | 23,398 | ||||||||
| Total securities available for sale |
$ | 22,745 | $ | 686 | $ | 33 | $ | 23,398 | ||||||||
| Securities held to maturity: |
||||||||||||||||
| Corporate securities |
$ | 750 | $ | — | $ | 57 | 693 | |||||||||
| Total securities held to maturity |
$ | 750 | $ | — | $ | 57 | $ | 693 | ||||||||
The following table shows at December 31, 2010 and 2009 gross unrealized losses on and fair values of the Company’s investments, aggregated by investment category and length of time that the individual securities have been in a continuous unrealized loss position. All unrealized losses on investment securities are considered by management to be temporary given the credit ratings on these investment securities and the Company’s intent and ability to hold its securities to maturity. The unrealized losses on available for sale securities as of December 31, 2010 and 2009, relate to one and three government-sponsored residential mortgage-backed securities, respectively. The unrealized losses on held to maturity securities for December 31, 2010 and 2009 relate to one corporate security. The unrealized losses are not likely to reverse unless and until market interest rates decline to the levels that existed when the securities were purchased. Since the Company does not intend to sell the securities prior to recovery and it is more likely than not the Company will not be required to sell the imparied securities prior to recovery, none of the securities are deemed to be other than temporarily impaired.
F-15
Table of Contents
NORTH STATE BANCORP
NOTES TO CONSOLIDATED FINANCIAL STATEMENTS
Years Ended December 31, 2010, 2009 and 2008
NOTE C - INVESTMENT SECURITIES (Continued)
| As of December 31, 2010 | ||||||||||||||||||||||||
| Less than 12 months | 12 months or more | Total | ||||||||||||||||||||||
| Fair Value |
Unrealized Losses |
Fair Value |
Unrealized Losses |
Fair Value |
Unrealized Losses |
|||||||||||||||||||
| (Dollars in thousands) | ||||||||||||||||||||||||
| Securities available for sale: |
||||||||||||||||||||||||
| Government-sponsored residential mortgage-backed securities |
$ | 2,879 | $ | 123 | $ | — | $ | — | $ | 2,879 | $ | 123 | ||||||||||||
| Total temporarily impaired securities |
$ | 2,879 | $ | 123 | $ | — | $ | — | $ | 2,879 | $ | 123 | ||||||||||||
| Securities held to maturity: |
||||||||||||||||||||||||
| Corporate securities |
$ | — | $ | — | $ | 211 | $ | 39 | $ | 211 | $ | 39 | ||||||||||||
| Total securities held to maturity |
$ | — | $ | — | $ | 211 | $ | 39 | $ | 211 | $ | 39 | ||||||||||||
| As of December 31, 2009 | ||||||||||||||||||||||||
| Less than 12 months | 12 months or more | Total | ||||||||||||||||||||||
| Fair Value |
Unrealized Losses |
Fair Value |
Unrealized Losses |
Fair Value |
Unrealized Losses |
|||||||||||||||||||
| (Dollars in thousands) | ||||||||||||||||||||||||
| Securities available for sale: |
||||||||||||||||||||||||
| Government-sponsored residential mortgage-backed securities |
$ | 7,030 | $ | 33 | $ | — | $ | — | $ | 7,030 | $ | 33 | ||||||||||||
| Total temporarily impaired securities |
$ | 7,030 | $ | 33 | $ | — | $ | — | $ | 7,030 | $ | 33 | ||||||||||||
| Securities held to maturity: |
||||||||||||||||||||||||
| Corporate securities |
$ | — | $ | — | $ | 693 | $ | 57 | 693 | 57 | ||||||||||||||
| Total securities held to maturity |
$ | — | $ | — | $ | 693 | $ | 57 | $ | 693 | $ | 57 | ||||||||||||
The amortized cost and fair values of securities available for sale and securities held to maturity at December 31, 2010 by contractual maturity are shown below. Expected maturities will differ from contractual maturities because borrowers may have the right to call or prepay obligations with or without call or prepayment penalties.
F-16
Table of Contents
NORTH STATE BANCORP
NOTES TO CONSOLIDATED FINANCIAL STATEMENTS
Years Ended December 31, 2010, 2009 and 2008
NOTE C - INVESTMENT SECURITIES (Continued)
| As of December 31, 2010 | ||||||||
| Amortized Cost |
Fair Value |
|||||||
| (Dollars in thousands) | ||||||||
| Securities available for sale: |
||||||||
| U. S. government securities and obligations of U.S. government agencies |
||||||||
| Due within one year |
$ | 5,500 | $ | 5,500 | ||||
| 5,500 | 5,500 | |||||||
| Government-sponsored residential mortgage-backed securities |
||||||||
| Due within one year |
195 | 200 | ||||||
| Due after one but within five years |
440 | 458 | ||||||
| Due after ten years |
3,194 | 3,076 | ||||||
| 3,829 | 3,734 | |||||||
| Total Securities available for sale: |
||||||||
| Due within one year |
$ | 5,695 | $ | 5,700 | ||||
| Due after one but within five years |
440 | 458 | ||||||
| Due after ten years |
3,194 | 3,076 | ||||||
| $ | 9,329 | $ | 9,234 | |||||
| Securities held to maturity: |
||||||||
| Corporate securities |
||||||||
| Due after five but within ten years |
$ | 250 | $ | 211 | ||||
| $ | 250 | $ | 211 | |||||
Securities with a carrying value of $8.8 million and $15.2 million as of December 31, 2010 and 2009, respectively, were pledged to secure securities sold under agreements to repurchase and public deposits.
During 2010 and 2009, proceeds from the call and sales of investment securities of $21.0 million and $17.2 million resulted in gross gains of $741,000 during 2010, gross gains and gross losses of $470,000 and $6,000, respectively during 2009 and gross losses of $7,000 during 2008.
F-17
Table of Contents
NORTH STATE BANCORP
NOTES TO CONSOLIDATED FINANCIAL STATEMENTS
Years Ended December 31, 2010, 2009 and 2008
NOTE D - LOANS
The following is a summary of loans segregated by loan category:
| As of December 31, | ||||||||||||||||
| 2010 | 2009 | |||||||||||||||
| Amount | % of Total Loans |
Amount | % of Total Loans |
|||||||||||||
| (Dollars in thousands) | ||||||||||||||||
| Real estate loans: |
||||||||||||||||
| Residential construction |
$ | 51,058 | 10.2 | % | $ | 59,531 | 11.4 | % | ||||||||
| Commercial construction |
82,136 | 16.5 | % | 115,233 | 22.1 | % | ||||||||||
| Residential real estate |
98,450 | 19.7 | % | 108,229 | 20.7 | % | ||||||||||
| Commercial real estate |
221,604 | 44.3 | % | 188,395 | 36.1 | % | ||||||||||
| 453,248 | 90.7 | % | 471,388 | 90.3 | % | |||||||||||
| Non-real estate loans: |
||||||||||||||||
| Commercial and industrial |
42,884 | 8.6 | % | 45,713 | 8.7 | % | ||||||||||
| Consumer and other |
3,644 | 0.7 | % | 4,986 | 1.0 | % | ||||||||||
| 46,528 | 9.3 | % | 50,699 | 9.7 | % | |||||||||||
| 499,776 | 100.0 | % | 522,087 | 100.0 | % | |||||||||||
| Unamortized net deferred loan fees |
(253 | ) | (278 | ) | ||||||||||||
| Total loans |
$ | 499,523 | $ | 521,809 | ||||||||||||
Loans are primarily funded in Wake County and New Hanover County in North Carolina. Real estate loans can be affected by the condition of the local real estate market. Commercial and installment loans can be affected by the local economic conditions.
The following describe the risk characteristics relevant to each of the portfolio segments.
Real estate construction
Commercial and residential construction loans are underwritten utilizing independent appraisal reviews, sensitivity analysis of absorption and financial analysis of the developers and property owners. Construction loans are generally based upon estimates of costs and value associated with the complete project. These estimates may be inaccurate. Construction loans often involve the disbursement of substantial funds with the repayment substantially dependent on the success of the ultimate project. Sources of repayment for these types of loans may be pre-committed permanent loans, sales of developed property or an interim loan commitment from the Company until permanent financing is obtained. These loans are closely monitored by on-site inspections and are considered to have higher risks than other real estate loans due to their ultimate repayment being sensitive to interest rate changes, government regulation of real property, general economic conditions and the availability of long-term financing. As of December 31, 2010, residential construction and commercial construction loans represented 10.2% and 16.5%, respectively, of our loans outstanding.
Commercial and residential real estate
Commercial and residential real estate secured loans are subject to underwriting similar to real estate construction loans. These loans are either cash flow loans or development loans paid from the real estate sale and secondarily as loans secured by real estate. Commercial real estate lending typically involves higher risk and higher loan principal amounts and the repayment of these loans is generally largely dependent on the successful operation of the property securing the loan or the business conducted on the property securing the loan. Commercial real estate loans may be more adversely affected by conditions in real estate markets or the general economy. The properties securing the Company’s commercial real estate portfolio are principally secured by owner-occupied buildings including professional practices, office and church properties; and single family rental properties. Management monitors and evaluates commercial real estate loans based on collateral, market area and risk grade criteria. As a general rule, the Company avoids non-owner occupied commercial single-purpose projects unless other underwriting factors are present to help mitigate risk. The Company also utilizes third-party experts to provide insight and guidance about economic conditions and trends within its market areas. Residential real estate properties are typically secured by the primary residence of the borrower and the combined loan-to-value ratio is usually 90% or less. As of December 31, 2010, commercial and residential real estate represented 44.3% and 19.7%, respectively, of our loans outstanding.
F-18
Table of Contents
NORTH STATE BANCORP
NOTES TO CONSOLIDATED FINANCIAL STATEMENTS
Years Ended December 31, 2010, 2009 and 2008
NOTE D – LOANS (Continued)
Commercial and industrial
Non-real estate secured commercial and industrial loans are underwritten after evaluating and understanding the borrowers’ ability to operate profitably and prudently expand its business. Underwriting standards are designed to promote relationship banking rather than transactional banking. Management examines current and projected cash flows of the borrower to determine the ability of the borrower to repay their obligations as agreed. Commercial and industrial loans are primarily made based on the indentified cash flows of the borrower and secondarily on the underlying collateral provided by the borrower and tertiary as applicable, the guarantors. The cash flows of borrowers, however, may not be as expected and the collateral securing these loans may fluctuate in value. Most commercial and industrial loans are secured by the assets being financed or other business assets such as accounts receivable, inventory or equipment and usually incorporate a personal guarantee. In the case of loans secured by accounts receivable, the availability of the funds for repayment of these loans may be substantially dependent on the ability of the borrower to collect amounts due from its customers. As of December 31, 2010, commercial and industrial loans represented 8.6% of our loans outstanding.
The Company maintains an independent loan review function that reviews and validates the credit risk program on a periodic basis. Results of these reviews are presented to management and the board of directors. The loan review process compliments and reinforces the risk identification and assessment decisions made by lenders and credit personnel, as well as the Company’s policies and procedures.
The Company also originates single-family, residential mortgage loans have that have been approved by secondary investors which are included on the consolidated balance sheet under the caption “loans held for sale.” The Company recognizes certain origination and service release fees from sale, which are included in non-interest income on the consolidated statements of operations. As of December 31, 2010 mortgage loans held for sale were $51.5 million. There were no loans held for sale as of December 31, 2009.
Related party loans
The Company has had loan transactions with its directors and executive officers. Such loans were made in the ordinary course of business and on substantially the same terms and collateral as those for comparable transactions prevailing at the time and did not involve more than the normal risk of collectability or present other unfavorable features.
A summary of related party loan transactions is as follows:
(Dollars in thousands)
| Balance at December 31, 2009 |
$ | 31,935 | ||
| Additional borrowings |
14,924 | |||
| Loan repayments |
(7,878 | ) | ||
| Balance at December 31, 2010 |
$ | 38,981 | ||
At December 31, 2010, the Company had pre-approved but unused lines of credit totaling $2.4 million to executive officers, directors and their affiliates.
F-19
Table of Contents
NORTH STATE BANCORP
NOTES TO CONSOLIDATED FINANCIAL STATEMENTS
Years Ended December 31, 2010, 2009 and 2008
NOTE D – LOANS (Continued)
Nonperforming assets and potential problem loans
Nonaccrual loans segregated by loan category, restructured loans, foreclosed assets and potential problem loans as of December 31, 2010 and 2009 consisted of the following:
| As of December 31, | ||||||||
| 2010 | 2009 | |||||||
| (Dollars in thousands) | ||||||||
| Nonaccrual loans: |
||||||||
| Commercial and industrial |
$ | 1,544 | $ | 243 | ||||
| Commercial real estate loans: |
||||||||
| Commercial real estate construction |
2,875 | 6,788 | ||||||
| Commercial real estate - other |
255 | 2,152 | ||||||
| 3,130 | 8,940 | |||||||
| Residential real estate loans: |
||||||||
| Residential real estate construction |
4,056 | 6,176 | ||||||
| Residential real estate - other |
2,231 | 1,614 | ||||||
| 6,287 | 7,790 | |||||||
| Consumer |
11 | 36 | ||||||
| Restructured and nonaccrual |
520 | 1,839 | ||||||
| Total nonaccrual loans |
$ | 11,492 | $ | 18,848 | ||||
| Accruing loans past due 90 days or more |
$ | 131 | $ | 200 | ||||
| Potential problem loans |
$ | 1,184 | $ | 1,433 | ||||
| Allowance for loan losses |
$ | 9,935 | $ | 8,581 | ||||
| Nonaccrual loans to period end loans |
2.30 | % | 3.61 | % | ||||
| Allowance for loan losses to period end loans |
1.99 | % | 1.64 | % | ||||
| Ratio of allowance for loan losses to nonaccrual loans |
0.86 x | 0.46 x | ||||||
For all classes of loans, loans are classified as nonaccrual if they are past due as to maturity or payment of principal or interest for a period of more than 90 days, unless such loans are well-secured and in the process of collection. Loans that are current or past due less than 90 days may also be classified as nonaccrual if repayment in full of principal and/or interest is in doubt (as determined by the contractual terms of the note). Loans may be returned to accrual status when all principal and interest amounts contractually due (including arrearages) are reasonably assured of repayment within an acceptable period of time, and there is a sustained period of repayment performance (generally a minimum of six months) by the borrower, in accordance with the contractual terms.
The approximate amount of interest income foregone on nonaccrual loans during the year was $875,000 for 2010, $704,000 for 2009 and $111,000 for 2008.
F-20
Table of Contents
NORTH STATE BANCORP
NOTES TO CONSOLIDATED FINANCIAL STATEMENTS
Years Ended December 31, 2010, 2009 and 2008
NOTE D – LOANS (Continued)
Past due loans
An age analysis of past due loans segregated by loan category as of December 31, 2010 was as follows:
| 30 - 89 Days Past Due |
Over 90 Days |
Total Past Due |
Current | Total Loans |
Accruing Loans 90 or More Days Past Due |
|||||||||||||||||||
| (Dollars in thousands) | ||||||||||||||||||||||||
| Commercial and industrial |
$ | 1,797 | $ | 602 | $ | 2,399 | $ | 40,485 | $ | 42,884 | $ | — | ||||||||||||
| Commercial real estate loans: |
||||||||||||||||||||||||
| Commercial real estate construction |
4,801 | 2,462 | 7,263 | 74,873 | 82,136 | — | ||||||||||||||||||
| Commercial real estate - other |
1,554 | 438 | 1,992 | 219,612 | 221,604 | — | ||||||||||||||||||
| 6,355 | 2,900 | 9,255 | 294,485 | 303,740 | — | |||||||||||||||||||
| Residential real estate loans: |
||||||||||||||||||||||||
| Residential real estate construction |
1,274 | 3,079 | 4,353 | 46,705 | 51,058 | — | ||||||||||||||||||
| Residential real estate - other |
2,510 | 1,863 | 4,373 | 94,077 | 98,450 | 131 | ||||||||||||||||||
| 3,784 | 4,942 | 8,726 | 140,782 | 149,508 | 131 | |||||||||||||||||||
| Consumer |
11 | — | 11 | 3,165 | 3,176 | — | ||||||||||||||||||
| Other |
— | — | — | 215 | 215 | — | ||||||||||||||||||
| Total |
$ | 11,947 | $ | 8,444 | $ | 20,391 | $ | 479,132 | $ | 499,523 | $ | 131 | ||||||||||||
Impaired loans
For all classes of loans, interest payments on impaired loans are applied to principal unless collectability of the principal amount is reasonably assured, in which case interest is recognized on a cash basis. Accrual of interest is continued for restructured loans when the borrower is performing prior to the loan restructuring and there is reasonable assurance of repayment and continued performance under the modified terms. Accrual of interest on restructured loans in nonaccrual status is resumed when the borrower has established a sustained period of performance under the restructured terms of at least six months. Information regarding impaired loans segregated by loan category as of and for the year ended December 31, 2010 is as follows.
F-21
Table of Contents
NORTH STATE BANCORP
NOTES TO CONSOLIDATED FINANCIAL STATEMENTS
Years Ended December 31, 2010, 2009 and 2008
NOTE D – LOANS (Continued)
Impaired Loans
As of and for the year ended December 31, 2010
| Recorded Investment |
Unpaid Principal Balance |
Related Allowance |
Average Recorded Investment |
Interest Income Recognized |
||||||||||||||||
| (Dollars in thousands) | ||||||||||||||||||||
| Impaired with no related allowance recorded: |
||||||||||||||||||||
| Commercial and industrial |
$ | 54 | $ | 204 | $ | — | $ | 130 | $ | — | ||||||||||
| Commercial real estate loans: |
||||||||||||||||||||
| Commercial real estate construction |
2,554 | 2,589 | — | 1,980 | — | |||||||||||||||
| Commercial real estate - other |
54 | 54 | — | 48 | — | |||||||||||||||
| 2,608 | 2,643 | — | 2,028 | — | ||||||||||||||||
| Residential real estate loans: |
||||||||||||||||||||
| Residential real estate construction |
1,350 | 1,433 | — | 1,013 | — | |||||||||||||||
| Residential real estate - other |
989 | 989 | — | 873 | — | |||||||||||||||
| 2,339 | 2,422 | — | 1,886 | — | ||||||||||||||||
| Consumer |
11 | 25 | — | 17 | — | |||||||||||||||
| Total |
$ | 5,012 | $ | 5,294 | $ | — | $ | 4,061 | $ | — | ||||||||||
| Impaired restructured and accruing loans with no related allowance recorded: |
||||||||||||||||||||
| Commercial and industrial |
$ | 1,089 | $ | 1,078 | $ | — | $ | 1,081 | $ | 56 | ||||||||||
| Commercial real estate loans: |
||||||||||||||||||||
| Commercial real estate construction |
4,787 | 4,752 | — | 4,760 | 204 | |||||||||||||||
| Commercial real estate - other |
3,879 | 3,870 | — | 4,451 | 217 | |||||||||||||||
| 8,666 | 8,622 | — | 9,211 | 421 | ||||||||||||||||
| Residential real estate loans: |
||||||||||||||||||||
| Residential real estate construction |
2,025 | 2,021 | — | 2,020 | 96 | |||||||||||||||
| Residential real estate - other |
— | — | — | — | — | |||||||||||||||
| 2,025 | 2,021 | — | 2,020 | 96 | ||||||||||||||||
| Consumer |
20 | 20 | — | 22 | 2 | |||||||||||||||
| Total |
$ | 11,800 | $ | 11,741 | $ | — | $ | 12,334 | $ | 575 | ||||||||||
| Impaired with a related allowance recorded: |
||||||||||||||||||||
| Commercial and industrial |
$ | 1,544 | $ | 1,934 | $ | 697 | $ | 845 | $ | — | ||||||||||
| Commercial real estate loans: |
||||||||||||||||||||
| Commercial real estate construction |
321 | 321 | 96 | 350 | — | |||||||||||||||
| Commercial real estate - other |
201 | 201 | 111 | 98 | — | |||||||||||||||
| 522 | 522 | 207 | 448 | — | ||||||||||||||||
| Residential real estate loans: |
||||||||||||||||||||
| Residential real estate construction |
2,706 | 2,763 | 188 | 2,283 | — | |||||||||||||||
| Residential real estate - other |
1,708 | 1,708 | 1,009 | 875 | — | |||||||||||||||
| 4,414 | 4,471 | 1,197 | 3,158 | — | ||||||||||||||||
| Consumer |
— | — | — | — | — | |||||||||||||||
| Total |
$ | 6,480 | $ | 6,927 | $ | 2,101 | $ | 4,451 | $ | — | ||||||||||
| Total impaired |
||||||||||||||||||||
| Commercial |
$ | 14,483 | $ | 15,003 | $ | 904 | $ | 13,743 | $ | 477 | ||||||||||
| Residential |
8,778 | 8,914 | 1,197 | 7,064 | 96 | |||||||||||||||
| Consumer |
31 | 45 | — | 39 | 2 | |||||||||||||||
| Total |
$ | 23,292 | $ | 23,962 | $ | 2,101 | $ | 20,846 | $ | 575 | ||||||||||
F-22
Table of Contents
NORTH STATE BANCORP
NOTES TO CONSOLIDATED FINANCIAL STATEMENTS
Years Ended December 31, 2010, 2009 and 2008
NOTE D – LOANS (Continued)
All loans risk rated “substandard”, “doubtful” and “loss” are reviewed to determine if it is an impaired loan. If a loan is determined to be impaired it is removed from its homogeneous group and individually analyzed for impairment. Other groups of loans based on facts and circumstances may also be selected for impairment review. If a loan is impaired, a specific reserve allowance is allocated if necessary. Interest payments on impaired loans are typically applied to principal. Impaired loans are charged off in full or in part when losses are confirmed. As of December 31, 2010, the recorded investment in loans considered impaired totaled $21.2 million. The Company provided for probable losses through specific reserve allowances of $2.1 million with corresponding outstanding loan balances of $6.5 million. Management analyzed and determined the collateral on loan balances of approximately $740,000 to be adequate and no additional specific reserve allowance is necessary, after recording approximately $366,000 in related charge-offs. Included in the impaired loans as of December 31, 2010 are $11.7 million of restructured but still accruing loans and six restructured nonaccrual loans for $520,000, for a balance of troubled debt restructuring amounting to $12.2 million. The loans were primarily restructured to forgive accrued interest due to financial difficulties of the borrower. In addition, the Company has identified and evaluated for impairment $1.2 million of potential problem loans primarily as a result of possible credit problems of the related borrowers which are not included in the above table. Although these loans are not currently impaired, they have been considered by management in assessing the adequacy of its allowance for loan losses due to possible future credit problems of the borrowers. The allowance for loan losses includes allocated reserves of $147,000 for these potential problem loans as of December 31, 2010.
As of December 31, 2009, the recorded investment in loans that management considered impaired totaled $18.8 million including $1.8 million in restructured loans. Impaired loans of $17.1 million had a corresponding allowance of $2.6 million. There was no corresponding allowance with the remaining $1.7 million of loan balances analyzed for impairment after recording approximately $437,000 in related charge-offs. In addition, the Company identified $1.4 million of potential problem loans with $290,000 in allocated reserves included in the allowance for loan losses. The average recorded investment in impaired loans was approximately $13.1 million for 2009. The approximate amount of interest foregone on nonperforming loans during 2009 was $704,000.
Credit Quality Indicators
As part of the on-going monitoring of the credit quality of the Company’s loan portfolio, management examines certain credit quality indicators which consider the risk of payment performance, overall portfolio quality utilizing weighted-average risk rating, general economic factors, net charge-offs, non-performing loans and the level of classified loans. All loans risk rated “substandard”, “doubtful” and “loss” are reviewed on an individual basis for probable losses.
A description of our credit quality indicators follows:
Pass – loans with acceptable credit quality and moderate risk.
Special mention – This grade is intended to be temporary and includes loans (1) with potential weaknesses if left uncorrected could result in deterioration or (2) were classified as substandard accruing or substandard nonaccruing have made improvements to their financial profile but do not yet meet the definition of a pass grade.
Substandard, accruing – These loans have a well defined weakness where the accrual of interest has not been stopped. The defined weakness may make default or principal exposure likely but not certain. These loans are likely to be dependent on collateral liquidation or a secondary source of repayment.
Substandard, nonaccruing – These assets have well defined weakness that jeopardize the liquidation of the debt and are past due over 90 days. The institution may sustain loss if the weaknesses are not corrected. These loans are inadequately protected by the paying capacity of the borrower, any guarantors or of the collateral pledged. These loans are individually analyzed for impairment.
Doubtful – These loans have all the weaknesses of substandard, nonaccruing plus the added characteristic that the weaknesses make collection or liquidation in full on the basis of currently existing facts, conditions and values, highly questionable and improbable.
Loss – These loans are considered uncollectable and of such little value that their continuance as a bankable asset is not warranted. This classification does not mean that the asset has absolutely no recovery or salvage value, but rather that it is not practical or desirable to defer writing off this worthless loan even though partial recovery may be affected in the future.
F-23
Table of Contents
NORTH STATE BANCORP
NOTES TO CONSOLIDATED FINANCIAL STATEMENTS
Years Ended December 31, 2010, 2009 and 2008
NOTE D – LOANS (Continued)
Information regarding the Company’s credit risk by internally assigned risk grades as of December 31, 2010 follows:
| Real Estate Loans | Non-Real Estate Loans | |||||||||||||||||||||||||||||||
| Construction | Commercial & Industrial |
|||||||||||||||||||||||||||||||
| Residential | Commercial | Residential | Commercial | Consumer | Other | Total | ||||||||||||||||||||||||||
| (Dollars in thousands) | ||||||||||||||||||||||||||||||||
| Pass |
$ | 28,520 | $ | 59,248 | $ | 86,490 | $ | 210,372 | $ | 38,616 | $ | 3,066 | $ | 215 | $ | 426,527 | ||||||||||||||||
| Special mention |
4,424 | 8,171 | 6,532 | 3,013 | 1,366 | 28 | — | 23,534 | ||||||||||||||||||||||||
| Substandard accruing |
14,058 | 11,842 | 2,240 | 7,817 | 1,075 | 71 | — | 37,103 | ||||||||||||||||||||||||
| Substandard nonaccruing |
4,056 | 2,875 | 2,697 | 255 | 1,598 | 11 | — | 11,492 | ||||||||||||||||||||||||
| Doubtful |
— | — | 491 | 147 | 180 | — | — | 818 | ||||||||||||||||||||||||
| Loss |
— | — | — | — | 49 | — | — | 49 | ||||||||||||||||||||||||
| Total by exposure |
$ | 51,058 | $ | 82,136 | $ | 98,450 | $ | 221,604 | $ | 42,884 | $ | 3,176 | $ | 215 | $ | 499,523 | ||||||||||||||||
NOTE E - ALLOWANCE FOR LOAN LOSSES
An analysis of the allowance for loan losses for the years ended December 31, 2010, 2009 and 2008 follows:
| 2010 | 2009 | 2008 | ||||||||||
| (Dollars in thousands) | ||||||||||||
| Allowance for loan losses beginning of period |
$ | 8,581 | $ | 6,376 | $ | 5,020 | ||||||
| Provision for loan losses |
8,095 | 5,710 | 2,755 | |||||||||
| Loans charged off |
6,832 | 3,510 | 1,405 | |||||||||
| Recoveries |
(91 | ) | (5 | ) | (6 | ) | ||||||
| Net charge-offs |
6,741 | 3,505 | 1,399 | |||||||||
| Allowance for loan losses end of period |
$ | 9,935 | $ | 8,581 | $ | 6,376 | ||||||
The allowance for possible loan losses is a reserve established through a provision for possible loan losses charged to expense for estimated loan losses inherent in the loan portfolio. The allowance is maintained at a level which management considers adequate to provide for probable loan losses based on our assessment of various factors affecting the loan portfolio. Additional information regarding the Company’s policies and methodology used to estimate the allowance for possible loan losses is presented in Note B- Summary of Significant Accounting Policies.
The table below details activity in the allowance for possible loan losses by segregated loan category for the year ended December 31, 2010. Allocation of a portion of the allowance to one class of loan does not preclude its availability to absorb losses in other categories.
F-24
Table of Contents
NORTH STATE BANCORP
NOTES TO CONSOLIDATED FINANCIAL STATEMENTS
Years Ended December 31, 2010, 2009 and 2008
NOTE E - ALLOWANCE FOR LOAN LOSSES (Continued)
Allowance for Loan Losses and Recorded Investment in Loans
For the Year Ended December 31, 2010
| Real Estate Loans | Non-Real Estate Loans | |||||||||||||||||||||||||||||||
| Construction | Commercial & Industrial |
|||||||||||||||||||||||||||||||
| Residential | Commercial | Residential | Commercial | Consumer | Other | Total | ||||||||||||||||||||||||||
| (Dollars in thousands) | ||||||||||||||||||||||||||||||||
| Allowance for loan losses: |
||||||||||||||||||||||||||||||||
| Beginning balance |
$ | 1,753 | $ | 2,604 | $ | 1,276 | $ | 2,023 | $ | 870 | $ | 42 | $ | 13 | $ | 8,581 | ||||||||||||||||
| Charge-offs |
(3,152 | ) | (1,293 | ) | (765 | ) | (364 | ) | (1,224 | ) | (34 | ) | — | (6,832 | ) | |||||||||||||||||
| Recoveries |
34 | 34 | 7 | 10 | 6 | — | — | 91 | ||||||||||||||||||||||||
| Provision |
2,840 | 924 | 1,821 | 795 | 1,702 | 22 | (9 | ) | 8,095 | |||||||||||||||||||||||
| Ending balance |
$ | 1,475 | $ | 2,269 | $ | 2,339 | $ | 2,464 | $ | 1,354 | $ | 30 | $ | 4 | $ | 9,935 | ||||||||||||||||
| Ending balance, individually evaluated for impairment |
$ | 188 | $ | 96 | $ | 1,009 | $ | 111 | $ | 697 | $ | — | $ | — | $ | 2,101 | ||||||||||||||||
| Ending balance, collectively evaluated for impairment |
$ | 1,287 | $ | 2,173 | $ | 1,330 | $ | 2,353 | $ | 657 | $ | 30 | $ | 4 | $ | 7,834 | ||||||||||||||||
| Loans: |
||||||||||||||||||||||||||||||||
| Ending balance |
$ | 51,058 | $ | 82,136 | $ | 98,450 | $ | 221,604 | $ | 42,884 | $ | 3,176 | $ | 215 | $ | 499,523 | ||||||||||||||||
| Ending balance, individually evaluated for impairment |
$ | 6,081 | $ | 7,662 | $ | 2,697 | $ | 4,134 | $ | 2,687 | $ | 31 | $ | — | $ | 23,292 | ||||||||||||||||
| Ending balance, collectively evaluated for impairment |
$ | 44,977 | $ | 74,474 | $ | 95,753 | $ | 217,470 | $ | 40,197 | $ | 3,145 | $ | 215 | $ | 476,231 | ||||||||||||||||
NOTE F - PREMISES AND EQUIPMENT
Following is a summary of premises and equipment as of December 31, 2010 and 2009:
| As of December 31, | ||||||||
| 2010 | 2009 | |||||||
| (Dollars in thousands) | ||||||||
| Land |
$ | 4,703 | $ | 4,703 | ||||
| Buildings |
8,373 | 8,356 | ||||||
| Leasehold improvements |
2,132 | 1,591 | ||||||
| Furniture, fixtures and equipment |
5,006 | 4,727 | ||||||
| 20,214 | 19,377 | |||||||
| Accumulated depreciation |
(5,413 | ) | (4,531 | ) | ||||
| Total |
$ | 14,801 | $ | 14,846 | ||||
Depreciation and amortization amounting to $927,000 in 2010, $914,000 in 2009, and $808,000 in 2008 is included in occupancy and equipment expense.
F-25
Table of Contents
NORTH STATE BANCORP
NOTES TO CONSOLIDATED FINANCIAL STATEMENTS
Years Ended December 31, 2010, 2009 and 2008
NOTE F - PREMISES AND EQUIPMENT (Continued)
The Company leases office facilities under non-cancelable operating leases. Future minimum lease payments required under the leases are as follows:
| For the Years Ending December 31, |
||||
| (Dollars in thousands) | ||||
| 2011 |
$ | 1,102 | ||
| 2012 |
1,024 | |||
| 2013 |
1,048 | |||
| 2014 |
1,072 | |||
| 2015 |
640 | |||
| Thereafter |
3,682 | |||
| $ | 8,568 | |||
Total building and equipment rental expense for the years ended December 31, 2010, 2009 and 2008 amounted to $1.2 million. Rent expense is included in occupancy and equipment expenses.
NOTE G - DEPOSITS
The aggregate amount of time deposits in denominations of $100,000 or more as of December 31, 2010 and 2009 was approximately $98.8 million and $134.1 million, respectively.
As of December 31, 2010, the scheduled maturities of time deposits were as follows:
| As of December 31, 2010 | ||||||||||||
| Less than $100,000 |
$100,000 or more |
Total | ||||||||||
| (Dollars in thousands) | ||||||||||||
| 2011 |
$ | 77,981 | $ | 69,525 | $ | 147,506 | ||||||
| 2012 |
10,079 | 11,164 | 21,243 | |||||||||
| 2013 |
4,910 | 4,930 | 9,840 | |||||||||
| 2014 |
2,525 | 12,604 | 15,129 | |||||||||
| 2015 |
111 | 610 | 721 | |||||||||
| $ | 95,606 | $ | 98,833 | $ | 194,439 | |||||||
F-26
Table of Contents
NORTH STATE BANCORP
NOTES TO CONSOLIDATED FINANCIAL STATEMENTS
Years Ended December 31, 2010, 2009 and 2008
NOTE H - BORROWINGS
A summary of borrowings are as follows:
| As of December 31, | ||||||||
| 2010 | 2009 | |||||||
| (Dollars in thousands) | ||||||||
| Short-term borrowings |
||||||||
| Repurchase agreements |
$ | 3,615 | $ | 6,103 | ||||
| $ | 3,615 | $ | 6,103 | |||||
| Long-term borrowings |
||||||||
| FHLB advances |
$ | 804 | $ | 825 | ||||
| Subordinated debentures |
11,000 | 11,000 | ||||||
| Junior subordinated debentures |
15,465 | 15,465 | ||||||
| $ | 27,269 | $ | 27,290 | |||||
A description of the trust preferred securities and related junior subordinated debentures outstanding as of December 31, 2010 and December 31, 2009 are as follows:
| Carrying Value as of December 31, |
Maturity Date |
Interest Rate | ||||||||||||
| 2010 | 2009 | |||||||||||||
| (Dollars in thousands) | ||||||||||||||
| North State Statutory Trust I |
$ | 5,155 | $ | 5,155 | 4/17/2034 | 3 mo LIBOR plus 2.79%, resets quarterly | ||||||||
| North State Statutory Trust II |
5,155 | 5,155 | 4/15/2035 | 3 mo LIBOR plus 1.65%, resets quarterly | ||||||||||
| North State Statutory Trust III |
5,155 | 5,155 | 12/15/2037 | 3 mo LIBOR plus 2.75%, resets quarterly | ||||||||||
| $ | 15,465 | $ | 15,465 | |||||||||||
A description of the subordinated debentures outstanding as of December 31, 2010 and December 31, 2009 are as follows:
| Carrying Value as of December 31, |
Maturity Date |
Interest Rate | ||||||||||||
| 2010 | 2009 | |||||||||||||
| (Dollars in thousands) | ||||||||||||||
| Floating rate subordinated notes |
$ | 11,000 | $ | 11,000 | 6/30/2018 | 3 mo LIBOR plus 3.50%, resets quarterly | ||||||||
Short-term Borrowings
The Company had repurchase agreements outstanding in the amount of $3.6 million and $6.1 million as of December 31, 2010 and 2009, respectively. Securities sold under agreements to repurchase generally mature within one to four days from the transaction date and are collateralized by U.S. Government securities and obligations of U.S. government agencies or Government-sponsored residential mortgage-backed securities. These repurchase agreements are due within one year and are classified as short-term borrowings in the accompanying consolidated balance sheets.
As of and throughout the years ended December 31, 2010 and 2009, the Company had no outstanding Federal Home Loan Bank (“FHLB”) short-term advances. Currently, any advances are secured by cash or other assets available for collateralization.
As of December 31, 2010, the Company had pre-approved available lines of credit totaling approximately $163.7 million with various financial institutions and the Federal Reserve for borrowing on a short-term basis, with no amounts outstanding at that date. These lines are subject to annual renewals with varying interest rates.
Long-term Debt
On March 17, 2004, the Company issued $5.2 million of junior subordinated debentures to North State Statutory Trust I (“Trust I”) in exchange for the proceeds of trust preferred securities issued by Trust I. On December 15, 2005, the Company issued $5.2 million of junior subordinated debentures to North State Statutory Trust II (“Trust II”) in exchange for the proceeds of trust preferred securities issued by Trust II. On November 28, 2007, the Company issued $5.2 million of junior subordinated debentures to North State Statutory Trust III (“Trust III”) in exchange for the proceeds of trust preferred securities issued by Trust III. Trust I, Trust II and Trust III are wholly owned by the Company. The junior subordinated deferrable interest debentures are included in long-term debt and the Company’s equity interests in Trust I, Trust II and Trust III are included in other assets.
F-27
Table of Contents
NORTH STATE BANCORP
NOTES TO CONSOLIDATED FINANCIAL STATEMENTS
Years Ended December 31, 2010, 2009 and 2008
NOTE H - BORROWINGS (Continued)
Long-term Debt (Continued)
The junior subordinated debentures for Trust I pay interest quarterly at an annual rate, reset quarterly, equal to 3-month LIBOR plus 2.79%. The debentures became redeemable on June 17, 2009 or afterwards in whole or in part, on any January 17, April 17, July 17 or October 17. Redemption is mandatory at April 17, 2034. The Company has fully and unconditionally guaranteed the repayment of the trust preferred securities. The Company’s obligation under the guarantee is unsecured and subordinate to senior and subordinated indebtedness of the Company.
The junior subordinated debentures for Trust II pay interest quarterly at an annual rate, reset quarterly, equal to 3-month LIBOR plus 1.65%. The debentures became redeemable on March 15, 2011 or afterwards in whole or in part, on any January 15, April 15, July 15 or October 15. Redemption is mandatory at April 15, 2035. The Company has fully and unconditionally guaranteed the repayment of the trust preferred securities. The Company’s obligation under the guarantee is unsecured and subordinate to senior and subordinated indebtedness of the Company.
The junior subordinated debentures for Trust III pay interest quarterly at an annual rate, reset quarterly, equal to 3-month LIBOR plus 2.75%. The debentures are redeemable on March 15, 2013 or afterwards in whole or in part, on any January 15, April 15, July 15 or October 15. Redemption is mandatory at December 15, 2037. The Company has fully and unconditionally guaranteed the repayment of the trust preferred securities. The Company’s obligation under the guarantee is unsecured and subordinate to senior and subordinated indebtedness of the Company.
As of December 31, 2010 the trust preferred securities issued by Trust I, Trust II and Trust III qualified as Tier I regulatory capital for regulatory capital purposes subject to certain limitations. Amounts in excess of the limitations count as Tier II supplementary capital for regulatory capital purposes. Effective March 31, 2011, the Federal Reserve rule limits the aggregate amount of restricted core capital elements, including trust preferred securities, that can be included in Tier I capital to not more than 25% of total core capital elements, net of goodwill, less any associated tax liability. The new rule also limits the aggregate amount of restricted core capital elements (including trust preferred securities), term subordinated debt and limited life preferred stock that can be included in Tier II capital to 50% of Tier I capital. Because of the current economic and regulatory environment, the Company’s board of directors has agreed to seek prior approval from our federal regulator before making any payments on our trust preferred securities.
On May 13, 2008, the Bank issued $9.8 million and, on July 1, 2008, $1.2 million of floating-rate subordinated notes due June 30, 2018. Interest on the notes is payable quarterly in arrears on March 31, June 30, September 30 and December 31 of each year beginning with June 30, 2008. The interest rate on the notes is based on 3-month LIBOR plus 3.50% and resets quarterly on the 15th of March, June, September and December of each year. The Bank may redeem some or all of the notes at any time beginning on June 30, 2013 at a price equal to 100% of the principal amount of the notes redeemed plus accrued but unpaid interest to the redemption date. The subordinated notes are included in long-term debt and qualify as Tier II capital.
As of December 31, 2010 and 2009, the Company had $804,000 and $825,000, respectively, in a long-term FHLB advance. This advance, maturing October 7, 2025, funds a qualified Community Investment Program loan. The Company pays 2.00% interest for the advance with the loan earning 4.00%. These advances are secured by cash as of December 31, 2010 and by a blanket floating lien on qualifying 1-4 family mortgage loans as of December 31, 2009.
F-28
Table of Contents
NORTH STATE BANCORP
NOTES TO CONSOLIDATED FINANCIAL STATEMENTS
Years Ended December 31, 2010, 2009 and 2008
NOTE I - INCOME TAXES
The significant components of the provision for income taxes for the years ended December 31, 2010, 2009 and 2008 are as follows:
| 2010 | 2009 | 2008 | ||||||||||
| (Dollars in thousands) | ||||||||||||
| Current tax expense: |
||||||||||||
| Federal |
$ | 1,538 | $ | 727 | $ | 1,544 | ||||||
| State |
244 | 303 | 399 | |||||||||
| 1,782 | 1,030 | 1,943 | ||||||||||
| Deferred tax provision: |
||||||||||||
| Federal |
(1,006 | ) | (147 | ) | (333 | ) | ||||||
| State |
(59 | ) | (109 | ) | (112 | ) | ||||||
| (1,065 | ) | (256 | ) | (445 | ) | |||||||
| Provision for income tax expense before adjustment to deferred tax asset valuation allowance |
717 | 774 | 1,498 | |||||||||
| Increase in valuation allowance |
78 | 43 | 57 | |||||||||
| Net provision for income taxes |
$ | 795 | $ | 817 | $ | 1,555 | ||||||
The difference between the provision for income taxes and the amounts computed by applying the statutory federal income tax rate of 34% to income before income taxes is summarized below:
| 2010 | 2009 | 2008 | ||||||||||
| (Dollars in thousands) | ||||||||||||
| Expected income tax expense |
$ | 618 | $ | 651 | $ | 1,333 | ||||||
| Increase (decrease) resulting from: |
||||||||||||
| State income taxes, net of federal tax effect |
114 | 87 | 178 | |||||||||
| Adjustment to deferred tax asset valuation allowance |
78 | 43 | 57 | |||||||||
| Credits |
(47 | ) | (29 | ) | (53 | ) | ||||||
| Other permanent differences |
32 | 65 | 40 | |||||||||
| Provision for income taxes |
$ | 795 | $ | 817 | $ | 1,555 | ||||||
F-29
Table of Contents
NORTH STATE BANCORP
NOTES TO CONSOLIDATED FINANCIAL STATEMENTS
Years Ended December 31, 2010, 2009 and 2008
NOTE I - INCOME TAXES (Continued)
Deferred income taxes reflect the net tax effects of temporary differences between the carrying amounts of assets and liabilities for financial reporting purposes and the amounts used for income tax purposes. Significant components of deferred taxes at December 31, 2010 and 2009 are as follows:
| 2010 | 2009 | |||||||
| (Dollars in thousands) | ||||||||
| Deferred tax assets relating to: |
||||||||
| Allowance for loan losses |
$ | 3,775 | $ | 3,212 | ||||
| Deferred compensation |
71 | 189 | ||||||
| Unrealized loss on available for sale securities |
32 | — | ||||||
| Capital loss carryforward |
40 | 47 | ||||||
| Foreclosed assets |
213 | 269 | ||||||
| Interest on nonaccrual loans |
44 | — | ||||||
| Lease obligations |
144 | 136 | ||||||
| CAHEC investment |
17 | 15 | ||||||
| Other |
— | 25 | ||||||
| State net operating loss carryforwards |
270 | 235 | ||||||
| Total deferred tax assets |
4,606 | 4,128 | ||||||
| Less: Valuation allowance |
(310 | ) | (232 | ) | ||||
| Net deferred tax asset |
4,296 | 3,896 | ||||||
| Deferred tax liabilities relating to: |
||||||||
| Deferred loan origination fees |
(323 | ) | (281 | ) | ||||
| Goodwill |
(4 | ) | — | |||||
| Unrealized gain on available for sale securities |
— | (254 | ) | |||||
| Property and equipment |
(309 | ) | (679 | ) | ||||
| Prepaid expenses |
(101 | ) | (106 | ) | ||||
| Total deferred tax liabilities |
(737 | ) | (1,320 | ) | ||||
| Net recorded deferred tax assets included in other assets |
$ | 3,559 | $ | 2,576 | ||||
It is the Company’s policy to recognize interest and penalties associated with uncertain tax positions as components of income taxes. There were no interest or penalties accrued during 2010 or 2009. The Company’s federal and state income tax returns are subject to examination for the years 2007, 2008, and 2009. There were uncertain tax positions as of December 31, 2010 or 2009. The valuation allowance is related to a state net operating loss and capital loss carryforwards.
F-30
Table of Contents
NORTH STATE BANCORP
NOTES TO CONSOLIDATED FINANCIAL STATEMENTS
Years Ended December 31, 2010, 2009 and 2008
NOTE J - NON-INTEREST INCOME AND OTHER NON-INTEREST EXPENSE
The major components of non-interest income for the years ended December 31, 2010, 2009 and 2008 are as follows:
| 2010 | 2009 | 2008 | ||||||||||
| (Dollars in thousands) | ||||||||||||
| Merchant and other loan fees |
$ | 114 | $ | 136 | $ | 520 | ||||||
| Service charges and fees on deposit accounts |
402 | 432 | 428 | |||||||||
| Gain on sale of equity interest in investment |
— | 18 | — | |||||||||
| Gain on sale of investment securities |
741 | 464 | 7 | |||||||||
| Impairment loss on nonmarketable securities |
— | (134 | ) | — | ||||||||
| Fees from mortgage operations |
2,620 | — | 72 | |||||||||
| Other |
599 | 252 | 199 | |||||||||
| Total other non-interest income |
$ | 4,476 | $ | 1,168 | $ | 1,226 | ||||||
The major components of other non-interest expense for the years ended December 31, 2010, 2009 and 2008 are as follows:
| 2010 | 2009 | 2008 | ||||||||||
| (Dollars in thousands) | ||||||||||||
| Professional fees |
$ | 478 | $ | 419 | $ | 364 | ||||||
| Postage, printing & office supplies |
160 | 120 | 169 | |||||||||
| Advertising and promotion |
133 | 134 | 329 | |||||||||
| Data processing & other outsourced services |
1,466 | 1,200 | 854 | |||||||||
| Directors fees |
40 | 17 | 199 | |||||||||
| FDIC insurance premiums |
1,346 | 1,766 | 396 | |||||||||
| Net cost of foreclosed assets |
1,587 | 807 | 5 | |||||||||
| Other |
1,652 | 1,486 | 1,853 | |||||||||
| Total other non-interest expense |
$ | 6,862 | $ | 5,949 | $ | 4,169 | ||||||
NOTE K - REGULATORY MATTERS
The Bank, as a North Carolina banking corporation, may pay cash dividends to the Company only out of undivided profits as determined pursuant to North Carolina General Statutes Section 53-87. However, regulatory authorities may limit payment of dividends by any bank when it is determined that such limitation is in the public interest and is necessary to ensure financial soundness of the bank.
The Company (on a consolidated basis) and the Bank are subject to various regulatory capital requirements administered by federal and state banking agencies. Failure to meet minimum capital requirements can initiate certain mandatory - and possibly additional discretionary - actions by regulators that, if undertaken, could have a direct material effect on the Company’s consolidated financial statements. Under capital adequacy guidelines and the regulatory framework for prompt corrective action, the Bank must meet specific capital guidelines that involve quantitative measures of its assets, liabilities, and certain off-balance-sheet items as calculated under regulatory accounting practices. The capital amounts and classifications are also subject to qualitative judgments by the regulators about components, risk weightings, and other factors. Prompt corrective action provisions are not applicable to bank holding companies.
As of December 31, 2010, the most recent notification from the FDIC categorized the Bank as well capitalized under the regulatory framework for prompt corrective action. To be categorized as well capitalized, the Bank must maintain minimum amounts and ratios. There are no conditions or events since that notification that management believes have changed the Bank’s category.
F-31
Table of Contents
NORTH STATE BANCORP
NOTES TO CONSOLIDATED FINANCIAL STATEMENTS
Years Ended December 31, 2010, 2009 and 2008
NOTE K - REGULATORY MATTERS (Continued)
Quantitative measures established by regulation to ensure capital adequacy require the Company and the Bank to maintain minimum amounts and ratios, as prescribed by regulations, of total and Tier I capital to risk-weighted assets and of Tier I capital to average assets. As of December 31, 2010 and 2009, the Company and the Bank met their respective capital adequacy requirements.
Information regarding the Bank’s capital and capital ratios is set forth below:
| Minimum for capital adequacy purposes |
Minimum to be well capitalized under prompt corrective action provisions |
|||||||||||||||||||||||
| Actual | ||||||||||||||||||||||||
| Actual | Ratio | Actual | Ratio | Actual | Ratio | |||||||||||||||||||
| (Dollars in thousands) | ||||||||||||||||||||||||
| As of December 31, 2010 |
||||||||||||||||||||||||
| Total capital to risk-weighted assets |
$ | 68,425 | 12.99 | % | $ | 42,141 | 8.00 | % | $ | 52,677 | 10.00 | % | ||||||||||||
| Tier I capital to risk-weighted assets |
50,799 | 9.64 | % | 21,071 | 4.00 | % | 31,606 | 6.00 | % | |||||||||||||||
| Tier I capital to average assets |
50,799 | 8.04 | % | 25,280 | 4.00 | % | 31,600 | 5.00 | % | |||||||||||||||
| As of December 31, 2009: |
||||||||||||||||||||||||
| Total capital to risk-weighted assets |
$ | 67,748 | 12.64 | % | $ | 42,875 | 8.00 | % | $ | 53,594 | 10.00 | % | ||||||||||||
| Tier I capital to risk-weighted assets |
50,039 | 9.34 | % | 21,438 | 4.00 | % | 32,156 | 6.00 | % | |||||||||||||||
| Tier I capital to average assets |
50,039 | 7.31 | % | 27,394 | 4.00 | % | 34,242 | 5.00 | % | |||||||||||||||
The Company is also subject to these capital requirements. Information regarding the Company’s capital and capital ratios is set forth below:
| December 31, 2010 | December 31, 2009 | |||||||||||||||
| Amount | Ratio | Amount | Ratio | |||||||||||||
| (Dollars in thousands) | ||||||||||||||||
| Total capital to risk-weighted assets |
$ | 70,518 | 13.37 | % | $ | 68,943 | 12.86 | % | ||||||||
| Tier I capital to risk-weighted assets |
49,895 | 9.46 | % | 47,688 | 8.89 | % | ||||||||||
| Tier I capital to average assets |
49,895 | 7.89 | % | 47,688 | 6.96 | % | ||||||||||
NOTE L - OFF-BALANCE SHEET RISK
The Company is a party to financial instruments with off-balance sheet risk in the normal course of business to meet the financing needs of its customers. These financial instruments include commitments to extend credit and standby letters of credit. Those instruments involve, to varying degrees, elements of credit and interest rate risk in excess of the amount recognized in the balance sheet. The contract or notional amounts of those instruments reflect the extent of involvement the Company has in particular classes of financial instruments. The Company uses the same credit policies in making commitments and conditional obligations as it does for on-balance-sheet instruments.
Commitments to extend credit are agreements to lend to a customer as long as there is no violation of conditions established in the contract. Commitments generally have fixed expiration dates or other termination clauses and may require payment of a fee. Since some of the commitments are expected to expire without being drawn upon, the total commitment amounts do not necessarily represent future cash requirements. The Company evaluates each customer’s creditworthiness on a case-by-case basis. The amount of collateral obtained, if deemed necessary by the Company, upon extension of credit is based on management’s credit evaluation of the borrower. Collateral obtained varies but may include real estate, stocks, bonds, and certificates of deposit. The liability related to off balance sheet commitments is not considered material as of December 31, 2010 or 2009.
F-32
Table of Contents
NORTH STATE BANCORP
NOTES TO CONSOLIDATED FINANCIAL STATEMENTS
Years Ended December 31, 2010, 2009 and 2008
NOTE L - OFF-BALANCE SHEET RISK (Continued)
A summary of the contract amount of the Company’s exposure to off-balance sheet credit risk as of December 31, 2010 is as follows (Dollars in thousands):
| Financial instruments whose contract amounts represent credit risk: |
||||
| Commitments to extend credit |
$ | 31,413 | ||
| Undisbursed lines of credit |
17,644 | |||
| Letters of credit |
1,799 | |||
| Commitments to originate mortgage loans, fixed and variable rate |
70,907 |
NOTE M - DISCLOSURES ABOUT FAIR VALUES OF FINANCIAL INSTRUMENTS
Financial instruments include cash and due from banks, interest-bearing deposits with banks, certificates of deposit with banks, federal funds sold, investments, accrued interest, loans, written loan commitments, deposit accounts and borrowings. The Company has recorded certain assets at fair value as required by accounting standards on the proper disclosure of fair value of financial instruments. Fair value estimates are made at a specific moment in time, based on relevant market information and information about the financial instrument. These estimates do not reflect any premium or discount that could result from offering for sale at one time the Company’s entire holdings of a particular financial instrument. Because no active market readily exists for a portion of the Company’s financial instruments, fair value estimates are based on judgments regarding future expected loss experience, current economic conditions, risk characteristics of various financial instruments, and other factors. These estimates are subjective in nature and involve uncertainties and matters of significant judgment and, therefore, cannot be determined with precision. Changes in assumptions could significantly affect the estimates.
The following methods and assumptions were used to estimate the fair value of each class of financial instruments for which it is practicable to estimate that value:
Cash and Due from Banks, Interest-Earning Deposits With Banks, and Federal Funds Sold
The carrying amounts are a reasonable estimate of fair value for cash and due from banks, interest-earning deposits with banks, and federal funds sold because of the short maturities of those instruments.
Certificates of Deposit with Banks
The fair values are based on discounting expected cash flows at the interest rate for certificates of deposit with the same or similar remaining maturity.
Investment Securities
Fair value for investment securities available for sale equals quoted market price if such information is available. If a quoted market price is not available, fair value is estimated using quoted market prices for similar securities. Fair value for investment securities held to maturity is determined using discounted cash flow analysis.
Loans and Loans Held for Sale
The fair value of loans is based on estimated cash flows using the current rates at which similar loans would be made to borrowers with similar credit ratings and for the same remaining maturities, less a credit component. The carrying amount of loans held for sale is a reasonable estimate of fair value since they will be sold in a short period. This does not include consideration of liquidity that market participants would use to value such loans.
Stock in Federal Home Loan Bank of Atlanta
The fair value for FHLB stock approximates carrying value, based on the redemption provisions of the Federal Home Loan Bank.
Deposits
The fair value of demand, savings, money market and NOW deposits is the amount payable on demand at the reporting date. The fair value of time deposits and borrowings is estimated by discounting expected cash flows using the rates currently offered for instruments of similar remaining maturities.
F-33
Table of Contents
NORTH STATE BANCORP
NOTES TO CONSOLIDATED FINANCIAL STATEMENTS
Years Ended December 31, 2010, 2009 and 2008
NOTE M - DISCLOSURES ABOUT FAIR VALUES OF FINANCIAL INSTRUMENTS (Continued)
Borrowings
The fair values are based on discounting expected cash flows at the interest rate for debt with the same or similar remaining maturities and collateral requirements.
Accrued Interest
The carrying amounts of accrued interest approximate fair value.
Written Loan Commitments
The Company enters into interest rate lock commitments and commitments to sell mortgages. At December 31, 2010, the amount of fair value associated with these written loan commitments was approximately $411,000, which is included in other assets. Forward loan sale commitments are generally equal and offsetting to interest rate lock commitments. The Company had no interest rate lock commitments at December 31, 2009.
Financial Instruments with Off-Balance Sheet Risk
With regard to financial instruments with off-balance sheet risk discussed in Note L, the estimated fair value of future financing commitments is not deemed material.
The following table presents the carrying values and estimated fair values of the Company’s financial instruments as of December 31, 2010 and 2009.
| 2010 | 2009 | |||||||||||||||
| Carrying Amount |
Estimated Fair Value |
Carrying Amount |
Estimated Fair Value |
|||||||||||||
| (Dollars in thousands) | ||||||||||||||||
| Financial assets: |
||||||||||||||||
| Cash and due from banks |
$ | 5,974 | $ | 5,974 | $ | 8,096 | $ | 8,096 | ||||||||
| Interest-earning deposits with banks |
43,859 | 43,859 | 50,987 | 50,987 | ||||||||||||
| Certificates of deposit with banks |
198 | 198 | 50,196 | 50,219 | ||||||||||||
| Investment securities available for sale |
9,234 | 9,234 | 23,398 | 23,398 | ||||||||||||
| Investment securities held to maturity |
250 | 211 | 750 | 693 | ||||||||||||
| Loans held for sale |
51,472 | 51,472 | — | — | ||||||||||||
| Loans, net |
489,588 | 490,131 | 513,228 | 514,808 | ||||||||||||
| Accrued interest receivable |
1,654 | 1,654 | 1,811 | 1,811 | ||||||||||||
| Stock in the Federal Home Loan Bank |
1,273 | 1,273 | 1,275 | 1,275 | ||||||||||||
| Written loan commitments |
411 | 411 | — | — | ||||||||||||
| Financial liabilities: |
||||||||||||||||
| Deposits |
$ | 562,748 | $ | 562,640 | $ | 606,888 | $ | 606,690 | ||||||||
| Short-term borrowings |
3,615 | 3,615 | 6,103 | 6,103 | ||||||||||||
| Long-term debt |
27,269 | 27,253 | 27,290 | 27,185 | ||||||||||||
| Accrued interest payable |
1,181 | 1,181 | 1,724 | 1,724 | ||||||||||||
NOTE N - FAIR VALUES OF ASSETS AND LIABILITIES
The Company utilizes fair value measurements to record fair value adjustments to certain assets and liabilities and to determine fair value disclosures. Securities available-for-sale are recorded at fair value on a recurring basis. Additionally, from time to time, the Company may be required to record at fair value other assets on a nonrecurring basis, such as impaired loans. The nonrecurring fair value adjustments typically involve application of lower of cost or market accounting or write-downs of individual assets. The Company groups its financial assets and financial liabilities measured at fair value in three levels, based on the markets in which the assets and liabilities are traded and the reliability of the assumptions used to determine fair value. These levels are:
| • | Level 1 – Valuations for assets and liabilities traded in active exchange markets, such as the New York Stock Exchange. Level 1 also includes U.S. Treasury, other U.S. government and agency mortgage-backed securities that are traded by dealers or brokers in active markets. Valuations are obtained from readily available pricing sources for market transactions involving identical assets or liabilities. |
F-34
Table of Contents
NORTH STATE BANCORP
NOTES TO CONSOLIDATED FINANCIAL STATEMENTS
Years Ended December 31, 2010, 2009 and 2008
NOTE N - FAIR VALUES OF ASSETS AND LIABILITIES (Continued)
| • | Level 2 – Valuations for assets and liabilities traded in less active dealer or broker markets. Valuations are obtained from third party services for identical or comparable assets or liabilities. |
| • | Level 3 – Valuations for assets and liabilities that are derived from other valuation methodologies, including option pricing models, discounted cash flow models and similar techniques, and not based on market exchange, dealer, or brokered traded transactions. Level 3 valuations incorporate certain assumptions and projections in determining the fair value assigned to such assets or liabilities. |
The following is a description of valuation methodologies used by the Company for assets and liabilities recorded at fair value.
Investment Securities Available for Sale
Investment securities available-for-sale are recorded at fair value on a recurring basis. Fair value measurement is based upon quoted prices, if available. If quoted prices are not available, fair values are measured using independent pricing models or other model-based valuation techniques such as the present value of future cash flows, adjusted for the security’s credit rating, prepayment assumptions and other factors such as credit loss assumptions. Level 1 securities include those traded on an active exchange, such as the New York Stock Exchange, U.S. Treasury securities that are traded by dealers or brokers in active over-the-counter markets and money market funds. Level 2 securities include mortgage-backed securities issued by government sponsored entities, municipal bonds and corporate debt securities. Securities classified as Level 3 include asset-backed securities in less liquid markets.
Mortgage Banking Activity
The Company enters into written loan commitments and commitments to sell mortgages. Changes in the written loan commitments subjected to recurring fair value adjustments are affected by the changes in the balances of locked mortgage loan commitments, changes in the fall out rates and changes in the prevailing secondary market prices for like-kind mortgage loans. The fall out rate measures the likelihood that an interest rate lock commitment will ultimately not become a closed loan held for sale. Fall out rates as of December 31, 2010 averaged 21.6%. As of December 31, 2010, the amount of fair value associated with these written loan commitments was $411,000, which was included in other assets. The Company had no written loan commitments as of December 31, 2009. Forward loan sale commitments are generally equal and offsetting to the interest rate lock committment.
Loans
The Company does not record loans at fair value on a recurring basis. However, from time to time, a loan is considered impaired and an allowance for loan losses is established. Loans for which it is probable that payment of interest and principal will not be made in accordance with the contractual terms of the loan agreement are considered impaired. Once a loan is identified as impaired, management measures the impairment in accordance with accounting standards. The fair value of impaired loans is estimated using one of several methods, including collateral value, market value of similar debt, enterprise value, liquidation value or discounted cash flows. Those impaired loans not requiring an allowance represent loans for which the fair value of the expected repayments or collateral exceed the recorded investments in such loans. As of December 31, 2010, a portion of the Company’s impaired loans was evaluated based on the fair value of the collateral. Impaired loans where an allowance is established based on the fair value of collateral require classification in the fair value hierarchy. When the fair value of the collateral is based on an observable market price or a current appraised value, the Company records the impaired loan as nonrecurring Level 2. When an appraised value is not available or management determines the fair value of the collateral is further impaired below the appraised value and there is no observable market price, the Company records the impaired loan as nonrecurring Level 3.
Foreclosed Assets
Foreclosed assets are adjusted to fair value, less cost to sale, upon transfer of the loans to foreclosed assets. Subsequently, foreclosed assets are carried at fair value less costs to sell. Fair value is based upon independent market prices, appraised values of the collateral or management’s estimation of the value of the collateral. When the fair value of the collateral is based on an observable market price or a current appraised value, the Company records the foreclosed asset as nonrecurring Level 2. When an appraised value is not available or management determines the fair value of the collateral is further impaired below the appraised value and there is no observable market price, the Company records the foreclosed asset as nonrecurring Level 3.
F-35
Table of Contents
NORTH STATE BANCORP
NOTES TO CONSOLIDATED FINANCIAL STATEMENTS
Years Ended December 31, 2010, 2009 and 2008
NOTE N - FAIR VALUE MEASUREMENT (Continued)
The table below presents the balances of assets and liabilities measured at fair value on a recurring basis.
| As of December 31, 2010 | ||||||||||||||||
| Total | Level 1 | Level 2 | Level 3 | |||||||||||||
| (Dollars in thousands) | ||||||||||||||||
| Securities available for sale: |
||||||||||||||||
| U. S. government securities and obligations of U.S. government agencies |
$ | 5,500 | $ | — | $ | 5,500 | $ | — | ||||||||
| Government-sponsored residential mortgage-backed securities |
3,734 | — | 3,734 | — | ||||||||||||
| Written loan commitments |
411 | — | — | 411 | ||||||||||||
| Total assets at fair value |
$ | 9,645 | $ | — | $ | 9,234 | $ | 411 | ||||||||
| As of December 31, 2009 | ||||||||||||||||
| Total | Level 1 | Level 2 | Level 3 | |||||||||||||
| (Dollars in thousands) | ||||||||||||||||
| Securities available for sale: |
||||||||||||||||
| Government-sponsored residential mortgage-backed securities |
$ | 23,398 | $ | — | $ | 23,398 | $ | — | ||||||||
| Total assets at fair value |
$ | 23,398 | $ | — | $ | 23,398 | $ | — | ||||||||
The Company may be required, from time to time, to measure certain assets at fair value on a nonrecurring basis in accordance with U.S. generally accepted accounting principles. These include assets that are measured at the lower of cost or market that were recognized at fair value below cost at the end of the period.
The table below presents the balances of assets and liabilities measured at fair value on a nonrecurring basis.
| As of December 31, 2010 | ||||||||||||||||
| Total | Level 1 | Level 2 | Level 3 | |||||||||||||
| (Dollars in thousands) | ||||||||||||||||
| Impaired loans |
$ | 5,119 | $ | — | $ | 727 | $ | 4,392 | ||||||||
| Foreclosed assets |
$ | 5,296 | $ | — | $ | — | $ | 5,296 | ||||||||
| As of December 31, 2009 | ||||||||||||||||
| Total | Level 1 | Level 2 | Level 3 | |||||||||||||
| (Dollars in thousands) | ||||||||||||||||
| Impaired loans |
$ | 15,997 | $ | — | $ | 15,997 | $ | — | ||||||||
| Foreclosed assets |
$ | 3,271 | $ | — | $ | 756 | $ | 2,515 | ||||||||
Approximately $1.8 of the December 31, 2010 level 2 impaired loans were transferred to level 3 as of December 31, 2010 as a result of further market driven discounts.
NOTE O - EMPLOYEE AND DIRECTOR BENEFIT PLANS
Stock Option Plans
During 2000, the Bank adopted, with shareholder approval, an Employee Stock Option Plan and a Non-Employee Director Stock Option Plan. The Company assumed these plans in July 2002 as part of the Bank’s holding company reorganization. In 2003, the Company adopted, with shareholder approval, the 2003 Stock Plan. The 2003 Stock Plan replaced the two prior plans. All shares available for issuance under the prior plans, plus any shares covered by outstanding options that are forfeited under the prior plans were transferred to the 2003 Plan. An aggregate of 1,239,827 shares of the Company’s common stock was initially reserved for options under the stock option plans.
F-36
Table of Contents
NORTH STATE BANCORP
NOTES TO CONSOLIDATED FINANCIAL STATEMENTS
Years Ended December 31, 2010, 2009 and 2008
NOTE O - EMPLOYEE AND DIRECTOR BENEFIT PLANS (Continued)
Stock Option Plan (Continued)
On May 9, 2007, the Company’s shareholders approved an additional 525,000 shares of the Company’s common stock for future issuance of options under the 2003 Stock Plan. Certain of the options granted to directors in 2000 vested immediately at the time of grant. All other options granted vest 20% annually. All unexercised options expire ten years after the date of grant.
The fair market value of each option award is estimated on the date of grant using the Black-Scholes option pricing model. In valuing options under Black-Scholes, the risk-free interest rate is based upon a U.S. Treasury instrument with a life that is similar to the expected life of the option grant. Expected volatility is estimated based on the Company’s historical volatility over a period similar to the expected life of the option grant. The expected term of the options is based upon the average life of previously issued stock options. The expected dividend yield is based upon current yield on date of grant. No post-vesting restrictions exist for these options. The following table illustrates the assumptions for the Black-Scholes model used in determining the fair value of options granted to employees for the years ended December 31, 2010 and 2009.
| 2010 | 2009 | |||
| Estimated fair value of options granted |
$1.97 | $2.80 | ||
| Assumptions in estimating option values: |
||||
| Risk-free interest rate |
2.39% | 1.89% | ||
| Dividend yield |
0.00% | 0.00% | ||
| Expected volatility |
39.6% - 41.0% | 40.4% | ||
| Expected life |
6.5 - 7 years | 6 years |
A summary of option activity under the stock option plan for the year ended December 31, 2010 is as follows:
| Weighted Average | Aggregate Intrinsic Value |
|||||||||||||||
| Shares | Exercise Price |
Remaining Contractual Term |
||||||||||||||
| (In thousands) |
||||||||||||||||
| Outstanding December 31, 2009 |
361,711 | $ | 4.93 | 2.34 years | $ | 395 | ||||||||||
| Granted |
15,000 | 4.41 | ||||||||||||||
| Exercised |
(229,463 | ) | 2.66 | |||||||||||||
| Forfeited |
(6,750 | ) | 6.55 | |||||||||||||
| Outstanding at December 31, 2010 |
140,498 | $ | 8.51 | 5.19 years | $ | 9 | ||||||||||
| Exercisable at December 31, 2010 |
101,975 | $ | 8.08 | 4.20 years | $ | 9 | ||||||||||
| Range of Exercise Prices | ||||||||
| Number of options outstanding |
Number of options exercisable |
|||||||
| $3.22 - $5.15 |
65,298 | 50,285 | ||||||
| $6.37 - $12.25 |
48,700 | 35,790 | ||||||
| $17.00 - $18.50 |
26,500 | 15,900 | ||||||
| 140,498 | 101,975 | |||||||
F-37
Table of Contents
NORTH STATE BANCORP
NOTES TO CONSOLIDATED FINANCIAL STATEMENTS
Years Ended December 31, 2010, 2009 and 2008
NOTE O - EMPLOYEE AND DIRECTOR BENEFIT PLANS (Continued)
Stock Option Plan (Continued)
| Shares | Weighted Average Grant Date Fair Value |
|||||||
| Nonvested, December 31, 2009 |
39,113 | $ | 12.70 | |||||
| Granted |
15,000 | 4.41 | ||||||
| Vested |
(15,040 | ) | 12.33 | |||||
| Forfeited |
(550 | ) | 11.29 | |||||
| Nonvested, December 31, 2010 |
38,523 | 9.64 | ||||||
For the years ended December 31, 2010 and 2009, the intrinsic value of options exercised was approximately $400,000 and $54,000, respectively. During the first quarter of 2010, 10,000 options were granted with a fair value of $2.11 per option and during the second quarter of 2010 an additional 5,000 options were granted with a fair value of $1.68 per option. During 2009, 8,000 options were granted during the first quarter with a fair value of $2.80 per option. The fair value of options vested was approximately $100,000 and $119,000 for the years ended December 31, 2010 and 2009, respectively. As of December 31, 2010, approximately $152,000 of share-based compensation expense remained to be recognized over a weighted average period of approximately three years.
Cash received from option exercises under share-based payment arrangements for the year ended December 31, 2010 and 2009 was approximately $611,000 and $89,000, respectively. Tax benefits of $60,000 and $9,000 were realized for tax deductions from option exercise of the share-based payment arrangements during the years ended December 31, 2010 and 2009, respectively.
Employment Agreements
The Company has entered into an employment agreement with its chief executive officer to ensure a stable and competent management base. This agreement provides for benefits as spelled out in the contract and cannot be terminated by the Board of Directors, except for cause, without prejudicing the officer’s right to receive certain vested rights, including compensation. In the event of a change in control of the Company, as outlined in the agreement, the acquirer will be bound to the terms of this contract.
The Company has entered into agreements with four executive officers and one non-executive officer that provide for severance pay benefits in the event of a change in control of the Company that results in the termination of such officers or diminished compensation, duties or benefits.
Deferred Compensation Plan for Directors
In December 2001, the Company implemented a non-qualifying deferred compensation plan for directors. Under the plan, a participating director could elect to defer receipt of all or a portion of his or her director fees that would otherwise be payable in cash. At the end of each calendar year, the fees electively deferred during the year were converted, using a formula based upon 125% of the dollar amount of fees deferred and the fair value of the Company’s common stock at the close of business on the preceding January 1, into a hypothetical number of shares (the “phantom shares”) credited to the participating director’s account. The then current value of all phantom shares accumulated under the plan were payable to the participating director, or to his or her designated beneficiary, upon retirement, disability or death. Provisions of $613,000 in 2006 and $399,000 in 2005 were expensed to provide for future obligations payable under this plan. At December 31, 2006 and December 31, 2005, the outstanding deferred obligations were $1.3 million and $719,000, respectively. Effective December 31, 2006, the amount of phantom shares credited to a director under the plan was converted to a cash amount based on a value of $24.00 per phantom share. Beginning January 1, 2007, this amount was credited to a bookkeeping account for each director, and each month a rate of earnings will be credited to the account for the month equal to the 3-month LIBOR rate in effect on the last business day of the month plus 2%.
Beginning in 2007, the Company implemented a new deferred compensation plan for directors. Under this plan, a director could elect to defer the payment of all or a portion of his or her director’s fees that would otherwise have been paid currently. The fees deferred were to be increased by 25% and credited to a bookkeeping account kept by the Company for the director, however beginning January 1, 2008, the 25% fee was ceased and in May 2008, the board of directors terminated deferral of director’s fees for fiscal years after 2008. The outstanding deferred director compensation obligation was approximately $184,000 and $490,000, respectively, as of December 31, 2010 and 2009.
F-38
Table of Contents
NORTH STATE BANCORP
NOTES TO CONSOLIDATED FINANCIAL STATEMENTS
Years Ended December 31, 2010, 2009 and 2008
NOTE O - EMPLOYEE AND DIRECTOR BENEFIT PLANS (Continued)
Employment Agreements (Continued)
Director fees of $199,000 were expensed during 2008 to provide for the pre-2007 outstanding deferred obligations and fees expensed under the new 2007 deferred compensation plan for directors. During September 2007, the board of directors waived the equity compensation portion of the 2007 deferred compensation plan for fiscal 2007 and in December 2007 terminated the equity compensation portion in its entirety.
401(k) Retirement Plan
The Company maintains a qualified 401(k) plan for regular full or part-time employees. Under the plan, employees may contribute up to an annual maximum as determined under the Internal Revenue Code. The Company matches 100% of such contributions not exceeding 6% of the participants’ compensation. In addition, the board of directors can authorize additional discretionary contributions to the plan. The plan provides that employees’ contributions are 100% vested at all times. Company contributions are 100% vested for the years beginning January 1, 2008. The Company began expense reduction initiatives early in 2009 which included the temporary suspension of the Company’s matching contributions which continued for the year 2010. The expense related to the 401(k) plan contributions for the years ended December 31, 2009 and 2008 totaled approximately $108,000 and $324,000, respectively.
NOTE P - PARENT COMPANY FINANCIAL DATA
Following are the condensed financial statements of North State Bancorp as of December 31, 2010 and 2009 and for the years ended December 31, 2010, 2009 and 2008:
Condensed Statements of Financial Condition
December 31, 2010 and 2009
| 2010 | 2009 | |||||||
| (Dollars in thousands) | ||||||||
| Assets |
||||||||
| Cash |
$ | 1,145 | $ | 561 | ||||
| Investment in North State Bank |
50,880 | 50,438 | ||||||
| Investment in North State Statutory Trust I |
155 | 155 | ||||||
| Investment in North State Statutory Trust II |
155 | 155 | ||||||
| Investment in North State Statutory Trust III |
155 | 155 | ||||||
| Other assets |
495 | 187 | ||||||
| Total Assets |
$ | 52,985 | $ | 51,651 | ||||
| Liabilities and Shareholders’ equity |
||||||||
| Other liabilities |
$ | 18 | $ | 20 | ||||
| Long-term debt |
15,465 | 15,465 | ||||||
| Shareholders’ equity |
||||||||
| Common stock |
21,636 | 20,865 | ||||||
| Retained earnings |
15,926 | 14,902 | ||||||
| Accumulated other comprehensive income ( loss) |
(60 | ) | 399 | |||||
| Total shareholders’ equity |
37,502 | 36,166 | ||||||
| Total liabilities and shareholders’ equity |
$ | 52,985 | $ | 51,651 | ||||
F-39
Table of Contents
NORTH STATE BANCORP
NOTES TO CONSOLIDATED FINANCIAL STATEMENTS
Years Ended December 31, 2010, 2009 and 2008
NOTE P - PARENT COMPANY FINANCIAL DATA (Continued)
Condensed Statements of Operations
Years Ended December 31, 2010, 2009 and 2008
| 2010 | 2009 | 2008 | ||||||||||
| (Dollars in thousands) | ||||||||||||
| Equity in undistributed earnings of bank subsidiary |
$ | 741 | $ | 850 | $ | 2,983 | ||||||
| Dividend income from bank subsidiary |
750 | 754 | — | |||||||||
| Interest income |
45 | 54 | 80 | |||||||||
| Interest expense |
(429 | ) | (536 | ) | (882 | ) | ||||||
| Other expense |
(324 | ) | (285 | ) | (115 | ) | ||||||
| Tax benefit |
241 | 261 | 299 | |||||||||
| Net income |
$ | 1,024 | $ | 1,098 | $ | 2,365 | ||||||
Condensed Statements of Cash Flows
Years Ended December 31, 2010, 2009 and 2008
| 2010 | 2009 | 2008 | ||||||||||
| (Dollars in thousands) | ||||||||||||
| Cash flows from operating activities: |
||||||||||||
| Net income |
$ | 1,024 | $ | 1,098 | $ | 2,365 | ||||||
| Adjustments to reconcile net income to net cash provided by operating activities: |
||||||||||||
| Amortization |
2 | 2 | 2 | |||||||||
| Stock based compensation |
100 | 119 | 155 | |||||||||
| Gain on sale of equity interest in investment |
— | (18 | ) | — | ||||||||
| Equity in undistributed earnings of subsidiaries |
(741 | ) | (850 | ) | (2,983 | ) | ||||||
| Changes in assets and liabilities: |
||||||||||||
| (Increase) decrease in other assets |
(308 | ) | (86 | ) | 1,279 | |||||||
| Increase (decrease) in other liabilities |
(2 | ) | (53 | ) | 6 | |||||||
| Net cash provided by operating activities |
75 | 212 | 824 | |||||||||
| Cash flows from investing activities: |
||||||||||||
| Proceeds from sale of equity interest in investment |
— | 32 | — | |||||||||
| Investment in subsidiaries |
588 | 625 | (2,458 | ) | ||||||||
| Net cash provided (used) by investing activities |
588 | 657 | (2,458 | ) | ||||||||
| Cash flows from financing activities: |
||||||||||||
| Proceeds from stock options exercised |
611 | 89 | 543 | |||||||||
| Excess tax benefits from stock options |
60 | 9 | 341 | |||||||||
| Dividends from bank subsidiary |
(750 | ) | (754 | ) | — | |||||||
| Net cash provided (used) by financing activities |
(79 | ) | (656 | ) | 884 | |||||||
| Net increase (decrease) in cash and cash equivalents |
584 | 213 | (750 | ) | ||||||||
| Cash and cash equivalents, beginning |
561 | 348 | 1,098 | |||||||||
| Cash and cash equivalents, ending |
$ | 1,145 | $ | 561 | $ | 348 | ||||||
F-40
Table of Contents
NORTH STATE BANCORP
NOTES TO CONSOLIDATED FINANCIAL STATEMENTS
Years Ended December 31, 2010, 2009 and 2008
NOTE Q - BUSINESS COMBINATION
Effective at the beginning of business on February 15, 2010, the Bank acquired 100% of the mortgage operations of Affiliated Mortgage, LLC, creating a new division of the Bank, North State Bank Mortgage.
The purchase price of $250,000 per the agreement included the purchase of fixed assets, interest and fees receivable and goodwill. In exchange for cash consideration of $250,000, the fair value of assets acquired included fixed assets of approximately $18,000, interest and fee income receivable of $91,000 and goodwill of $141,000.
The acquisition is being accounted for under the acquisition method of accounting (revised business combination guidance). The purchased assets and identifiable intangible assets were recorded at their respective acquisition date values. Goodwill of $141,000 is calculated as the purchase premium after adjusting for the fair value of the assets acquired and is included in other assets on the consolidated balance sheet. The goodwill is deductible for income tax purposes. The statement of net assets acquired as of February 15, 2010 is presented in the following table.
Affiliated Mortgage, LLC’s results of operations prior to the acquisition are not included in the Company’s statements of operations.
Acquisition of Affiliated Mortgage, LLC
| February 15, 2010 | ||||
| (Dollars in thousands) | ||||
| Consideration: |
||||
| Cash |
$ | 250 | ||
| Fair value of total consideration paid |
$ | 250 | ||
| Net assets acquired: |
||||
| Premises and equipment, net |
$ | 18 | ||
| Interest and fee income receivable |
91 | |||
| Total identifiable net assets at fair value |
$ | 109 | ||
| Goodwill |
141 | |||
| Fair value of total consideration paid |
$ | 250 | ||
NOTE R - BUSINESS SEGMENT INFORMATION
The Company has three reportable business segments, the Bank, NSB Mortgage and the parent Company. The Bank is engaged in general commercial and retail banking in central and coastal North Carolina. The Bank operates six full-service banking offices located in Wake County and one full-service office in Wilmington, New Hanover County, North Carolina. NSB Mortgage, a division of the Bank, began operations during February 2010 for the purpose of originating and selling single-family, residential first mortgage loans. The remaining segment consists of activities of the parent Company. The table also includes eliminations necessary to accurately report the operations of the Company. Segment reporting disclosure is required disclosure the year 2010 due to our new mortgage division. Segment reporting disclosure was not required for 2009 or 2008.
F-41
Table of Contents
NORTH STATE BANCORP
NOTES TO CONSOLIDATED FINANCIAL STATEMENTS
Years Ended December 31, 2010, 2009 and 2008
NOTE R - BUSINESS SEGMENT INFORMATION (Continued)
| As of or for the Year Ended December 31, 2010 | ||||||||||||||||||||
| Bank | NSB Mortgage | Parent Company | Eliminations | Total Company | ||||||||||||||||
| (Dollars in thousands) | ||||||||||||||||||||
| Total interest income |
$ | 29,478 | $ | 1,472 | $ | 45 | $ | (33 | ) | $ | 30,962 | |||||||||
| Total interest expense |
7,092 | — | 429 | (33 | ) | 7,488 | ||||||||||||||
| Net interest income |
22,386 | 1,472 | (384 | ) | — | 23,474 | ||||||||||||||
| Provision for loan losses |
8,095 | — | — | — | 8,095 | |||||||||||||||
| Net interest income after provision for loan losses |
14,291 | 1,472 | (384 | ) | — | 15,379 | ||||||||||||||
| Noninterest income |
1,838 | 2,638 | 1,491 | (1,491 | ) | 4,476 | ||||||||||||||
| Noninterest expense |
15,326 | 2,386 | 324 | — | 18,036 | |||||||||||||||
| Income before income taxes |
803 | 1,724 | 783 | (1,491 | ) | 1,819 | ||||||||||||||
| Income taxes |
283 | 753 | (241 | ) | — | 795 | ||||||||||||||
| Net income |
$ | 520 | $ | 971 | $ | 1,024 | $ | (1,491 | ) | $ | 1,024 | |||||||||
| Total assets |
$ | 579,400 | $ | 53,505 | $ | 52,985 | $ | (52,025 | ) | $ | 633,865 | |||||||||
| Net loans |
489,588 | — | — | — | 489,588 | |||||||||||||||
| Loans held for sale |
— | 51,472 | — | — | 51,472 | |||||||||||||||
| Goodwill |
— | 141 | — | — | 141 | |||||||||||||||
F-42
Table of Contents
SIGNATURES
Pursuant to the requirement of Section 13 or 15(d) of the Securities Exchange Act of 1934, the registrant has duly caused this report to be signed on its behalf by the undersigned, thereunto duly authorized.
| NORTH STATE BANCORP | ||||||||
| Date: March 30, 2011 | By: | /s/ LARRY D. BARBOUR | ||||||
| Larry D. Barbour, President | ||||||||
| and Chief Executive Officer | ||||||||
Pursuant to the requirement of the Securities Exchange Act of 1934, this report has been signed below by the following persons on behalf of the registrant and in the capacities and on the date indicated.
| Signature |
Title |
Date | ||
| /s/ LARRY D. BARBOUR Larry D. Barbour |
President, Chief Executive Officer and Director (principal executive officer) |
March 30, 2011 | ||
| /s/ KIRK A. WHORF Kirk A. Whorf |
Chief Financial Officer (principal financial officer) | March 30, 2011 | ||
| /s/ JOANN B. BRATTON JoAnn B. Bratton |
Controller (principal accounting officer) | March 30, 2011 | ||
|
Forrest H. Ball |
Director | March 30, 2011 | ||
| /s/ JAMES C. BRANCH James C. Branch |
Director | March 30, 2011 | ||
| /s/ CHARLES T. FRANCIS Charles T. Francis |
Director | March 30, 2011 | ||
| /s/ GLENN FUTRELL Glenn Futrell |
Director | March 30, 2011 | ||
|
Jeanette W. Hyde |
Director | March 30, 2011 | ||
| /s/ J. KEITH KEENER J. Keith Keener |
Director | March 30, 2011 | ||
S-1
Table of Contents
| /s/ BURLEY B. MITCHELL, JR. Burley B. Mitchell, Jr. |
Director | March 30, 2011 | ||
|
Barry W. Partlo |
Director | March 30, 2011 | ||
| /s/ W. HAROLD PERRY W. Harold Perry |
Director | March 30, 2011 | ||
| /s/ FRED J. SMITH, JR. Fred J. Smith, Jr. |
Director | March 30, 2011 | ||
| /s/ JACK M. STANCIL Jack M. Stancil |
Director | March 30, 2011 | ||
S-2