Attached files
| file | filename |
|---|---|
| EX-3.1 - CERTIFICATE OF INCORPORATION - CYBRA CORP | f10k2010ex3i_cybra.htm |
| EX-32.1 - CERTIFICATION PURSUANT TO SECTION 906 OF SARBANES OXLEY ACT OF 2002 - CYBRA CORP | f10k2010ex32i_cybra.htm |
| EX-31.1 - CERTIFICATION PURSUANT TO SECTION 302 OF SARBANES OXLEY ACT OF 2002 - CYBRA CORP | f10k2010ex31i_cybra.htm |
| EX-32.2 - CERTIFICATION PURSUANT TO SECTION 906 OF SARBANES OXLEY ACT OF 2002 - CYBRA CORP | f10k2010ex32ii_cybra.htm |
| EX-31.2 - CERTIFICATION PURSUANT TO SECTION 302 OF SARBANES OXLEY ACT OF 2002 - CYBRA CORP | f10k2010ex31ii_cybra.htm |
UNITED STATES
SECURITIES AND EXCHANGE COMMISSION
Washington, D.C. 20549
FORM 10-K
(Mark One)
xANNUAL REPORT PURSUANT TO SECTION 13 OR 15(D) OF THE SECURITIES EXCHANGE ACT OF 1934
For the fiscal year ended December 31, 2010
OR
oTRANSITION REPORT PURSUANT TO SECTION 13 OR 15(D) OF THE SECURITIES EXCHANGE ACT OF 1934
For the transition period from _______ to _______
Commission File Number 000-52624
CYBRA CORPORATION
(Exact Name of Registrant as Specified in Its Charter)
|
13-3303290
|
||
|
Incorporation or Organization)
|
(I.R.S. Employer
Identification No.)
|
|
|
One Executive Blvd., Yonkers, NY
|
10701
|
|
|
(Address of Principal Executive Offices)
|
(Zip Code)
|
|
|
Registrant’s Telephone Number, Including Area Code
|
(914)963-6600
|
Securities registered pursuant to Section 12(b) of the Act: None
Securities registered pursuant section 12(g) of the Act:
Common Stock, $0.001 par value
Title of Class
Indicate by check mark if the registrant is a well-known seasoned issuer, as defined in Rule 405 of the Securities Act. Yes o No x
Indicate by check mark if the registrant is not required to file reports pursuant to Section 13 or 15(d) of the Exchange Act. Yes o No x
Indicate by check mark whether the registrant (1) has filed all reports required to be filed by Section 13 or 15(d) of the Securities Exchange Act of 1934 during the preceding 12 months (or for such shorter period that the Registrant was required to file such reports), and (2) has been subject to such filing requirements for the past 90 days. Yes x No o
Indicate by check mark if disclosure of delinquent filers pursuant to Item 405 of Regulation S-K is not contained herein, and will not be contained, to the best of Registrant’s knowledge, in definitive proxy or information statements incorporated by reference in Part III of this Form 10-K or any amendment to this Form 10-K . x
Indicate by check mark whether the registrant is a large accelerated filer, an accelerated filer, a non-accelerated filer, or a smaller reporting company. See the definitions of “large accelerated filer,” “accelerated filer” and “smaller reporting company” in Rule 12b-2 of the Exchange Act. (Check One):
|
Large accelerated filer o
|
Accelerated filer o
|
|
|
Non-accelerated filer o
|
Smaller reporting company x
|
|
|
(Do not check if a smaller reporting company)
|
Indicate by check mark whether the registrant is a shell company (as defined in Rule 12b-2 of the Act). Yes o No x
As of June 30, 2010, which was the last business day of the registrant’s most recent second fiscal quarter, the aggregate market value of the registrant’s Common Stock held by non-affiliates of the registrant was $3,126,281.
As of March 15, 2011, there were 15,519,667 shares of Common Stock outstanding.
TABLE OF CONTENTS
|
Page
|
|||||||
|
Part I
|
|||||||
|
Item 1.
|
Description of Business
|
1 | |||||
|
Item 1A.
|
Risk Factors
|
15 | |||||
|
Item 1B.
|
Unresolved Staff Comments
|
21 | |||||
|
Item 2.
|
Properties
|
21 | |||||
|
Item 3.
|
Legal Proceedings
|
22 | |||||
|
Item 4.
|
Reserved
|
22 | |||||
|
Part II
|
|||||||
|
Item 5.
|
Market for Registrant’s Common Equity, Related Stockholder Matters and Issuer Purchases of Equity Securities
|
23 | |||||
|
Item 6.
|
Selected Financial Data
|
24 | |||||
|
Item 7.
|
Management’s Discussion and Analysis of Financial Condition and Results of Operations
|
24 | |||||
|
Item 7A.
|
Quantitative and Qualitative Disclosures About Market Risk
|
27 | |||||
|
Item 8.
|
Financial Statements and Supplementary Data
|
F-1 | |||||
|
Item 9.
|
Changes in and Disagreements with Accountants on Accounting and Financial Disclosure
|
28 | |||||
|
Item 9A(T).
|
Controls and Procedures
|
28 | |||||
|
Item 9B.
|
Other Information
|
29 | |||||
|
Part III
|
|||||||
|
Item 10.
|
Directors, Executive Officers and Corporate Governance
|
30 | |||||
|
Item 11.
|
Executive Compensation
|
32 | |||||
|
Item 12.
|
Security Ownership of Certain Beneficial Owners and Management and Related Stockholder Matters
|
34 | |||||
| Item 13. | Certain Relationships and Related Transactions, and Director Independence | 35 | |||||
| Item 14. | Principal Accountant Fees and Services | 35 | |||||
| Part IV | |||||||
| Item 15. | Exhibits, Financial Statement Schedules | 35 | |||||
| Signatures | 36 | ||||||
FORWARD LOOKING STATEMENTS
This report on Form 10-K contains forward-looking statements within the meaning of Rule 175 of the Securities Act of 1933, as amended, and Rule 3b-6 of the Securities Exchange Act of 1934, as amended, that involve substantial risks and uncertainties. These forward-looking statements are not historical facts, but rather are based on current expectations, estimates and projections about our industry, our beliefs and our assumptions. Words such as “anticipates”, “expects”, “intends”, “plans”, “believes”, “seeks” and “estimates” and variations of these words and similar expressions are intended to identify forward-looking statements. These statements are not guarantees of future performance and are subject to risks, uncertainties and other factors, some of which are beyond our control and difficult to predict and could cause actual results to differ materially from those expressed or forecasted in the forward-looking statements. You should not place undue reliance on these forward-looking statements, which apply only as of the date of this Form 10-K. Investors should carefully consider all of such risks before making an investment decision with respect to the Company’s stock.
PART I
ITEM 1. DESCRIPTION OF BUSINESS
THE COMPANY
CYBRA Corporation (“CYBRA” or the “Company”) was founded as a New York corporation in 1985 by Harold Brand, an Information Technology (“IT”) professional with extensive experience in computer systems design, and Dr. Shlomo Kalish, an authority in marketing for start up ventures. Initially, CYBRA was a consulting organization for mid-range computing systems. Utilizing Mr. Brand’s expertise in the IT industry, CYBRA resold and integrated Israeli software products for the IBM System 34, 36, and 38 platforms in the North American marketplace. In the early 1990’s, one of the Company’s main clients asked CYBRA (in collaboration with Pitney Bowes) to develop a bar code label software component. In order to accommodate its client’s needs, CYBRA agreed to develop the new technology. The results had a profound effect on the Company’s future. CYBRA became much more heavily involved in software application development, and wrote the code for a new proprietary software product known as MarkMagicTM. CYBRA owns the trademark for MarkMagic. The MarkMagic software is not patented. It is protected by use of standard secure software keys that are locked to specific computer serial numbers. Computer source code is not distributed with the product.
In August 1997, Monarch Marking Systems, a supplier of labels and printers to retail customers, acquired a minority ownership position in CYBRA with the intention of establishing a strategic partnership. Since that time, CYBRA’s fundamental strategy has been to establish OEM partnerships that embed MarkMagic in leading business software products. Vendors of these business software products resell MarkMagic to their customers. In addition, CYBRA sells MarkMagic directly to businesses needing radio frequency identification (RFID) and bar code labels, as well as electronic forms. Today, the Company is well known for its computerized bar code document design and printing. CYBRA’s R&D department has core competencies in auto id/bar code and RFID expertise, object oriented programming and design, and information technology — especially in connection with the IBM System i.
IBM System i and its predecessors (IBM iSeries and IBM AS/400) have been deployed into midsize companies since the late 1980s. System i, however, has been transformed since that time, meeting a new set of price points and performance results that far outstrip the price/performance ratio offered in the 1990s, or even a few years ago. The System i is a midrange computer platform aimed at meeting the business information and technology needs of midsize businesses, and it is designed to support the growth of a business over time.
1
CYBRA’s key distributors and resellers are Manhattan Associates, Apparel Business Systems, Vormittag Associates (“VAI”) and Solzon Corporation. CYBRA’s primary suppliers are: Avery Dennison (bar code and RFID printers and printing supplies), Psion Teklogix (bar scanners and wireless equipment), ScanSource (wholesale distributors), Blue Star (wholesale distributors), and Nimax (wholesale distributors).
|
|
Percentage of
Sales
Attributable to Software
Manufacturers
|
Percentage of
Sales
to End Users
|
||||||
|
2010
|
78 | % | 22 | % | ||||
|
2009
|
75 | % | 25 | % | ||||
CYBRA’s annual revenues are derived from hundreds of customers. Sales to the largest customers are as follows::
|
|
Total Sales
|
Sales to the
largest
customer
|
Percentage of
Total
Sales
|
||||||||||
|
2010
|
$ | 1,605,744 |
Manhattan Assoc.
|
$ | 133,205 | 8.1 | % | ||||||
|
2009
|
$ | 1,335,944 |
Foot Locker
|
$ | 86,285 | 6.6 | % | ||||||
PRODUCTS AND SERVICES
MarkMagicTM

With a single, simple interface, MarkMagic lets businesses design and print all types of documents, such as bar code labels, RFID tags, e-forms, and other media, using live data, with little or no programming necessary. MarkMagic’s “what-you-see-is-what-you-get” design component, JMagic, was developed in Java specifically in order to be deployed across the Internet, as well as on diverse computing platforms, including Windows, UNIX and Linux.
Until recently, MarkMagic has addressed the IBM System i market. In 2010, CYBRA completed a version of MarkMagic called MarkMagic Platform Independent (PI) that is designed to run on all major computing platforms, such as Windows, UNIX and Linux. MarkMagic PI sales to end-user customers began in 2010. A major OEM software partner is planning to roll it out to its customer base in mid-2011.
MarkMagic Version 7, a major new release, was launched in May 2009. It contains the MarkMagic FormsComposer feature that adds full report writing functions to MarkMagic with a simple user interface. The other significant feature introduced in Version 7 is the Print Transformer, which provides MarkMagic users with powerful conditional printing capabilities. Since its initial launch, MarkMagic Version 7 has undergone two upgrade releases, providing improvements in performance, usability and functionality.
2
EdgeMagic®

EdgeMagic, released in February 2008, is an integrated RFID control solution for IBM System i customers. It is also deployable on other platforms and is highly scalable. EdgeMagic is designed to manage RFID readers and analog control devices; commission, read, filter and verify RFID tags to comply with Electronic Product Code (EPC) compliance mandates and to track company assets; and integrate with popular ERP and Warehouse Management application packages.
Throughout 2007 and 2008 management focused substantially all of the Company’s resources on development and release of EdgeMagic with revenue potential that management believes will be far in excess of the current product mix. EdgeMagic product development remains a high priority for the Company. During 2010, EdgeMagic was enhanced to provide industry specific functionality. Key among those were enhancements for tracking item level apparel and document tracking.
Auto-ID MagicTMSales Strategy
Together, MarkMagic and EdgeMagic constitute CYBRA’s Auto-ID Magic family of products. CYBRA’s primary sales strategy is to sell through Application Software Vendors (ASV’s) that bundle MarkMagic and EdgeMagic with their package offerings.
Auto-ID (Automatic Identification) is a term that encompasses a wide range of technologies that allow items to be automatically identified, including Bar Code, RFID Tagging, Magnetic Stripe, Biometrics, etc.
The main benefits of Auto-ID are:
|
·
|
Reduced human error by eliminating manual look-up and entry;
|
|
·
|
Increased speed, reducing labor costs;
|
|
·
|
Improved security, as it can be difficult to forge or fool;
|
|
·
|
Increased revenue by insuring that products are always available; and
|
|
·
|
Significant reductions in personnel training.
|
The key benefits to the ASV of OEMing CYBRA’s Auto-ID Magic family of products are:
|
·
|
Increased Revenues – ASV’s can generate an additional source of revenue through sales of CYBRA’s Auto-ID Magic family of products to future customers as well as to their installed base. With MarkMagic integrated into their application, their customers can quickly create new labels and change existing labels with ease, including RFID “smart” labels. With CYBRA’s forms component, they can eliminate many, or all, of the preprinted forms required by their application. These net savings give ASV customers a compelling reason to upgrade their ASV product. Utilizing EdgeMagic, ASV’s can help their customers with the essential need to comply with trading partner mandates, as well as developing tracking of their own assets, with ease and at a competitive price compared to other alternatives.
|
|
·
|
Cost Avoidance – ASV’s can greatly reduce, or eliminate, their staff costs for ongoing source code maintenance and customer support for all Auto-ID customer requirements. Their staff no longer needs to learn and maintain competence on complex RFID printer or reader command languages. As Auto-ID Magic provides a full range of RFID and bar code solutions that run on all major computing platforms, the burden for the ASV to support multiple computing environments is dramatically reduced.
|
3
|
·
|
Competitive Advantage – ASV’s can improve their competitive advantage by offering compliance labeling solutions – including the printing of RFID smart labels, and the commissioning, validating and management of RFID tags – to their customers on a wide range of RFID and bar code equipment from numerous manufacturers. ASV’s can avail themselves of a source for all RFID needs – middleware, training, services, equipment, supplies, maintenance and support – without having to develop their own expertise.
|
In 2011, we are expanding our channel strategy beyond OEMs to include System Integrators that specialize in Auto-ID solutions. Auto-ID Magic provides the integrator with out-of-the-box solutions that permit work on virtually any computing platform and implement a full scale system in days, rather than weeks or months.
CYBRACare

During 2010, CYBRA designed a solution family for the long-term care market called CYBRACare. CYBRACare incorporates RFID and RTLS (Real Time Location Systems) technology. The basic CYBRACare technology layer is CYBRA’s EdgeMagic RFID tracking software.
The concept of the CYBRACare suite of solutions for long-term care covers a broad range of areas within long-term care facilities of all types. In its initial release, CYBRACare consists of three types of tracking: resident, staff and equipment.
◦ Resident Tracking is based on a resident wristband containing an RFID tag so that a patient’s whereabouts can be tracked automatically at every moment. This prevents unsafe wandering and leaving the premises (elopement).
◦ Staff Tracking uses RFID “smart” cards to track staff whereabouts and response times by caregiver in order to monitor productivity. The CYBRACare card also provides the staff member with emergency call buttons.
◦ Medical Equipment tracking provides for the location of expensive medical appliances and equipment that are often in limited supply and need to be located quickly. Examples of medical equipment that can be tracked include mechanical lifts, intravenous pumps, respiratory machines, scooters, and defibrillators.

CYBRA’s strategic partner in its long-term care venture is CenTrak, Inc. CenTrak is a leader in providing simple and reliable tracking innovations to hospitals. Their products include patient, staff and equipment tracking. CenTrak is headquartered in Newtown, Pennsylvania with manufacturing facilities in Hong Kong, South Korea and India. CenTrak solutions are currently operating in millions of square feet at dozens of world-class healthcare sites throughout the United States. Its largest installation to date is at Mount Sinai Hospital in New York, which uses a system supplied by CenTrak partner GE Healthcare. CYBRA is among the few solution providers to utilize CenTrak technology in long-term care.
4
The Evolution of Auto-ID: From Bar Code To RFID
This section will introduce you to two key Auto-ID technologies – Bar Coding and RFID – briefly explaining what they are about, how businesses benefit from their use, how bar coding evolved to RFID and what role CYBRA plays in these vital areas.
In the beginning: UPC Bar Code

History was made on June 26, 1974, when the first product with a “Universal Product Code” (UPC) bar code was run through a hand-made scanner at a check-out counter at Marsh’s supermarket in Troy, Ohio. It was a 10-pack of Wrigley’s Juicy Fruit chewing gum.
The supply chain would never be the same.
Today, that pack of gum is on display at the Smithsonian Institution’s National Museum of American History.
Grocery items and other consumer products are well-suited for UPC bar codes. Developed by the food industry to give every product a unique symbol and numeric code, the multi-digit number identifies the manufacturer and the item. Scanners can read the bars and spaces of the symbol. This system speeds customer checkout, reduces item price marking requirements, and helps collect complete and accurate information on all aspects of the sales transaction.
Since the early seventies, bar code systems have spread far from the supermarket checkout counter. In warehouses, hospitals, and automobile assembly lines, bar code systems enter data at speeds, efficiency and accuracy levels far beyond human ability.
Comply or Die
In the late 1980s, manufacturers and distributors had no choice but to add bar code technology to their operations. These companies had to “comply” and integrate bar code technology because their customers had installed scanning systems to read bar code labels to cut data entry and handling costs and demanded that they either bar code or lose the business to a competitor.
Customer demands (“compliance mandates”) typically include special shipping labels developed by industry trade associations. Item ticketing is another type of compliance. Across all industries, there are literally thousands of different compliance label types. Industries that have established compliance specification standards include retail consumer goods, the automobile industry, and the health industry.
Customers required to supply bar code shipping labels are given detailed, explicit instructions defining how the label is supposed to look, what data should appear on the label, how the bar code information is presented and how the label is to be printed.
Compliance specifications are complex and constantly changing, often without notice to the supplier. If any portion of the label is defective, out of date, or “out of spec”, the customer is liable for hefty fines called chargebacks.
5
Chargebacks can easily add up to hundreds of thousands of dollars per year for a small to medium sized manufacturer. Major retailers such as Wal-Mart, Sears, Target, etc., accrue tens of millions of dollars from chargeback revenue.
Chargebacks are a significant cost center for a small to medium manufacturer and can mean the difference between profit and loss. Software that can help reduce a company’s chargeback expenses, by providing proper carton labeling and ticketing of merchandise produces an immediate return on investment.
This is where CYBRA’s MarkMagic comes in.
Thousands of CYBRA customers reduce their chargeback burden daily by relying on MarkMagic to handle their compliance labeling.
Manhattan Associates, a $670 million supply chain solution company, is a CYBRA OEM Partner that has built its business on this premise by guaranteeing 100% compliance with the top U.S. and global retailers’ guidelines for shipping and content labels. One of the principal ways in which this is accomplished is by integrating CYBRA’s MarkMagic bar code label software into Manhattan’s Warehouse Management and Transportation Execution software packages.

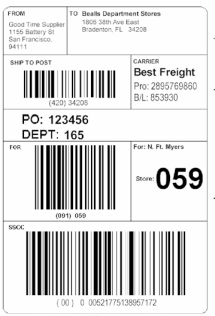
Advances in bar code printing and scanning capabilities have led to the development of new bar code types that can contain greater amounts of information in less and less space. The newer bar code types are called “stacked” 2D (two dimensional) bar codes because they encode data by layering a series of bars and spaces. Stacked 2D bar codes can contain as many as 3,000 characters or more in the space of a postage stamp, while the one dimensional bar codes are limited to between twelve and thirty characters.
6

Another 2D bar code family includes “matrix” codes, such as the UPS MaxiCode. Because 2D bar codes are able to encode entire packing lists or shipping label addresses, these bar codes are now specified by a number of carriers for their labels. Compliance with FedEx Ground and UPS is the biggest reason the use of these bar code types is growing. MarkMagic has helped customers print 2D bar codes since 1994. In addition, MarkMagic makes it possible for customers in certain industries, such as those that ship directly to the consumer, to produce shipping documents containing both a pick ticket and a FedEx Ground or UPS carrier label with a 2D bar code.

A QR code (short for Quick Response) is a matrix barcode readable by dedicated QR barcode readers as well as smart phones. The information encoded can be text, a website URL or other data. Common in Japan, where it was created by Toyota subsidiary Denso-Wave in 1994, the QR code is one of the most popular types of two-dimensional barcodes today. QR codes are of particular interest to marketers, giving them the ability to measure response rates with a high degree of precision, allowing for easier ROI (return on investment) calculation, thus helping justify spending on marketing budgets. Media where QR codes have been deployed include: billboard ads, guerilla marketing campaigns, in-store displays, event ticketing and tracking, trade-show management, business cards, print ads, contests, direct mail campaigns, websites, email marketing and couponing.

7
There are many apps available for Apple’s iPhone and Google Android phones that let users scan barcodes using the smartphone’s camera. These barcode apps are typically meant to make the shopping experience more enjoyable. Examples of popular smartphone bar code apps are:
|
·
|
RedLaser: Scans product barcodes and compares prices using Google Products and Amazon.
|
|
·
|
FoodScanner: Scans UPC barcodes on foods letting the users know how many calories they are consuming.
|
|
·
|
Cardstar: Lets users store, manage and retrieve reward, club, and loyalty cards on their smart phone, where they can be scanned directly from the phone’s screen at many merchants.[Missing Graphic Reference]
|
The Future Arrives:RFID

Bar codes have one big shortcoming: a scanner has to “see” the bar code to read it. RFID, by contrast, does not have this limitation. RFID tags – chips no larger than a grain of sand plus an attached antenna – can be read without being “seen” as long as they are within range of a reader, anywhere from a few inches to twenty or more feet. The tags can be embedded into packaging or applied to a product in a “smart” label. An entire pallet of 200 RFID tagged items can be read in an instant.
RFID technology was first used during World War II as an aircraft identification system, and businesses have used RFID technology on a limited basis for years. Drivers in twelve states in the Northeast United States are familiar with the E-ZPass system for paying tolls, which is based on RFID technology.
Recent technical breakthroughs have made RFID well-suited for retail, distribution, and consumer packaged goods manufacturing. Major retailers such as Wal-Mart, Target, and Metro Group Germany have mandated the tagging of items coming into their businesses. The U. S. Department of Defense requires RFID tagged shipments to solve such problems as tracking munitions.
Currently retailers’ RFID mandates affect only the largest suppliers (the top Wal-Mart vendors, for example). In the years ahead, however, the RFID compliance mandates are expected to impact virtually all suppliers regardless of size. The supply chain standards groups have adopted a new RFID standard, the EPC (Electronic Product Code), to supplement the simple UPC bar code.
The UPC bar code identifies the manufacturer and the product. Like a UPC bar code, the EPC also identifies the manufacturer and product. The EPC, however, identifies each item in the supply chain with a unique serial number.
Unlike bar coding, where scanning of data one by one can be integrated into an organization’s existing infrastructure in a relatively straightforward manner, reading and managing RFID tags is a far more complex process. It requires a class of software referred to as RFID management software.
RFID management software, also referred to as RFID Edge Middleware, enables the rapid development and deployment of RFID systems. The software absorbs differences in various RFID tags from multiple suppliers and integrates that data, making it possible to build flexible and scalable RFID solutions. The middleware also includes tools to monitor and maintain RFID systems.
8
Middleware needs to filter non-essential RFID data as close to the source as possible. It is invisible to applications and does not overwhelm the existing system. The transition from deployments to networks capable of handling this increased load requires a solution that is scalable as the deployment grows.
CYBRA’s EdgeMagic RFID middleware is designed to provide RFID management capabilities with maximum scalability and minimum customization. EdgeMagic provides a fully integrated RFID management system to manage readers and edge devices, commission and read RFID tags, and interface to the major ERP and Warehouse Management packages. EdgeMagic runs on the IBM System i, as well as other major computing platforms such as Windows, UNIX and Linux.
THE MARKET
Wal-Mart, along with the U.S. Department of Defense and the FDA, kick-started the entire RFID industry in 2003 when they announced plans for revolutionizing the supply chain with RFID technology. RFID would enable a more visible and effective supply chain and better tracking of corporate assets. Other benefits included lower labor cost, reduced product theft, elimination of counterfeiting and reduced stock outages. According to figures released by the National Retail Foundation, out of stock alone is a $92 billion annual problem.
From the outset, proponents insisted that RFID would dramatically change the way companies track goods in the supply chain. For the next seven years it remained a niche technology, held back by the difficulties its pioneers had pulling in a critical mass of partners. A relatively small number of Wal-Mart’s suppliers had started using RFID since the retailer announced its famous supply chain “mandate”.
All that changed in the middle of 2010.
Retailers at all points on the price spectrum are now embracing RFID and are positioning themselves to gain market share from rivals and operate more intelligently. Wal-Mart has thrown its considerable weight behind item-level RFID in the apparel category as have JCPenney, Macy’s and Dillard’s. The world’s leading specialty apparel retailers — GAP Inc. and Inditex (operator of multiple retail banners, including Zara) — are both devoting energy to RFID, as is Banana Republic. Wal-Mart’s decision to initiate tagging of all men’s jeans, socks, underwear and t-shirts is significant, especially considering that some of the items being tagged sell for less than $5. The significance of the fact that disposable RFID tags are now being applied to millions of items with retail price points of $5 or less shatters the myth that RFID tags are too expensive.
Stores that utilize RFID have the potential to be much more attractive shopping destinations. Superior on-shelf availability, faster checkout and amenities such as “smart” fitting rooms could be a powerful draw. Research analyst group, IDTechEx, estimated that about 300 million RFID labels were used for apparel tagging globally in 2010 – a 50% increase over the previous year. Additionally, nearly 225 million RFID labels were used for tagging pallets and cases by companies such as Wal-Mart and Target. The role of RFID in apparel retail is still in its early stages but is poised to potentially become an area of explosive growth in the ticketing and labeling market.
CYBRA anticipated this trend in planning the architecture of its EdgeMagic product. After a number of difficult years in which we waited for the RFID curve to take off, we believe that we are now well positioned to leverage our IP to gain market share with respect to this fast emerging trend.
9
RFID Business Forecasts
A selection of quotes from recent analyst reports shows that 2011 should be a growth year for RFID, that apparel will be the principal industry affected, and that healthcare will also benefit significantly from RFID technology.
 |
Jan
2011
|
“…37 percent of companies expect RFID budgets to grow…
The level of RFID activity in the apparel industry is clearly on the rise.”
|
 |
Sept 2010
|
“Apparel RFID will grow at double the rate of the overall RFID market through the next ten years.”
“RFID will not be just big in China - it will be huge.”
“RFID tags and systems in healthcare... $2.03 billion in 2018 …locating systems for staff, patients and assets…”
|
 |
Jan
2011
|
“2011 to be a year of steady growth for the RFID industry…
The most growth will likely occur in apparel retail and health care…”
|
 |
Nov 2010
|
“…RFID is going strong.”
|
 |
Nov 2010
|
“…biggest retail supply chain transformation since the bar code …”
|
 |
Sept 2010
|
“RFID Systems Revenue to Exceed $6 Billion in 2011”
“The latest research indicates CAGRs of between 21.7% and 28.8%...”
|
 |
Jan
2011
|
“Inventory accuracy rates of more than 95%, up from an average of 62%.
…time savings of 96%... out-of-stock reductions of up to 50%...”
|
 |
Jan
2011
|
“40% of 125 survey respondents denote that a pilot store is part of their RFID roll-out strategy”
… consumer goods, apparel, and consumer electronics are the top three product categories that retailers are currently tagging or plan to tag.
|
10
COMPETITION — MarkMagic
CYBRA Corporation’s MarkMagic product family faces competition for each of its feature sets, but it is our belief that no single product, on any platform, offers the wide range of output device and document support that MarkMagic brings to the marketplace.
MarkMagic’s advantage is that besides addressing the key requirements of thermal bar code label and RFID printing, it alone provides virtually all other printing needs that customers may demand. Only MarkMagic supports all the following printer devices and document types:
|
●
|
Thermal bar code tags
|
|
●
|
Thermal care labels
|
|
●
|
RFID smart labels
|
|
| ● | Laser printed bar code documents | |
| ● | Ink jet printed documents | |
| ● | Plastic ID cards with magnetic stripe encoding |
In the market consisting of IBM System i users of bar code and RFID labeling, CYBRA faces one major competitor, T.L. Ashford, located in Covington, Kentucky, a private company of similar size to CYBRA. The competitor entered the bar code labeling software arena a few years before we did. To the best of our knowledge, the competitor has a larger base of System i bar code labeling customers than we have. The competitor’s base price is lower than ours, but additional features can level out the price difference. To the best of our knowledge, the competitor sells software only, and does not offer bar code and RFID equipment, supplies or services.
In 2010, we began to expand beyond the IBM System i platform and we anticipate a number of additional competitors. We believe that many of these competitors are well financed and have large customer installed bases. We expect CYBRA’s appeal to end-user customers will be based on our multiple platform support, multiple document type support, our experience and track record in integrating with business software packages and the upgrade path we provide to those requiring or anticipating a full RFID control solution. Our primary channels – software OEM companies and system integrators – tend to be attracted to CYBRA for ease of integration into their software packages, multiple platforms supported, the wide range of capabilities available (thus lowering their R&D burden) and competitive discount structure.
COMPETITION — EdgeMagic
In the RFID market, we anticipate that we will face many competitors as the market grows. Many of these will be large companies, both public and private. There are currently no clearly dominant companies in the RFID space. We anticipate that CYBRA’s appeal will be based on our multiple platform support and our experience and track record in providing solutions for developers of business software packages.
CYBRA’s EdgeMagic product faces well financed competition for each of its feature sets, but we believe that no single product offers the integrated solution that EdgeMagic brings to the IBM Power System i platform.
EdgeMagic’s competitive advantage is that the functions of RFID tag reading and device control it provides are native to the System i platform. No PC’s or additional servers are required. The EdgeMagic solution significantly reduces the systems’ integration effort required to install competing solutions.
Competing Windows, Linux, or Unix-based solutions may have more functions, but each installation in a System i environment requires custom programming to match up System i files and programs with RFID data.
11
We believe that EdgeMagic alone provides a tightly integrated solution that has the functions System i customers require, yet offers the flexibility for System i customers to implement advanced RFID applications without costly custom programming.
On platforms other than System i, EdgeMagic’s advantages are scalability, ease of integration, and ease of use.
Included certified EPC-compliant label templates, pre-configured interfaces to leading ERP and WMS packages, and modular device control allows customers to roll out both open loop and closed loop industrial strength RFID solutions in far less time than with competing solutions.
High-end competitors (selling a suite of products to a specific industry) include:
| ● |
BEA Weblogic RFID Platform Edge Server
|
|
|
●
|
OAT Systems OAT Foundation Suite
|
|
|
●
|
IBM Websphere RFID Premises
|
|
|
●
|
Manhattan Associates EPC Manager
|
|
|
●
|
Seeburger RFID Workbench
|
|
|
●
|
Sybase iAnywhere
|
Low end (selling stand-alone tools that are not industry-specific) includes EPCSolutions Tag Manager.
PARTNERSHIPS
CYBRA has established partnerships with key bar code and RFID companies. CYBRA partners fall into one or more of the following categories:
|
●
|
OEM ASV (Application Software Vendor) partners who have integrated MarkMagic into their application software products that also sell through VARs and Systems Integrators.
|
|
●
|
Technology Partners with whom CYBRA works closely to support their printing technologies or computing platforms. CYBRA has relationships with their VAR channels.
|
| ● | Channel Partners whose products CYBRA resells to provide a single source for a customer’s entire bar code label and RFID needs. The table below contains a list of our key partners, the type of relationship(s) and the product(s) involved: |
|
Company
|
ASV
|
Technology
|
Channel
|
Product
|
||||
|
Apparel Business Systems
|
√
|
MarkMagic Labels Development
|
||||||
|
Infor
|
√
|
MarkMagic Labels Runtime
|
||||||
|
Manhattan Assoc.
|
√
|
MarkMagic Labels Runtime
|
||||||
|
Network Systems
|
√
|
MarkMagic Labels Development
|
||||||
|
Vormittag Assoc.
|
√
|
MarkMagic Enterprise Development
|
||||||
|
Wynne Systems
|
√
|
MarkMagic Labels Development
|
||||||
|
Avery Dennison
|
√
|
√
|
Printers, Supplies, and RFID Encoders and Care Label Printers and Supplies
|
|||||
|
Datamax
|
√
|
√
|
Printers, Supplies, and RFID Encoders
|
|||||
|
HP
|
√
|
√
|
HP PCL laser printers
|
12
|
IBM
|
√
|
√
|
Printers, Supplies, and RFID Encoders, System servers
|
|||||
|
Intermec
|
√
|
√
|
Printers, Supplies, and RFID Encoders
|
|||||
|
Impinj
|
√
|
√
|
RFID Readers and antennas
|
|||||
|
Motorola
|
√
|
√
|
RFID Readers, Mobile Computers, Wireless Networks, Bar Code Scanners
|
|||||
|
Printronix
|
√
|
√
|
Printers, Supplies, and RFID Encoders
|
|||||
|
SATO
|
√
|
√
|
Printers, Supplies, and RFID Encoders
|
|||||
|
Teklogix
|
√
|
√
|
RFID Readers, Mobile Computers, Wireless Networks
|
|||||
|
Zebra
|
√
|
√
|
Label and Plastic Card Printers, Supplies, and RFID Encoders
|
|||||
|
Alien Technologies
|
√
|
RFID UHF readers and tags
|
||||||
|
Hand Held
|
√
|
Bar code scanners and imagers
|
||||||
|
IIMAK
|
√
|
Thermal Ribbons
|
||||||
|
Microscan
|
√
|
Fixed bar code scanners
|
||||||
|
PSC
|
√
|
Bar code scanners and imagers
|
||||||
|
Tagsys
|
√
|
RFID HF and UHF readers and tags
|
CYBRA’s key distributors and resellers are Manhattan Associates, Inc., Vormittag Associates, Inc., Apparel Business Systems, LLC and Solzon Corporation.
On October 20, 1998, the Company signed a five-year Software License, Sublicensing and Distribution Commitment Agreement (the “License Agreement”) with Manhattan Associates, Inc. (“MAI”). The License Agreement automatically renews on a year-to-year basis unless cancelled by either party 30 days prior to each renewal date. Pursuant to the License Agreement, the Company granted to MAI a worldwide non-exclusive license to market and sell its MarkMagic software and related products. MAI pays to the Company a per copy license fee for copies of MarkMagic licensed by MAI or its distributors to end user customers. MAI has agreed to provide support to its customers, and CYBRA has agreed to provide back-up support to MAI. The License Agreement contains other standard provisions such as a source code escrow, copyright indemnification and limitation of warranties.
Effective April 20, 2007, the Company entered into a two year OEM Software Licensing Agreement with Vormittag Associates, Inc. (“VAI”) (the “VAI Agreement”). Pursuant to the VAI Agreement the reseller is granted marketing rights to the MarkMagic and EdgeMagic suite of software products and ancillary products in the United States and Canada. Thus VAI became the first OEM reseller for EdgeMagic. The VAI Agreement provides for set commissions on the sale of products based upon the then current list price. The VAI Agreement contains confidentiality provisions, warranty and support obligations of CYBRA and the reseller’s provisions governing selling methods, and related standard provisions. The VAI Agreement automatically renews for additional one-year periods unless either party notifies the other of its intention to terminate at least 30 days prior to any termination or renewal date. Each party may terminate the VAI Agreement by notifying the other party of its intent to do so three months in advance without cause.
13
Effective October 23, 2006, the Company entered into a two-year Domestic Reseller Agreement with Apparel Business Systems, Inc. (“ABS”) (the “Reseller Agreement”). Pursuant to this Reseller Agreement the Company granted ABS marketing rights to the MarkMagic suite of software products and ancillary products in the United States and Canada. The Reseller Agreement provides for set commissions on the sale of products based upon the then current list price. The Reseller Agreement contains confidentiality provisions, warranty and support obligations of CYBRA and the reseller’s provisions governing selling methods, and related standard provisions. The Reseller Agreement automatically renews for additional one-year periods unless either party notifies the other of its intention to terminate at least 30 days prior to any termination or renewal date. Each party may terminate the Reseller Agreement by notifying the other party of its intent to do so three months in advance without cause.
Effective August 27, 2007, CYBRA entered into three agreements with Solzon Corporation, Nashua, New Hampshire: (1) a Technology License Agreement; (2) a Contractor Agreement for System Integration and Consulting Services; and (3) a Reseller Agreement (the “Solzon Agreements”). Pursuant to the Solzon Agreements, Solzon has assigned to CYBRA a perpetual world-wide license to utilize Solzon’s RFID for iSeries Product and Solzon has agreed to provide support of the installation and configuration of CYBRA’s EdgeMagic Application Software at certain of CYBRA’s customer facilities. Pursuant to these Agreements, Solzon will abandon future development of Solzon’s products and for so long as Solzon is a reseller of CYBRA’s products, and for a period of two years thereafter, Solzon will cease all sales and marketing of its products to any third party. Solzon will be available to answer customers’ RFID and associated questions regarding application and customer needs. In addition, the parties entered in a two-year “Premier Reseller Software Licensing Agreement” (the “PRSLA”), pursuant to which Solzon will market and sell CYBRA’s suite of software products anywhere in the world. The PRSLA provides for set commissions on the sale of products based upon the then current list price. The PRSLA contains confidentiality provisions, warranty and support obligations of CYBRA and the reseller’s provisions governing selling methods, and related standard provisions. The PRSLA automatically renews for additional one-year periods unless either party notifies the other of its intention to terminate at least 30 days prior to any termination or renewal date. Each party may terminate the PRSLA by notifying the other party of its intent to do so three months in advance without cause. For so long as Solzon acts as a reseller of CYBRA’s products, and for a period of two years thereafter, Solzon has agreed not to compete with CYBRA’s business.
In May, 2008 CYBRA signed a strategic partnership agreement with Globe Tracker, Inc. (GTI), a Beijing, China based provider of Global Tracking and Monitoring solutions, to deliver comprehensive, integrated worldwide tracking solutions for global trading partners.
Effective August 6, 2008, the Company entered into a two year OEM Software Licensing Agreement with DCS, Inc., a provider of IBM System i-based software solutions for law enforcement. Pursuant to this agreement the reseller is granted marketing rights to the MarkMagic™ and EdgeMagic® suite of software products and ancillary products in the United States and Canada. The agreement provides for set sales credits on the sale of products based upon the then current list price. The agreement contains confidentiality provisions, warranty and support obligations of CYBRA and the reseller's provisions governing selling methods, and related standard provisions. The agreement automatically renews for additional one-year periods unless either party notifies the other of its intentions to terminate at least 30 days prior to any termination or renewal date. Each party may terminate the agreement by notifying the other party of its intent to do so three months in advance without cause.
On August 3, 2009, the Company entered into an Agreement for Establishment of Beijing Smart Shipping Technologies (SST) Co. Ltd. (the “Beijing Agreement”), with the Waterborne Transportation Institute of the Ministry of Communications, a governmental agency of the People’s Republic of China, and Key West Technologies, Inc. The Beijing Agreement proposes to establish an equity joint venture, and contemplates a subsequent definitive joint venture agreement. The business scope of the proposed joint venture is to utilize the Company’s identification software to develop and sell products and services that track and monitor goods throughout the shipping supply chain. The Beijing Agreement contemplates a financial commitment by the Company to the joint venture of $2.5 million over eighteen months in exchange for a 52% equity interest in the joint venture. The Company is under no obligation to make these capital contributions unless and until the parties enter into a binding, definitive joint venture agreement. The Company will require additional financing in the form of debt and/or equity to participate in the joint venture and make the required contributions. Both the agreement and the subsequent binding, definitive joint venture agreement will be governed by the law of the People’s Republic of China.
14
In fiscal year 2010, the Company spent $215,772 on Research and Development activities and in fiscal year 2009, the Company spent $204,509 on Research and Development activities. For the years ended December 31, 2010 and 2009, all costs were borne directly by CYBRA. No customers paid for these activities in any direct manner.
Employees
As of March 15, 2011, the Company employed 11 full time employees. In addition, the Company retains the services of consultants and other third-parties on an as-needed basis.
Stock Option Plan
The Company adopted an Incentive Stock Plan on April 30, 2006 and has reserved 5,000,000 shares of its Common Stock for issuance thereunder.
ITEM 1A. Risk Factors
There are numerous and varied risks, known and unknown, that may prevent us from achieving our goals, including those described below. The risks described below are not the only ones we will face. Additional risks not presently known to us or that we currently believe are immaterial may also impair our financial performance and business operations. If any of these risks actually occurs, our business, financial condition or results of operations may be materially adversely affected.
We may not be able to continue as a going concern.
Management is planning to commence negotiations with the holders of the Debentures. In the event that negotiations are not successful, the Company does not have sufficient cash to pay the balances and will be in default.
This factor raises serious doubt about the Company’s ability to continue as a going concern. Management is hopeful that they will succeed in settling with the Debenture holders in a manner that will provide the Company with sufficient time to repay the debt and not have the risk of further default. No assurances can be given that management will be successful in its negotiations with the Debenture holders. If the Company is unable to successfully negotiate with the Debenture holders, it is unlikely that it will be able to continue as a going concern.
We may not be able to pay, refinance or otherwise satisfy our obligations under certain of the 8% Convertible Debentures (the “Debentures”).
We did not pay the Debentures when they became due on April 10, 2009. In 2010, certain holders of the Debentures agreed to extend the term of their Debentures, and certain other holders agreed to exchange their Debentures for a new class of preferred stock. Holders of Debentures having an aggregate principal amount of $1,445,000 have agreed to extend the term of their Debentures until April 10, 2011. We can provide no assurance that we will be able to generate adequate revenue from our operations to pay such Debentures when they mature or to refinance or further extend the term of the Debentures at that time.
15
Our continued operations will depend upon the availability of cash flow from operations and/or our ability to raise additional funds through various financing methods. If sales or revenues do not meet expectations, or cost estimates for development and expansion of our business prove to be inadequate, we will require additional funding. If additional capital cannot be obtained, we may have to delay or postpone acquisitions, development or other expenditures, which can be expected to harm our competitive position, business operations and growth potential. There can be no assurance that cash flow from operations will be sufficient to fund our financial needs, or if such cash flow is not sufficient, that additional financing will be available on satisfactory terms, if at all. Changes in capital markets and the cost of capital are unpredictable. Any failure to obtain such financing, or obtaining financing on unfavorable terms, can be expected to have a material adverse effect on our business, financial condition, results of operations and future business prospects.
We have had limited revenues and experienced significant net losses thus far.
To date, we have had limited revenues. We had revenues of $1,605,744 and $1,335,944 in fiscal years 2010 and 2009, respectively. In fiscal year 2010, we had a net loss of $2,491,966 and in fiscal year 2009, we had a net loss of $1,090,284. A substantial portion of our net losses for fiscal year 2010, aggregating approximately 88% of our total net losses for fiscal 2010, resulted from charges as a result of debt restructuring and other non-cash charges. Nevertheless, because we are subject to all risks inherent in a business venture, it is not possible to predict whether we will be profitable.
Accordingly, it is not possible to predict whether or not our current and proposed activities will be sufficiently profitable. Prospective purchasers of our securities should bear in mind that, in light of the risks and contingencies involved, no assurance can be given that we will ever generate enough revenue to offset expenses or to generate a return on invested capital. There is no guarantee of our successful, profitable operation. Our failure to achieve or maintain profitability can be expected to have a material adverse effect on our business, financial condition, results of operations and future business prospects.
We may experience significant fluctuations in our operating results and rate of growth and may not be profitable in the future.
Our results of operations may fluctuate significantly due to a variety of factors, many of which are outside of our control and difficult to predict. The following are some of the factors that may affect us from period to period and may affect our long-term financial performance:
|
●
|
our ability to retain and increase revenues associated with customers and satisfy customers’ demands;
|
|
●
|
our ability to be profitable in the future;
|
|
●
|
our investments in longer-term growth opportunities;
|
| ● |
our ability to expand our marketing network, and to enter into, maintain, renew and amend strategic alliance arrangements on favorable terms;
|
|
| ● | changes to offerings and pricing by us or our competitors; |
|
●
|
fluctuations in the size of our customer base, including fluctuations caused by marketing efforts and competitors’ marketing and pricing strategies;
|
|
●
|
the effects of commercial agreements and strategic alliances and our ability to successfully integrate them into our business;
|
|
●
|
technical difficulties, system downtime or interruptions;
|
|
| ● | the effects of litigation and the timing of resolutions of disputes; | |
| ● | the amount and timing of operating costs and capital expenditures; | |
| ● | changes in governmental regulation and taxation policies; |
16
|
●
|
events, such as a sustained decline in our stock price, that cause us to conclude that goodwill or other long-term assets are impaired and for which a significant charge to earnings is required; and
|
|
●
|
changes in, or the effect of, accounting rules, on our operating results.
|
The market for RFID services may not develop as anticipated, which would adversely affect our ability to execute our business strategy.
The success of our RFID offerings depends on growth in the number of RFID users, which in turn depends on wider public acceptance of RFID software solutions. The RFID market is in its early stages and may not develop as rapidly as is expected. Potential new users may view RFID as unattractive relative to traditional bar code products for a number of reasons, including implementation, procurement, integration and supply costs, greater technical complexity, immature technology, consumer privacy concerns, or the perception that the performance advantage for RFID is insufficient to justify the increased costs. There is no assurance that RFID will ever achieve broad user acceptance.
We may not successfully enhance existing products and services or develop new products and services in a cost-effective manner to meet customer demand in the evolving market for bar code and RFID software services.
The market for bar code and RFID software solutions is characterized by evolving technology and industry standards, changes in customer needs and frequent new product introductions. We are currently focused on enhancing our RFID capabilities through wider device coverage, additional application coverage and supporting other computing platforms beyond the System i. Our future success will depend, in part, on our ability to use leading technologies effectively, to continue to develop our technical expertise, to enhance our existing services and to develop new services that meet changing customer needs on a timely and cost-effective basis. We may not be able to adapt quickly enough to changing technology, customer requirements and industry standards. If we fail to use new technologies effectively, to develop our technical expertise and new services, or to enhance existing services on a timely basis, either internally or through arrangements with third parties, our product and service offerings may fail to meet customer needs, which would adversely affect our revenues and prospects for growth.
We have spent and will continue to spend significant resources enhancing our existing capabilities and developing, implementing and launching our RFID products. We believe RFID software solutions represent a significant growth opportunity. However, losses are expected to result in the early stages until a sufficient number of customers are added whose recurring revenues, net of recurring costs, more than offset sales, marketing and other expenses incurred to add additional customers.
RFID solutions may have technological problems or may not be accepted by customers. To the extent we pursue commercial agreements, acquisitions and/or strategic alliances to facilitate new product activities, the agreements, acquisitions and/or alliances may not be successful. If any of this were to occur, it could damage our reputation, limit our growth, negatively affect our operating results and harm our business.
Intense competition could reduce market share and harm financial performance.
The market for bar code and RFID encoding software is emerging, intensely competitive and characterized by rapid technological change.
Bar code and RFID software companies compete for customers based on industry experience, know-how, technology and price, with the dominant providers conducting extensive advertising campaigns to capture market share. Many of our competitors have (i) greater financial, technical, engineering, personnel and marketing resources; (ii) longer operating histories; (iii) better name recognition; and (iv) larger customer bases. These advantages afford our competitors the ability to (a) offer greater pricing flexibility, (b) offer more attractive incentive packages to encourage resellers to carry competitive products, (c) negotiate more favorable distribution contracts with resellers and (d) negotiate more favorable contracts with suppliers. We believe additional competitors may be attracted to the market, including IBM, Oracle, Microsoft, and HP. We also believe existing competitors are likely to continue to expand their offerings.
17
Current and prospective competitors include many large companies that have substantially greater market presence and greater financial, technical, marketing and other resources than we have. We compete directly or indirectly with the following categories of companies:
| ● | System i Label Software | |
|
●
|
System i Forms Software
|
|
●
|
UNIX/Linux/Windows Label Software
|
|
●
|
UNIX/Linux/Windows Forms Software
|
|
●
|
UNIX/Linux/Windows RFID Edge Software
|
As competition in the bar code and RFID market continues to intensify, competitors may continue to merge or form strategic alliances that would increase their ability to compete with us for customers. These relationships may negatively impact our ability to form or maintain our own strategic relationships and could adversely affect our ability to expand our customer base. Because we operate in a highly competitive environment, the number of customers we are able to add may decline, and the cost of acquiring new customers through our own sales and marketing efforts may increase.
Our ability to compete effectively in the bar code and RFID services industry will depend upon our ability to (i) continue to provide high quality products and services at prices competitive with, or lower than, those charged by our competitors and (ii) develop new and innovative products and services. There can be no assurance that competition from existing or new competitors or a decrease in prices by competitors will not have a material adverse effect on our business, financial condition and results of operations, or that we will be able to compete successfully in the future.
We may not be able to keep up with rapid technological and other changes.
The industry in which we compete is characterized, in part, by rapid growth, evolving industry standards, significant technological changes and frequent product enhancements. These characteristics could render our existing systems and strategies obsolete, and require us to continue to develop and implement new products and services, anticipate changing customer demands and respond to emerging industry standards and technological changes. We intend to evaluate these developments and others that may allow us to improve service to our customers. However, no assurance can be given that we will be able to keep pace with rapidly changing customer demands, technological trends and evolving industry standards. The failure to keep up with such changes is likely to have a material adverse effect on our business, long-term growth prospects and results of operations.
We are dependent on strategic relationships.
Our business is dependent, in part, upon current relationships and those we intend to develop with suppliers, distributors and resellers in various markets and other third parties. The failure to develop or maintain these relationships could result in a material adverse effect on our financial condition and results of operations.
Reliance upon third-party suppliers for components may place us at risk of interruption of supply or increase in costs.
We rely on third-party suppliers for certain hardware and software necessary for our services and we do not have any long-term supply agreements. Although we believe we can secure other suppliers, we expect that the deterioration or cessation of any relationship would have a material adverse effect, at least temporarily, until the new relationships are satisfactorily in place. Adverse affects could limit our ability to fill customer orders for bar code and RFID hardware and supplies, resulting in potential loss of revenues and loss of goodwill. Replacing any one supplier could take weeks.
18
Ongoing success and our ability to compete depend upon hiring and retention of key personnel.
Success will be dependent to a significant degree upon the involvement of current management, especially Harold Brand, our CEO. These individuals have critical industry experience and relationships upon which we rely. The loss of services of any of our key personnel could divert time and resources, delay the development of our business and negatively affect our ability to sell our products and services or execute our business plan. In addition, we will need to attract and retain additional talented individuals in order to carry out our business objectives. The competition for such persons is intense and there are no assurances that these individuals will be available. Such problems might be expected to have a material adverse impact on our financial condition, results of operations and future business prospects.
We are subject to control by officers and management and there could be conflicts of interest with management that may be adverse to your interests.
Management of CYBRA currently beneficially owns approximately 62.3% of the outstanding shares of our Common Stock. As a result, management possesses meaningful influence and control over the Company, and may be able to control and direct the Company’s affairs, including the election of directors and approval of significant corporate transactions for the foreseeable future.
A conflict of interest may arise between our management’s personal pecuniary interest and its fiduciary duty to our shareholders. Conflicts of interest create the risk that management may have an incentive to act adversely to the interests of other investors. Such influence may not necessarily be consistent with the interests of our other shareholders.
Director and officer liability is limited.
As permitted by New York law, our certificate of incorporation limits the personal liability of directors to the fullest extent permitted by the provisions of New York Business Corporation Law. As a result of our charter provision and New York law, shareholders may have limited rights to recover against directors for breach of fiduciary duty.
If we raise additional funds through the issuance of equity securities, or determine in the future to register additional Common Stock, your percentage ownership will be reduced, you will experience dilution which could substantially diminish the value of your stock and such issuance may convey rights, preferences or privileges senior to your rights, which could substantially diminish your rights and the value of your stock.
We may issue additional shares of Common Stock for various reasons and may grant additional stock options to employees, officers, directors and third parties. If we determine to register for sale to the public additional shares of Common Stock or other debt or equity securities in any future financing or business combination, a material amount of dilution can be expected to cause the market price of the Common Stock to decline. One of the factors that generally affects the market price of publicly traded equity securities is the number of shares outstanding in relationship to assets, net worth, earnings or anticipated earnings. Furthermore, the public perception of future dilution can have the same effect even if actual dilution does not occur.
In order for us to obtain additional capital, complete a business combination, or refinance the Debentures, we may find it necessary to issue securities, including but not limited to debentures, options, warrants or shares of preferred stock, conveying rights senior to those of the holders of Common Stock. Those rights may include voting rights, liquidation preferences and conversion rights. To the extent senior rights are conveyed, the value of the Common Stock can be expected to decline.
19
The existence of outstanding warrants, debentures, preferred stock and shares available under our Incentive Stock Plan may harm our ability to obtain additional financing and their exercise will result in dilution to your interests.
We have outstanding 11,400,404 warrants to purchase an aggregate of 11,400,404 shares of Common Stock. Each of the Class A and Class B Warrants is exercisable for up to five years from date of issue at an exercise price of $.75 per share (Class A Warrants) and $1.75 per share (Class B Warrants). The holder of a warrant may not exercise a warrant, if, after giving effect to such issuance after exercise, such holder would beneficially own more than 4.99% of the Company’s outstanding shares.
We also have 2,860,000 shares of Common Stock issuable upon exercise of the outstanding Debentures, and an additional 2,090,000 shares of Common Stock issuable upon exercise of an equal number of shares of Series A Preferred Stock. The Debentures and the Series A Preferred Stock are generally convertible into shares of Common Stock at any time at the option of the holders thereof.
Further, we have 5 million shares of Common Stock available for the grant of stock options and other grants of equity-based compensation under our 2006 Incentive Stock Plan.
The warrants contain standard anti-dilution provisions in the event of stock dividend, splits or other dilutive transactions. While these various securities are outstanding or otherwise available for grant, our ability to obtain future financing may be harmed. Upon exercise of these warrants, conversion of debentures or preferred stock or exercise of options or grants of other equity-based awards, substantial dilution to your ownership interests will occur as the number of shares of Common Stock outstanding increases.
We have identified material weaknesses in our internal controls over financial reporting.
In connection with our assessment of internal control over financial reporting for the year ended December 31, 2010, we identified two material weaknesses with respect to our internal control over financial reporting: A lack of an effective control environment, i.e., insufficient complement of personnel with an appropriate level of accounting knowledge, experience and training in the application of GAAP commensurate with our financial reporting requirements and business environment; and a failure to maintain effective controls over the period-end reporting process. In response to the material weaknesses identified by the Company, management has taken certain remedial measures that we believe will correct the design and operational effectiveness of such internal controls; however, we cannot guarantee that such remedial measures will actually correct the design and operational effectiveness of such internal controls and that in the future we will not discover additional material weaknesses in internal control over financial reporting.
Penny stock regulations may impose certain restrictions on marketability of the Company’s securities.
We are subject to rules pertaining to “penny stocks”. The SEC has adopted regulations which generally define a “penny stock” to be any equity security that has a market price (as defined) of less than $5.00 per share or an exercise price of less than $5.00 per share, subject to certain exceptions. Our shares have not had a market price of or greater than $5.00 per share since they began trading, nor is it likely that they will attain such price in the foreseeable future. As a result, our Common Stock will be subject to rules that impose additional sales practice requirements on broker-dealers who sell such securities to persons other than established clients and “accredited investors”. For transactions covered by these rules, the broker-dealer must make a special suitability determination for the purchase of such securities and have received the purchaser’s written consent to the transaction prior to the purchase. Additionally, for any transaction involving a penny stock, unless exempt, the rules require the delivery, prior to the transaction, of a risk disclosure document mandated by the SEC relating to the penny stock market. The broker-dealer must also disclose the commission payable to both the broker-dealer and the registered representative, current quotations for the securities and, if the broker-dealer is the sole market maker, the broker-dealer must disclose this fact and the broker-dealer’s presumed control over the market. Finally, monthly statements must be sent disclosing recent price information for the penny stock held in the account and information on the limited market in penny stocks. Consequently, the “penny stock” rules may restrict the ability of broker-dealers to sell shares of our Common Stock and may affect the ability of investors to sell such shares of Common Stock in the secondary market and the price at which such investors can sell any of such shares.
20
Investors should be aware that, according to the SEC, the market for penny stocks has suffered in recent years from patterns of fraud and abuse. Such patterns include:
|
●
|
control of the market for the security by one or a few broker-dealers that are often related to the promoter or issuer;
|
|
| ● | manipulation of prices through prearranged matching of purchases and sales and false and misleading press releases; | |
| ● | “boiler room” practices involving high pressure sales tactics and unrealistic price projections by inexperienced sales persons; | |
| ● | excessive and undisclosed bid-ask differentials and markups by selling broker-dealers; and | |
| ● | the wholesale dumping of the same securities by promoters and broker-dealers after prices have been manipulated to a desired level, along with the inevitable collapse of those prices with consequent investor losses. |
Our management is aware of the abuses that have occurred historically in the penny stock market.
Our Common Stock is thinly traded, and as a result, the market price for our Common Stock may be particularly volatile, which could lead to wide fluctuation in our share price, as the sale of substantial amounts of our Common Stock in the public market could depress the price of our Common Stock.
The trading volume of our Common Stock on the OTC Bulletin Board has been relatively low when compared with larger companies listed on the OTC Bulletin Board or other stock exchanges. Thinly traded stocks, such as ours, can be more volatile than stocks trading in an active public market. Because of this, our shareholders may not be able to sell their shares at the volumes, prices, or times that they desire.
We cannot predict the effect, if any, that future sales of our Common Stock in the market, or availability of shares of our Common Stock for sale in the market, will have on the market prices of our Common Stock. Therefore, we can give no assurance that sales of substantial amounts of our Common Stock in the market, or the potential for large amounts of sale in the market, would not cause the price of our Common Stock to decline or impair our ability to raise capital through sales of our Common Stock.
The market price of our Common Stock may fluctuate in the future, and these fluctuations may be unrelated to our performance. General market price declines or overall market volatility in the future could adversely affect the price of our Common Stock, and the current market price may not be indicative of future market prices.
ITEM 1B. UNRESOLVED STAFF COMMENTS
Not applicable.
ITEM 2. DESCRIPTION OF PROPERTY
The Company maintains its administrative and R&D offices in approximately 3,400 square feet of space located at One Executive Blvd., Yonkers, New York 10701. The Company has leased this space for a period of four years, beginning January 2010. Monthly rent for 2010 and 2011 will be $5,937 and subsequent years will be $6,312, which includes electricity.
CYBRA also leases approximately 1,100 square feet in West Seneca (Buffalo), New York for sales and customer support. The Company is leasing this space for a period of two years, beginning June 1, 2010. Monthly rent is $926 through May 2011 and $945 for the duration of the lease. Electricity is billed directly from the utility company.
21
ITEM 3. LEGAL PROCEEDINGS
In June 2009, the Herzliya, Israel Magistrate’s Court issued a judgment in favor of Raz-Lee Security Ltd. (“Raz-Lee”), a former distributor of the Company's products, in the amount of $26,944 plus interest at the rate of LIBOR plus one percent (1%), and an additional amount of 25,000 New Israel Shekels in costs. This judgment represented approximately ¼ of the amount that had been claimed by Raz-Lee.
The Company has to date paid 23,000 New Israel Shekels on account of the costs, leaving a balance of 2,000 New Israel Shekels (approximately $550). The Company has also paid the amount of $6,688 on account of the judgment, leaving a balance of approximately $21,000 (the original amount plus interest less the payment).
On February 15, 2011, Raz-Lee instituted proceedings in the Supreme Court of the State of New York, County of Westchester, Index No. 4763/11, for enforcement of the foreign judgment. In its pleading, Raz-Lee incorrectly states the balance due. Raz-Lee also seeks costs and disbursements.
The Company has included the liability for the balance in accrued expenses.
22
PART II
ITEM 5. MARKET FOR COMMON EQUITY, RELATED STOCKHOLDER MATTERS AND ISSUER PURCHASES OF EQUITY SECURITIES.
Trading in our Common Stock began in the third quarter of 2008. Our Common Stock is currently quoted on the OTC Bulletin Board under the symbol “CYRP”. The following table sets forth the range of high and low bid prices per share of our Common Stock for each of the calendar quarters identified below as reported by the OTC Bulletin Board. These quotations represent inter-dealer prices, without retail mark-up, markdown or commission, and may not represent actual transactions.
|
2010:
|
High
|
Low
|
||||||
|
Quarter ended March 31, 2010
|
$ | 0.51 | $ | 0.10 | ||||
|
Quarter ended June 30, 2010
|
$ | 0.59 | $ | 0.50 | ||||
|
Quarter ended September 30, 2010
|
$ | 0.60 | $ | 0.25 | ||||
|
Quarter ended December 31, 2010
|
$ | 0.55 | $ | 0.15 | ||||
|
2009:
|
High
|
Low
|
||||||
|
Quarter ended March 31, 2009
|
$ | 1.2500 | $ | 0.4000 | ||||
|
Quarter ended June 30, 2009
|
$ | 1.2500 | $ | 0.6000 | ||||
|
Quarter ended September 30, 2009
|
$ | 0.6000 | $ | 0.2000 | ||||
|
Quarter ended December 31, 2009
|
$ | 0.6000 | $ | 0.2500 | ||||
Holders
As of March 2011, there were 99 record owners of our Common Stock.
Dividends
Holders of Common Stock are entitled to receive dividends as may be declared by our Board of Directors and, in the event of liquidation, to share pro rata in any distribution of assets after payment of liabilities and payment of the liquidation preference to holders of our preferred stock. The Board of Directors is not obligated to declare a dividend. In addition, the terms of the Debentures and preferred stock restrict our ability to pay dividends. We have not paid any dividends and do not have any current plans to pay any dividends.
Recent Sales of Unregistered Securities
23
Securities Authorized For Issuance under Equity Compensation Plan
|
Plan Category
|
Number of securities
to be issued upon exercise
of outstanding options,
warrants and rights
|
Weighted-average
exercise price of
outstanding options,
warrants and rights
|
Number of securities
remaining available for
future issuance under
equity compensation plan
(excluding securities
reflected in column (a)
|
|||||||||
|
(a)
|
(b)
|
(c)
|
||||||||||
|
Equity compensation plans approved by security holders
|
100,000 | $ | 0.75 | 4,821,046 | ||||||||
|
Equity compensation plans not approved by security holders
|
— | — | — | |||||||||
|
Total
|
100,000 | $ | 0.75 | 4,821,046 | ||||||||
ITEM 6. SELECTED FINANCIAL DATA
Not applicable
This report on Form 10-K contains forward-looking statements. Forward-looking statements are statements not based on historical information and that relate to future operations, strategies, financial results or other developments. Forward-looking statements are necessarily based upon estimates and assumptions that are inherently subject to significant business, economic and competitive uncertainties and contingencies, many of which are beyond our control and many of which, with respect to future business decisions, are subject to change. These uncertainties and contingencies can affect actual results and could cause actual results to differ materially from those expressed in any forward-looking statements made by us or on our behalf. We disclaim any obligation to update forward-looking statements.
|
Years ended
|
||||||||||||||||
|
December 31,
|
||||||||||||||||
|
2010
|
2009
|
Change $
|
Change %
|
|||||||||||||
|
Revenues
|
||||||||||||||||
|
Products
|
$ | 806,980 | $ | 651,962 | $ | 155,018 | 24 | % | ||||||||
|
Services
|
798,764 | 683,982 | 114,782 | 17 | % | |||||||||||
|
Total Revenues
|
1,605,744 | 1,335,944 | 269,800 | 20 | % | |||||||||||
|
Direct Costs
|
||||||||||||||||
|
Equipment Purchases
|
$ | 143,272 | $ | 218,258 | $ | (74,986 | ) | -34 | % | |||||||
|
Royalties & Consulting
|
50,243 | 59,576 | (9,333 | ) | -16 | % | ||||||||||
|
Total Direct Costs
|
$ | 193,515 | $ | 277,834 | $ | (84,319 | ) | -30 | % | |||||||
|
% of total revenues
|
12 | % | 21 | % | ||||||||||||
|
Gross margin
|
$ | 1,412,229 | $ | 1,058,110 | $ | 354,119 | 33 | % | ||||||||
|
% of total revenues
|
88 | % | 79 | % | ||||||||||||
|
Research and development costs
|
$ | 215,772 | $ | 204,509 | $ | 11,263 | 6 | % | ||||||||
|
% of total revenues
|
13 | % | 15 | % | ||||||||||||
|
Sales and marketing expenses
|
$ | 173,550 | $ | 165,595 | $ | 7,955 | 5 | % | ||||||||
|
% of total revenues
|
11 | % | 12 | % | ||||||||||||
|
General and administrative expenses
|
$ | 1,594,243 | $ | 1,309,346 | $ | 284,897 | 22 | % | ||||||||
|
% of total revenues
|
99 | % | 98 | % | ||||||||||||
|
Interest expense
|
$ | 173,616 | $ | 407,698 | $ | (234,082 | ) | -57 | % | |||||||
|
% of total revenues
|
11 | % | 31 | % | ||||||||||||
|
Other Income (Expenses)
|
$ | (1,747,014 | ) | $ | (61,246 | ) | $ | (1,685,768 | ) | 2752 | % | |||||
|
% of total revenues
|
-109 | % | -5 | % | ||||||||||||
|
Loss Before Taxes
|
$ | (2,491,966 | ) | $ | (1,090,284 | ) | $ | (1,401,682 | ) | 129 | % | |||||
|
% of total revenues
|
-155 | % | -82 | % | ||||||||||||
24
Revenues
Total revenues for the twelve months ended ,December 31, 2010, as compared to the same period in 2009, increased by approximately 20%. New MarkMagic features previously released have met with positive reception from new and existing customers. Sales for our most recent RFID product, EdgeMagic, began to pick up this year, mirroring the general trend of increased market acceptance of RFID technology. Demand for services has showed an increase for the three and six month periods as well. We expect these trends to continue contributing to positive growth in revenues over the course of the year.
Direct Costs
The costs for equipment purchases for the twelve months ended December 31, 2010, were lower as compared to the same period in 2009, due to a sale from earlier in the year that was canceled in the third quarter, resulting in a vendor credit. The cost for equipment purchases for the twelve months ended December 31, 2010 was 34% lower as compared to 2009 due to a continuing trend of decrease in sales of lower profit hardware products.
Gross Margin
Gross Margin as a percentage of sales for the twelve months ended December 31, 2010 as compared to the same period in 2009 increased from 79% to 88%. This was due to the improved product sales mix of increased sales of higher profit software products and decrease of lower profit hardware products.
Research and Development Costs
Research and development costs consist primarily of compensation of development personnel, related overhead incurred to develop EdgeMagic and upgrades, and to enhance our current products and fees paid to outside consultants. Substantially all of these expenses have been incurred by us in the United States. Software development costs are accounted for in accordance with ACS 985-20-25, Research and Development Costs of Computer Software, under which we are required to capitalize software development costs between the time technological feasibility is established and the product is ready for general release. Costs that do not qualify for capitalization are charged to research and development expense when incurred. Our EdgeMagic software product was available for general release on September 1, 2009, and all costs after that date have been expensed in accordance with ACS 985-20-25. During the twelve months ended December 31, 2010 and 2009, the software development costs that were expensed were $226,605 and $204,509 , respectively. Software development costs increased slightly in 2010 due to enhancements to our MarkMagic and EdgeMagic products.
25
Sales and Marketing Expenses
Sales and marketing expenses consist primarily of commissions and advertising and promotional expenses. The small increase in absolute dollars for the twelve months ended December 31, 2010 as compared to the same period in 2009 is due to higher commissions paid as a result of higher revenues.
General and Administrative Expense
General and administrative expenses consist primarily of costs associated with our executive, financial, human resources and information services functions. General and administrative expenses increased in absolute dollars for the twelve months ended December 31, 2010 as compared to the same period in 2009 primarily due to the resolution of the Board to issue common stock in lieu of deferred management salaries, as well as management salaries paid in full beginning mid-year.
Interest Expense
Interest expense represents interest accrued on, and amortization of deferred financing cost related to, the 8% Convertible Debentures originally due April 10, 2009 (the “Debentures’). Amortization of these deferred finance costs ceased in April 2009 and standard interest continued to accrue on them. On June 8, 2010, holders of our Debentures having an aggregate principal amount of $1,445,000 converted outstanding interest due through April 2009 into shares of common stock. On the same date, 16 holders of Debentures having an aggregate principal amount of $1,045,000 agreed to exchange their Debentures for a new class of preferred stock of the Company having terms similar to those in the Debentures, resulting in decreased interest expense for the twelve months ended December 31, 2010.
Other Income (Expenses)
Other income and expenses increased for the twelve months ended December 31, 2010 compared to the same period in 2009 due to the reversal of default interest on the Debentures. Holders of our Debentures having an aggregate principal amount of $2,490,000 converted outstanding interest due through April 2009 into shares of common stock. The common stock was issued at $0.50 per share compared to the fair market value on June 8, 2010 of $0.59. As a result, the conversion generated a beneficial conversion cost. In addition, we incurred a loss of approximately $1,900,000 due to the amendment of Debentures having an aggregate principal amount of $2,490,000.
Provision for Income Taxes
The provision for income taxes consists of provisions for federal and state income taxes.
We recorded no income tax expense or benefit for the twelve months ended ended December 31, 2010 and 2009. The effective tax rate of 0% differs from the statutory U.S. federal income tax rate of 35% primarily due to increases in valuation allowance for deferred tax asset that we believe we are unlikely to be able to realize.
Liquidity and Capital Resources
The following table summarizes our cash and cash equivalents, working capital, long-term debt and cash flows for the twelve months ended December 31, 2010 and 2009.
26
|
Years Ended
|
||||||||||||||||
|
2010
|
2009
|
Change $
|
Change %
|
|||||||||||||
|
Cash and cash equivalents
|
$ | 24,335 | $ | 58,039 | $ | (33,704 | ) | -139 | % | |||||||
|
Working capital deficit
|
(2,410,668 | ) | (4,011,848 | ) | 1,601,180 | -66 | % | |||||||||
|
Net cash used in operating activities
|
(64,847 | ) | (11,162 | ) | (53,685 | ) | 83 | % | ||||||||
|
Net cash used in investing activities
|
(16,357 | ) | (1,390 | ) | (14,967 | ) | 92 | % | ||||||||
|
Net cash provided by financing activities
|
47,500 | - | 47,500 | 100 | % | |||||||||||
As of December 31, 2010, our principal source of liquidity was cash of $24,000. Our operations used $64,847 in cash during the twelve months ended December 31, 2010 as compared to $11,162 for the same period in 2009.
To sustain operations under our current structure, we need cash of approximately $110,000 per month to fund research and administrative expenses. We believe that we will be able to meet that continuing obligation at our current sales level.
Our working capital deficit was approximately $2,245,000 at December 31, 2010. The deficit in working capital included approximately $1,420,000 in liabilities related to the Convertible Debentures, as well as $414,737 in deferred revenues that require settlement in future services rather than cash.
During the year ended December 31, 2010, the Company issued 285,000 shares of common stock for services rendered as consultants and directors for total compensation of $147,750. Pursuant to a resolution of the Board of Directors on August 3, 2010, 436,861 shares were issued to management in lieu of deferred compensation of $93,157. The shares were valued at the then market price of $.51 resulting in a gross valuation of the shares issued of $222,799 of which $129,643 was charged to operations as officer compensation.
During 2010, the Company issued 150,000 shares of Common Stock to Nathan Retek, and 125,000 shares of Common Stock to Shmilly Gruenstein, in both instances for services rendered by Messrs. Retek and Gruenstein to the Company.
As of the fourth quarter of 2010, we were operating at better than break-even on a cash flow basis. This is due to an upturn in business that we believe may be a result of the overall improvement in the general business environment, positive market acceptance of new product features, as well as our success in maintaining tight control on expenses. We see a recent positive trend in customer interest in RFID in general and in our EdgeMagic product in particular. Wal-Mart’s implementation of RFID tracking throughout its stores for selected apparel goods is a positive sign. Apparel suppliers represent a large segment of our customer base. Wal-Mart is often a pioneer in new technology, with other retailers following suit. JC Penney and Dillard’s have already joined Wal-Mart in encouraging their suppliers - among them a number of CYBRA customers - to tag their apparel goods at the item level. We therefore, expect increased interest in EdgeMagic to meet anticipated retailer compliance requirements over the course of 2011.
The Company does not have the resources to repay the Debentures that remain outstanding. We are currently attempting to renegotiate the terms of the Debentures, either by extending the due date of the Debentures or by exchanging the Debentures for a new series of preferred stock. However, there is no guarantee that we will be successful in negotiating an extension of the maturity date of the Debentures or an exchange of the Debentures for preferred stock with all holders of the Debentures. If we are successful, we believe we can sustain the Company’s cash flow at break-even and will not need additional sources of financing for the short term. If we are unsuccessful, we may not be able to continue operations as a going concern.
ITEM 7A. QUANTITIVE AND QUALITATIVE DISCLOSURES ABOUT MARKET RISK
Not applicable to smaller reporting companies.
27
ITEM 8. FINANCIAL STATEMENTS AND SUPPLEMENTARY DATA
The financial statements and notes thereto are set forth immediately after the signature page in this Annual Report on Form 10-K. Set forth below is the table of contents for the aforementioned financial statements and notes thereto.
|
Page
|
|
|
REPORT OF INDEPENDENT REGISTERED PUBLIC ACCOUNTING FIRM – KBL, LLP
|
F-1
|
|
FINANCIAL STATEMENTS
|
|
|
BALANCE SHEETS
|
F-2
|
|
STATEMENTS OF OPERATIONS
|
F-3
|
|
STATEMENTS OF CHANGES IN STOCKHOLDERS’ DEFICIT
|
F-4
|
|
STATEMENTS OF CASH FLOWS
|
F-5
|
|
NOTES TO FINANCIAL STATEMENTS
|
F-6 - F-18
|
REPORT OF INDEPENDENT REGISTERED PUBLIC ACCOUNTING FIRM
To the Board of Directors and Stockholders of
CYBRA Corporation
We have audited the accompanying balance sheets of CYBRA Corporation ("the Company") as of December 31, 2010 and 2009 and the related statements of operations, changes in stockholders' deficit, and cash flows for the years then ended. These financial statements are the responsibility of the Company's management. Our responsibility is to express an opinion on these financial statements based on our audits.
We conducted our audits in accordance with the standards of the Public Company Accounting Oversight Board (United States). Those standards require that we plan and perform the audit to obtain reasonable assurance about whether the financial statements are free of material misstatement. The Company is not required to have, nor were we engaged to perform, an audit of its internal control over financial reporting. Our audits included consideration of internal control over financial reporting as a basis for designing audit procedures that are appropriate in the circumstances, but not for the purpose of expressing an opinion on the effectiveness of the Company's internal control over financial reporting. Accordingly we express no such opinion. An audit includes examining, on a test basis, evidence supporting the amounts and disclosures in the financial statements. An audit also includes assessing the accounting principles used and significant estimates made by management, as well as evaluating the overall financial statement presentation. We believe that our audits provide a reasonable basis for our opinion.
In our opinion, the financial statements referred to above present fairly, in all material respects, the financial position of the Company as of December 31, 2010 and 2009 and the results of its operations and its cash flows for the years then ended in conformity with accounting principles generally accepted in the United States of America.
The accompanying financial statements have been prepared assuming that the Company will continue as a going concern. As discussed in Note 1 to the financial statements, the Company incurred a net loss of $ 2,491,966 for the year ended December 31, 2010, had a working capital deficit of $2,410,668, and had a stockholders’ deficit of $2,245,100 at December 31, 2010. Additionally, the amended 8% Convertible Debentures with a balance of $1,420,000 are due on April 11, 2011 and the Company will not have sufficient cash reserves to make the payments when they come due. These conditions raise substantial doubt about the Company’s ability to continue as a going concern. Management’s plans regarding those matters also are described in Note 1. The financial statements do not include any adjustments that might result from the outcome of this uncertainty.
/s/ KBL, LLP
New York, New York
March 31, 2011
F-1
CYBRA CORPORATION
BALANCE SHEETS
|
December 31,
|
||||||||
|
2010
|
2009
|
|||||||
| ASSETS | ||||||||
|
CURRENT ASSETS
|
||||||||
|
Cash
|
$ | 24,335 | $ | 58,039 | ||||
|
Accounts receivable, less allowance for doubtful accounts of $6,000 and $17,000, respectively
|
221,590 | 174,538 | ||||||
|
Total Current Assets
|
245,925 | 232,577 | ||||||
|
PROPERTY AND EQUIPMENT, at cost, less accumulated depreciation and amortization of
|
||||||||
|
$281,017 and $263,425
|
51,246 | 53,982 | ||||||
|
SOFTWARE DEVELOPMENT, at cost, less accumulated amortization of
|
||||||||
|
$576,033 and $349,862
|
102,668 | 327,338 | ||||||
|
SECURITY DEPOSITS AND OTHER ASSETS
|
11,654 | 11,654 | ||||||
|
TOTAL ASSETS
|
$ | 411,493 | $ | 625,551 | ||||
|
LIABILITIES AND STOCKHOLDERS' DEFICIT
|
||||||||
|
CURRENT LIABILITIES
|
||||||||
|
8% Convertible Debentures
|
$ | 1,420,000 | $ | 2,604,098 | ||||
|
Accrued liquidated damages - registration rights agreement
|
- | 110,000 | ||||||
|
Accounts payable and accrued expenses
|
329,283 | 472,211 | ||||||
|
Deferred officer/director compensation
|
131,827 | 90,565 | ||||||
|
Accrued interest
|
313,246 | 599,728 | ||||||
|
Loans from shareholders in contemplation of private placement of common stock
|
47,500 | - | ||||||
|
Deferred revenue
|
414,737 | 367,823 | ||||||
|
TOTAL CURRENT LIABILITIES
|
2,656,593 | 4,244,425 | ||||||
|
STOCKHOLDERS' DEFICIT
|
||||||||
|
Preferred Stock, Series A 10% Convertible Preferred Stock, par value $0.001 per share, 10,000,000
|
||||||||
|
shares authorized; 2,090,000 shares issued and outstanding (liquidation preference $1,045,000)
|
2,090 | - | ||||||
|
Common stock, par value $0.001 per share, 100,000,000 shares authorized;
|
||||||||
|
15,519,667 and 13,766,662 shares issued and outstanding
|
15,519 | 13,767 | ||||||
|
Additional Paid - in capital
|
6,754,024 | 2,892,126 | ||||||
|
Accumulated deficit
|
(9,016,733 | ) | (6,524,767 | ) | ||||
|
Total Stockholders' Deficit
|
(2,245,100 | ) | (3,618,874 | ) | ||||
|
TOTAL LIABILITIES AND STOCKHOLDERS' DEFICIT
|
$ | 411,493 | $ | 625,551 | ||||
The accompanying notes are an integral part of these financial statements
F-2
CYBRA CORPORATION
STATEMENT OF OPERATIONS
|
Years Ended
|
||||||||
|
December 31,
|
||||||||
|
2010
|
2009
|
|||||||
|
REVENUES
|
||||||||
|
Products
|
$ | 806,980 | $ | 651,962 | ||||
|
Services
|
798,764 | 683,982 | ||||||
|
TOTAL REVENUES
|
1,605,744 | 1,335,944 | ||||||
|
COST OF GOODS SOLD
|
||||||||
|
Equipment purchases
|
143,272 | 218,258 | ||||||
|
Royalties and consulting
|
50,243 | 59,576 | ||||||
| 193,515 | 277,834 | |||||||
|
GROSS PROFIT
|
1,412,229 | 1,058,110 | ||||||
|
Research and Development
|
215,772 | 204,509 | ||||||
|
Selling, General and Administrative
|
1,767,793 | 1,474,941 | ||||||
|
TOTAL OPERATING EXPENSES
|
1,983,565 | 1,679,450 | ||||||
|
LOSS FROM OPERATIONS
|
(571,336 | ) | (621,340 | ) | ||||
|
OTHER INCOME (EXPENSE)
|
||||||||
|
Reversal (Loss) on debenture valuation adjustment
|
61,316 | (61,316 | ) | |||||
|
Reversal on liquidated damages
|
110,000 | - | ||||||
|
Loss on debt restructuring
|
(1,225,748 | ) | - | |||||
|
Beneficial conversion cost resulting from stock issued in payment
|
||||||||
|
of accrued debenture interest at amounts less than the current
|
||||||||
|
quoted market price of the shares
|
(88,083 | ) | - | |||||
|
Loss in connection with issuance of Series A 10% Convertible Preferred
|
||||||||
|
Stock valued at $1,665,788 in exchange for 8% convertible debentures with
|
||||||||
|
an outstanding balance of $1,045,000 at the date of exchange
|
(620,788 | ) | - | |||||
|
Interest expense, includes amortization of deferred finance costs of $113,010 (2009)
|
||||||||
|
and $20,007 to officers related to deferred compensation (2010)
|
(173,616 | ) | (407,698 | ) | ||||
|
Refundable state tax credits
|
16,243 | - | ||||||
|
Interest income
|
46 | 70 | ||||||
| (1,920,630 | ) | (468,944 | ) | |||||
|
NET LOSS
|
$ | (2,491,966 | ) | $ | (1,090,284 | ) | ||
|
PER SHARE DATA
|
||||||||
|
Basic and diluted net loss per share
|
$ | (0.17 | ) | $ | (0.08 | ) | ||
|
Basic and diluted weighted-average shares outstanding
|
15,080,701 | 13,499,937 | ||||||
The accompanying notes are an integral part of these financial statements
F-3
|
STATEMENTS OF CHANGES IN STOCKHOLDERS' DEFICIT
|
||||||||||||||||||||||||||||
|
FOR THE YEARS ENDED DECEMBER 31, 2010 AND DECEMBER 31, 2009
|
||||||||||||||||||||||||||||
|
Series A 10% Convertible
|
||||||||||||||||||||||||||||
|
Preferred Stock
|
Common Stock
|
Additional
|
Accumulated
|
|||||||||||||||||||||||||
|
Shares
|
Amount
|
Shares
|
Amount
|
paid-in-capital
|
Deficit
|
Total
|
||||||||||||||||||||||
|
Balance at January 1, 2009
|
13,512,143 | $ | 13,512 | $ | 2,752,621 | $ | (5,434,483 | ) | $ | (2,668,350 | ) | |||||||||||||||||
|
Common Stock issued to consultants in lieu
|
||||||||||||||||||||||||||||
|
of cash payments for services rendered
|
70,000 | 70 | 47,430 | 47,500 | ||||||||||||||||||||||||
|
Common Stock issued in payment of accrued
|
||||||||||||||||||||||||||||
|
interest payable on 8% convertible debentures
|
184,519 | 185 | 92,075 | 92,260 | ||||||||||||||||||||||||
|
Net loss for the year
|
- | - | - | (1,090,284 | ) | (1,090,284 | ) | |||||||||||||||||||||
|
Balance at December 31, 2009
|
- | - | 13,766,662 | 13,767 | 2,892,126 | $ | (6,524,767 | ) | $ | (3,618,874 | ) | |||||||||||||||||
|
Common Stock issued to consultants in lieu
|
||||||||||||||||||||||||||||
|
of cash payments for services rendered
|
285,000 | 285 | 147,465 | 147,750 | ||||||||||||||||||||||||
|
Common Stock issued in payment of accrued
|
||||||||||||||||||||||||||||
|
interest payable on 8% convertible debentures
|
981,144 | 980 | 489,592 | 490,572 | ||||||||||||||||||||||||
|
Series A Preferred Stock issued in exchange
|
||||||||||||||||||||||||||||
|
for 8% convertible debentures
|
2,090,000 | 2,090 | 1,663,698 | 1,665,788 | ||||||||||||||||||||||||
|
Valuation adjustment on old warrants exchanged
|
||||||||||||||||||||||||||||
|
for new warrants with extended terms and reduced
|
||||||||||||||||||||||||||||
|
exercise price, issued in connection with the
|
||||||||||||||||||||||||||||
|
renegotiation and exchange of debentures
|
1,225,748 | 1,225,748 | ||||||||||||||||||||||||||
|
Beneficial conversion cost resulting from stock issued
|
||||||||||||||||||||||||||||
|
in payment of accrued debenture interest at amounts
|
||||||||||||||||||||||||||||
|
less than the current quoted market price of the shares
|
88,083 | 88,083 | ||||||||||||||||||||||||||
|
Shares issued to officers and directors in partial
|
||||||||||||||||||||||||||||
|
payment of previously accrued deferred compensation
|
||||||||||||||||||||||||||||
|
of $93,157 and additional compensation of $129,643
|
436,861 | 437 | 222,362 | 222,799 | ||||||||||||||||||||||||
|
Conversion of 8% Convertible Debentures into Common Stock
|
50,000 | 50 | 24,950 | 25,000 | ||||||||||||||||||||||||
|
Net loss for the year
|
(2,491,966 | ) | (2,491,966 | ) | ||||||||||||||||||||||||
|
Balance at December 31, 2010
|
2,090,000 | 2,090 | 15,519,667 | 15,519 | 6,754,024 | (9,016,733 | ) | (2,245,100 | ) | |||||||||||||||||||
The accompanying notes are an integral part of these financial statements
F-4
CYBRA CORPORATION
STATMENTS OF CASH FLOWS
|
Years Ended
|
||||||||
|
December 31,
|
||||||||
|
2010
|
2009
|
|||||||
|
CASH FLOWS FROM OPERATING ACTIVITIES
|
||||||||
|
Net loss
|
$ | (2,491,966 | ) | $ | (1,090,284 | ) | ||
|
Adjustments to reconcile net loss to net cash provided by (used in) operating activities
|
||||||||
|
Depreciation and Amortization
|
243,763 | 251,972 | ||||||
|
Stock based compensation to officers
|
129,643 | - | ||||||
|
Stock based compensation to outside directors
|
7,500 | 10,000 | ||||||
|
Stock based compensation to consultants
|
140,250 | 37,500 | ||||||
|
Reduction in allowance for doubtful accounts
|
11,000 | - | ||||||
|
Common Stock issued in payment of accrued interest payable on 8% convertible debentures
|
490,572 | - | ||||||
|
Loss on debt restructuring-warrants valuation adjustment
|
1,225,748 | - | ||||||
|
Beneficial conversion cost in connection with issuance of common stock
|
||||||||
|
in exchange for interest payable.
|
88,083 | - | ||||||
|
Loss in connection with issuance of 10% convertible preferred stock valued at $1,665,788 in exchange
|
||||||||
|
for 8% convertible debentures with an outstanding balance of $1,045,000 at the date of exchange
|
620,788 | - | ||||||
|
Interest expense - amortization of debt discount
|
- | 139,992 | ||||||
|
Amortization of deferred finance cost
|
- | 113,010 | ||||||
|
Provision for settlement of litigation
|
- | 3,000 | ||||||
|
Debenture valuation adjustment
|
(61,316 | ) | 61,316 | |||||
|
Changes in operating assets and liabilities
|
||||||||
|
(Decrease) in accrued liquidated damages
|
(110,000 | ) | - | |||||
|
(Decrease) in accounts receivable
|
(58,052 | ) | 156,482 | |||||
|
Increase in security deposits and other assets
|
- | 7,057 | ||||||
|
(Decrease) increase in accounts payable and accrued expenses
|
(9,303 | ) | 122,688 | |||||
|
(Decrease) increase in accrued interest
|
(338,471 | ) | 154,698 | |||||
|
Deferred revenue
|
46,914 | 21,407 | ||||||
|
Net Cash Used in Operating Activities
|
(64,847 | ) | (11,162 | ) | ||||
|
Acquisition of property and equipment and increase in software development
|
(16,357 | ) | (1,390 | ) | ||||
|
Additions to software development costs
|
- | |||||||
|
Net Cash Used in Investing Activities
|
(16,357 | ) | (1,390 | ) | ||||
|
CASH FLOWS FROM FINANCING ACTIVITIES
|
||||||||
|
Loans from shareholders towards the planned issuance of common stock
|
47,500 | - | ||||||
|
Net Cash Provided by Financing Activities
|
47,500 | - | ||||||
|
(DECREASE) IN CASH AND CASH EQUIVALENTS
|
(33,704 | ) | (12,552 | ) | ||||
|
CASH AND CASH EQUIVALENTS
|
||||||||
|
Beginning of period
|
58,039 | 70,591 | ||||||
|
End of period
|
$ | 24,335 | $ | 58,039 | ||||
|
SUPPLEMENTAL DISCLOSURES OF CASH FLOW INFORMATION:
|
||||||||
|
Cash paid during the period for:
|
||||||||
|
Income Taxes
|
$ | 714 | $ | 3,752 | ||||
|
Interest
|
$ | 1,545 | $ | - | ||||
|
NON-CASH DISCLOSURES
|
||||||||
|
Issuance of 978,703 shares of common stock in settlement of accrued interest payable to
|
$ | 490,572 | $ | - | ||||
|
holders of 8% convertible debentures
|
||||||||
|
Issuance of 184,519 shares of common stock in settlement of accrued interest payable to
|
||||||||
|
holders of (original) 8% convertible debentures
|
$ | - | $ | 92,260 | ||||
|
Conversion of 8% Convertible Debentures into 50,000 shares of common stock
|
$ | 25,000 | $ | - | ||||
|
286,861 shares of common stock issued to officers and directors in partial payment of previously deferred
|
||||||||
|
compensation
|
$ | 93,157 | $ | - | ||||
|
Issuance of 2,090,000 shares of Series A Preferred Stock in exchange for 8% Convertible Debentures
|
$ | 1,665,788 | $ | - | ||||
|
Reversal of Mandatory Prepayment balance in connection with Debenture Amendment and Exchange Agreements
|
$ | 51,989 | $ | - | ||||
The accompanying notes are an integral part of these financial statements
F-5
CYBRA CORPORATION
NOTES TO FINANCIAL STATEMENTS
1. ORGANIZATION, DESCRIPTION OF OPERATIONS, FINANCIAL STATUS OF THE COMPANY AND BASIS OF PRESENTATION
Organization and Description of Operations
CYBRA Corporation (the “Company”) was incorporated under the laws of the State of New York on September 6, 1985. The Company is a software developer, publisher and systems integrator specializing in Automatic Identification technology solutions. The Company’s flagship product, MarkMagicTM, is a barcode, radio frequency identification (“RFID”) and forms middleware solution relied upon daily by thousands of customers worldwide. It helps customers easily integrate bar code labels, RFID technology and electronic forms into their business systems. EdgeMagic®, first released in February 2008, is an integrated RFID control solution that is highly scalable. It is designed to manage edge readers and analog control devices, commission, read, filter and verify RFID tags to comply with Electronic Product Code (EPC) compliance mandates, as well as for asset tracking applications and integration with popular ERP and Warehouse Management application packages. CYBRA software solutions run on all major computing platforms including IBM Power Systems (System i, iSeries, AS/400, AIX) as well as Linux, Unix, and Microsoft Windows.
Financial Status of the Company/Going Concern
At December 31, 2010, the Company had cash of approximately $24,000, and a working capital deficit of $ 2,410,668, which includes certain current liabilities that do not require near term cash settlement. Additionally, the Company incurred a net loss of $2,491,966 for the year ended December 31, 2010, and had a sharehholders’ deficit of $2,245,100 at December 31, 2010. Management has taken several steps to improve sales and reduce costs in order to ensure that its cash flows will meet its operating cash requirements for the next quarter. These steps include increasing sales of EdgeMagic®, which management believes has revenue potential far in excess of the current product mix, as well as the formation of a field level sales team.
The amended 8% Convertible Debentures with a principal balance of $1,420,000 are due on April 11, 2011.Management is planning to commence negotiations with the holders of these debentures. In the event that negotiations are not successful, the Company does not have sufficient cash to pay the balances and will be in default.
These factors raise serious doubt about the Company’s ability to continue as a going concern. Management is hopeful that they will succeed in settling with the debenture holders in a manner that will provide the Company with sufficient time to repay the debt and not have the risk of further default. No assurances can be given that management will be successful in its negotiations with the debenture holders or that the efforts to improve the sales of EdgeMagic® will result in improvements significant enough to provide sufficient cash flows and operating capital. No adjustments have been made to the accompanying financial statements to reflect the recoverability or classification of recorded asset amounts or the amounts or classification of liabilities should the Company be unable to continue in existence.
2. SUMMARY OF SIGNIFICANT ACCOUNTING POLICIES
Software Costs
The Company accounts for software development costs in accordance with ASC 985.730, Software Research and Development, and ASC 985-20, Costs of Software to be Sold, Leased or Marketed. ASC 985-20 requires that costs related to the development of enhancements to MarkMagic be capitalized as an asset when incurred subsequent to the point at which technological feasibility of the enhancement is established. ASC 985-20 specifies that “technological feasibility” can only be established by the completion of a “detailed program design” or if no such design is prepared, upon the completion of a “working model” of the software. The Company’s development process does not include a detailed program design. Management believes that such a design could be produced in the early stages of development but would entail significant wasted expense and delay. Consequently, ASC 985-20 requires the development costs to be recorded as an expense until the completion of a “working model”. In the Company’s case, the completion of a working model does not occur until shortly before the time when the software is ready for sale.
Research and Development Costs
Research and development costs incurred after completion of development of a product are expensed as incurred. Total research and development expense for the years ended December 31, 2010 and 2009 was $ 215,772 and $204,509, respectively.
F-6
Accounting for Warrants Classified as Equity Issued to Purchase Company Common Stock
Warrants issued in conjunction with equity financings were accounted for under ASC 815-40, Contracts in Entity’s Own Stock. ASC 825-20, Accounting for Registration Payment Arrangements, establishes the standard that contingent obligations to make future payments under a registration rights arrangement shall be recognized and measured separately in accordance with the standard, Reasonable Estimation of the Amount of a Loss. The Company has evaluated how these standards affected these accompanying financial statements. The adoption of the accounting pronouncement on January 1, 2007 changed the classification of the warrant liability, which was $551,910 at January 1, 2007, to stockholders’ equity (additional paid in capital). This is no longer applicable.
Derivative Financial Instruments
The Company accounts for its Warrants, which were issued in a private placement of the 8% Convertible Debentures (the “Debentures”) with detachable Warrants on April 10, 2006, and amended on June 8, 2010 to extend their maturity to April 10, 2013, and reduce the exercise prices to amounts between $1.00 and $1.30 from $1.75 (see Note 3, 8% Convertible Debentures and Derivative Financial Instruments), as derivatives under the guidance of ASC 815-10, Accounting for Derivative Instruments and Hedging Activities, and ASC 815-40, Contracts in an Entity’s Own Stock. The Company considers these standards applicable by adopting “View A” of the Issue Summary–The Effect of a Liquidated Damages Clause on a Freestanding Financial Instrument in which the Warrants and the related registration rights agreement are viewed together as a combined instrument that is indexed to the Company's stock. The embedded conversion feature of the Debentures has not been classified as a derivative financial instrument because the Company believes that they are “conventional” as defined in ASC 470-20, Conventional Convertible Debt Instrument.
Depreciation and Amortization
Depreciation and amortization are provided by the straight-line and accelerated methods over the estimated useful lives indicated in Note 5, Property and Equipment.
Income Taxes
Income taxes are accounted for under the asset and liability method in accordance with ASC 740, Income Taxes. Deferred tax assets and liabilities are recognized for the future tax consequences attributable to differences between the financial carrying amounts of existing assets and liabilities and their respective tax bases as well as operating loss and tax credit carry forwards. Deferred tax assets and liabilities are measured using enacted tax rates expected to apply to taxable income in the periods in which those temporary differences are expected to be recovered or settled. The effect on deferred tax assets and liabilities of a change in tax rates is recognized in income in the period that includes the enactment date. Deferred tax assets are reduced by a valuation allowance to the extent that the recoverability of the asset is unlikely to be recognized.
The Company follows ASC 740 rules governing uncertain tax positions, which provides guidance for recognition and measurement. This prescribes a threshold condition that a tax position must meet for any of the benefits of the uncertain tax position to be recognized in the financial statements. It also provides accounting guidance on derecognization, classification and disclosure of these uncertain tax positions.
Interest costs and penalties related to income taxes are classified as interest expense and selling, general and administrative costs, respectively, in the Company's financial statements. For the years ended December 31, 2010 and 2009, the Company did not recognize any interest or penalty expense related to income taxes. The Company is currently subject to a three-year statute of limitations by major tax jurisdictions. The Company files income tax returns in the U.S. federal jurisdiction and New York State.
Advertising Costs
Advertising costs are charged to expense as incurred. Total advertising amounted to $12,852 and $11,504 for the years ended December 31, 2010 and 2009, respectively.
Use of Estimates
The preparation of financial statements, in conformity with accounting principles generally accepted in the United States of America, requires management to make estimates and assumptions that affect the reported amounts of assets and liabilities and disclosure of contingent assets and liabilities at the date of the financial statements, and the reported amounts of revenue and expenses during the reporting period. Actual results could differ from those estimates. The most significant estimates relate to valuation of warrants, stock grants and stock options, the net operating loss carry-forward, the valuation allowance for deferred taxes and various contingent liabilities. It is reasonably possible that these above-mentioned estimates and others may be adjusted as more current information becomes available, and any adjustment could be significant in future reporting periods. The Company bases its estimates on historical experience and on various other assumptions that are believed to be reasonable under the circumstances, the results of which form the basis for making judgments about the carrying value of assets and liabilities that are not readily apparent from other sources. Actual results could differ from those estimates.
F-7
Concentrations of Credit Risk
Financial instruments that potentially subject the Company to concentrations of credit risk consist of commercial accounts receivable and temporary cash investments, which could, from time-to-time, exceed the federal depository insurance coverage. The Company has cash investment policies that restrict placement of these investments with financial institutions evaluated as highly creditworthy. As of December 31, 2010, the Company does not hold cash and cash equivalents with individual banks in excess of federally insured limits.
Concentrations of credit risk that arise from financial instruments exist for groups of customers when they have similar economic characteristics that would cause their ability to meet contractual obligations to be similarly affected by changes in economic conditions. The Company operates in one segment, software development and systems integration of bar code and RFID to manufacturers and wholesale distributors in the United States of America. Management believes that the customer base is sufficiently diverse and therefore does not consider the aggregate of customer accounts receivable to be a concentration of credit risk.
Cash and Cash Equivalents
The Company classifies marketable securities that are highly liquid and have maturities of six months or less at the date of purchase as cash equivalents. The Company manages its exposure to counterparty credit risk through specific minimum credit standards, diversification of counterparties and procedures to monitor its credit risk concentrations.
Revenue Recognition
The Company recognizes revenues in accordance with AICPA Statement of Position ASC 985-605, Software Revenue Recognition.
Revenue from software license agreements is recognized when persuasive evidence of an agreement exists, delivery of the software has occurred, the fee is fixed or determinable, and collectability is probable. In software arrangements that include more than one element, the Company allocates the total arrangement fee among the elements based on the relative fair value of each of the elements.
License revenue allocated to software products generally is recognized upon delivery of the products or deferred and recognized in future periods to the extent that an arrangement includes one or more elements to be delivered at a future date and for which fair values have not been established. Revenue allocated to maintenance agreements is recognized ratably over the maintenance term and revenue allocated to training and other service elements is recognized as the services are performed. If evidence of fair value does not exist for all elements of a license agreement and post customer support (PCS) is the only undelivered element, then all revenue for the license arrangement is recognized ratably over the term of the agreement as license revenue. If evidence of fair value of all undelivered PCS elements exists but evidence does not exist for one or more delivered elements, then revenue is recognized using the residual method. Under the residual method, the fair value of the undelivered elements is deferred and the remaining portion of the arrangement fee is recognized as revenue.
Cost of license revenue primarily includes product, delivery, and royalty costs. Cost of maintenance and service revenue consists primarily of labor costs for engineers performing implementation services, technical support, and training personnel as well as facilities and equipment costs.
Accounts Receivable
The Company records trade accounts receivable at net realizable value. This value includes an appropriate allowance for estimated uncollectible accounts to reflect any loss anticipated on the trade accounts receivable balances and charged to the provision for doubtful accounts. The Company calculates this allowance based on its history of write-offs, level of past-due accounts based on the contractual terms of the receivables, and its relationships with and the economic status of its customers. Uncollectible receivables are charged off against the allowance for doubtful accounts as management determines that they are clearly uncollectible after taking all reasonable steps to collect the balances.
Trade receivables are presented net of an allowance for doubtful accounts of $ 6,000 and $17,000 as of December 31, 2010 and 2009.
Substantially all of the Company’s accounts receivable are due from manufacturing companies and software vendors located throughout the United States.
F-8
Stock-Based Compensation
In addition to requiring supplemental disclosures, ASC 718, Compensation – Stock Compensation, and ASC 505-50, Equity-Based Payments to Non-Employees, addresses the accounting for share-based payment transactions in which a company receives goods or services in exchange for (a) equity instruments of the company or (b) liabilities that are based on the fair value of the company’s equity instruments or that may be settled by the issuance of such equity instruments. ASC 718 focuses primarily on accounting for transactions in which a company obtains employee services in share-based payment transactions.
The Company uses the modified prospective method. Stock issued to consultants for consulting services was valued as of the date of the agreements with the various consultants, which in all cases was earlier than the dates when the services were committed to be performed by the various consultants.
References to the issuances of restricted stock refer to stock of a public company issued in private placement transactions to individuals who are eligible to sell all or some of their shares of restricted Common Stock pursuant to Rule 144, promulgated under the Securities Act of 1933, as amended (“Rule 144”), subject to certain limitations. In general, pursuant to Rule 144, a stockholder who is not an affiliate and has satisfied a six-month holding period may sell all of his restricted stock without restriction, provided that the Company has current information publicly available. Rule 144 also permits, under certain circumstances, the sale of restricted stock, without any limitations, by a non-affiliate of the Company that has satisfied a one-year holding period.
Fair Value of Financial Instruments
The fair value of the Company’s assets and liabilities, which qualify as financial instruments under ASC 820, Fair Value Measurements and Disclosures, approximates the carrying amounts represented in the balance sheet.
ASC 825-20, Accounting for Registration Payment Arrangements, addresses an issuer’s accounting for registration payment arrangements by specifying that the contingent obligation to make future payments or otherwise transfer consideration under a registration payment arrangement, whether issued as a separate agreement or included as a provision of a financial instrument or other agreement, should be separately recognized and measured in accordance with ASC 450, Contingencies. In connection with the Debenture Amendment and Exchange Agreements (as discussed in Note 3, 8% Convertible Debentures and Derivative Financial Instruments), the registration rights and penalties under the original Securities Purchase Agreements were waived.
Basic and Diluted Loss per Share
In accordance with ASC 260, Earnings Per Share, the basic loss per common share is computed by dividing net loss available to common stockholders by the weighted average number of common shares outstanding. Diluted loss per common share is computed in a manner similar to basic loss per common share except that the denominator is increased to include the number of additional common shares that would have been outstanding if the potential common shares had been issued and if the additional common shares were dilutive. At December 31, 2010 and 2009, the Company’s stock equivalents were anti-dilutive and excluded in the diluted loss per share computation.
Commitments and Contingencies
Liabilities for loss contingencies arising from various claims, assessments, litigation, fines and penalties and other sources are recorded when it is probable that a liability has been incurred and the amount of the assessment can be reasonably estimated.
Recently issued accounting standards
The Company does not believe that the adoption of any recently issued, but not yet effective, accounting standards will have a material effect on its financial position and results of operations.
Reclassifications
No reclassifications have been made to the financial statements.
3. 8% CONVERTIBLE DEBENTURES AND DERIVATIVE FINANCIAL INSTRUMENTS
Original financing:
On April 10, 2006, the Company issued 8% Convertible Debentures (the “Debentures”) with a principal (“face”) value of $2,500,000, along with 7,500,000 detachable Stock Warrants (the “Warrants”) to several investors. The gross proceeds of this transaction were $2,500,000, consisting of $2,080,000 cash, $151,000 from the cancellation of debt incurred in 2005, $19,000 from the cancellation of debt incurred earlier in 2006 and $250,000 applied as finders’ fees. Interest on the Debentures was due semiannually at 8% per annum beginning December 31, 2006. Interest was also due upon conversion, redemption and maturity. The total interest paid in cash to two Debenture holders prior to April 10, 2009 was $16,982. Another Debenture holder converted its accrued interest to shares of common stock in 2009. The original Debentures matured on April 10, 2009, but were not paid on that date. As a result, the Debentures were in default; however, the Company has renegotiated the terms of the Debentures, as described below.
F-9
The investors also received 7,500,000 Warrants, 2,500,000 of Class A Warrants and 5,000,000 of Class B Warrants as part of the original sale of the Debentures. Each Class A Warrant gives the holder the right to buy one share of the Company’s common stock, par value $0.001 per share (the “Common Stock”), for $0.75. Class A Warrants to purchase 2,123,800 shares of Common Stock remain outstanding and are exercisable at any time through April 10, 2011. Class B Warrants were replaced with new Class B Warrants as described below.
Renegotiation and exchange of Debentures:
The Company has renegotiated the terms of the Debentures, either by extending the maturity date of the Debentures or by exchanging the Debentures for a new series of preferred stock.
On June 8, 2010, the Company entered into Debenture Amendment and Exchange Agreements with two holders of its Debentures having an aggregate principal amount of $640,000 (the “Option A Holders”), and ten holders of its Debentures having an aggregate principal amount of $805,000 (the “Option B Holders”). Pursuant to the Debenture Amendment and Exchange Agreements, the Option A Holders and the Option B Holders exchanged their Debentures for an amended and restated Debenture due April 10, 2011.
In addition, the Option A Holders and the Option B Holders received an aggregate of 499,099 shares of common stock in lieu of approximately $246,000 of accrued interest through April 10, 2009. The Company also issued (a) new Class B Warrants to the Option A Holders to purchase an aggregate of 1,560,000 shares of the Company’s Common Stock at an exercise price of $1.15 per share, in exchange for their outstanding Class B Warrants, and (b) new Class B Warrants to the Option B Holders to purchase an aggregate of 1,803,200 shares of the Company’s Common Stock at an exercise price of $1.30 per share, in exchange for their outstanding Class B Warrants.
On the same date, the Company entered into Securities Exchange Agreements with 16 holders of its Debentures having an aggregate principal amount of $1,045,000 (the “Option C Holders”) to exchange their Debentures for 2,090,000 shares of Series A 10% Convertible Preferred Stock (the “Series A Preferred Stock”). The Securities Exchange Agreements were signed on June 8, 2010, but the transactions contemplated by those agreements were subject to (i) approval by the Company’s shareholders of an amendment to the Company’s Certificate of Incorporation to authorize it to issue up to 10 million shares of preferred stock in one or more series or classes having such designations, relative rights, preferences, and limitations as may be designated by the Company’s Board of Directors (the “Amendment”), and (ii) subsequent authorization of the Series A Preferred Stock by the Company’s Board of Directors.
On August 3, 2010 the Company held a special meeting of shareholders in which its shareholders approved the Amendment. On the same day, the Company filed a Certificate of Designation setting forth the terms of the Series A Preferred Stock with the New York Secretary of State. The Company subsequently issued to the Option C Holders (a) 2,090,000 shares of Series A Preferred Stock in exchange for the Debentures, and (b) 487,704 shares of its Common Stock in payment of accrued and unpaid interest due under the Debentures through April 10, 2009. The Common Stock was issued at $0.50 per share compared to the fair market value on June 8, 2010 of $0.59 per share. As a result, the conversion generated a beneficial conversion cost. The Option C Holders also received new Class B Warrants to purchase an aggregate of 2,466,200 shares of the Company’s Common Stock at an exercise price of $1.00 per share, in exchange for their outstanding Class B Warrants. The new Class B Warrants vest immediately and expire on April 10, 2013.
The Debenture balances at December 31, 2010 and 2009 were $1,420,000 and $2,604,098, respectively.
Other transactions related to the amendments:
In July 2010, two holders of the Company’s 8% Convertible Debentures due April 10, 2011 (the “Amended Debentures”) converted an aggregate of $15,000 of the principal amount of Amended Debentures into 30,000 shares of Common Stock. Outstanding interest on the converted principal was paid in cash. The Company subsequently provided notice (the “Notice”) to all holders of the Amended Debentures specifying that, unless notified otherwise by the Company, the Company will pay interest due upon the conversion, redemption and maturity of the Amended Debentures with shares of its Common Stock. The Notice also clarified that the aforesaid election includes the accrued and unpaid interest due under the Amended Debentures on June 30, 2009, December 31, 2009, and June 30, 2010.
In October 2010 one holder converted $10,000 of the principal amount of Amended Debentures into 20,000 shares of Common Stock. Outstanding interest on the converted principal was paid in 2,442 shares of common stock.
The Company recorded a loss of $620,788 in the year ended December 31, 2010 in connection with the exchange of certain Debentures for Series A 10% Convertible Preferred Stock.
At December 31, 2010, there were Warrants to purchase 7,953,200 shares of Common Stock outstanding in connection with the sale and amendments of the Debentures.
F-10
The new Class B Warrants issued to the Option A Holders and the Option B Holders were determined to have a value of $1,956,000, as compared to the outstanding Class B Warrants, which were valued at $1,261,000. The new Class B warrants issued to the Option C Holders were determined to have a value of $1,436,000, as compared to the outstanding Class B warrants, which were valued at $906,000. As a result, the Company incurred a debt extinguishment charge in accordance with ASC 470-50, Debt Modification and Extinguishments, and recorded a loss of $1,225,748.
As part of the original sale of the Debentures, $250,000 principal amount of the Debentures were issued along with 125,000 Class A Warrants and 250,000 Class B Warrants as finders’ fees. The finders will also receive as additional fees equal to 5% of any cash collected as on the exercise of any of the Warrants. To date, no Warrants have been exercised.
The shares of Common Stock that underlie the conversion feature of the original Debentures and those that underlie the Warrants were subject to a registration rights agreement. The registration rights agreement provided for liquidated damages if certain requirements were met, which they were not. In connection with the Debenture Exchange and Amendment Agreements, the Debenture holders waived their right to receive liquidated damages and interest thereon due under the registration rights agreement.
The Warrants were classified as derivative financial instruments as a result of the issuance of a registration rights agreement that includes a liquidated damages clause, which is linked to an effective registration of such securities. Accordingly, the Company accounted for the Warrants as liabilities at estimated fair value. In accordance with the Company’s adoption of ASC 815-40, Contracts in Entity’s Own Stock, and ASC 825-20, Accounting for Registration Payment Arrangements, the classification of the warrant liability was changed to stockholders’ equity (additional paid in capital) as of January 1, 2007.
The derivative financial instruments have not been designated as hedges. The purpose of their issuance was to raise additional capital in a more advantageous fashion than could be done without the use of such instruments. In addition to expecting the overall cost of capital to be less, the use of the derivative instruments reduces the cost to the common shareholders when the value of their shares declines in exchange for increasing the cost to the common shareholders when the value of their shares increases, all of which should tend to reduce the volatility of the value of the Company’s common shares.
Effects of the default prior to the amendment:
The Company’s failure to pay the full principal amount of the Debentures on their Maturity Date constituted an “Event of Default” under the Debentures. Upon an Event of Default, the full principal amount of the Debenture, together with interest and other amounts owing in respect thereof, to the maturity date becomes, at the Debenture holder’s election, immediately due and payable in cash. The aggregate amount payable upon an Event of Default is referred to in the Debentures as the “Mandatory Prepayment Amount”, as more fully explained in the Company’s Annual Report on Form 10-K for the year ended December 31, 2009 filed with the Securities and Exchange Commission on April 15, 2010.
During the year ended December 31, 2009 and the three months ended March 31, 2010, the Company recorded charges related to the Mandatory Prepayment Amount of $61,316 and $4,931, respectively. These charges were reversed during the quarter ended June 30, 2010 and September 30, 2010 as the relevant Debentures were modified or exchanged for Series A Preferred Stock.
4. STOCK BASED COMPENSATION
During the year ended December 31, 2010, the Company issued 285,000 shares of common stock to for services rendered as consultants and directors for total compensation of $147,750.
Pursuant to a resolution of the Board of Directors on August 3, 2010, 436,861 shares were issued to management in lieu of deferred compensation of $93,157. The shares were valued at the then market price of $.51 resulting in a gross valuation of the shares issued of $222,799 of which $129,643 was charged to operations as officer compensation.
During the year ended December 31, 2009, the Company issued 70,000 shares of Common Stock for services rendered as follows: 10,000 shares to directors valued at $.75 per share ($7,500); 10,000 shares to directors valued at $.25 per share ($2,500) and; 50,000 to investor relations firms, valued at $0.75 per share ($37,500). Total share based compensation for 2009 was $47,500.
The Company has adopted the CYBRA Corporation 2006 Incentive Stock Plan, a stock-based compensation plan to reward services rendered by officers, directors, employees and consultants. The Company has reserved 5,000,000 shares of Common Stock for issuance under the plan.
The Company recognizes share-based compensation expense for all service-based awards with graded vesting schedules on a straight-line basis over the requisite service period for the entire award. Initial accruals of compensation expense are based on the estimated number of shares for which requisite service is expected to be rendered. Estimates are revised if subsequent information indicates that forfeitures will differ from previous estimates, and the cumulative effect on compensation cost of a change in the estimated forfeitures is recognized in the period of the change.
F-11
Total stock options outstanding at December 31, 2010 were 100,000, all of which were vested.
Stock option transactions to the employees, directors, and consultants are summarized as follows:
|
Stock Options Outstanding
|
||||
|
Outstanding at January 1, 2009
|
100,000
|
|||
|
Granted
|
0
|
|||
|
Exercised
|
0
|
|||
|
Outstanding at December 31, 2009
|
100,000
|
|||
|
Options exercisable at December 31, 2009
|
100,000
|
|||
|
Options outstanding at January 1, 2010
|
100,000
|
|||
|
Granted
|
0
|
|||
|
Exercised
|
0
|
|||
|
Outstanding at December 31, 2010
|
100,000
|
|||
|
Options exercisable at December 31, 2010
|
100,000
|
|||
The 100,000 options outstanding at December 31, 2010 were issued in December 2007, have a remaining outstanding life of 1 year and have an exercise price of $0.75 per share.
F-12
Following is a summary of the warrant activity:
|
Weighted Avg Remaining
|
||||||||||||
|
Class A and B Warrants
|
Number of Shares
|
Avergage Exercise
Price per Share |
Contractual Term
In Years
|
|||||||||
|
Outstanding at December 31, 2009 – Class A
|
3,523,668 | 1.42 | 3.00 | |||||||||
|
Outstanding at December 31, 2009 – Class B
|
7,047,335 | 1.42 | 3.00 | |||||||||
|
Total Outstanding Warrants – December 31, 2009
|
10,571,003 | 1.42 | 3.00 | |||||||||
|
Exercisable at December 31, 2009
|
10,571,003 | 1.42 | 3.00 | |||||||||
|
Exchange of Class B warrants
|
(2,910,000 | ) | ||||||||||
|
Granted-Class B-6/16/10
|
3,363,200 | 1.23 | 2.25 | |||||||||
|
Exchange of Class B warrants
|
(2,090,000 | ) | ||||||||||
|
Granted-Class B-8/3/10
|
2,466,200 | 1.00 | 2.75 | |||||||||
|
Exercised
|
- | |||||||||||
|
Forfeited
|
- | |||||||||||
|
Outstanding at December 31, 2010 – Class A
|
3,523,669 | 0.75 | 1.20 | |||||||||
|
Outstanding at December 31, 2010 – Class B
|
7,876,735 | 1.29 | 2.46 | |||||||||
|
Total Outstanding Warrants – December 31, 2010
|
11,400,404 | 1.13 | 2.07 | |||||||||
|
Exercisable at December 31, 2010
|
11,400,404 | 1.13 | 2.07 | |||||||||
5. PROPERTY AND EQUIPMENT
At December 31, 2010 and December 31, 2009, property and equipment consisted of the following:
|
December 31,
|
December 31,
|
Estimated
Useful Life in
|
|||||||
|
2010
|
2009
|
Years
|
|||||||
|
Furniture and office equipment
|
$
|
198,787
|
$
|
186,869
|
5
|
||||
|
Computer software
|
112,182
|
109,244
|
3
|
||||||
|
Leasehold Improvements
|
21,294
|
21,294
|
Life of Lease
|
||||||
|
332,263
|
317,407
|
||||||||
|
Less: Accumulated Depreciation
|
281,017
|
263,425
|
|||||||
|
$
|
51,246
|
$
|
53,982
|
||||||
Depreciation and amortization of property and equipment amounted to $17,592 and $26,239 for the years ended December 31, 2010 and 2009, respectively.
|
December 31,
|
December 31,
|
Estimated
Useful Life in
|
||||||||||
|
2010
|
2009
|
Years
|
||||||||||
|
Software Development Costs
|
$
|
678,700
|
$
|
677,200
|
3
|
|||||||
|
Less: Accumulated Amortization
|
576,032
|
349,862
|
||||||||||
|
$
|
102,668
|
$
|
327,338
|
|||||||||
F-13
The Company’s policy is to capitalize software development costs in accordance with ASC 985.730 (See Note 2, Summary of Significant Accounting Policies). Amortization of Software Development Costs amounted to $226,171 $225,733 for the years ended December 31, 2010 and 2009, respectively and is included within Selling, General and Administrative Expenses.
6. INCOME TAXES
The Company has the following deferred tax assets and liabilities at December 31, 2010 and 2009:
|
December 31,
|
December 31,
|
|||||||
|
2010
|
2009
|
|||||||
|
Current assets and liabilities:
|
||||||||
|
Accounts receivable
|
$
|
(92,000
|
)
|
$
|
(71,000
|
)
|
||
|
Accounts payable and accrued expenses
|
57,000
|
86,000
|
||||||
|
Deferred revenues
|
168,000
|
149,000
|
||||||
|
133,000
|
164,000
|
|||||||
|
Valuation allowance
|
( 133,000
|
)
|
(164,000
|
)
|
||||
|
Net current deferred tax asset
|
$
|
-
|
$
|
-
|
||||
|
Noncurrent assets and liabilities:
|
||||||||
|
Net operating loss carryforwards
|
$
|
2,487,000
|
$
|
2,370,000
|
||||
|
Depreciation
|
(18,000
|
)
|
(68,000
|
)
|
||||
|
2, 469,000
|
2,302,000
|
|||||||
|
Valuation allowance
|
(2,469,000
|
)
|
(2,302,000
|
)
|
||||
|
Net deferred tax asset
|
$
|
-
|
$
|
-
|
||||
The valuation allowance for the deferred tax asset increased by $ 136,000 for the year ended December 31, 2010.
The Company has net operating losses amounting to approximately $ 6,140,000 that expire in various periods from 2024 through 2030. The ultimate realization of the net operating losses is dependent upon future taxable income, if any, of the Company and may be limited in any one period by alternative minimum tax rules. Although management believes that the Company will have sufficient future taxable income to absorb the net operating loss carryovers before the expiration of the carryover period, the current global economic crisis imposes additional profitability risks that are beyond the Company’s control. Accordingly, management has determined that a full valuation allowance of the deferred tax asset is appropriate at this time.
Internal Revenue Code Section 382 imposes limitations on the use of net operating loss carryovers when the stock ownership of one or more 5% shareholders (shareholders owning 5% or more of the Company’s outstanding capital stock) has increased by more than 50 percentage points. Management intends to carefully monitor share ownership of 5% shareholders but cannot control the ownership changes occurring as a result of public trading of the Company’s Common Stock. Accordingly, there is a risk of an ownership change beyond the control of the Company that could trigger a limitation of the use of the loss carryover.
The Company has no uncertain income tax positions.
The tax years ended December 31, 2008 through 2010 are periods open for examination and federal and state taxing authorities.
The statutory Federal income tax rate and the effective rate are reconciled as follows:
F-14
|
Year Ended December 31,
|
||||||||
|
2010
|
2009
|
|||||||
|
Statutory Federal income tax rate
|
34 | % | 34 | % | ||||
|
State taxes, net of Federal tax benefit
|
5 | % | 5 | % | ||||
|
Valuation allowance
|
-39 | % | -39 | % | ||||
| 0 | % | 0 | % | |||||
7. PREFERRED STOCK
The Company is authorized to issue up to 10,000,000 shares of preferred stock in one or more series or classes having such designations, relative rights, preferences, and limitations as may be designated by the Board of Directors. There are 2,090,000 shares of Series A 10% Convertible Preferred shares currently outstanding which are convertible into 2,090,000 shares of common stock, all issued in connection with the renegotiation and exchange of debentures as described in Note 3.
8. COMMITMENTS, CONTINGENCIES AND OTHER COMMENTS
a. Operating lease
The Company occupies office space in Yonkers, New York under a lease agreement that was amended effective December 30, 2009 and expires on January 31, 2014.
The Company also rents space in West Seneca, New York, near Buffalo. This lease expires on May 31, 2012 as extended on April 5, 2010.
The minimum rental commitment for both properties is as follows:
|
2011
|
$
|
71,250
|
||
|
2012
|
83,785
|
|||
|
2013
|
83,308
|
|||
|
2014
|
6,313
|
|||
|
2015
|
-0-
|
|||
|
$
|
244,656
|
Rent expense amounted to $69,820 and $85,755 for the years ended December 31, 2010 and 2009, respectively. This includes additional expense for storage.
b. Line of Credit
The Company has an $115,000 credit line available through its bank. No money was drawn from this line of credit in 2009. In 2010 $52,000 was drawn and repaid before year end. In the event of borrowing, the repayment period is 36 months. The line of credit is personally guaranteed by Harold Brand, Chairman and Chief Executive Officer and majority shareholder of the Company.
F-15
c. Litigation
In December, 2006, Raz-Lee Security Ltd. (“Raz-Lee”), a former distributor of the Company's products, filed a lawsuit in Herzliya, Israel (Case No. 8443/06) against the Company and its Chief Executive Officer for moneys allegedly owed in connection with the distribution of the Company's products in Israel. The action sought $50,000 in damages, plus interest, court costs and attorneys' fees. The Company filed a counterclaim against Raz-Lee for failure to report sales and royalties, and for a full accounting. The suit against the Company's CEO was dismissed, and appeal of such dismissal was filed. In July, 2009, the Herzliya court awarded Raz-Lee approximately $15,750 plus approximately $7,500 of costs (the approximations are a result of currency fluctuations). The balance of Raz-Lee's claim was dismissed. Since the amount awarded relates to past periods, the court also awarded interest charges, bringing the total award including costs to approximately $34,500. Raz-Lee collected the amount of approximately $6,500 which had been posted by the Company with the Herzliya court. The balance has not been paid. The Company's counterclaim against Raz-Lee was dismissed. The Company believes that Raz-Lee will file an appeal of the dismissal of parts of its claim. The Company is currently consulting with counsel concerning the filing of an appeal of the dismissal of the counterclaim or a part thereof. In addition, Raz-Lee has asserted that Harold Brand, Chief Executive Officer of the Company, is personally liable for the Company’s obligation. This claim was dismissed, but was returned to the Magistrate's Court on appeal.
In June, 2009, the Herzliya, Israel Magistrate’s Court issued a judgment in favor of Raz-Lee Security Ltd. (“Raz-Lee”), a former distributor of the Company's products in the amount of US$ 26,944 plus interest at the rate of LIBOR plus 1%, and an additional amount of 25,000 New Israel Shekels in costs. This judgment represented approximately ¼ of the amount that had been claimed by Raz-Lee.
The Company has to date paid 23,000 New Israel Shekels on account of the costs, leaving a balance of 2,000 New Israel Shekels (app. US$ 550). The Company has also paid the amount of US$ 6,688 on account of the judgment, leaving a balance of approximately US$ 21,000 (the original amount plus interest less the payment).
On February 15, 2011, Raz-Lee instituted proceedings in the Supreme Court of the State of New York, County of Westchester, Index No. 4763/11, for enforcement of the foreign judgment. In its pleading, Raz-Lee incorrectly states the balance due. Raz-Lee also seeks costs and disbursements.
The Company has included the liability for the balance in accrued expenses.
d. Joint Venture
On July 27, 2009, the Company entered into an agreement that outlines the intent to form a joint venture in the People’s Republic of China with two other companies. The purpose of this joint venture is to develop and sell leading edge products and services that add intelligence to shipping products to track and monitor goods throughout the supply chain.
The agreement provides for a capital contribution by the Company to the joint venture of $2,500,000 payable in four installments over eighteen months. The Company is under no obligation to make these capital contributions unless and until the parties enter into a binding, definitive joint venture agreement. The Company will require additional financing in the form of debt and/or equity to participate in the joint venture and make the required contributions. Both the agreement and the subsequent binding, definitive joint venture agreement will be governed by the law of the People’s Republic of China.
On June 12, 2009, the Company entered into a non-exclusive one-year agreement with an investment banker to raise the capital necessary to fund the joint venture. The investment banker will receive a fee of 5% of the transaction proceeds. The agreement expired on December 21, 2009 and has been extended by the parties until December 31, 2010.
e. Loans from shareholders
During the year ended December 31, 2010, the Company received $35,000 from its Chief Executive Officer and $12,500 from another stockholder (totaling $47,500) as advance payment toward the planned issuance of common stock and other securities in a planned private placement. The Company is currently legally obligated to return the funds received on demand of the investors if the contemplated private placement is not completed.
F-16
9. PROFIT SHARING PLAN
The Company has a qualified 401(k) profit sharing plan covering all eligible employees. The plan provides for contributions by the Company in such amounts as the Board of Directors may annually determine but subject to statutory limitations.
No contributions to the plan by the Company have been provided for either period ended December 31, 2010 or 2009.
10. RELATED PARTY TRANSACTIONS
a. Executive Employment Contract
Effective April 30, 2006, the Company entered into a five-year Employment Agreement with Mr. Brand, with a base salary set at $180,000 per annum. In addition to this salary, Mr. Brand is entitled to incentive compensation an amount equal to two percent (2%) of annual gross sales of the Company on sales in excess of one million dollars ($1,000,000). The compensation Mr. Brand earned was $11,349 and $5,326 for 2010 and 2009. Mr. Brand is also entitled to standard benefits: four weeks of paid vacation, accident and health insurance, sick leave benefits, holidays and personal days, personal expenses reimbursement, life insurance, disability insurance and the use of a corporate car. Unpaid incentive compensation is included in accrued expenses on the balance sheet.
Starting in 2008, the executive officers of the Company deferred part of their salaries and commissions. As of the third quarter of 2010, the total deferred compensation totaled $286,861. In August 2010, the Board resolved to issue 436,861 shares of Common Stock in partial payment of deferred compensation of $93,157. As of the most recent trading date before the resolution of the Board, the market value per share was $.51 resulting in an aggregate value of $222,799 for the 436,861 shares issued. The difference between the amount attributed to the deferred compensation of $93,157 and the value of the shares issued was $129,642 and was charged to operations for the year ended December 31, 2010.
Starting in 2008, the executive officers of the Company deferred part of their salaries and commissions. As of the third quarter of 2010, the total deferred compensation totaled $286,861. In December 2010, the Board voted to compensate the officers for some of the deferred compensation in common stock. The total amount of deferred salaries paid in common stock was $$73,150. The total shares issued were $436,861 at $.51 a share for a total value of $222,799.
Profit Horizon, Inc.
Profit Horizon, Inc., a company controlled by Robert J. Roskow, Executive Vice President and a Director of the Company, provides sales consulting services. During the years ended December 31, 2010 and 2009, the Company incurred approximately $34,000 and $30,000 respectively in commissions to Profit Horizon, Inc.
F-17
11. FAIR VALUE OF FINANCIAL INSTRUMENTS
The Company’s financial instruments consisted of the following:
|
December 31,
2010
|
December 31,
2009
|
|||||||
|
8% Convertible Debentures
|
$
|
1,420,000
|
$
|
2,604,098
|
||||
12. LOSS PER SHARE
Loss per share for the period ended December 31, 2010 and 2009 does not include the effects of 11,400,404 Warrants, 2,090,000 shares of Series A 10% Convertible Preferred Stock, options to acquire 100,000 shares of common stock held by employees, directors and consultants, or the 2,860,000 shares into which the 8% Convertible Debentures are convertible because the effects would be anti-dilutive.
13. SUBSEQUENT EVENTS
The Company evaluated events occurring between the end of the fourth quarter, December 31, 2010, and March 31, 2011 when the financial statements were issued.
F-18
Item 9. CHANGES IN AND DISGAREEMENTS WITH ACCOUNTANTS ON ACCOUNTING AND FINANCIAL DISCLOSURE
None.
Item 9A(T). CONTROLS AND PROCEDURES.
Disclosure Controls and Procedures.
As required by Rule 13a-15 under the Securities Exchange Act of 1934 (the “Exchange Act”), we carried out an evaluation of the effectiveness of the design and operation of our disclosure controls and procedures, as of the end of the period covered by this report on Form 10-K. This evaluation was carried out under the supervision and with the participation of our management, including our President and Chief Executive Officer and our interim Chief Financial Officer. Based upon that evaluation, management concluded that our disclosure controls and procedures are effective to ensure that information required to be disclosed in the reports that it files or submits under the Exchange Act is accumulated and communicated to management (including the chief executive officer and chief financial officer) to allow timely decisions regarding required disclosure and that our disclosure controls and procedures are effective to give reasonable assurance that the information required to be disclosed by us in reports that we file under the Exchange Act is recorded, processed, summarized and reported within the time periods specified in the rules and forms of the SEC.
Management’s Annual Report on Internal Control Over Financial Reporting
Our management is responsible for establishing and maintaining adequate internal control over financial reporting, as defined in Exchange Act Rule 13a-15(f). Our internal control over financial reporting is designed to provide reasonable assurance regarding the reliability of financial reporting and the preparation of financial statements for external purposes in accordance with accounting principles generally accepted in the United States of America (“GAAP”).
Under the supervision and with the participation of our management, including our Chief Executive Officer, we conducted an evaluation of the effectiveness of our internal control over financial reporting based on the framework established by the Committee of Sponsoring Organizations of the Treadway Commission (COSO) as set forth in Internal Control – Integrated Framework. As a result of that evaluation, management identified the following control deficiencies as of December 31, 2010 that constituted material weaknesses:
28
• Control environment — We did not maintain an effective control environment. Specifically, we did not maintain a sufficient complement of personnel with an appropriate level of accounting knowledge, experience, and training in the application of GAAP commensurate with our financial reporting requirements and business environment.
• Period-end financial reporting process — We did not maintain effective controls over the period-end reporting process, including controls with respect to the review, supervision, and monitoring of accounting operations.
Based on management’s evaluation, because of the material weaknesses described above, management has concluded that our internal control over financial reporting was not effective as of December 31, 2010. We are planning to implement changes in the second quarter of 2011 to remedy these weaknesses, including engaging the services of a financial reporting consultant to regularly monitor accounting operations.
This annual report does not include an attestation report of our registered public accounting firm regarding our internal control over financial reporting. Our management’s report was not subject to attestation by our registered public accounting firm pursuant to newly-enacted permanent rules of the SEC that permit us to provide only management’s report in this annual report.
Changes in Internal Control Over Financial Reporting
There were no changes in our internal control over financial reporting identified in connection with the evaluation performed that occurred during our last fiscal quarter ended December 31, 2010 that have materially affected, or are reasonably likely to materially affect, our internal control over financial reporting.
Item 9B. OTHER INFORMATION.
None.
29
ITEM 10. DIRECTORS, EXECUTIVE OFFICERS AND CORPORATE GOVERNANACE.
Set forth below are the present directors and executive officers of the Company. There are no arrangements or understandings between any of the directors, officers and other persons pursuant to which such person was selected as a director or an officer, except that Jonathan Rubin and Matt Rothman were chosen by the purchasers of Debentures to serve as directors, as described below in Item 13. Directors are elected to serve until the next annual meeting of shareholders and until their successors have been elected and have qualified. Officers serve at the pleasure of the Board of Directors and may be terminated at any time at will.
Directors
|
Age
|
Present Position and Offices
|
Term of Office
|
||||
|
Harold Brand
|
60
|
Chairman of the Board, Chief Executive Officer and Interim Chief Financial Officer
|
Since 1985
|
|||
|
Sheldon Reich
|
53
|
Vice President Solutions and Director
|
Since 1990
|
|||
|
Robert J. Roskow
|
67
|
Executive Vice President and Director
|
Since 1995
|
|||
|
Jonathan Rubin
|
40
|
Director
|
Since 2007
|
|||
|
Matt Rothman
|
32
|
Director
|
Since 2007
|
Set forth below are brief accounts of the business experience during the past five years of each director of the Company.
Harold Brand is a founder of CYBRA and has been its Chairman of the Board and Chief Executive Office since 1985. Mr. Brand has been the Company’s Interim Chief Financial Officer since 2006. He is responsible for managing the Company’s operations, monitoring its performance, and planning and overseeing R&D projects. Mr. Brand developed much of CYBRA’s proprietary technology. Prior to founding CYBRA, Mr. Brand was the Vice President of Personnel Systems at Manufacturers Hanover Trust Company (currently JP Morgan Chase Bank), a New York City money center bank, where he managed a multimillion dollar annual budget and a staff of 25 professionals. A highly rated speaker at IBM technical conferences, Mr. Brand holds a Masters of Science degree in Computer Science from Rutgers University in New Brunswick, New Jersey. We have determined that since he has been involved with the development of our business since its inception, Mr. Brand is well suited to serve as a director of CYBRA.
Sheldon Reich has been Vice President of Marketing and a Director of the Company since 1990. His title was recently changed to Vice President Solutions to more accurately reflect his role in the Company. He has expertise in the creative application of Auto ID technology. In April 2004, Mr. Reich was selected by IBM to help design their infrastructure solution for enabling RFID wireless inventory systems. Prior to joining CYBRA, Mr. Reich held the position of Copy Director at Bantam Doubleday Dell publishing. He developed business-to-business marketing programs for such clients as: NYNEX, AT&T Microelectronics, and Philips Information Systems. A frequent speaker at industry conferences and user group meetings, Mr. Reich, holds a Bachelor of Arts degree in Linguistics from the State University of New York at Stony Brook. We have determined that Mr. Reich’s industry experience in RFID technology and his understanding of the market makes him well suited to serve as a director of CYBRA.
Robert J. Roskow joined CYBRA in 1994 in the capacity of Vice President of Sales and a Director. His participation has recently transitioned to that of a sales advisory role, along with a change in title to Executive Vice President. Bob is also founder of Profit Horizons, Inc., a sales consultancy. He brings to CYBRA more than 30 years of high technology marketing experience with the IBM Corporation. Mr. Roskow’s marketing achievements with IBM were rewarded with membership in 17 100% clubs and three Golden Circles, which signified reaching the top 3% of sales professionals in the company. One of the chief architects of IBM’s Business Partner Program, Mr. Roskow has consulted to more than 50 IBM Business Partners with annual revenues ranging from $200,000 to $50 million. Bob was a New Business Executive with IBM for the four years prior to his retiring in 1992. We have determined that Mr. Roskow’s technology marketing experience makes him well suited to serve as a director of CYBRA.
30
Jonathan Rubin is an experienced small businessman, having run his own businesses for the past ten years. Mr. Rubin is a partner in the Imperial Real Estate Agency, which is one of the most prominent firms in Lakewood, New Jersey. He is a seasoned real estate professional, with extensive experience in numerous areas of the real estate field, including management, brokerage, title and finance. Mr. Rubin is active in the Lakewood, community, where he manages a free loan society, and sits on the Township Rent Control Board, the Board of Congregation Ohr Meir and other community organizations. We have determined that Mr. Rubin’s experience as an owner of small businesses makes him well suited to serve as a director of CYBRA.
Matt Rothman is the owner of MorFra Designs, a wholesale jewelry company supplying retailers and catalog companies throughout the U.S. MorFra specializes in cubic zirconia silver jewelry. Prior to the formation of MorFra in 2003, Mr. Rothman was for one year, vice president - sales at Designs by FMC, Inc., a manufacturer and distributor of gold and silver jewelry, selling to large retail chains, through catalogues and various cable television channels. Mr. Rothman also serves as a consultant to Global Equities, a real estate investment company with interests in residential and commercial real estate. We have determined that Mr. Rothman’s experience as an owner of small businesses, as well as his experience with sales for a manufacturing company, makes him well suited to serve as a director of CYBRA.
Officers
In addition to Harold Brand, Sheldon Reich and Robert J. Roskow, the following person also serves as an officer of the Company:
|
Name
|
Age
|
Present Position and Offices
|
Term of Office
|
|||
|
Charles M. Roskow
|
39
|
Vice President of Operations
|
Since 2006
|
Charles M. Roskow heads CYBRA’s West Seneca, New York branch office and is chiefly responsible for pre-sales and post-sales support of CYBRA Corporation’s software products. He joined the Company in 1994 as an Account Manager and served as Customer Support Manager from 1997 to 2005, when he became Branch Manager. Acting in a sales engineering capacity, Mr. Roskow is CYBRA’s OEM customers’ primary point of contact and manages the end user support effort. Previously, as a CYBRA marketing representative, Mr. Roskow tripled sales in his territory. Before joining CYBRA, he was the owner and proprietor of Just Belts, a martial art belt manufacturer, which he built from a standing start to profitability and sale to new owners in 18 months. Mr. Roskow holds a Bachelor of Science degree in Business Administration from the State University of New York College at Fredonia.
Matt Rothman is the son of Samuel Rothman, an investor in the Company and an investor and control person of Global Equities. Robert J. Roskow is Charles M. Roskow’s father. None of the other directors or officers is related to any other director or officer of the Company.
No officer or director has, during the past ten years, been involved in (a) any bankruptcy petition filed by or against any business of which such person was a general partner or executive officer either at the time of the bankruptcy or within two years prior to that time; (b) any conviction in a criminal proceeding or being subject to a pending criminal proceeding (excluding traffic violations and other minor offenses); (c) any order, judgment, or decree, not subsequently reversed, suspended or vacated, of any court of competent jurisdiction, permanently or temporarily enjoining, barring, suspending or otherwise limiting his involvement in any type of business, securities or banking activities; (d) a finding by a court of competent jurisdiction (in a civil action), the Commission or the Commodity Futures Trading Commission to have violated a federal or state securities or commodities law, and the judgment has not been reversed, suspended, or vacated; (e) any federal or state judicial or administrative order, judgment, decree or finding, not subsequently reversed, suspended or vacated, relating to an alleged violation of (i) any federal or state securities or common law or regulation; (ii) any law or regulation respecting financial institutions or insurance companies including, but not limited to, a temporary or permanent injunction, order of disgorgement or restitution, civil money penalty or temporary or permanent cease-and-desist order, or removal or prohibition order; or (iii) any law or regulation prohibiting mail or wire fraud or fraud in connection with any business entity; or (f) any sanction or order, not subsequently reversed, suspended or vacated, of any self-regulatory organization, any registered entity, or any equivalent exchange, association, entity or organization that has disciplinary authority over its members or persons associated with a member.
31
Section 16(a) Beneficial Ownership Reporting Compliance
Section 16(a) of the Exchange Act requires our executive officers and directors, and persons who own more than 10% of a registered class of our equity securities to file reports of ownership and changes in ownership with the SEC. SEC regulations also require us to identify in this annual report any person subject to this requirement who failed to file any such report on a timely basis.
Based on our records and other information available to us, we believe that, in 2010, all Section 16(a) filing requirements were satisfied.
Code of Ethics
Due to the early stage nature of the business of CYBRA, it does not have a Code of Ethics.
Audit Committee
Due to the early stage nature of the business of CYBRA, it does not have an audit committee, nor has its board of directors deemed it necessary to have an audit committee financial expert. CYBRA expects to have several committees in place, including a compensation, budget and audit committee. At such time, CYBRA Corporation intends to have a member of the Board of Directors that meets the qualifications for an audit committee financial expert.
ITEM 11. EXECUTIVE COMPENSATION
The following table sets forth all the compensation earned by Mr. Harold Brand who is serving as the Chief Executive Officer (Principal Executive Officer) and Interim Chief Financial Officer (Principal Financial Officer), Sheldon Reich, the Vice President of Marketing, and Chuck Roskow, Vice President of Operations, for the last two completed fiscal years. The Company had no other executive officers whose aggregate compensation was in excess of $100,000 during the aforementioned fiscal years.
SUMMARY COMPENSATION TABLE
|
Name and Principal Position
|
Year
|
Salary
|
Compensation
|
Total
|
|||||||||
|
Harold Brand, Chariman, Chief Executive Officer
|
2010
|
$ | 180,000 | $ | 58,094 | $ | 238,094 | 1 | |||||
|
and Interim Chief Financial Officer
|
2009
|
$ | 180,000 | $ | 5,326 | $ | 185,326 | 2 | |||||
|
Sheldon Reich, Vice President
|
2010
|
$ | 103,740 | 31,283 | $ | 135,023 | 3 | ||||||
|
of Marketing
|
2009
|
$ | 103,740 | $ | 3,751 | $ | 107,491 | 4 | |||||
|
Chuck Roskow, Vice President of Operations
|
2010
|
$ | 78,520 | $ | 21,729 | $ | 100,249 | 5 | |||||
|
2009
|
$ | 78,520 | $ | 1,165 | $ | 79,685 | 6 | ||||||
|
1
|
This amount includes $18,692 of salary and $11,349 of commissions that were voluntarily deferred by Mr. Brand as well as additional compensation of $46,745 paid in the form of restricted common stock. Does not include $36,692 representing the value of common stock in partial payment of previously accrued deferred salaries.
|
|
2
|
This amount includes $45,000 of salary and $5,326 of commissions that were voluntarily deferred by Mr. Brand.
|
|
3
|
This amount includes $10,773 of salary and $5,217 of commissions that were voluntarily deferred by Mr. Reich as well as additional compensation of $26,066 paid in the form of restricted common stock. Does not include $18,838 representing the value of common stock in partial payment of previously accrued deferred salaries.
|
|
4
|
This amount includes $25,935 of salary and $3,751 of commissions that were voluntarily deferred by Mr. Reich.
|
|
5
|
This amount includes $8,154 of salary and $2,937 of commissions that were voluntarily deferred by Mr. Roskow as well as additional compensation of $18,792 paid in the form of restricted common stock. Does not include $13,595 representing the value of common stock in partial payment of previously accrued deferred salaries.
|
|
6
|
This amount includes $19,630 of salary and $1,165 of commissions that were voluntarily deferred by Mr. Roskow.
|
32
Effective April 30, 2006, the Company entered into a five-year Employment Agreement with Mr. Brand, with base salary set at $180,000 per annum. In addition to this salary, Mr. Brand is entitled to incentive compensation an amount equal to two percent (2%) of annual gross sales of the Company on sales in excess of one million dollars ($1,000,000). In addition, Mr. Brand is entitled to standard benefits: four weeks of paid vacation, accident and health insurance, sick leave benefits, holidays and personal days, personal expenses reimbursement, life insurance, disability insurance and the use of a corporate car.
Director Compensation
Inside directors are not compensated in their roles as directors. They are reimbursed, however, for reasonable expenses incurred on behalf of the Company. Outside Director compensation is $7,500 per year, plus expenses, for up to four regular meetings per year and an unspecified number of special meetings. For any additional in person meetings, compensation is $750 per meeting. In 2010, Messrs. Rubin and Rothman each received 10,000 shares of common stock and $3,750 in cash for services rendered as a director in 2010.
CYBRA Corporation’s Advisory Board consists of executive officers, as well as two outside advisors.
Arthur Hershaft, the former Chairman of Paxar Corporation, grew Paxar from $2 million in 1959 to over $800 million in 2007. He served as Paxar’s Chairman of the Board since 1986 and as Chief Executive Officer from 1980 through August 2001, resuming that position from May 2003 through late April 2005. In June 2007, Paxar was acquired by Avery Dennison for $1.34 billion. Mr. Hershaft is one of the pioneers of the labeling industry. Shortly after graduating from Carnegie Mellon Institute in Pittsburgh with a degree in engineering, Mr. Hershaft went into his father's business. Together they developed the first non-woven label to be compatible with permanent-press fabric. Under Arthur Hershaft’s stewardship, Paxar Corporation became a global leader in providing innovative merchandising systems for the retail and apparel industry. As part of the Avery Dennison Retail Information Services Group, Paxar designs and manufactures tickets, tags and labels, and provides the technology-including the printers, software control systems and necessary supplies-for retail product identification. Customers include the world's major retailers, branded apparel companies and contract manufacturers.
Dr. Shlomo Kalish, a CYBRA founder, is an Israel-based technology investor. In January 2007, Dr. Kalish made the 39th slot in Forbes’ Midals List of top dealmakers in the world, and first among Israeli dealmakers. In 1994, Dr. Kalish founded The Jerusalem Global Group, a technology focused investment house, and in 1999 he founded Jerusalem Global Ventures, a venture capital firm managing $120M. Jerusalem Global Ventures invests in seed and early-stage communications, information technology and life sciences companies. From 1997 to 1999, Dr. Kalish served as a General Partner of Concord (K.T.) Ventures I, LP, a leading Israeli venture capital fund, where he was responsible for the investments in Oridion Medical and Oren Semiconductors. Dr. Kalish frequently appears in the media and has been featured on the cover of Upside Magazine. He has also been cited in The Wall Street Journal, Dow Jones, Business Week and other business publications. Dr. Kalish holds a Ph.D. in Operations Research from MIT, a M.Sc. from the Sloan School of Management at MIT and a B.Sc. from Tel Aviv University. From 1970 to 1975 Dr. Kalish served in the Israeli Air Force as a fighter pilot. Dr. Kalish is active on the boards of many non-profit organizations and academic institutions, including Shalom Beineinu, a charitable organization of which he is Chairman; the Board of Governors of Bar Ilan University; the Board of Governors of the Technion and The Jerusalem College of Technology. Dr. Kalish serves on the board of Saifun Semiconductors — selected by Globes, an Israeli business journal, as one of Israel’s most successful startups, Valor Computerized systems, as well as a number of JGV’s portfolio companies.
The Advisory Board meets twice a year, in the fall and spring. Members of the Advisory Board are not compensated but are reimbursed for travel-related expenses.
33
ITEM 12. SECURITY OWNERSHIP OF CERTAIN BENEFICIAL OWNERS AND MANAGEMENT AND RELATED STOCKHOLDER MATTERS
The following table sets forth certain information regarding the beneficial ownership of the Common Stock as of March 17, 2011: (i) each person who is known by CYBRA to own beneficially more than 5% of the outstanding Common Stock; (ii) each of the directors of CYBRA; and (iii) all executive officers and directors of CYBRA as a group. The address of each director and Named Executive Officer listed in the table below is c/o CYBRA Corporation, One Executive Boulevard, Yonkers, NY 10701.
|
Name and Address of
Beneficial Owner
|
Number of
Shares
Beneficially
Owned
|
Percentage of Shares
Beneficially Owned(1)
|
|||
|
Directors and Officers
|
|||||
|
Harold Brand
|
7,596,460
|
48.9%
|
|||
|
Robert Roskow
|
662,968
|
4.3 %
|
|||
|
Sheldon Reich
|
1,031,560
|
(2)
|
6.6%
|
||
|
Charles Roskow
|
339,653
|
2.2%
|
|||
|
Matt Rothman
|
20,500
|
*
|
|||
|
Jonathan Rubin
|
20,000
|
*
|
|||
|
All Officers and Directors as a Group (6 persons)
|
9,671,141
|
(3)
|
62.3%
|
||
|
Beneficial Owners of More Than 5%
|
|||||
|
Sam Rothman
c/o ABC, Inc.
149 Burd Street
Nyack, NY 10960
|
1,600,833
|
(4)
|
10.3%
|
||
|
Sholom Chaim Babad
c/o ABC, Inc.
149 Burd Street
Nyack, NY 10960
|
1,080,000
|
(5)
|
6.9%
|
||
|
*
|
Less than 1%.
|
|
(1)
|
Based upon 15,519,667 shares issued and outstanding as at March 30, 2011.
|
|
(2)
|
Includes 200,000 shares issuable to Mr. Reich’s wife upon conversion of 8% Convertible Debentures, 100,000 shares issuable to his wife upon exercise of Class A warrants, and 200,000 shares issuable upon exercise of Class B warrants. Mr. Reich disclaims beneficial ownership of all such shares. Does not include shares of Common Stock that may be issued upon payment of accrued and unpaid interest of the 8% Convertible Debentures.
|
|
(3)
|
Includes 200,000 shares issuable upon conversion of 8% Convertible Debentures, 100,000 shares issuable upon exercise of Class A warrants that are presently exercisable, and 200,000 shares issuable upon exercise of Class B warrants that are presently exercisable. Does not include shares of Common Stock that may be issued upon payment of accrued.
|
|
(4)
|
Includes 100,000 shares issuable upon conversion of 8% Convertible Debentures, 50,000 shares issuable upon exercise of Class A warrants that are presently exercisable, and 100,000 shares issuable upon exercise of Class B warrants that are presently exercisable. Does not include shares of Common Stock that may be issued upon payment of accrued and unpaid interest of the 8% Convertible Debentures.
|
|
Includes 175,000 shares issuable upon conversion of 8% Convertible Debentures, 87,500 shares issuable upon exercise of Class A warrants that are presently exercisable, and 175,000 shares issuable upon exercise of Class B warrants that are presently exercisable. Does not include shares of Common Stock that may be issued upon payment of accrued and unpaid interest of the 8% Convertible Debentures.
|
34
In 2006, the Company sought to raise capital through a private placement of 8% Convertible Debentures. Two shareholders of the Company, Sholom Chaim Babad and Sam Rothman, acted as finders in the private placement and were paid a 10% fee, which they converted into Debentures and Warrants. They will also be entitled to receive as additional fees equal to 5% of any cash received by the Company upon the exercise of Warrants. In addition, Messrs. Babad and Rothman loaned $151,000 to the Company in 2005, and an additional $19,000 in the first quarter of 2006, the proceeds of which were used to redeem Preferred Stock owned by a third party. This loan, together with interest, was repaid out of the proceeds of the private placement.
The Company agreed, in connection with the private placement, to allow the purchasers of Debentures to appoint two members to its Board of Directors. Jonathan Rubin and Matt Rothman have been chosen by the Purchasers to join the Board of Directors.
The Board of the Company has confirmed, that in accordance with FINRA Rule 4200, only Messrs. Matt Rothman and Jonathan Rubin are deemed Independent Directors.
ITEM 14. PRINCIPAL ACCOUNTING FEES AND SERVICES
The firm of KBL, LLP (“KBL”), our independent registered public accounting firm, has audited our financial statements for the fiscal years ended December 31, 2010 and December 31, 2009. The aggregate fees we paid to KBL for the years ended December 31, 2010 and December 31, 2009 were as follows:
|
KBL, LLP
|
2010
|
2009
|
|
|
Audit Fees
|
$30,000
|
$33,208
|
|
|
Audit-Related Fees
|
-0-
|
-0-
|
|
|
Total Audit and Audit-Related Fees
|
$30,000
|
$33,208
|
|
|
Tax Fees
|
-0-
|
-0-
|
|
|
All Other Fees
|
-0-
|
-0-
|
ITEM 15. EXHIBITS, FINANCIAL STATEMENT SCHEDULE.
See “Index to Exhibits” immediately following the financial statements and notes to financial statements in this Form 10-K for a description of the documents that are filed as Exhibits to this report on Form 10-K or incorporated by reference herein.
35
SIGNATURES
In accordance with Section 13 or 15(d) of the Exchange Act, the registrant caused this report to be signed on its behalf by the undersigned, thereunto duly authorized.
Date: March 31, 2011
|
By:
|
/s/ Harold Brand | ||
| HAROLD BRAND | |||
| Chief Executive Officer |
In accordance with the Exchange Act, this report has been signed below by the following persons in the capacities and on the dates as indicated.
|
Name
|
|
Title
|
Date
|
|
|
/s/ Harold Brand
|
|
Chairman of the Board,
|
March 31, 2011
|
|
|
HAROLD BRAND
|
Chief Executive Officer
(Principal Executive Officer), and
Interim Chief Financial Officer
(Principal Financial and Accounting Officer)
|
|||
|
/s/ Sheldon Reich
|
|
Director
|
March 31, 2011
|
|
|
SHELDON REICH
|
||||
|
/s/ Robert J. Roskow
|
|
Director
|
March 31, 2011
|
|
|
ROBERT J. ROSKOW
|
||||
|
/s/ Jonathan Rubin
|
|
Director
|
March 31, 2011
|
|
|
JONATHAN RUBIN
|
||||
|
/s/ Matt Rothman
|
Director
|
March 31, 2011
|
||
|
MATT ROTHMAN
|
36
|
Certificate of Incorporation+
|
||||
|
3.2
|
Certificate of Designation of Series A Preferred Stock6
|
|||
|
3.3
|
Bylaws1
|
|||
|
4.1
|
Form of Securities Purchase Agreement dated as of April 10, 20061
|
|||
|
4.2
|
Form of Common Class A and B Stock Purchase Warrant dated as of April 10, 20061
|
|||
|
4.3
|
Form of 8% Convertible Debenture issued on April 10, 20061
|
|||
|
4.4
|
Form of Registration Rights Agreement dated as of April 10, 20061
|
|||
|
4.5
|
Form of Common Class A Stock Purchase Warrant issued in connection with private placement4
|
|||
|
4.6
|
Form of Common Class B Stock Purchase Warrant issued in connection with private placement4
|
|||
|
4.7
|
Form of Amended and Restated 8% Convertible Debenture due April 10, 20115
|
|||
|
4.8
|
Form of Class B Stock Purchase Warrant, dated as of April 10, 20065
|
|||
|
4.9
|
Form of Class B Stock Purchase Warrant, dated as of April 10, 20065
|
|||
|
4.10
|
Form of Class B Stock Purchase Warrant, dated as of April 10, 20065
|
|||
|
4.11
|
Form of Debenture Amendment and Exchange Agreement, dated as of April 10, 20095
|
|||
|
4.12
|
Form of Debenture Amendment and Exchange Agreement, dated as of April 10, 20095
|
|||
|
4.13
|
Form of Securities Exchange Agreement, dated as of April 10, 20095
|
|||
|
4.14
|
Form of Waiver and Confirmation by the Option C Holders5
|
|||
|
10.1
|
2006 Incentive Stock Plan1†
|
|||
|
10.2
|
Employment Agreement between Harold Brand and CYBRA dated as of April 30, 20061
|
|||
|
10.3
|
Form of Domestic Reseller Agreement2
|
|||
|
10.4
|
Form of International Reseller Agreement2
|
|||
|
10.5
|
Form of Premier Reseller Software Licensing Agreement between CYBRA Corporation and Solzon Corporation dated as of August 27, 20073
|
|||
|
10.6
|
Form of Technology License Agreement dated as of August 27, 20073
|
|||
|
10.7
|
Form of Contractor Agreement for System Integration and Consulting Services dated as of August 27, 20073
|
|||
|
31.1
|
Section 302 Sarbanes-Oxley Certification – CEO+
|
|||
|
31.2
|
Section 302 Sarbanes-Oxley Certification – CFO+
|
|||
|
32.1
|
Section 906 Sarbanes-Oxley Certification – CEO+
|
|||
|
32.2
|
Section 906 Sarbanes-Oxley Certification – CFO+
|
|||
|
†
|
Compensatory Plan or Arrangement
|
|||
|
1
|
Incorporated herein by reference to the Registrant’s Registration Statement on Form SB-2 filed with the Commission on June 16, 2006, File No. 333-135068.
|
|||
|
2
|
Incorporated herein by reference to the Registrant’s Annual Report on Form 10-KSB filed with the Commission on April 2, 2007.
|
|||
|
3
|
Incorporated herein by reference to the Registrant’s Current Report on Form 8-K filed with the Commission on September 27, 2007.
|
|||
|
4
|
Incorporated herein by reference to the Registrant’s Annual Report on Form 10-K filed with the Commission on April 2, 2009.
|
|||
|
5
|
Incorporated herein by reference to the Registrant’s Current Report on Form 8-K filed with the Commission on August 3, 2010.
|
|||
|
6
|
Incorporated herein by reference to the Registrant’s Current Report on Form 8-K filed with the Commission on August 4, 2010.
|
|||
|
+
|
Filed herewith.
With respect to the Certificate of Incorporation filed as Exhibit 3.1, the Registrant hereby files a “composite” Restated Certificate of Incorporation in accordance with Item 601 of Regulation S-K promulgated by the Commission.
|
|||
37