Attached files
| file | filename |
|---|---|
| 8-K - FORM 8-K - AstroNova, Inc. | form8k.htm |

(NASDAQ: ALOT)
Albert W. Ondis, Founder, Chairman & CEO
Everett V. Pizzuti, President & COO
Joseph P. O’Connell, Senior Vice President & CFO
March 31, 2011

Table of Contents
Page
Forward Looking Statements……………………..………………………………..3
Corporate Profile………..…………………………………………………………4-5
Key Investment Highlights…..…………………………………………………....6-9
Three Year Strategic Plan - Corporate Financial Objectives………………….10
Financials…...……………………………………………………………………11-19
Product Groups
QuickLabel Systems.…………………………………….……………………21-23
Ruggedized Products……………...…………………………………………..24-27
Test & Measurement….…………………………………………..…………...28-29
Grass Technologies……………………………………………………………30-33
Recent Events………………………...………………………………………… 34-36
Expectations…...…………………………………………………………………37-38

3
Certain of the statements contained in this presentation may be
considered forward-looking statements within the meaning of
Section 27A of the Securities Act of 1933, as amended, and
Section 21E of the Securities Act of 1934, as amended. To the
extent that any of the statements contained herein relating to
Astro-Med, Inc. or its products or markets are forward-looking,
such statements are based on management’s assumptions
and/or current expectations that involve a number of
uncertainties and risks. Such uncertainties and risks include, but
are not limited to, those outlined in our Form 10K and other
public filings, which we make from time to time with the
Securities and Exchange Commission.
Forward-Looking Statements
4
Corporate Profile
Astro-Med®, Inc. manufactures systems that acquire, process, analyze,
store, and present data in a variety of useable forms.
store, and present data in a variety of useable forms.
We develop and sell
hardware and software
systems for industrial
test and measurement,
ruggedized airborne printing,
neurophysiological test and
analysis, and labeling and
package identification.
All of our systems include
related consumables.

5
Corporate Profile
Astro-Med products are marketed around the world under four brand
names: Astro-Med® Ruggedized Products, Astro-Med® Test &
Measurement, Grass® Technologies, and QuickLabel® Systems.
names: Astro-Med® Ruggedized Products, Astro-Med® Test &
Measurement, Grass® Technologies, and QuickLabel® Systems.
Our product applications are diverse, and so are our customers. We
make specialty printers that produce high-end labels, and specialty
printers that produce hard copies of aircraft cockpit communications. We
make data acquisition systems that record and analyze equipment
performance, and data acquisition systems that record and analyze the
human brain.
make specialty printers that produce high-end labels, and specialty
printers that produce hard copies of aircraft cockpit communications. We
make data acquisition systems that record and analyze equipment
performance, and data acquisition systems that record and analyze the
human brain.
We focus on product innovation, and we are committed to total
quality management and customer satisfaction. We sell our products
direct in the USA, Canada, France, Germany, and in the UK, and via
channel distribution in the rest of the world. We are ISO 9001 certified
and have also achieved the rigorous AS9100 quality standard.
quality management and customer satisfaction. We sell our products
direct in the USA, Canada, France, Germany, and in the UK, and via
channel distribution in the rest of the world. We are ISO 9001 certified
and have also achieved the rigorous AS9100 quality standard.

6
Astro-Med, Inc:
Key Investment Highlights

7
Key Investment Highlights:
• Strategic Growth Plan - 3 Year
Ø Organic - R&D funding at 7% of total revenues
Ø Acquisitions - Multiple target companies identified
Ø 7% - 10% Annual revenue growth
Ø 20% - 40% Net Income growth
• Market Leader in In-House, On-Demand
Digital Color Label Printing
Ø Innovation with multiple label printing technologies
Ø Rapidly growing label consumables business
● Long-term Contracts
Ø Contracts in-hand to supply airborne printers for new Boeing
and Airbus passenger planes and also military airplanes

8
Key Investment Highlights:
· Recurring Consumables Revenues
Ø 52% of total sales revenue
● Global Distribution Network
Ø Direct sales and service - North America and Europe
Ø Dealer channel - 85 firms
· Proven, Experienced Management Team

9
Key Investment Highlights:
● Strong Capital Structure
Ø $21 million in cash and securities
Ø Current ratio 6.62 - 1
Ø No debt
Ø Strong EBITDA
Ø 10% CAGR for annual cash dividend over last 5 years
Ø Cash dividends at $0.28/share - current yield 3.7%
● Diversified Product Groups
Ø QuickLabel Systems
Ø Astro-Med Test & Measurement
Ø Astro-Med Ruggedized Products
Ø Grass Technologies

10
|
|
|
|
|
|
|
|
|
|
|
|
|
|
|
|
|
|
|
|
|
|
|
|
|
|
|
|
|
|
|
|
|
|
|
|
|
|
|
|
|
|
|
|
|
|
|
|
|
|
|
|
|
|
|
|
|
|
|
|
|
|
|
|
|
|
|
|
|
|
|
|
|
|
|
|
|
|
|
|
|
|
|
|
|
ANNUAL REVENUE GROWTH RATE
|
7% - 15%
|
||
|
GROSS PROFIT MARGINS
|
42% - 45%
|
||
|
OPERATING PROFIT MARGINS
|
10% - 13%
|
||
|
RETURN ON SALES
|
5% - 7%
|
||
|
RETURN ON EQUITY*
|
8% - 15%
|
||
|
EBITDA TO SALES
|
8% - 14%
|
||
|
INTERNATIONAL SALES TO TOTAL SALES
|
35% - 40%
|
||
|
DIVIDEND GROWTH
|
8% - 10%
|
Three Year Strategic Plan
FY 2012-FY2014
Corporate Financial Goals
Financial
Goals
Goals
*Excludes cash and investments

11
Astro-Med, Inc:
Financials

12
|
|
|
|
|
|
|
|
|
|
|
|
|
|
|
|
|
|
|
|
|
|
|
|
|
|
|
|
|
|
|
|
|
|
|
|
|
|
|
|
|
|
|
|
|
|
|
|
|
|
|
|
|
|
|
|
|
|
|
|
|
|
|
|
|
|
|
|
|
|
|
|
|
|
|
|
|
|
|
|
|
|
|
|
|
|
|
2011(1)
|
2010(2)
|
2009
|
|
|
|
NET SALES
|
|
|
$ 71,016
|
$ 64,031
|
$71,783
|
|
|
GROSS PROFIT
|
|
|
$28,666
|
$26,628
|
$31,068
|
|
|
GROSS PROFIT%
|
|
|
40.4%
|
41.6%
|
43.3%
|
|
|
OPERATING INCOME
|
|
|
$2,656
|
$3,354
|
$4,626
|
|
|
MARGIN
|
|
|
3.7%
|
5.2%
|
6.4%
|
|
|
NET INCOME
|
|
|
$2,062
|
$2,766
|
$2,964
|
|
|
EPS - DILUTED
|
|
|
$0.28
|
$0.38
|
$0.40
|
|
|
EBITDA
|
|
|
$4,311
|
$4,922
|
$5,494
|
|
|
|
(1) Fiscal 2011 results include a tax benefit of $241,000 or $0.03 per diluted share recorded as a result of the resolution of a previously uncertain
tax position and a tax benefit of $130,000 or $0.02 per diluted share related to a favorable adjustment in the filing of the prior year’s foreign tax
returns.
tax position and a tax benefit of $130,000 or $0.02 per diluted share related to a favorable adjustment in the filing of the prior year’s foreign tax
returns.
Financial Highlights
($ in thousands except per share data)
(2) Fiscal 2010 results include a gain on legal settlement of $1,391,000 ($904,000 net of tax or $0.12 per diluted share); a gain on bargain purchase
related to the acquisition of Label Line of $112,000 or $0.02 per diluted share; and a tax benefit of $335,000 or $0.05 per diluted share recorded
as a result of the resolution of a previously uncertain tax position.
related to the acquisition of Label Line of $112,000 or $0.02 per diluted share; and a tax benefit of $335,000 or $0.05 per diluted share recorded
as a result of the resolution of a previously uncertain tax position.
GAAP BASIS

13
|
|
|
|
|
|
|
|
|
|
|
|
|
|
|
|
|
|
|
|
|
|
|
|
|
|
|
|
|
|
|
|
|
|
|
|
|
|
|
|
|
|
|
|
|
|
|
|
|
|
|
|
|
|
|
|
|
|
|
|
|
|
|
|
|
|
|
|
|
|
|
|
|
|
|
|
|
|
|
|
|
|
|
|
|
2011
|
2010
|
2009
|
|
|||
|
NET SALES
|
|
|
$ 71,016
|
$ 64,031
|
$71,783
|
|
|
GROSS PROFIT
|
|
|
$28,666
|
$26,628
|
$31,068
|
|
|
GROSS PROFIT%
|
|
|
40.4%
|
41.6%
|
43.3%
|
|
|
OPERATING INCOME
|
|
|
$2,656
|
$1,963
|
$4,626
|
|
|
MARGIN
|
|
|
3.7%
|
3.1%
|
6.4%
|
|
|
NET INCOME
|
|
|
$1,691
|
$1,415
|
$2,964
|
|
|
EPS - DILUTED
|
|
|
$0.23
|
$0.19
|
$0.40
|
|
|
EBITDA
|
|
|
$4,311
|
$4,922
|
$5,494
|
|
|
|
Fiscal Year Ended
January 31,
Financial Highlights
($ in thousands except per share data)
NON GAAP BASIS
14
|
|
||||
|
|
||||
|
|
||||
|
|
||||
|
|
||||
|
|
||||
|
|
||||
|
|
||||
|
|
||||
|
|
||||
|
|
||||
|
|
||||
|
|
||||
|
|
|
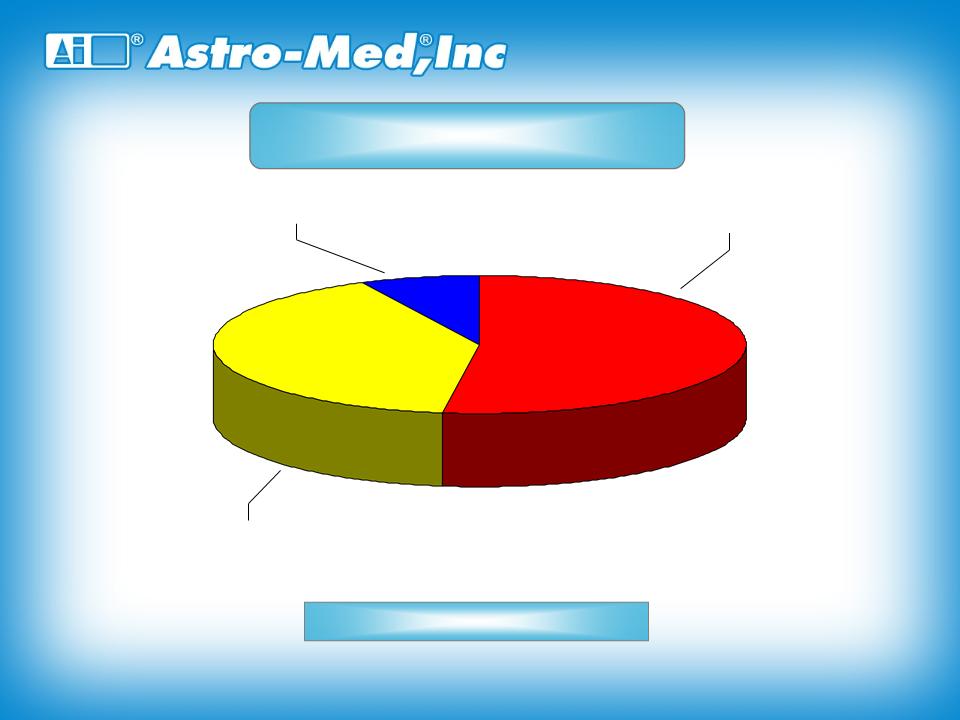
Consumables $37,113 [ 52%]
Hardware $28,686 [ 41%]
Service and Other $5,217 [ 7%]
Product Mix
FY2011 Net Sales: $71,016
($ in thousands)
15
|
|
|
|||
|
|
||||
|
|
||||
|
|
||||
|
|
||||
|
|
||||
|
|
||||
|
|
||||
|
|
||||
|
|
||||
|
|
||||
|
|
||||
|
|
||||
|
|
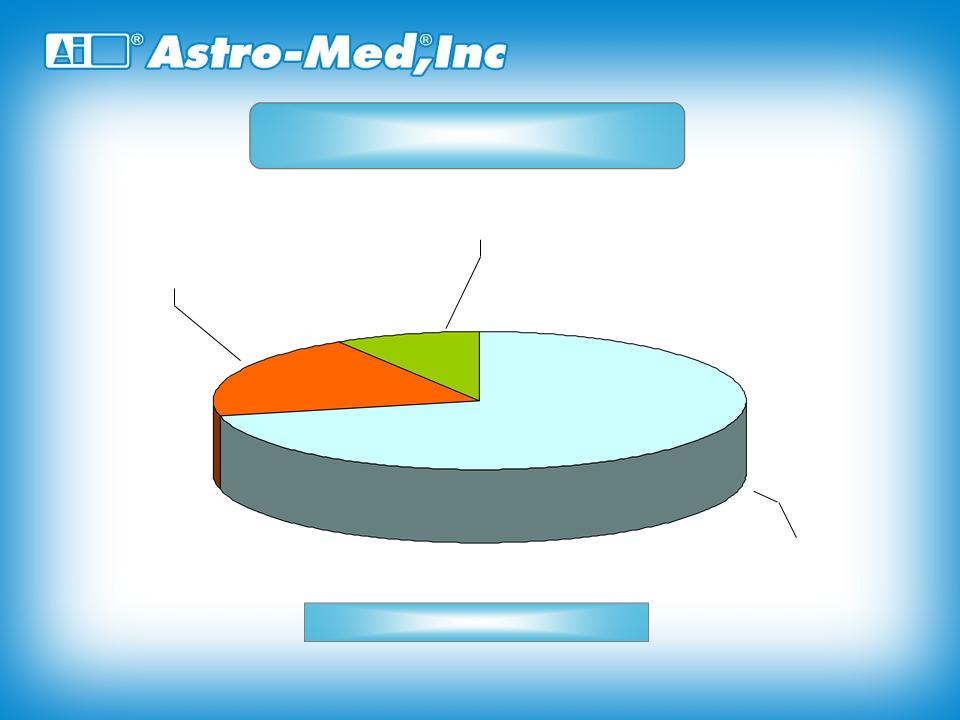
Domestic $50,614 [ 71%]
International Branches $14,027 [ 20%]
International Dealers $6,375 [ 9%]
FY2011 Net Sales: $71,016
($ in thousands)
Channel Distribution

16
|
|
||||
|
|
||||
|
|
||||
|
|
||||
|
|
||||
|
|
||||
|
|
||||
|
|
||||
|
|
||||
|
|
||||
|
|
||||
|
|
||||
|
|
||||
|
|
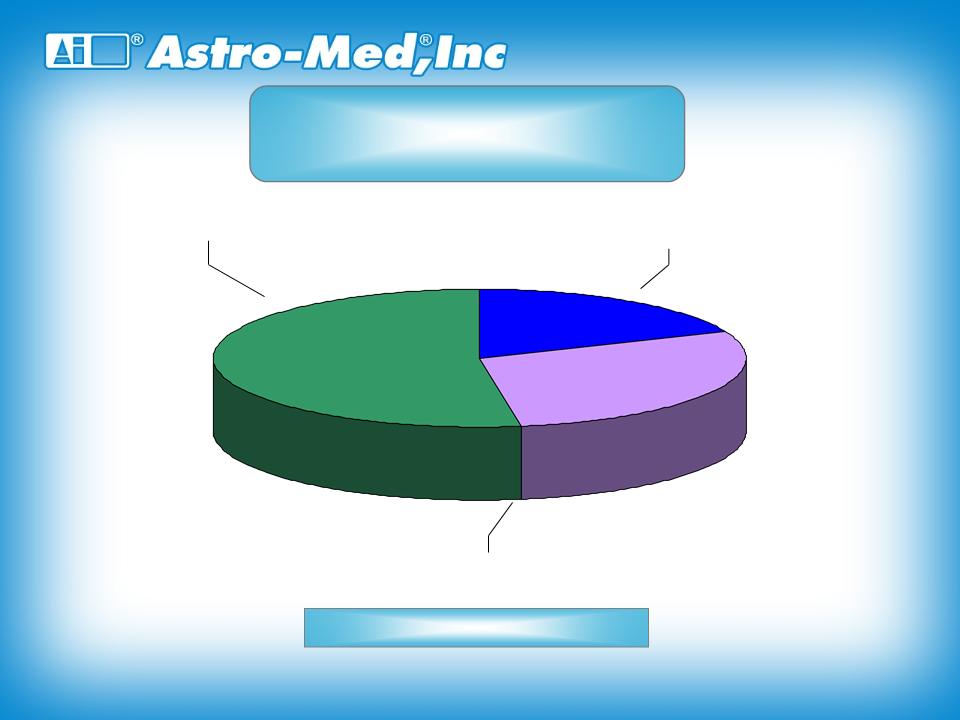
QuickLabel $39,500 [ 56%]
T&M and Ruggedized Products
$14,837 [ 21%]
$14,837 [ 21%]
Grass $16,679 [ 23%]
By Segment
FY2011 Net Sales: $71,016
($ in thousands)
17
|
|
||||
|
|
||||
|
|
||||
|
|
||||
|
|
||||
|
|
||||
|
|
||||
|
|
||||
|
|
||||
|
|
||||
|
|
||||
|
|
||||
|
|
||||
|
|
QuickLabel $1,847 [ 29%]
T&M and Ruggedized Products
$1,200 [ 19%]
$1,200 [ 19%]
Grass $3,358 [ 52%]
By Segment
FY2011 Segment Operating
Profit: $6,405
($ in thousands)

18
|
|
|
|
|
|
|
|
|
|
|
|
|
|
|
|
|
|
|
|
|
|
|
|
|
|
|
|
|
|
|
|
|
|
|
|
|
|
|
|
|
|
|
|
|
|
|
|
|
|
|
|
|
|
|
|
|
|
|
|
|
|
|
|
|
|
|
|
|
|
|
|
|
|
|
|
|
|
|
|
|
|
|
|
|
|
|
|
2011
|
2010
|
2009
|
|
|
CASH & MARKETABLE SECURITIES
|
|
|
$20,630
|
$23,670
|
$22,104*
|
|
|
CURRENT ASSETS
|
|
|
$49,700
|
$49,868
|
$48,023
|
|
|
TOTAL ASSETS
|
|
|
$64,999
|
$64,676
|
$62,155
|
|
|
CURRENT LIABILITIES
|
|
|
$ 7,503
|
$ 7,552
|
$ 7,904
|
|
|
DEBT
|
|
|
0
|
0
|
0
|
|
|
SHAREHOLDERS’ EQUITY
|
|
|
$54,289
|
$54,233
|
$51,471
|
|
Fiscal Year Ended January 31,
______________________
*Includes investments classified as non-current.
Selected Balance Sheet Data
($ in thousands)

19
|
|
|
|
|
|
|
|
|
|
|
|
|
|
|
|
|
|
|
|
|
|
|
|
|
|
|
|
|
|
|
|
|
|
|
|
|
|
|
|
|
|
|
|
|
|
|
|
|
|
|
|
|
|
|
|
|
|
|
|
|
|
|
|
|
|
|
|
|
|
|
|
|
|
|
|
|
|
|
|
|
|
|
|
|
|
|
|
2011
|
2010
|
2009
|
|
|
CASH PER SHARE(1)
|
|
|
$2.85
|
$3.32
|
$ 3.15
|
|
|
CURRENT RATIO
|
|
|
6.62:1
|
6.12:1
|
6.08:1
|
|
|
BOOK VALUE PER SHARE
|
|
|
$7.50
|
$7.58
|
$7.33
|
|
|
RETURN ON EQUITY(2)
|
|
|
6.3%
|
8.8%
|
8.0%
|
|
|
CASH DIVIDEND PER SHARE
|
|
|
$0.28
|
$0.24
|
$0.24
|
|
|
|
|
|
|
|
|
|
|
|
|
|
|
|
|
|
|
|
|
|
|
|
|
|
|
|
|
|
|
|
|
|
|
|
|
|
|
|
|
|
|
|
|
|
|
|
|
|
|
|
|
|
|
|
|
|
|
|
|
|
|
|
|
|
Fiscal Year Ended January 31,
__________________
(1) Includes investments.
(2) Excludes cash and investments.
Selected Financial Metrics
($ in thousands)

20
Astro-Med, Inc:
Product Groups
21
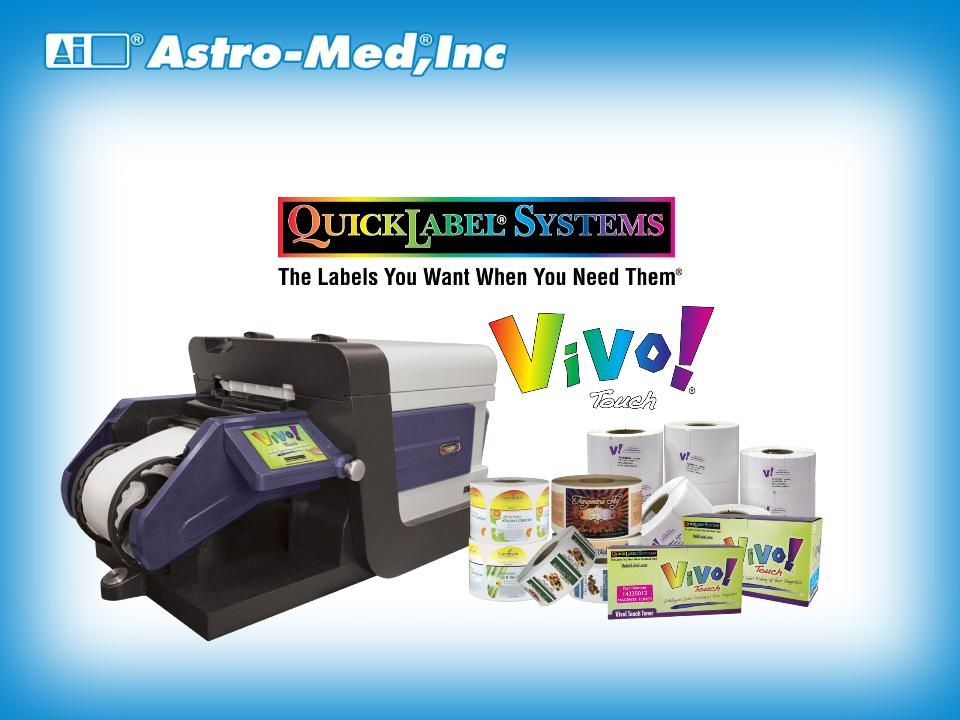
QuickLabel Systems Brand

22
• Market Size: $4 Billion
• Revenue FY2011: $40 million
• Market Growth: 8% to 15%
• Growth Driver: The growing demand for fast turn-around digitally
printed color labels
printed color labels
• Technologies: Electrophotographic (EP - toner-based)
Thermal Transfer; Ink Jet
• Products: ● Digital Label Printers
● Consumables: Labels and Inks
● Custom Label Printing Services
● Labeling Software & Accessory Devices
● Service & Support
23
• Industry Markets:
Ø Food & Beverage
Ø Industrial Chemicals & Chemical Cleansers
Ø Dietary Supplements & Pharmaceuticals
Ø Personal Care Products
Ø Medical Device Products
Ø Hardware
Ø Electronics
Ø Household Goods
Ø Tires
Ø Promotional Products & Advertising Specialties
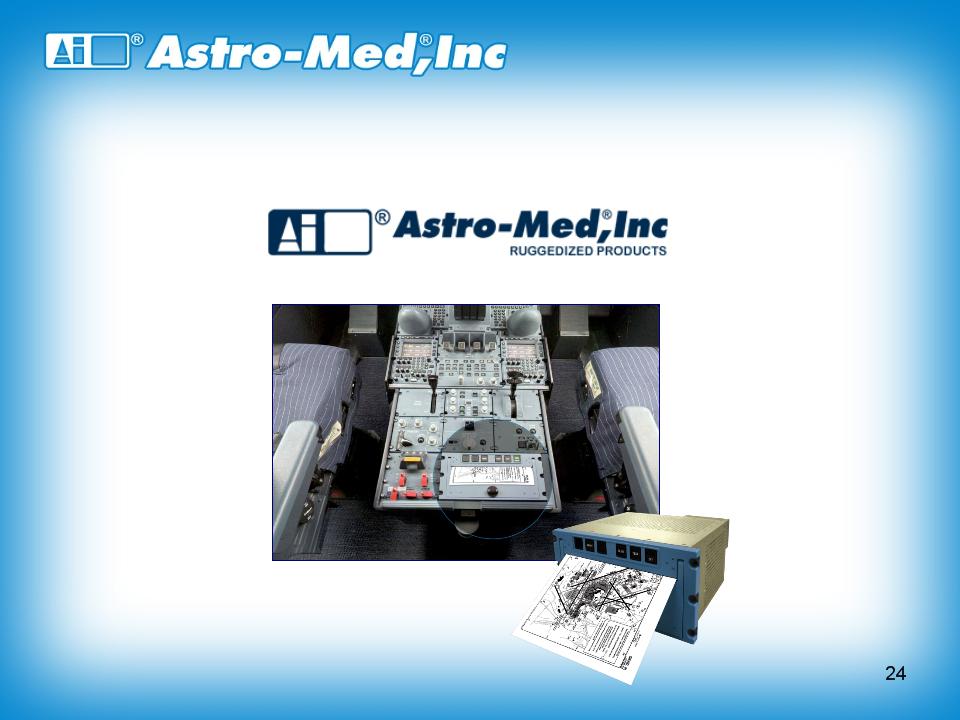
Ruggedized Product Group

25
• Estimated Annual Market Size: $50 Million
• Market Growth: 15% to 25%
• Growth Driver: Improved passenger safety in the
skies through accurate communications
skies through accurate communications
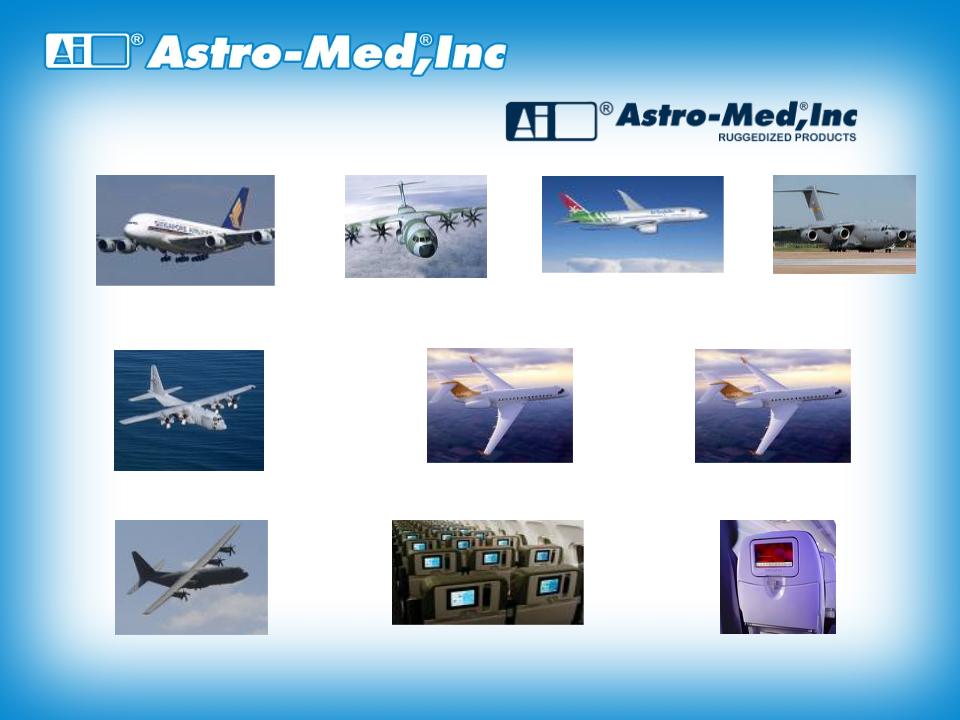
• Contracts on Hand: - Airbus A380
- Airbus A400M
- Boeing 787
- Boeing C-17
- Airbus A400M
- Boeing 787
- Boeing C-17
- Lockheed C-130 (via Boeing)
- Panasonic In-flight Entertainment Systems on:
- Boeing 747,767,777
- Airbus A330, A340
- Bombardier Global Vision Flight Deck
- Air Cargo Carrier
26
Boeing C-17
TW4, TS
Airbus A400M
TW4
Boeing C-130 AMP
TW4, TS2
Boeing B787
TW4
Lockheed Martin C-130J
TS2
Airbus A380
flight deck, cabin
TW4
Bombardier Global Express
TW4
Panasonic IFE
TW4
Thales IFE
TW4
Bombardier Global 5000
TW4
Contracts On Hand

27

28
Test & Measurement Product Group

29
• Market Size: $100 Million
• Revenue FY2011: $9 Million
• Market Growth: 5% to 8%
• Growth Driver: The increased need to troubleshoot the complex
electrical and electronic systems in industrial
systems and grids
electrical and electronic systems in industrial
systems and grids
• Technologies: Data Acquisition
• Products: Portable Data Recorders, Telemetry Recorder
Workstations
Workstations
• Industry Markets: Aerospace, Power, Heavy Industry, Military,
Transportation, Manufacturing
Transportation, Manufacturing

30
Grass Technologies Corporation

31
• Revenue FY2011: $17 million
• Market Growth: 4% to 6%
• Growth Driver: Continued growth in Sleep health and
expansion of Neurodiagnostic monitoring
in ICU.
expansion of Neurodiagnostic monitoring
in ICU.
• Industry Markets: Neurodiagnostic Devices and Supplies
for Clinical and Research Applications
for Clinical and Research Applications
32
• Sleep Diagnostic/PSG Instruments:
Ø Comet XL Lab-based PSG, Comet Portable PSG, AURA
PSG Wireless/Ambulatory Systems, AURA PSG LITE
Ambulatory Sleep Screener, SleepTrek3 Home Sleep
Screener
PSG Wireless/Ambulatory Systems, AURA PSG LITE
Ambulatory Sleep Screener, SleepTrek3 Home Sleep
Screener
• Research Instruments:
Ø Amplifiers, Amplifier Systems, Stimulators, Transducers
and Tissue-Organ Baths
and Tissue-Organ Baths
Product Lines:

33
• EEG/Long-Term Monitoring:
Ø Comet XL Lab-based EEG, Comet Portable EEG, TREA
Ambulatory EEG System, Beehive Horizon Long-term
Monitoring, S12x cortical stimulator
Ambulatory EEG System, Beehive Horizon Long-term
Monitoring, S12x cortical stimulator
• Electrodes:
Ø Genuine Grass® Precious Metal Recording Electrodes,
Grass Disc, Ear Clip, Needles & Nasopharyngeal
Electrodes, Grass Silver-Silver Chloride Electrodes,
Grass Cortical Electrode Accessories
Grass Disc, Ear Clip, Needles & Nasopharyngeal
Electrodes, Grass Silver-Silver Chloride Electrodes,
Grass Cortical Electrode Accessories
Product Lines:

34
Astro-Med, Inc:
Recent Events

35
Recent Events
♦ Recently introduced the VIVO! Touch intelligent color label printer at
several important trade shows including the Pack Expo in Chicago,
Illinois
several important trade shows including the Pack Expo in Chicago,
Illinois
♦ Established Three Year Strategic Business Plan for
FY 2012 - FY 2014
♦ Introduced the ToughWriter® 5, the smallest and lightest
fully-featured cockpit printer in the world
♦ Achieved AS9100 Quality Management System Certification,
meeting rigorous Aerospace Industry standard for Ruggedized
products
♦ Launched Test & Measurement’s TMXTM, a multi-channel
high speed data acquisition system
high speed data acquisition system

36
Recent Events (continued)
♦ Received FDA Clearance to Market its S12X Cortical Brain Stimulator
♦ Completed expansion of consumable manufacturing facility in
Rhode Island
♦ Expanded QuickLabel media manufacturing in Frankfurt, Germany and
Montreal, Canada
Montreal, Canada
♦ Continued expansion of Astro-Med’s Export business

37
Astro-Med, Inc:
Expectations

38
Expectations
♦ Sales Revenue in FY 2012 expected to grow 10%
♦ Operating Income in FY 2012 expected to grow > 25%
♦ EPS expected to be $0.33 - $0.35 in FY 2012
♦ Internally developed new products will promote revenue
and profit growth in FY 2012
♦ Strategic Acquisitions, as appropriate, to be made in FY
2012
2012

39
Thank You
“ALOT”!