Attached files
| file | filename |
|---|---|
| EXCEL - IDEA: XBRL DOCUMENT - AstroNova, Inc. | Financial_Report.xls |
| EX-21 - LIST OF SUBSIDIARIES OF THE COMPANY - AstroNova, Inc. | d272581dex21.htm |
| EX-10.8 - NON-EMPLOYEE DIRECTORS COMPENSATION PROGRAM - AstroNova, Inc. | d272581dex108.htm |
| EX-31.1 - CERTIFICATION OF CHIEF EXECUTIVE OFFICER PURSUANT TO SECTION 302 - AstroNova, Inc. | d272581dex311.htm |
| EX-31.2 - CERTIFICATION OF CHIEF FINANCIAL OFFICER PURSUANT TO SECTION 302 - AstroNova, Inc. | d272581dex312.htm |
| EX-32.1 - CERTIFICATION OF CHIEF EXECUTIVE OFFICER PURSUANT TO 18 U.S.C. SECTION 1350 - AstroNova, Inc. | d272581dex321.htm |
| EX-23.1 - CONSENT OF ERNST & YOUNG LLP - AstroNova, Inc. | d272581dex231.htm |
| EX-32.2 - CERTIFICATION OF CHIEF FINANCIAL OFFICER PURSUANT TO 18 U.S.C. SECTION 1350 - AstroNova, Inc. | d272581dex322.htm |
Table of Contents
SECURITIES AND EXCHANGE COMMISSION
Washington, D.C. 20549
FORM 10-K
| x | ANNUAL REPORT PURSUANT TO SECTION 13 OR 15(d) OF THE SECURITIES EXCHANGE ACT OF 1934 |
For the fiscal year ended January 31, 2012
OR
| ¨ | TRANSITION REPORT PURSUANT TO SECTION 13 OR 15(d) OF THE SECURITIES EXCHANGE ACT OF 1934 |
For the transition period from to
Commission file number 0-13200
Astro-Med, Inc.
(Exact name of registrant as specified in its charter)
| Rhode Island | 05-0318215 | |
| (State or other jurisdiction of incorporation or organization) |
(I.R.S. Employer Identification No.) | |
| 600 East Greenwich Avenue, West Warwick, Rhode Island |
02893 | |
| (Address of principal executive offices) | (Zip Code) | |
Registrant’s telephone number, including area code: (401) 828-4000
Securities registered pursuant to Section 12(b) of the Act:
| Title of each class |
Name of each exchange on which registered | |
| None | None |
Securities registered pursuant to Section 12(g) of the Act:
Common Stock, $.05 Par Value
(Title of Class)
Indicate by check mark if the registrant is a well-known seasoned issuer, as defined in Rule 405 of the Securities Act. Yes ¨ No x
Indicate by check mark if the registrant is not required to file reports pursuant to Section 13 or Section 15(d) of the Act. Yes ¨ No x
Indicate by check mark whether the registrant (1) has filed all reports required to be filed by Section 13 or 15(d) of the Securities Exchange Act of 1934 during the preceding 12 months (or for such shorter period that the registrant was required to file such reports), and (2) has been subject to such filing requirements for the past 90 days. Yes x No ¨
Indicate by check mark whether the registrant has submitted electronically and posted on its corporate Website, if any, every Interactive Data File required to be submitted and posted pursuant to Rule 405 of Regulation S-T (§ 232.405 of this chapter) during the preceding 12 months (or for such shorter period that the registrant was required to submit and post such files). Yes x No ¨
Indicate by checkmark if disclosure of delinquent filers pursuant to Item 405 of regulation S-K is not contained herein, and will not be contained. To the best of the Registrant’s knowledge, in definitive proxy or information statement incorporated by reference in Part III of this Form 10-K or any amendment to this Form 10-K. x
Indicate by check mark whether the registrant is a large accelerated filer, an accelerated filer, a non-accelerated filer or a smaller reporting company. See the definitions of “large accelerated filer,” “accelerated filer” and “smaller reporting company” in Rule 12b-2 of the Exchange Act.
| Large accelerated filer ¨ | Accelerated filer ¨ | Non-accelerated filer ¨ | Smaller reporting company x | |||
| (Do not check if a smaller reporting company) |
Indicate by check mark whether the registrant is a shell company (as defined in Rule 12b-2 of the Exchange Act): Yes ¨ No x
The aggregate market value of the registrant’s voting common equity held by non-affiliates at July 29, 2011 was approximately $43,368,741 based on the closing price on the Nasdaq Global Market on that date.
As of March 30, 2012 there were 7,427,773 shares of Common Stock (par value $0.05 per share) of the registrant outstanding.
DOCUMENTS INCORPORATED BY REFERENCE
Portions of the Company’s definitive Proxy Statement for the 2012 Annual Meeting of Shareholders are incorporated by reference into Part III of this Annual Report on Form 10-K where indicated.
Table of Contents
ASTRO-MED, INC.
FORM 10-K ANNUAL REPORT
| Page | ||||
| PART I | ||||
| Item 1. | 3-6 | |||
| Item 1A. | 6-10 | |||
| Item 1B. | 10 | |||
| Item 2. | 11 | |||
| Item 3. | 11 | |||
| Item 4. | 11 | |||
| PART II | ||||
| Item 5. | 12-14 | |||
| Item 6. | 14 | |||
| Item 7. | Management’s Discussion and Analysis of Financial Condition and Results of Operations |
14-21 | ||
| Item 7A. | 21 | |||
| Item 8. | 22 | |||
| Item 9. | Changes in and Disagreements with Accountants on Accounting and Financial Disclosure |
22 | ||
| Item 9A. | 22-23 | |||
| Item 9B. | 23 | |||
| PART III | ||||
| Item 10. | 24-25 | |||
| Item 11. | 25 | |||
| Item 12. | Security Ownership of Certain Beneficial Owners and Management and Related Stockholders Matters |
25-26 | ||
| Item 13. | Certain Relationships, Related Transactions and Director Independence |
26 | ||
| Item 14. | 26 | |||
| PART IV | ||||
| Item 15. | 27 | |||
2
Table of Contents
ASTRO-MED, INC.
Forward-Looking Statements
Information included in this Annual Report on Form 10-K may contain forward-looking statements within the meaning of the Private Securities Litigation Reform Act of 1995. Forward-looking statements are not statements of historical fact, but rather reflect our current expectations concerning future events and results. We generally use the words “believes,” “expects,” “intends,” “plans,” “anticipates,” “likely,” “continues,” “may,” “will,” and similar expressions to identify forward-looking statements. Such forward-looking statements, including those concerning our expectations, involve risks, uncertainties and other factors, some of which are beyond our control, which may cause our actual results, performance or achievements to be materially different from those expressed or implied by such forward-looking statements. These risks, uncertainties and factors include, but are not limited to, those factors set forth in this Annual Report on Form 10-K under “Item 1A. Risk Factors.” We undertake no obligation to publicly update or revise any forward-looking statements, whether as a result of new information, future events or otherwise. The reader is cautioned not to unduly rely on such forward-looking statements when evaluating the information presented in this Annual Report on Form 10-K.
PART I
General
Unless otherwise indicated, references to “Astro-Med,” the “Company,” “we,” “our,” and “us” in this Annual Report on Form 10-K refer to Astro-Med, Inc. and its consolidated subsidiaries.
Astro-Med, Inc. designs, develops, manufactures and distributes a broad range of specialty printers and data acquisition and analysis systems, including both hardware and software, which incorporate advanced technologies in order to acquire, store, analyze, and present data in multiple formats. Target markets for hardware and software products of the Company include aerospace, apparel, automotive, avionics, chemicals, computer peripherals, communications, distribution, food and beverage, general manufacturing, life sciences, packaging and transportation.
The Company’s products are distributed through its own sales force and authorized dealers in the United States. We sell to customers outside of the United States primarily by using authorized dealers and international sales representatives, who are managed from our foreign branch offices. Approximately 30% of the Company’s sales in fiscal 2012 were to customers located outside the United States.
Astro-Med operates its business through three operating segments, Astro-Med Test & Measurement (T&M), QuickLabel Systems (QuickLabel) and Grass Technologies (Grass). Financial information by business segment and geographic area appears in Note 10 to the Consolidated Financial Statements of this Annual Report on Form 10-K. The following description of our business should be read in conjunction with “Management’s Discussion and Analysis of Financial Conditions and Results of Operations” on pages 14 through 18 of this Annual Report on Form 10-K.
Description of Business
Product Overview
Astro-Med, Inc. develops and manufactures specialty printers and data acquisition systems. The Company’s products sell under the brand names Astro-Med® Test & Measurement (T&M), Grass® Technologies (Grass®), and QuickLabel® Systems (QuickLabel®).
Products sold under the Astro-Med T&M brand acquire and record data and print the output onto charts or electronic media. Products sold under the Grass® brand electronically capture and record neurological data that is
3
Table of Contents
used to analyze and diagnose disorders such as epilepsy and sleep apnea. Products sold under the QuickLabel® brand digitally print custom labels used in product packaging and automatic identification applications.
The Company supplies a range of products and services that include hardware, software and consumables to customers who are in a variety of industries.
Astro-Med Test & Measurement products include the Dash® MX portable data acquisition system, TMX™ high-speed data acquisition system, ToughWriter® ruggedized cockpit printers, ToughSwitch® Ethernet switches, Dash® series data recorders, and Everest® telemetry recorders.
ToughWriter® ruggedized cockpit printers are used in the flight deck and in the cabins of military and commercial aircraft to print hard copies of landing strips, flight itineraries, weather maps, gate information, and ground communications. ToughSwitch® Ethernet switches are used in commercial and military aircraft and military vehicles to connect multiple computers or Ethernet devices together. These products are ruggedized to comply with rigorous military and commercial flightworthiness standards for operation under extreme environmental conditions. The Company is currently furnishing ToughWriter® cockpit printers for several airplanes made by Airbus, Boeing, Bombardier, and Lockheed.
The Company’s family of portable data recorders are used as maintenance and troubleshooting instruments in pulp and paper mills, metal mills, power generating plants, automotive R&D centers, manufacturing plants, and for aerospace applications. The TMX™ data acquisition system is designed for data capture of long-term testing in automotive, aerospace, and other industrial applications where the ability to monitor high channel counts, and accept and view a wide variety of input signals, including time-stamped and synchronized video capture data and audio notation, is important.
Everest® telemetry recorders are used widely in the aerospace industry to monitor and track space vehicles, aircraft, missiles and other systems in flight.
Products sold under the Grass® brand include neurophysiological recording instruments, software, stimulators, electrode preps, consumable products, and Grass’ industry-renowned electrodes. Grass® equipment detects and amplifies neurophysiological signals for acquisition, review, and analysis via special Grass® software.
Grass® clinical equipment is primarily sold into the Sleep Disorders (PSG), Routine/Ambulatory EEG, and Long-Term Epilepsy Monitoring (LTM) diagnostic markets, and is sold to hospitals, free-standing clinics, and private physicians’ offices. Current Grass® clinical products include the FDA-listed Grass® S12X Cortical Stimulator for stimulation mapping to aid in cortical resection procedures, the TREA® ambulatory EEG recorder, the SleepTrek®3 at-home sleep screener, the Comet-Plus® for routine and expanded PSG/EEG studies and TWin® Neurotrac-III Neuromonitoring Software for computing and displaying long-term trends during continuous EEG monitoring in the ICU, NICU, OR, and Seizure Monitoring units.
Grass® research products consist of square pulse stimulators, including the S88X dual-output with digital controls model and the SD9 student research model, as well as amplifiers, including the LP511 high performance AC model and P122 AC/DC Strain Gage model as well as the 15LT Amplifier System. Customers of the Grass® research line are typically university research centers or pharmaceutical companies engaged in drug research. The Grass® consumable products are comprised predominantly of precious metal recording electrodes as well as sensing devices used to collect physiological data and are utilized with the systems described above.
Products sold under the QuickLabel® brand include digital color label printers developed for in-house label printing and software, label and tag substrates, label printing inks including thermal transfer ribbons, toners, custom label printing services, and a range of printer accessories. The breadth of the product line allows QuickLabel sales and support staff to serve customers at virtually every level of their label printing needs.
With its broad range of entry-level, mid-range, and high-performance digital label printers, QuickLabel Systems is able to provide its customers a continuous path to upgrade to new labeling products. QuickLabel® products are primarily sold to end-user manufacturers, processors, and retailers who label products on a
4
Table of Contents
just-in-time basis. Users can benefit from the time and cost-savings of digitally printing their own labels on-demand. Industries that commonly benefit from short-run label printing include apparel, chemicals, cosmetics, food and beverage, medical products, and pharmaceuticals, among many other packaged goods.
Current QuickLabel® models include the Vivo!® Touch, a patented electrophotographic color label printer developed to print full-color variable information labels in an office or factory; the Zeo!®, an entry-level inkjet label printer developed in partnership with Hewlett-Packard; and the Xe series of digital color label printers utilizing thermal transfer technology. The Xe Series of label printers are unique in the industry in that they can be directly integrated with automated production lines and represent a novel, patented application of multi-color thermal transfer technology. QuickLabel also sells and supports its Pronto!® family of barcode printers which utilize single color-thermal transfer label printing technology.
Technology
The core technologies of Astro-Med relate to (1) acquiring data, (2) conditioning the data, (3) displaying the data on hard copy, monitor or electronic storage media, and (4) analyzing the data.
Patents and Copyrights
Astro-Med holds a number of product patents in the United States and in foreign countries. The Company copyrights its software and registers its brand trademarks. While we consider our patents to be important to the operation of our business, we do not believe that any existing patent, license, trademark or other intellectual property right is of such importance that its loss or termination would have a material adverse effect on the Company’s business taken as a whole.
Manufacturing and Supplies
Astro-Med designs its products and manufactures many of the component parts. The balance of the parts required for manufacture of our products are produced to our specifications by suppliers. Raw materials required for the manufacture of products, including parts produced to our specifications, are generally available from numerous suppliers. However, we do obtain certain components of our products and certain finished products from sole sources.
Product Development
Astro-Med maintains an active program of product research and development. During fiscal 2012 and 2011, we spent $5,243,000 and $5,020,000, respectively, on Company-sponsored product development. We are committed to continuous product development as a requisite to our organic growth and expect to continue our focus on research and development efforts in fiscal 2013 and beyond.
Marketing and Competition
The Company competes worldwide in many markets including clinical and research diagnostics, specialty printing systems, and data acquisition and analysis. We retain a competitive position in our respective markets by virtue of proprietary technology, product reputation, delivery, technical assistance, and service to customers. We market our products worldwide by advertising and promotion using major national and international trade journals, scientific meetings, trade shows, direct mailing campaigns, and the internet.
Our products are sold by direct field sales persons as well as independent dealers and representatives. In the United States, the Company has factory-trained direct field sales people located in major cities from coast to coast specializing in either Astro-Med® T&M products, QuickLabel® products, or Grass® Technologies products. Additionally, we have direct field sales and service centers in Canada, France, Germany and the United
5
Table of Contents
Kingdom staffed by our own employees. In the rest of the world, Astro-Med utilizes approximately 90 independent dealers and representatives selling and marketing our products in 70 countries.
Astro-Med has a number of competitors in each of the markets that it serves. In the T&M area, we believe that we are one of the leaders in data acquisition systems. In the digital color label printing field, we believe we lead the world in portable bench-top color label printing technology, and we were the first to market an electrophotographic color label printer capable of printing on continuous rollstock.
Our Grass Technologies products are devoted to clinical applications in electroencephalography (EEG), polysomnography (PSG), and Long Term Epilepsy Monitoring (LTM). There are approximately ten companies that compete in one or more of the three modalities (EEG, PSG, LTM), but none are the clear leader. We believe we offer superior products based upon our long history and pioneering efforts in the field since 1935. Additionally, we produce a range of life science products for the research market many of which eventually find their way into clinical applications.
No single customer accounted for 10% or more of our net sales in any of the last two fiscal years.
International Sales
In fiscal 2012 and 2011, net sales to customers in various geographic areas outside the United States, primarily in Canada and Western Europe, amounted to $24,189,000 and $20,402,000, respectively.
Order Backlog
Astro-Med’s backlog fluctuates regularly. It consists of a blend of orders for end user customers as well as original equipment manufacturer customers. Manufacturing is geared to forecasted demands and applies a rapid turn cycle to meet customer expectations. Accordingly, the amount of order backlog may not indicate future sales trends. Backlog at January 31, 2012 and 2011 was $6,220,000 and $7,114,000, respectively.
Employees
As of January 31, 2012, Astro-Med employed 372 people. We are generally able to satisfy our employment requirements. No employees are represented by a union. We believe that employee relations are good.
Other Information
The Company’s business is not seasonal in nature. However, our sales are impacted by the size of certain individual transactions, which can cause fluctuations in sales from quarter to quarter.
Available Information
We make available on our website (www.astro-medinc.com) the Company’s Annual Report on Form 10-K, Quarterly Reports on Form 10-Q, Current Reports on Form 8-K and, if applicable, amendments to those reports filed or furnished pursuant to Sections 13(a) or 15(d) of the Securities Exchange Act of 1934 as soon as reasonably practicable after the Company electronically files such material with, or furnishes it to, the Securities Exchange Commission. These filings are also accessible on the SEC’s website at http://www.sec.gov.
The following risk factors should be carefully considered in evaluating Astro-Med because such factors may have a significant impact on our business, operating results, liquidity and financial condition. As a result of the
6
Table of Contents
risk factors set forth below, actual results could differ materially from those projected in any forward-looking statements. Additional risks and uncertainties not presently known to us, or that we currently consider to be immaterial, may also impact our business operations.
Depressed general economic conditions, financial market disruptions, and uncertainties in the global credit and equity markets may adversely affect Astro-Med’s results of operation and financial position.
Our business is sensitive to changes in general economic conditions, both inside and outside the United States. As widely reported, financial markets throughout the world have experienced extreme disruption since 2008, including historically high volatility in securities prices, severely diminished liquidity and credit availability, rating downgrades of certain investments and declining value of others, failure of major financial institutions and unprecedented government support of financial institutions and corporations. Recurrence of these developments and a related economic downturn may adversely impact our business resulting in:
| • | Reduced demand for our products realized by diminished new orders and increases in order cancellations; |
| • | Increased risk of excess and obsolete inventories; |
| • | Increased pressure on the prices for our products and services; |
| • | Greater difficulty in collecting accounts receivables; |
| • | Greater risk of impairment to the value and liquidity of our investment portfolio: and |
| • | Greater risk that cost reduction actions may be necessary resulting in restructuring charges |
Astro-Med’s operating results and financial condition could be harmed if the markets into which we sell our product decline or do not grow as anticipated.
Any decline in our customers’ markets or in their general economic conditions, including declines related to the market disruptions as described above, would likely result in a reduction in demand for our products. For example, although we have experienced measured progress in fiscal 2012 and 2011, as sales have increased from prior years, we are still affected by the continued global economic downturn as some of our customers remain reluctant to make capital equipment purchases and are limiting consumable product purchases to quantities necessary to satisfy immediate needs with no provisions to stock supplies for future use. Also, if our customers’ markets decline, we may not be able to collect on outstanding amounts due to us. Such declines could harm our results of operations, financial position and cash flows and could limit our ability to continue to remain profitable.
Astro-Med’s future revenue growth depends on our ability to introduce new products and services on a timely basis and achieve market acceptance of these new products and services.
The markets for our products are characterized by rapidly changing technology and accelerating product introduction cycles. Our future success depends largely upon our ability to address the rapidly changing needs of our customers by developing and supplying high-quality, cost-effective products, product enhancements and services on a timely basis and by keeping pace with technological developments and emerging industry standards. The success of our new products will also depend on our ability to differentiate our offerings from our competitors’ offerings; price our products competitively; anticipate our competitor’s development of new products; and maintain high levels of product quality and reliability. Astro-Med spends a significant amount of time and effort related to the development of our Ruggedized and Color Printer products as well as our Test and Measurement products. Failure to further develop any of our new products and their related markets as anticipated could adversely affect our future revenue growth and operating results.
Astro-Med faces significant competition and our failure to compete successfully could adversely affect our results of operations and financial condition.
We operate in an environment of significant competition, driven by rapid technological advances, evolving industry standards, frequent new product introductions and the demands of customers to become more efficient.
7
Table of Contents
Our competitors range from large international companies to relatively small firms. We compete primarily on the basis of technology, performance, price, quality, reliability, brand, distribution and customer service and support. Our success in future performance is largely dependent upon our ability to compete successfully in the markets we currently serve and to expand into additional market segments. Additionally, current competitors or new market entrants may develop new products with features that could adversely affect the competitive position of our products. To remain competitive, we must develop new products, services and applications and periodically enhance our existing offerings. If we are unable to compete successfully, we could lose market share and important customers to our competitors which could materially adversely affect our results of operations and financial position.
Astro-Med is dependent upon contract manufacturers for some of our products. If these manufacturers do not meet our requirements, either in volume or quality, then we could be materially harmed.
During fiscal 2012, we subcontracted the manufacturing and assembly of certain of our products to an independent third party at facilities located in various countries. Relying on subcontractors involves a number of significant risks, including:
| • | Loss of control over the manufacturing process; |
| • | Potential absence of adequate production capacity; |
| • | Potential delays in production lead times; |
| • | Unavailability of certain process technologies; and |
| • | Reduced control over delivery schedules, manufacturing yields, quality and costs. |
If our significant subcontractor becomes unable or unwilling to continue to manufacture these products in required volumes, we will have to identify qualified alternate subcontractors or we will take over the manufacturing ourselves in as much as we own the designs, drawings, and bills of material for all our products. Additional qualified subcontractors may not be available, or may not be available on a timely or cost competitive basis. Any interruption in the supply of, or increase in the cost of, the products manufactured by third party subcontractors could have a material adverse effect on our business, operating results and financial condition.
For certain components and assembled products, Astro-Med is dependent upon single or limited source suppliers. If these suppliers do not meet demand, either in volume or quality, then we could be materially harmed.
If the supply of a key component or assembled products were to be delayed or curtailed or, in the event a key manufacturing or sole vendor delays shipment of such components or completed products, our ability to ship products in desired quantities and in a timely manner would be adversely affected. Our business, results of operations and financial position could also be adversely affected, depending on the time required to obtain sufficient quantities from the original source or, if possible, to identify and obtain sufficient quantities from an alternative source. Additionally, if any single or limited source supplier becomes unable or unwilling to continue to supply these components or assembled products in required volumes, we will have to identify and qualify acceptable replacements or redesign our products with different components. Alternative sources may not be available, or product redesign may not be feasible on a timely basis. Any interruption in the supply of or increase in the cost of the components and assembled products provided by single or limited source suppliers could have a material adverse effect on our business, operating results and financial condition.
Economic, political and other risks associated with international sales and operations could adversely affect Astro-Med’s results of operations and financial position.
Because we sell our products worldwide, our business is subject to risks associated with doing business internationally. Revenue from international operations, which includes both direct and indirect sales to customers outside the U.S. accounted for approximately 30% of our total revenue for fiscal year 2012 and we anticipate that international sales will continue to account for a significant portion of our revenue. In addition, many of our
8
Table of Contents
employees, suppliers, job functions and facilities are located outside the U.S. Accordingly, our future results could be harmed by a variety of factors, including:
| • | Interruption to transportation flows for delivery of parts to us and finished goods to our customers; |
| • | Customer and vendor financial stability; |
| • | Changes in foreign currency exchange rates; |
| • | Changes in a specific country’s or region’s environment including political, economic, monetary, regulatory or other conditions; |
| • | Trade protection measures and import or export licensing requirements; |
| • | Negative consequences from changes in tax laws; |
| • | Difficulty in managing and overseeing operations that are distant and remote from corporate headquarters; |
| • | Difficulty in obtaining and maintaining adequate staffing; |
| • | Differing labor regulations; |
| • | Differing protection of intellectual property; |
| • | Unexpected changes in regulatory requirements; and |
| • | Geopolitical turmoil, including terrorism and war. |
Astro-Med’s profitability is dependent upon our ability to obtain adequate pricing for our products and to improve our cost structure.
Our success depends on our ability to obtain adequate pricing for our products and services which provides a reasonable return to our shareholders. Depending on competitive market factors, future prices we obtain for our products and services may decline from previous levels. In addition, pricing actions to offset the effect of currency devaluations may not prove sufficient to offset further devaluations or may not hold in the face of customer resistance and/or competition. If we are unable to obtain adequate pricing for our products and services, our results of operations and financial position could be materially adversely affected.
We are continually reviewing our operations with a view towards reducing our cost structure, including but not limited to downsizing our employee base, exiting certain businesses, improving process and system efficiencies and outsourcing some internal functions. From time to time we also engage in restructuring actions to reduce our cost structure. If we are unable to maintain our cost base at or below the current level and maintain process and systems changes resulting from cost reduction and prior restructuring actions, our results of operations and financial position could be materially adversely affected.
Astro-Med could incur liabilities as a result of installed product failures due to design or manufacturing defects.
Astro-Med could incur liabilities as a result of installed product failures due to design or manufacturing defects. Our products may have defects despite testing internally or by current or potential customers. These defects could result in among other things, a delay in recognition of sales, loss of sales, loss of market share, failure to achieve market acceptance or substantial damage to our reputation. We could be subject to material claims by customers, and may need to incur substantial expenses to correct any product defects.
Astro-Med is subject to laws and regulations; failure to address or comply with these laws and regulations could harm our business and adversely affect our results of operations.
Our operations are subject to laws, rules, regulations, including environmental regulations, government policies and other requirements in each of the jurisdictions in which we conduct business. Changes in laws, rules, regulations, policies or requirements could result in the need to modify our products and could affect the demand
9
Table of Contents
for our products, which may have an adverse impact on our future operating results. In addition, we must comply with new regulations restricting our ability to include lead and certain other substances in our products. If we do not comply with applicable laws, rules and regulations we could be subject to costs and liabilities and our business may be adversely impacted.
A number of our products from our Grass Technologies product group are subject to regulation by the United States Food and Drug Administration (“FDA”) and certain similar foreign regulatory agencies. If we or any of our suppliers or distributors fail to comply with FDA and other applicable regulatory requirements or are perceived potentially to have failed to comply, we may face, among other things, adverse publicity affecting both us and our customers; investigations or notices of non-compliance; fines, injunctions and civil penalties; partial suspensions or total shutdown of production facilities or the imposition of operating restrictions; increased difficulty in obtaining required FDA clearances or approvals; seizures or recalls of our products or those of our customers, and/or the inability to sell our products.
Adverse conditions in the global banking industry and credit markets may adversely impact the value of our investments or impair our liquidity.
At the end of fiscal 2012, we had cash and cash equivalents of approximately $11.7 million invested or held in a mix of money market funds and bank demand deposit accounts. The continued disruptions in the financial markets may, in some cases, result in an inability to access assets such as money market funds that traditionally have been viewed as highly liquid. Any failure of our counterpart financial institutions or funds in which we have invested may adversely impact our cash and cash equivalent positions and, in turn, our results of operations and financial position. As of January 31, 2012, we also had an approximate $11.3 million portfolio of securities available for sale. This portfolio consists of state and municipal securities with various maturity dates, all of which have a credit rating of AA or above at the original purchase date; however, failure of any of these securities may result in an adverse impact on our portfolio.
Astro-Med may not be able to effectively integrate businesses or assets acquired.
We may identify and pursue acquisitions of complementary companies and strategic assets, such as customer bases, products and technology. However, there can be no assurance that we will be able to identify suitable acquisition opportunities. In any acquisition that we complete we cannot be certain that:
| • | We will successfully integrate the operations of the acquired business with our own; |
| • | All the benefits expected from such integration will be realized; |
| • | Management’s attention will not be diverted or divided, to the detriment of current operations; |
| • | Amortization of acquired intangible assets will not have a negative effect on operating results or other aspects of our business; |
| • | Delays or unexpected costs related to the acquisition will not have a detrimental effect on our business, operating results and financial condition; |
| • | Customer dissatisfaction with, or performance problems at, an acquired company will not have an adverse effect on our reputation; and |
| • | Respective operations, management and personnel will be compatible. |
In certain instances as permitted by applicable law and NASDAQ rules, acquisitions may be consummated without seeking and obtaining shareholder approval, in which case shareholders will not have an opportunity to consider and vote upon the merits of such an acquisition. Although we will endeavor to evaluate the risks inherent in a particular acquisition, there can be no assurance that we will properly ascertain or assess such risks.
Item 1B. Unresolved Staff Comments
None
10
Table of Contents
The following table sets forth information regarding the Company’s principal owned properties, all of which are included in the consolidated balance sheet appearing elsewhere in this report.
| Location |
Approximate Square Footage |
Principal Use | ||||
| West Warwick, Rhode Island, USA |
135,500 | Corporate headquarters, research and development, manufacturing, sales and service | ||||
| Rockland, Massachusetts, USA | 36,000 | Manufacturing | ||||
| Slough, England | 1,700 | Sales and service | ||||
Astro-Med also leases facilities in various other locations. The following information pertains to each location:
| Location |
Approximate Square Footage |
Principal Use | ||||
| Rodgau, Germany |
8,300 | Manufacturing, sales and service | ||||
| Brossard, Quebec, Canada |
7,900 | Manufacturing, sales and service | ||||
| Trappes, France |
2,164 | Sales and service | ||||
| Schaumburg, Illinois, USA | 630 | Sales | ||||
| El Dorado Hills, California, USA | 273 | Sales | ||||
| Newport Beach, California, USA | 151 | Sales | ||||
We believe our facilities are well maintained, in good operating condition and generally adequate to meet our needs for the foreseeable future.
There are no pending or threatened legal proceedings against the Company believed to be material to the financial position or results of operations of the Company.
Item 4. Mine Safety Disclosures
Not applicable.
11
Table of Contents
PART II
| Item 5. | Market for the Registrant’s Common Stock, Related Stockholder Matters and Issuer Purchases of Equity Securities |
Astro-Med’s common stock trades on The NASDAQ Global Market under the symbol “ALOT.” The following table sets forth the range of high and low closing prices and dividend data, as furnished by NASDAQ, for the years ended January 31:
| High | Low | Dividends Per Share |
||||||||||
| 2012 |
||||||||||||
| First Quarter |
$ | 8.07 | $ | 7.48 | $ | 0.07 | ||||||
| Second Quarter |
$ | 9.00 | $ | 7.64 | $ | 0.07 | ||||||
| Third Quarter |
$ | 8.18 | $ | 6.94 | $ | 0.07 | ||||||
| Fourth Quarter |
$ | 8.15 | $ | 7.07 | $ | 0.07 | ||||||
| 2011 |
||||||||||||
| First Quarter |
$ | 8.05 | $ | 7.31 | $ | 0.07 | ||||||
| Second Quarter |
$ | 7.75 | $ | 6.93 | $ | 0.07 | ||||||
| Third Quarter |
$ | 7.49 | $ | 6.60 | $ | 0.07 | ||||||
| Fourth Quarter |
$ | 7.95 | $ | 6.90 | $ | 0.07 | ||||||
Astro-Med had approximately 301 shareholders of record as of March 23, 2012, which does not reflect shareholders with beneficial ownership in shares held in nominee name.
12
Table of Contents
Stock Performance Graph
The graph below shows a comparison of the cumulative total return on the Company’s common stock against the cumulative total returns for the NASDAQ Composite Index and the NASDAQ Electronic Index for the period of five fiscal years ended January 31, 2012. The NASDAQ Composite Index is calculated using all companies trading on the NASDAQ Global Select, NASDAQ Global Market and the NASDAQ Capital Markets through January 31, 2012. The Index is weighted by the current shares outstanding and assumes dividends reinvested. The NASDAQ Electronic Index, designated as the Company’s peer group index, is comprised of companies classified as electronic equipment manufacturers.
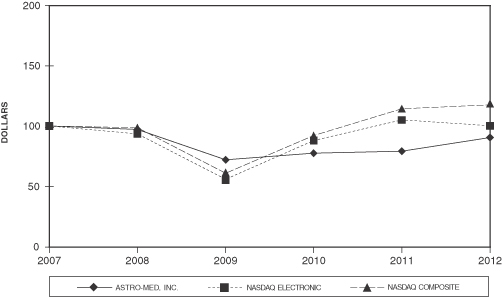
| Cumulative Total Returns* | ||||||||||||||||||||||||
| 2007 | 2008 | 2009 | 2010 | 2011 | 2012 | |||||||||||||||||||
| Astro-Med, Inc. |
$ | 100.00 | $ | 95.12 | $ | 70.21 | $ | 75.74 | $ | 78.66 | $ | 90.58 | ||||||||||||
| NASDAQ Electronic Index |
$ | 100.00 | $ | 94.71 | $ | 56.56 | $ | 87.78 | $ | 104.98 | $ | 100.59 | ||||||||||||
| NASDAQ Composite Index |
$ | 100.00 | $ | 97.62 | $ | 60.84 | $ | 89.31 | $ | 113.69 | $ | 119.63 | ||||||||||||
| * | Assumes $100 invested on February 1, 2007 with reinvestment of dividends |
Dividend Policy
Astro-Med began a program of paying quarterly cash dividends in fiscal 1992 and has paid a dividend for 82 consecutive quarters. During fiscal 2012, we paid a quarterly dividend of $0.07 per share. We anticipate that we will continue to pay comparable cash dividends on a quarterly basis.
Stock Repurchases
On August 22, 2011, Astro-Med’s Board of Directors approved an increase in the number of shares authorized for repurchase from 254,089 to 500,000 shares of common stock. This is an ongoing authorization without any expiration date.
13
Table of Contents
During the fourth quarter of fiscal 2012, the Company made the following repurchases of its common stock:
| Total Number of Shares Repurchased |
Average Price paid Per Share |
Total Number of Shares Purchased as Part of Publicly Announced Plans or Programs |
Maximum Number of Shares That May Be Purchased Under The Plans or Programs |
|||||||||||||
| October 30 – November 26 |
— | — | — | 500,000 | ||||||||||||
| November 27 – December 24 |
— | (a)(b) | — | — | 500,000 | |||||||||||
| December 25 – January 31 |
— | (c) | — | — | 500,000 | |||||||||||
| (a) | On November 29, 2011, the Company’s Chief Executive Officer delivered 7,893 shares of the Company’s common stock to satisfy the exercise price for 14,300 stock options exercised. The shares delivered were valued at $7.99 per share and are included with treasury stock in the consolidated balance sheet. This transaction did not impact the number of shares authorized for repurchase under the Company’s current repurchase program. |
| (b) | On November 29, 2011, the Company’s Vice President and Chief Technology Officer delivered 2,547 shares of the Company’s common stock to satisfy the exercise price for 7,562 stock options exercised. The shares delivered were valued at $7.99 per share and are included with treasury stock in the consolidated balance sheet. This transaction did not impact the number of shares authorized for repurchase under the Company’s current repurchase program. |
| (c) | On January 6, 2012, the Company’s Marketing Manager delivered 716 shares of the Company’s common stock to satisfy the exercise price for 2,062 stock options exercised. The shares delivered were valued at $7.76 per share and are included with treasury stock in the consolidated balance sheet. This transaction did not impact the number of shares authorized for repurchase under the Company’s current repurchase program. |
Item 6. Selected Financial Data
We are a “smaller reporting company” and, as such, are not required to provide this information.
Item 7. Management’s Discussion and Analysis of Financial Condition and Results of Operations
Overview
Astro-Med is a multi-national enterprise, which designs, develops, manufactures, distributes and services a broad range of products that acquire, store, analyze and present data in multiple formats. The Company organizes its structure around a core set of competencies, including research and development, manufacturing, service, marketing and distribution. It markets and sells its products and services through the following three sales product groups:
| • | Test and Measurement Product Group (T&M)—offers a suite of Ruggedized Printer products designed for military and commercial applications to be used in the avionics industry to print weather maps, communications and other critical flight information. T&M also comprises a suite of telemetry recorder products sold to the aerospace and defense industries, as well as portable data acquisition recorders, which offer diagnostic and test functions to a wide range of manufacturers including automotive, energy, paper and steel fabrication. |
| • | QuickLabel Systems Product Group (QuickLabel)—offers label printer hardware, labeling software, servicing contracts, and label and ink consumable products that digitally print color labels on a broad range of label and tag substrates. |
| • | Grass Technologies Product Group (Grass)—offers monitoring and diagnostic instrumentation that serves the clinical and research neurophysiology and life sciences markets, as well as a range of consumable supplies. |
14
Table of Contents
Astro-Med markets and sells its products and services globally through a diverse distribution structure of direct sales personnel, manufacturer’s representatives and authorized dealers that deliver a full complement of branded products and services to customers in our respective markets.
Our growth strategy centers on organic growth through product innovation made possible by research and development initiatives, as well as strategic acquisitions that fit into existing core businesses. Research and development activities are funded and expensed by the Company at approximately 6.6% of annual sales for fiscal 2012. We also continue to invest in sales and marketing initiatives by expanding the existing sales force and using various marketing campaigns to achieve our goals of sales growth and increased profitability notwithstanding today’s challenging economic environment.
Results of Operations
| ($ in thousands) | 2012 | 2011 | ||||||||||||||||||
| Net Sales |
As a % of Total Net Sales |
% Change Over Prior Year |
Net Sales |
As a % of Total Net Sales |
||||||||||||||||
| T&M |
$ | 17,138 | 21.7 | % | 15.5 | % | $ | 14,837 | 20.9 | % | ||||||||||
| QuickLabel |
43,586 | 55.0 | % | 10.3 | % | 39,500 | 55.6 | % | ||||||||||||
| Grass |
18,469 | 23.3 | % | 10.7 | % | 16,679 | 23.5 | % | ||||||||||||
|
|
|
|
|
|
|
|
|
|
|
|||||||||||
| Total |
$ | 79,193 | 100.0 | % | 11.5 | % | $ | 71,016 | 100.0 | % | ||||||||||
|
|
|
|
|
|
|
|
|
|
|
|||||||||||
Fiscal 2012 compared to Fiscal 2011
Astro-Med’s sales in fiscal 2012 were $79,193,000, representing an 11.5% increase as compared to prior year sales of $71,016,000. Domestic sales of $55,004,000 increased 8.7% from the prior year sales of $50,614,000. International sales of $24,189,000 includes a favorable impact of $705,000 due to foreign exchange rates and reflects an 18.6% increase as compared to the prior year.
Hardware sales in fiscal 2012 were $34,767,000, a 21.2% increase as compared to prior year’s sales of $28,686,000. All three product groups achieved double-digit growth in the current year, with T&M hardware sales up 21.0%, QuickLabel hardware sales up 37.5% and Grass Technologies’ hardware sales up 12.4%. The primary drivers of this increase relates to the increase in T&M’s Ruggedized product sales, the increase in sales of QuickLabel’s Vivo! and Zeo! product lines and the increase in Grass’ clinical line of diagnostic systems, especially EEG and Long Term Epilepsy Monitoring Systems. The increase in the current year’s hardware sales was tempered by lower sales of T&M’s recorder and data acquisition product lines.
Consumable sales in fiscal 2012 were $39,269,000, representing a 5.8% increase as compared to prior year sales of $37,113,000. The overall increase in consumable sales for the current fiscal year was primarily traceable to sales of digital color printer supplies within the QuickLabel product group, which were up 38.9% over the prior year. Also contributing to the current year increase were sales of Grass’ electrodes and cream products which increased 10.7% as compared to the prior year. This overall increase in consumable sales was somewhat tempered by a decrease in sales of chart paper within the T&M group, as well as lower sales of QuickLabel’s thermal transfer ribbon product lines as compared to the prior year.
Service and other sales revenue in fiscal 2012 were $5,157,000, a 1.2% decrease compared to prior year sales of $5,217,000 due to lower repair and parts revenue.
The Company achieved $31,783,000 in gross profit for fiscal 2012 and generated a gross profit margin of 40.1%, a slight decrease as compared to prior year’s gross profit margin of 40.4%. The nominal decline in gross profit margin for the current year is due to higher manufacturing costs, as the Company incurred an increase in raw material costs this year as a result of the higher cost of precious sensitive material and paper stock.
15
Table of Contents
Operating expenses for the current year were $27,185,000, representing a 4.5% increase from prior year’s operating expenses of $26,011,000. Specifically, selling and marketing expenses increased 7.7% from prior year to $17,980,000 in fiscal 2012, representing 22.7% of sales, a slight decrease as compared to the prior year’s 23.5% of sales. The increase in selling and marketing was primarily the result of higher personnel cost, as well as increased commissions due to sales growth. The increase in selling and marketing was also impacted by the increase in outside service spending for fiscal 2012. General and administrative (G&A) expenses declined 7.9% from prior year to $3,962,000 in fiscal 2012. The reduced G&A expense was primarily due to a decrease in professional service fees as compared to the prior year. Funding of research & development (R&D) in fiscal 2012 has increased 4.5% to $5,243,000. The increase in R&D for fiscal 2012 is primarily due to the increase in personnel costs and increase in prototype spending, offset by lower outside research and development spending. The R&D spending level for fiscal 2012 represents 6.6% of net sales, a decline from the prior year’s level of 7.1%.
In fiscal 2012, the Company recognized a $681,000 loss on the sale of our manufacturing operations in Asheboro, while in fiscal 2011 the Company reported a $104,000 gain on legal settlement for interest and attorney fees recognized as a result of damages collected from a lawsuit filed against a former employee and competitor business.
Other income in fiscal 2012 was $316,000 as compared to $24,000 in fiscal 2011. This increase in other income for the current year is primarily the result of the $300,000 of income recognized related to the disposition of a key-man life insurance policy, as well as increases in investment income and lower foreign exchange losses recognized in the current year.
Astro-Med’s fiscal 2012 pretax income was reduced by approximately $208,000 related to stock-based compensation expense as compared to fiscal 2011 pretax income, which was reduced by approximately $333,000 in stock-based compensation expense.
During fiscal 2012, the Company recognized income tax expense of $1,101,000 and had an effective tax rate of 26.0%. The current year’s income tax expense includes a benefit of $157,000 related to a favorable adjustment in the filing of the prior year’s tax returns. This compares to income tax expense of $722,000 and an effective tax rate of 25.9% in fiscal 2011 which includes a benefit of $241,000 related to the resolution of a previously uncertain tax position and a benefit of $143,000 related to a favorable adjustment in the filing of the prior year’s tax returns.
Net income for fiscal 2012 was $3,132,000, providing a return of 4.0% on sales and generating an EPS of $0.42 per diluted share. Included in net income is a $450,000 loss, net of tax, related to the sale of the Asheboro operations, equal to $0.06 per diluted share; income of $300,000 related to key-man life insurance proceeds received, equal to $0.04 per diluted share; and a $157,000 tax benefit equal to $0.02 per diluted share relating to a favorable adjustment in the filing of the prior year’s tax returns. On a comparative basis, fiscal 2011 net income was $2,062,000, providing a return of 2.9% on sales and an EPS of $0.28 per diluted share. Included in net income is a $63,000 gain, net of tax, related to the settlement of a legal matter equal to $0.01 per diluted share; $241,000 tax benefit pertaining to previously uncertain tax positions realized equal to $0.03 per diluted share; and a $143,000 tax benefit relating to a favorable adjustment in the filing of the prior year’s tax returns equal to $0.02 per diluted share.
Segment Analysis
Astro-Med reports three segments consistent with its sales product groups: Test & Measurement (T&M), QuickLabel Systems (QuickLabel) and Grass Technologies (Grass). Segment performance is evaluated based on the operating segment’s profit before corporate and financial administration expenses.
16
Table of Contents
The following table summarizes selected financial information by segment:
| (Dollars in thousands) | Net Sales | Segment Operating Profit | Segment Operating Profit as a % of Net Sales |
|||||||||||||||||||||
| 2012 | 2011 | 2012 | 2011 | 2012 | 2011 | |||||||||||||||||||
| T&M |
$ | 17,138 | $ | 14,837 | $ | 2,425 | $ | 1,200 | 14.1 | % | 8.1 | % | ||||||||||||
| QuickLabel |
43,586 | 39,500 | 2,553 | 1,847 | 5.9 | % | 4.7 | % | ||||||||||||||||
| Grass |
18,469 | 16,679 | 3,592 | 3,358 | 19.5 | % | 20.1 | % | ||||||||||||||||
|
|
|
|
|
|
|
|
|
|
|
|
|
|||||||||||||
| Total |
$ | 79,193 | $ | 71,016 | 8,570 | 6,405 | 10.8 | % | 9.0 | % | ||||||||||||||
|
|
|
|
|
|
|
|
|
|||||||||||||||||
| Corporate Expenses |
3,972 | 3,749 | ||||||||||||||||||||||
| Loss on Sale of Asheboro Operations* |
(681 | ) | — | |||||||||||||||||||||
| Gain on Legal Settlement |
— | 104 | ||||||||||||||||||||||
|
|
|
|
|
|||||||||||||||||||||
| Operating Income |
3,917 | 2,760 | ||||||||||||||||||||||
| Other Income, Net |
316 | 24 | ||||||||||||||||||||||
|
|
|
|
|
|||||||||||||||||||||
| Income Before Income Taxes |
4,233 | 2,784 | ||||||||||||||||||||||
| Income Tax Provision |
1,101 | 722 | ||||||||||||||||||||||
|
|
|
|
|
|||||||||||||||||||||
| Net Income |
$ | 3,132 | $ | 2,062 | ||||||||||||||||||||
|
|
|
|
|
|||||||||||||||||||||
| * | The Asheboro operations were part of the QuickLabel System segment. |
Test & Measurement
T&M’s sales increased 15.5% in fiscal 2012 to $17,138,000 from $14,837,000 in the prior year. The increase is primarily due to the double-digit growth in the Ruggedized printer product line due to increased contract sales. Also contributing to the increase in sales was the continued increase in demand for the TMX product line, as current year sales grew 23.1% as compared to prior year sales. The current year sales increase is tempered by declining sales in the Dash data acquisition and recorder product lines as compared to the prior year. T&M’s segment operating profit was $2,425,000 in fiscal 2012, reflecting a profit margin of 14.1%, an improvement as compared to the prior year’s segment operating profit of $1,200,000 and related profit margin of 8.1%. The fiscal 2012 increase in operating profit is an outgrowth of higher sales and lower selling and marketing expenses.
QuickLabel Systems
QuickLabel Systems sales increased 10.3% in fiscal 2012 to $43,586,000 from sales of $39,500,000 in the prior year. The increase in current year is primarily attributable to the hardware product lines which grew 37.5% from the prior year. Within the hardware line, sales of the Vivo! and Zeo! products, which includes the new Vivo! Touch, made a significant contribution to the overall growth rate. Current year revenues from QuickLabel’s consumable product lines also reflected an increase over the previous year’s sales, primarily attributable to the increase in sales of Vivo! and Zeo! supplies, as current year sales represents a 38.9% increase as compared to the prior year. QuickLabel’s fiscal 2012 segment operating profit was $2,553,000 reflecting a profit margin of 5.9%, compared to prior year’s segment profit margin of 4.7%. The increase in operating margin for fiscal 2012 is due to higher sales and favorable mix of higher margin products included in our net sales.
Grass Technologies
Grass sales in fiscal 2012 were $18,469,000, a 10.7% increase as compared to sales of $16,679,000 in the prior year. The increase is primarily attributed to sales of the Clinical and Research hardware product lines, which increased 12.4%. Within the Clinical hardware product line, the primary contributors to the sales growth were the Electroencephalography systems (EEG) and Long Term Epilepsy Monitoring systems (LTM) as both product lines reported double digit sales increments. Also contributing to the increase in sales for the current year are the consumable products of electrodes and creams, as sales have increased 10.7%, as compared to the
17
Table of Contents
prior year. Grass’ segment operating profit was $3,592,000 in fiscal 2012, representing a profit margin of 19.5%, as compared to prior year’s segment operating profit of $3,358,000 and related profit margin of 20.1%. The fiscal 2012 increase in operating profits is an outgrowth of higher sales and favorable product mix of higher margin products included in net sales, as well as lower manufacturing costs.
Liquidity and Capital Resources
The Company expects to finance its future working capital needs, capital expenditures and acquisition requirements through internal funds and believes that cash provided by operations will be sufficient to meet our operating and capital needs for at least the next twelve months. To the extent our capital and liquidity requirements are not satisfied internally, we may utilize a $5.0 million revolving bank line of credit, all of which is currently available. Borrowings under this line of credit bear interest at either a fluctuating rate equal to 75 basis points below the base rate, as defined in the agreement, or at a fixed rate equal to 150 basis points above LIBOR.
Astro-Med’s Statements of Cash Flows for the two years ended January 31, 2012 and 2011 are included on page 34. Net cash flows provided by operating activities was $5,472,000 in the current year compared to net cash provided by operating activities of $1,348,000 in the previous year. The increase in net cash flow from operations for the current year is attributed to the positive cash flow generated from net income and reduced working capital requirements. Accounts receivables increased to $11,800,000 at January 31, 2012, as compared to $11,112,000 at January 31, 2011. The accounts receivable collection cycle decreased to 51 days sales outstanding at January 31, 2012 as compared to 54 days outstanding at prior year end. Inventory balances decreased to $14,129,000 at January 31, 2012, compared to $14,405,000 at the end of the previous year due to the sale of the Asheboro manufacturing operations. Inventory days on hand also decreased to 105 days on hand at the end of the current fiscal year from 124 days at prior year end.
Net cash flow provided by investing activities for fiscal 2012 was $430,000, which included cash used for capital expenditures of approximately $1,155,000 including $480,000 for machinery and equipment, $335,000 for tools and dies, $228,000 for information technology, $102,000 for land and building improvements and $10,000 for furniture and fixtures.
Included in net cash flow used by financing activities for fiscal 2012 were dividends paid of $2,055,000. Dividends paid in fiscal 2011 were $2,036,000. The Company’s annual dividend per share was $0.28 in fiscal 2012 and 2011. The Company has not repurchased any shares of its common stock in fiscal 2012; however, since the inception of the common stock buy back program in fiscal 1997, the Company has repurchased a total of 1,420,010 shares of its common stock. At January 31, 2012, the Company’s Board of Directors has authorized the purchase of an additional 500,000 shares of the Company’s common stock in the future.
Contractual Obligations, Commitments and Contingencies
Astro-Med is subject to contingencies, including legal proceedings and claims arising out of its businesses that cover a wide range of matters, such as: contract and employment claims; workers compensation claims; product liability claims; warranty claims; and claims related to modification, adjustment or replacement of component parts of units sold. While it is impossible to ascertain the ultimate legal and financial liability with respect to contingent liabilities, including lawsuits, we believe that the aggregate amount of such liabilities, if any, in excess of amounts provided or covered by insurance, will not have a material adverse effect on our consolidated financial position or results of operations. It is possible, however, that results of operations for any particular future period could be materially affected by changes in our assumptions or strategies related to these contingencies or changes out of the Company’s control.
18
Table of Contents
Critical Accounting Policies and Estimates
Astro-Med’s discussion and analysis of financial condition and results of operations are based upon the Company’s Consolidated Financial Statements, which have been prepared in accordance with accounting principles generally accepted in the United States. Certain of our accounting policies require the application of judgment in selecting the appropriate assumptions for calculating financial estimates. By their nature, these judgments are subject to an inherent degree of uncertainty. We periodically evaluate the judgments and estimates used for our critical accounting policies to ensure that such judgments and estimates are reasonable for our interim and year-end reporting requirements. These judgments and estimates are based on the Company’s historical experience, current trends and information available from other sources, as appropriate. If different conditions result from those assumptions used in our judgments, the results could be materially different from our estimates. We believe the following are our most critical accounting policies as they require significant judgments and estimates in the preparation of our financial statements:
Revenue Recognition: Our product sales are recognized when all of the following criteria have been met: persuasive evidence of an arrangement exists; price to the buyer is fixed or determinable; delivery has occurred and legal title and risk of loss have passed to the customer; and collectability is reasonably assured. When other significant obligations remain after products are delivered, revenue is recognized only after such obligations are fulfilled. Returns and customer credits are infrequent and are recorded as a reduction to sales. Rights of return are not included in sales arrangements. Revenue associated with products that contain specific customer acceptance criteria is not recognized before the customer acceptance criteria are satisfied. When a sale arrangement involves training or installation, the deliverables in the arrangement are evaluated to determine whether they represent multiple element arrangements. This evaluation occurs at inception of the arrangement and as each item in the arrangement is delivered. The total fee from the arrangement is allocated to each unit of accounting based on its relative fair value. Fair value for each element is established generally based on the sales price charged when the same or similar element is sold separately. We allocate revenue to each element in our multiple-element arrangements based upon their relative selling prices. We determine the selling price for each deliverable based on a selling price hierarchy. The selling price for a deliverable is based on our vendor specific objective evidence (VSOE) if available, third-party evidence (TPE) if VSOE is not available, or estimated selling price (ESP) if neither VSOE nor TPE is available. Revenue allocated to each element is then recognized when the basic revenue recognition criteria for that element have been met. The amount of product revenue recognized is affected by our judgments as to whether an arrangement includes multiple elements.
Infrequently, Astro-Med recognizes revenue for non-recurring engineering (NRE) fees for product modification orders upon completion of agreed-upon milestones. Revenue is deferred for any amounts received prior to completion of milestones. Certain of our NRE arrangements include formal customer acceptance provisions. In such cases, we determine whether we have obtained customer acceptance for the specific milestone before recognizing revenue.
Infrequently, the Company receives requests from customers to hold product being purchased from us for the customers’ convenience. We recognize revenue for such bill and hold arrangements provided the transaction meets the following criteria: a valid business purpose for the arrangement exists; risk of ownership of the purchased product has transferred to the buyer; there is a fixed delivery date that is reasonable and consistent with the buyer’s business purpose; the product is ready for shipment; the payment terms are customary; we have no continuing performance obligation in regards to the product and the product have been segregated from our inventories.
Warranty Claims and Bad Debts: Provisions for the estimated costs for future product warranty claims and bad debts are recorded in cost of sales and general and administrative expense, respectively, at the time a sale is recorded. The amounts recorded are generally based upon historically derived percentages while also factoring in any new business conditions that might impact the historical analysis such as new product introduction for warranty and bankruptcies of particular customers for bad debts. We also periodically evaluate the adequacy of
19
Table of Contents
our reserves for warranty and bad debts recorded in its consolidated balance sheet as a further test to ensure the adequacy of the recorded provisions. Warranty and bad debt analysis often involves subjective analysis of a particular customer’s ability to pay. As a result, significant judgment is required in determining the appropriate amounts to record and such judgments may prove to be incorrect in the future. We believe that our procedures for estimating such amounts are reasonable and historically have not resulted in material adjustments in subsequent periods when the estimates are adjusted to the actual amounts.
Inventories: Inventories are stated at the lower of cost (first-in, first-out) or market. The Company records provisions to write-down obsolete and excess inventory to its estimated net realizable value. The process for evaluating obsolete and excess inventory consists of analyzing the inventory supply on hand and estimating the net realizable value of the inventory based on historical experience, current business conditions and anticipated future sales. We believe that our procedures for estimating such amounts are reasonable and historically have not resulted in material adjustments in subsequent periods when the estimates are adjusted to actual experience.
Income Taxes: A valuation allowance is established when it is “more-likely-than-not” that all or a portion of deferred tax assets will not be realized. A review of all available positive and negative evidence must be considered, including our performance, the market environment in which we operate, length of carryforward periods, existing sales backlog and future sales projections. If actual factors and conditions differ materially from the estimates made by management, the actual realization of the net deferred tax assets or liabilities could vary materially from the amounts previously recorded. At January 31, 2012, the Company has provided valuation allowances for future tax benefits resulting from certain R&D tax credits which could expire unused.
The calculation of tax liabilities involves significant judgment in estimating the impact of uncertainties in the application of complex tax laws and regulations in a multitude of jurisdictions. Although guidance on the accounting for uncertain income taxes prescribes the use of a recognition and measurement model, the determination of whether an uncertain tax position has met those thresholds will continue to require significant judgment by management. If the ultimate resolution of tax uncertainties is different from what we have estimated, our income tax expense could be materially impacted.
Long-Lived Assets and Goodwill: The impairment of long-lived assets to be held and used are reviewed for impairment whenever events or changes in circumstances indicate that the carrying amount of such assets may not be recoverable. Determination of recoverability is based on an estimate of undiscounted future cash flows resulting from the use of the asset and its eventual disposition. Measurement of an impairment loss for long-lived assets that management expects to hold and use is based on the fair value of the asset.
Management evaluates the recoverability of goodwill annually or more frequently if events or changes in circumstances, such as declines in sales, earnings or cash flows, or material adverse changes in the business climate, indicate that the carrying value of an asset might be impaired. During the fourth quarter of fiscal 2012, we adopted new accounting guidance which simplifies goodwill impairment testing. Under the new guidance, goodwill is first qualitatively assessed to determine whether further impairment testing is necessary. Factors that management considers in this assessment include macroeconomic conditions, industry and market considerations, overall financial performance (both current and projected), changes in management and strategy and changes in the composition or carrying amount of net assets. If this qualitative assessment indicates that it is more likely than not that the fair value of a reporting unit is less than its carrying amount, a two step process is then performed. Step one compares the fair value of the reporting unit with its carrying value, including goodwill. If the carrying amount exceeds the fair value of the reporting unit, step two is required to determine if there is an impairment of the goodwill. Step two compares the implied fair value of the reporting unit goodwill to the carrying amount of the goodwill. We estimate the fair value of our reporting units using the income approach based upon a discounted cash flow model. We believe that this approach is appropriate because it provides a fair value estimate based upon the reporting unit’s expected long–term operating cash flow performance. In addition, the Company uses the market approach, which compares the reporting unit to publicly-traded companies and transactions involving similar business, to support the conclusions based upon the income approach. The income approach requires the use of many assumptions and estimates including future revenue, expenses, capital expenditures, and working capital, as well as discount factors and income tax rates.
20
Table of Contents
We performed a qualitative assessment for our 2012 analysis of goodwill. Based on this assessment, management does not believe that it is more likely than not that the carrying value of the reporting units exceed their fair values. Accordingly, no further testing was performed as management believes that there are no impairment issues in regards to goodwill at this time.
Share-Based Compensation: Share-based compensation expense is based on the estimated fair value of each option on the date of grant using the Black-Scholes option-pricing model. Our estimate of share-based compensation requires a number of complex and subjective assumptions including our stock price volatility, employee exercise patterns (expected life of the options) the risk free interest rate and the Company’s dividend yield. The stock price volatility assumption is based on the historical weekly price data of our common stock over a period equivalent to the weighted average expected life of our options. Management evaluated whether there were factors during that period which were unusual and would distort the volatility figure if used to estimate future volatility and concluded that there were no such factors. In determining the expected life of the option grants, the Company has observed the actual terms of prior grants with similar characteristics and the actual vesting schedule of the grant and has assessed the expected risk tolerance of different option groups. The risk-free interest rate used in the model is based on the actual U.S. Treasury zero coupon rates for bonds matching the expected term of the option as of the option grant date. The dividend assumption is based upon the prior year’s average dividend yield. No compensation expense is recognized for options that are forfeited for which the employee does not render the requisite service.
Recent Accounting Pronouncements
Reference is made to Note 1 of our Consolidated Financial Statements included herein.
Item 7A. Quantitative and Qualitative Disclosures about Market Risk
The registrant is a smaller reporting company and is not required to provide this information.
21
Table of Contents
Item 8. Financial Statements and Supplementary Data
The consolidated financial statements required under this item are submitted as a separate section of this report on the pages indicated at Item 15(a)(1). The supplementary data regarding quarterly results of operations is set forth in the following table.
QUARTERLY FINANCIAL DATA (Unaudited)
(Dollars in Thousands, Except Per Share Amounts)
| 2012 | ||||||||||||||||
| Q1 | Q2 (1) | Q3 (2) | Q4 (3) | |||||||||||||
| Net Sales |
$ | 18,860 | $ | 20,336 | $ | 19,569 | $ | 20,429 | ||||||||
| Gross Profit |
$ | 7,501 | $ | 7,901 | $ | 8,014 | $ | 8,367 | ||||||||
| Net Income |
$ | 431 | $ | 1,046 | $ | 800 | $ | 854 | ||||||||
| Net Income Per Common Share—Basic |
$ | 0.06 | $ | 0.14 | $ | 0.11 | $ | 0.12 | ||||||||
| Net Income Per Common Share—Diluted |
$ | 0.06 | $ | 0.14 | $ | 0.11 | $ | 0.11 | ||||||||
| 2011 | ||||||||||||||||
| Q1 (4) | Q2 | Q3 (5) | Q4 | |||||||||||||
| Net Sales |
$ | 17,077 | $ | 17,753 | $ | 18,329 | $ | 17,857 | ||||||||
| Gross Profit |
$ | 6,865 | $ | 7,024 | $ | 7,401 | $ | 7,376 | ||||||||
| Net Income |
$ | 430 | $ | 323 | $ | 792 | $ | 517 | ||||||||
| Net Income Per Common Share—Basic |
$ | 0.06 | $ | 0.04 | $ | 0.11 | $ | 0.07 | ||||||||
| Net Income Per Common Share—Diluted |
$ | 0.06 | $ | 0.04 | $ | 0.11 | $ | 0.07 | ||||||||
| (1) | Second quarter fiscal year 2012 net income includes $300,000 or $0.04 per share related to the proceeds of a key-man life insurance policy. |
| (2) | Third quarter fiscal year 2012 net income includes a tax benefit of $113,000 or $0.02 per share recorded as a result of a favorable adjustment in the filing of the prior year’s tax returns. |
| (3) | Fourth quarter fiscal 2012 net income includes a loss on the sale of the Asheboro operations, net of taxes of $450,000 or $0.06 per share and a tax benefit of $44,000 or $0.01 per share related to the favorable adjustment in the filing of the prior year’s tax return. |
| (4) | First quarter fiscal year 2011 net income includes gain on legal settlement, net of taxes of $63,000 or $0.01 per share. |
| (5) | Third quarter fiscal year 2011 net income includes a tax benefit of $241,000 or $0.03 per share related to the resolution of a previously uncertain tax position and a benefit of $143,000 or $0.02 per share recorded as a result of a favorable adjustment in the filing of the prior year’s tax returns. |
Item 9. Changes in and Disagreements with Accountants on Accounting and Financial Disclosure
None
Item 9A. Controls and Procedures
Evaluation of Disclosure Controls and Procedures
Our management has evaluated, under the supervision and with the participation of our Chief Executive Officer and Chief Financial Officer, the effectiveness of our disclosure controls and procedures as of the end of the period covered by this Annual Report on Form 10-K pursuant to Rules 13a-15(e) and 15d-15(e) under the Securities Exchange Act of 1934, as amended (Exchange Act). Based on that evaluation, our Chief Executive Officer and our Chief Financial Officer have concluded that our disclosure controls and procedures are effective at January 31, 2012 to ensure that the information required to be disclosed in our Exchange Act reports is (1) recorded, processed, summarized and reported in a timely manner and (2) accumulated and communicated to our management, including our Chief Executive Officer and our Chief Financial Officer, as appropriate, to allow timely decisions regarding required disclosure.
22
Table of Contents
Management’s Annual Report on Internal Control over Financial Reporting
The Company’s management is responsible for establishing and maintaining adequate internal control over financial reporting (as such term is defined in Rules 13a-15(f) and 15d-15(f) under the Exchange Act). The Company’s internal control over financial reporting is designed to provide reasonable assurance regarding the reliability of its financial reporting and the preparation of published financial statements in accordance with generally accepted accounting principles.
Because of the inherent limitations, internal control over financial reporting may not prevent or detect misstatements. Also, projections of any evaluation of effectiveness to future periods are subject to risk that controls may become inadequate because of changes in conditions, or the degree of compliance may deteriorate.
Management conducted its evaluation of the effectiveness of its internal control over financial reporting based on the framework in “Internal Control-Integrated Framework” issued by the Committee of Sponsoring Organizations of the Treadway Commission (“COSO”) as of January 31, 2012. Based on this assessment, the principal executive officer and principal financial officer believe that as of January 31, 2012, the Company’s internal control over financial reporting was effective based on criteria set forth by COSO in “Internal Control-Integrated Framework.”
This annual report does not include an attestation report of the Company’s registered public accounting firm regarding internal control over financial reporting. Management’s report was not subject to attestation by the Company’s registered public accounting firm pursuant to the rules of the Securities and Exchange Commission that permit the Company to provide only management’s report in this annual report.
Changes in Internal Controls over Financial Reporting
There have been no changes in the Company’s internal control over financial reporting during our most recent fiscal quarter that have materially affected, or are reasonably likely to affect, our internal control over financial reporting.
Nothing to Report
23
Table of Contents
PART III
Item 10. Directors, Executive Officers and Corporate Governance
The response to this item is incorporated by reference to the Company’s definitive proxy statement for the 2012 annual meeting of shareholders.
The following sets forth certain information with respect to all executive officers of the Company. All officers serve at the pleasure of the Board of Directors.
| Name |
Age | Position | ||||
| Everett V. Pizzuti |
75 | President, Chief Executive Officer and Director | ||||
| Joseph P. O’Connell |
68 | Senior Vice President, Treasurer and Chief Financial Officer | ||||
| Elias G. Deeb |
69 | Vice President—Media Products | ||||
| Gordon Bentley |
65 | Vice President—Information Technology | ||||
| Michael J. Sullivan |
61 | Vice President and Chief Technology Officer | ||||
| Michael M. Morawetz |
52 | Vice President—International Branches | ||||
| Stephen M. Petrarca |
49 | Vice President—Instrument Manufacturing | ||||
| Erik J. Mancyak |
36 | Vice President and Corporate Controller | ||||
| Eric E. Pizzuti |
45 | Vice President & General Manager—QuickLabel Systems | ||||
| Michael J. Natalizia |
48 | Vice President and Chief Technology Officer | ||||
Mr. Everett V. Pizzuti was appointed Chief Executive Officer of the Company on June 29, 2011 and has been functioning as President since 1971. Mr. Pizzuti had served as Astro-Med’s Chief Operating Officer from 1971 to 2011 and was previously a Vice President of the Company.
Mr. O’Connell joined the Company in 1996. He previously held senior financial management positions with Cherry Tree Products Inc., IBI Corporation and Avery Dennison Corporation. Mr. O’Connell is also Assistant Secretary of the Company. He was appointed to the position of Senior Vice President in 2007.
Mr. Deeb has held the position identified since 1987. In 1985, he was named General Manager—Media Products after having been Vice President and General Manager since 1981 of a business sold by the Company in 1984. On March 9, 2012, Mr. Deeb retired.
Mr. Bentley was appointed Vice President of Information Technology in 2007. He was previously Director of Information Technology and held other various operations positions since joining the Company in 1980.
Mr. Sullivan was appointed Vice President and Chief Technology Officer in 2000. On March 9, 2012, Mr. Sullivan relinquished this position in order to assume the position of Senior Research Fellow.
Mr. Morawetz was appointed Vice President International Branches in 2006. He was previously the General Manager of Branch Operations for the Company’s German Subsidiary, having joined the Company in 1989.
Mr. Petrarca was appointed Vice President of Instrument Manufacturing in 1998. He has previously held positions as General Manager of Manufacturing, Manager of Grass Operations and Manager of Grass Sales. He has been with the Company since 1980.
Mr. Mancyak was appointed Vice President of the Company in 2011. He also holds the position of Corporate Controller and Principal Accounting Officer to which he was appointed in 2009. He served as Assistant Corporate Controller of the Company from 2008 to 2009 and prior to that was an Accounting Manager of the Company beginning in 2005. Prior to 2005, Mr. Mancyak was Senior Treasury Analyst at American Power Conversion and an auditor at the international accounting firm of KPMG LLP.
Mr. Eric E. Pizzuti was appointed Vice President and General Manager of the Company’s QuickLabel System business segment on March 9, 2012. Prior to this appointment, Mr. Pizzuti held the position of Vice President and Worldwide Director of Sales for QuickLabel Systems from March 2010 and Worldwide Director of Sales from March 2006 through March 2010. Mr. Pizzuti has held various other positions since joining the Company in 1996.
24
Table of Contents
Mr. Natalizia was appointed Vice President and Chief Technology Officer of Astro-Med, Inc. on March 9, 2012. Prior to this appointment, Mr. Natalizia held the position of Director of Product Development of the Company since 2005.
Code of Ethics
The Company has adopted a Code of Ethics which applies to all directors, officers and employees of the Company, including the Chief Executive Officer (“CEO”), Chief Financial Officer (“CFO”) and Corporate Controller, as supplemented by a Code of Ethical Conduct for the Chief Executive Officer and Senior Financial Officers, which meets the requirements of a “code of ethics” as defined in Item 406 of Regulation S-K. A copy of the Code of Ethics will be provided to shareholders, without charge, upon request directed to Investor Relations or can be obtained on the Company’s website, (www.astro-medinc.com), under the heading “Corporate Governance—Charters.” The Company will disclose any amendment to, or waiver of, a provision of the Codes for the CEO, CFO, Corporate Controller or persons performing similar functions by posting such information on its website and filing a Form 8-K as required under the rules of the NASDAQ Global Market.
Item 11. Executive Compensation
The response to this item is incorporated by reference to the Company’s definitive Proxy Statement for the 2012 Annual Meeting of Shareholders.
The information set forth under the heading “Compensation Committee Report” in the Company’s definitive Proxy Statement is furnished and shall not be deemed as filed for purposes of Section 18 of the Securities Act of 1934, as amended, and is not deemed incorporated by reference in any filing under the Securities Act of 1933, as amended.
Item 12. Security Ownership of Certain Beneficial Owners and Management and Related Stockholders Matters
The response to this item is incorporated by reference to the Company’s definitive Proxy Statement for the 2012 Annual Meeting of Shareholders.
Equity Compensation Plan Information
The following table sets forth information about the Company’s equity compensation plans as of January 31, 2012:
| Plan Category |
Number of Securities to be Issued Upon Exercise of Outstanding Options, Warrants and Rights |
Weighted- Average Exercise Price of Outstanding Options, Warrants and Rights |
Number of Securities Remaining Available for Future Issuances Under Equity Compensation Plans |
|||||||||
| Equity Compensation Plans Approved by Security Holders |
888,097 | (1) | $ | 8.27 | 683,444 | (2) | ||||||
| Equity Compensation Plans Not Approved by Security Holders |
— | — | — | |||||||||
|
|
|
|
|
|
|
|||||||
| Total |
888,097 | (1) | $ | 8.27 | 683,444 | (2) | ||||||
| (1) | Includes 348,202 shares issuable upon exercise of outstanding options granted under the Company’s incentive stock option plans, 214,189 shares issuable upon exercise of outstanding options granted under the Company’s non-qualified stock option plans under which options may be granted to officers and key employees, 9,625 shares issuable upon exercise of outstanding stock options granted under the Astro-Med, Inc. Non-Employee Director Stock Option Plan and 316,081 shares issuable upon exercise of outstanding options granted under the Company’s 2007 Equity Incentive Plan. |
| (2) | Shares under the Astro-Med, Inc. 2007 Equity Incentive Plan. |
25
Table of Contents
Additional information regarding these equity compensation plans is contained in Note 7 to the Company’s Consolidated Financial Statements included in Item 15 hereto.
Item 13. Certain Relationships, Related Transactions and Director Independence
The response to this item is incorporated by reference to the Company’s definitive Proxy Statement for the 2012 Annual Meeting of Shareholders.
Item 14. Principal Accountant Fees and Services
The information required by this item is incorporated herein by reference to the Company’s definitive Proxy Statement for the 2012 Annual Meeting of Shareholders.
26
Table of Contents
PART IV
Item 15. Exhibits and Financial Statement Schedule
(a)(1) Financial Statements:
The following documents are included as part of this Annual Report filed on Form 10-K:
| Page | ||||
| 30 | ||||
| 31 | ||||
| Consolidated Statements of Operations—Years Ended January 31, 2012 and 2011 |
32 | |||
| 33 | ||||
| Consolidated Statements of Cash Flows—Years Ended January 31, 2012 and 2011 |
34 | |||
| 35-50 | ||||
| (a)(2) Financial Statement Schedule: |
||||
| Schedule II—Valuation and Qualifying Accounts and Reserves—Years Ended January 31, 2012 and 2011 |
51 | |||
27
Table of Contents
All other schedules for which provision is made in the applicable accounting regulations of the Securities and Exchange Commission are not required under the related instructions or are inapplicable, and therefore, have been omitted.
(a)(3) Exhibits:
| Exhibit Number |
||
| (3A) | Articles of Incorporation of the Company and all amendments thereto (filed as Exhibit No. 3A to the Company’s report on Form 10-Q for the quarter ended August 1, 1992 and by this reference incorporated herein). | |
| (3B) | By-laws of the Company as amended to date (filed as Exhibit No. 3B to the Company’s Annual Report on Form 10-K for the fiscal year ended January 31, 2008 and by this reference incorporated herein). | |
| (4) | Specimen form of common stock certificate of the Company (filed as Exhibit No. 4 to the Company’s report on Form 10-K for the year ended January 31, 1985 and by this reference incorporated herein). | |
| (10.1) | Astro-Med, Inc. 1993 Incentive Stock Option Plan filed as Exhibit 4.3 to Registration Statement on Form S-8, Registration No. 333-24127, and incorporated by reference herein.* | |
| (10.2) | Astro-Med, Inc. Non-Employee Director Stock Plan filed as Exhibit 4.3 to Registration Statement on Form S-8, Registration No. 333-24123, and incorporated by reference herein.* | |
| (10.3) | Astro-Med, Inc. 1997 Incentive Stock Option Plan, as amended, filed as Exhibit 4.3 to Registration Statements on Form S-8, Registration Nos. 333-32315, 333-93565 and 333-44414, and incorporated by reference herein.* | |
| (10.4) | Astro-Med, Inc. 1998 Non-Qualified Stock Option Plan, as amended, filed as Exhibit 4.3 to Registration Statement on Form S-8, Registration Nos. 333-62431 and 333-63526, and incorporated by reference herein.* | |
| (10.5) | Astro-Med, Inc. 2007 Equity Incentive Plan as filed as Appendix A to the Definitive Proxy Statement filed on Schedule 14A for the 2007 annual shareholders meeting and incorporated by reference herein.* | |
| (10.6) | Astro-Med, Inc. Management Bonus Plan (Group III) filed on Form 8-K on March 19, 2010 and by this reference incorporated herein.* | |
| (10.7) | Astro-Med, Inc. Management Bonus Plan—Vice President International Branches filed as Exhibit 10.9 to the Company’s Annual Report on Form 10-K for the year ended January 31, 2009 and by this reference incorporated herein.* | |
| (10.8) | Astro-Med, Inc. Non-Employee Directors Compensation Program.* | |
| (21) | List of Subsidiaries of the Company. | |
| (23.1) | Consent of Ernst & Young LLP. | |
| (31.1) | Certification of Chief Executive Officer Pursuant to Section 302 of the Sarbanes-Oxley Act of 2002. | |
| (31.2) | Certification of Chief Financial Officer Pursuant to Section 302 of the Sarbanes-Oxley Act of 2002. | |
| (32.1) | Certification of Chief Executive Officer Pursuant to 18 U.S.C. Section 1350, as adopted pursuant to Section 906 of the Sarbanes-Oxley Act of 2002. | |
| (32.2) | Certification of Chief Financial Officer Pursuant to 18 U.S.C. Section 1350, as adopted pursuant to Section 906 of the Sarbanes-Oxley Act of 2002. | |
| (101) | The following materials from Registrant’s Annual Report on Form 10-K for the year ended January 31, 2012, formatted in XBRL (Extensible Business Reporting Language): (i) the Consolidated Balance Sheets, (ii) the Consolidated Statements of Operations, (iii) the Consolidated Statements of Comprehensive Income and Changes in Shareholders’ Equity, (iv) the Consolidated Statements of Cash Flows, and (v) Notes to Consolidated Financial Statements, tagged as blocks of text. | |
| * | Management contract or compensatory plan or arrangement. |
28
Table of Contents
SIGNATURES
Pursuant to the requirements of Section 13 or 15(d) of the Securities Exchange Act of 1934, the registrant has duly caused this report to be signed on its behalf by the undersigned, thereunto duly authorized.
| ASTRO-MED, INC. (Registrant) | ||||||
| Date: April 4, 2012 |
By: |
/S/ EVERETT V. PIZZUTI | ||||
| (Everett V. Pizzuti, President and Chief Executive Officer) | ||||||
Each person whose signature appears below constitutes and appoints each of Everett V. Pizzuti or Joseph P. O’Connell, or any of them, each acting alone, his true and lawful attorneys-in-fact and agents, with full power of substitution and resolution, for such person and in his name, place and stead, in any and all capacities in connection with the annual report on Form 10-K of Astro-Med, Inc. for the year ended January 31, 2012 to sign any and all amendments to the Form 10-K, and to file the same, with all exhibits thereto, and other documents in connection therewith, the Securities and Exchange Commission, granting unto said attorneys-in-fact and agents, each acting alone, full power and authority to do and perform each and every act and thing requisite and necessary to be done in and about the premises, as fully to all intents and purposes as he might or could do in person, hereby ratifying and confirming all that said attorneys-in-fact and agents, or their substitute, may lawfully do or cause to be done by virtue hereof.
Pursuant to the requirements of the Securities Exchange Act of 1934, this report has been signed below by the following persons on behalf of the registrant and in the capacities and on the date indicated.
| Name |
Title |
Date | ||
| /S/ EVERETT V. PIZZUTI Everett V. Pizzuti |
President, Chief Executive Officer and Director (Principal Executive Officer) |
April 4, 2012 | ||
| /S/ JOSEPH P. O’CONNELL Joseph P. O’Connell |
Senior Vice President, Treasurer and Chief Financial Officer (Principal Financial Officer) |
April 4, 2012 | ||
| /S/ ERIK J. MANCYAK Erik J. Mancyak |
Vice President and Corporate Controller (Principal Accounting Officer) |
April 4, 2012 | ||
| /S/ JACQUES V. HOPKINS Jacques V. Hopkins |
Chairman of the Board of Directors and Director |
April 4, 2012 | ||
| /S/ HERMANN VIETS Hermann Viets |
Director |
April 4, 2012 | ||
| /S/ GRAEME MACLETCHIE Graeme MacLetchie |
Director |
April 4, 2012 | ||
| /S/ MITCHELL I. QUAIN Mitchell I. Quain |
Director |
April 4, 2012 | ||
29
Table of Contents
REPORT OF INDEPENDENT REGISTERED PUBLIC ACCOUNTING FIRM
The Board of Directors and Shareholders of
Astro-Med, Inc.
We have audited the accompanying consolidated balance sheets of Astro-Med, Inc. and subsidiaries (the “Company”) as of January 31, 2012 and 2011 and the related consolidated statements of operations, comprehensive income and changes in shareholders’ equity, and cash flows for each of the two years in the period ended January 31, 2012. Our audits also included the financial statement schedule listed in the index at Item 15(a)(2). These financial statements and schedule are the responsibility of the Company’s management. Our responsibility is to express an opinion on these financial statements and schedule based on our audit.
We conducted our audits in accordance with the standards of the Public Company Accounting Oversight Board (United States). Those standards require that we plan and perform the audit to obtain reasonable assurance about whether the financial statements are free of material misstatement. We were not engaged to perform an audit of the Company’s internal control over financial reporting. Our audits included consideration of internal control over financial reporting as a basis for designing audit procedures that are appropriate in the circumstances, but not for the purpose of expressing an opinion on the effectiveness of the Company’s internal control over financial reporting. Accordingly, we express no such opinion. An audit also includes examining, on a test basis, evidence supporting the amounts and disclosures in the financial statements, assessing the accounting principles used and significant estimates made by management, and evaluating the overall financial statement presentation. We believe that our audits provide a reasonable basis for our opinion.
In our opinion, the consolidated financial statements referred to above present fairly, in all material respects, the financial position of Astro-Med, Inc. and subsidiaries as of January 31, 2012 and 2011 and the consolidated results of its operations and its cash flows for each of the two years in the period ended January 31, 2012, in conformity with U.S. generally accepted accounting principles. Also, in our opinion, the related financial statement schedule, when considered in relation to the basic financial statements taken as a whole, presents fairly, in all material respects, the information set forth therein.
/s/ ERNST & YOUNG LLP
Providence, Rhode Island
April 4, 2012
30
Table of Contents
CONSOLIDATED BALANCE SHEETS
As of January 31, 2012 and 2011
| 2012 | 2011 | |||||||
| ASSETS | ||||||||
| CURRENT ASSETS |
||||||||
| Cash and Cash Equivalents |
$ | 11,703,621 | $ | 7,720,135 | ||||
| Securities Available for Sale |
11,335,924 | 12,910,232 | ||||||
| Accounts Receivable, net of reserves of $428,409 in 2012 and $546,870 in 2011 |
11,800,481 | 11,111,974 | ||||||
| Inventories |
14,128,599 | 14,404,914 | ||||||
| Deferred Tax Assets |
2,618,578 | 2,577,166 | ||||||
| Prepaid Expenses and Other Current Assets |
891,047 | 975,928 | ||||||
|
|
|
|
|
|||||
| Total Current Assets |
52,478,250 | 49,700,349 | ||||||
| PROPERTY, PLANT AND EQUIPMENT |
||||||||
| Land and Improvements |
1,232,862 | 1,210,463 | ||||||
| Buildings and Improvements |
13,021,888 | 13,011,082 | ||||||
| Machinery and Equipment |
23,621,321 | 23,926,971 | ||||||
|
|
|
|
|
|||||
| 37,876,071 | 38,148,516 | |||||||
| Less Accumulated Depreciation |
(26,705,341 | ) | (25,606,561 | ) | ||||
|
|
|
|
|
|||||
| Total Property, Plant and Equipment, net |
11,170,730 | 12,541,955 | ||||||
|
|
|
|
|
|||||
| OTHER ASSETS |
||||||||
| Intangible Assets, net |
— | 331,389 | ||||||
| Goodwill |
2,336,721 | 2,336,721 | ||||||
| Note Receivable |
969,700 | — | ||||||
| Other |
106,735 | 88,799 | ||||||
|
|
|
|
|
|||||
| Total Other Assets |
3,413,156 | 2,756,909 | ||||||
|
|
|
|
|
|||||
| TOTAL ASSETS |
$ | 67,062,136 | $ | 64,999,213 | ||||
|
|
|
|
|
|||||
| LIABILITIES AND SHAREHOLDERS’ EQUITY | ||||||||
| CURRENT LIABILITIES |
||||||||
| Accounts Payable |
$ | 2,540,116 | $ | 2,748,293 | ||||
| Accrued Compensation |
3,228,728 | 2,179,448 | ||||||
| Other Accrued Expenses |
1,807,675 | 1,750,515 | ||||||
| Deferred Revenue |
623,223 | 787,988 | ||||||
| Income Taxes Payable |
72,725 | 36,979 | ||||||
|
|
|
|
|
|||||
| Total Current Liabilities |
8,272,467 | 7,503,223 | ||||||
| Deferred Tax Liabilities |
1,894,104 | 2,060,418 | ||||||
| Other Long Term Liabilities |
1,232,699 | 1,146,978 | ||||||
|
|
|
|
|
|||||
| TOTAL LIABILITIES |
11,399,270 | 10,710,619 | ||||||
|
|
|
|
|
|||||
| SHAREHOLDERS’ EQUITY |
||||||||
| Preferred Stock, $10 Par Value, Authorized 100,000 shares, None Issued |
— | — | ||||||
| Common Stock, $0.05 Par Value, Authorized 13,000,000 shares; Issued 8,956,488 shares in 2012 and 8,660,270 shares in 2011 |
447,829 | 433,017 | ||||||
| Additional Paid-in Capital |
37,964,204 | 36,586,226 | ||||||
| Retained Earnings |
27,919,367 | 26,842,890 | ||||||
| Treasury Stock, at Cost, 1,542,276 shares in 2012 and 1,414,981 shares in 2011 |
(10,789,805 | ) | (9,840,052 | ) | ||||
| Accumulated Other Comprehensive Income |
121,271 | 266,513 | ||||||
|
|
|
|
|
|||||
| Total Shareholders’ Equity |
55,662,866 | 54,288,594 | ||||||
|
|
|
|
|
|||||
| TOTAL LIABILITIES AND SHAREHOLDERS’ EQUITY |
$ | 67,062,136 | $ | 64,999,213 | ||||
|
|
|
|
|
|||||
See Notes to the Consolidated Financial Statements.
31
Table of Contents
CONSOLIDATED STATEMENTS OF OPERATIONS
For the years ended January 31
| 2012 | 2011 | |||||||
| Net Sales |
$ | 79,193,202 | $ | 71,016,111 | ||||
| Cost of Sales |
47,410,034 | 42,349,870 | ||||||
|
|
|
|
|
|||||
| Gross Profit |
31,783,168 | 28,666,241 | ||||||
| Costs and Expenses: |
||||||||
| Selling and Marketing |
17,979,996 | 16,690,197 | ||||||
| General and Administrative |
3,961,557 | 4,300,525 | ||||||
| Research and Development |
5,243,460 | 5,020,020 | ||||||
|
|
|
|
|
|||||
| Operating Expenses |
27,185,013 | 26,010,742 | ||||||
| Loss on Sale of Asheboro Operations |
(681,440 | ) | — | |||||
| Gain on Legal Settlement |
— | 104,448 | ||||||
|
|
|
|
|
|||||
| Operating Income |
3,916,715 | 2,759,947 | ||||||
| Other Income: |
||||||||
| Investment Income |
81,781 | 49,040 | ||||||
| Other, Net |
233,997 | (25,373 | ) | |||||
|
|
|
|
|
|||||
| 315,778 | 23,667 | |||||||
|
|
|
|
|
|||||
| Income before Income Taxes |
4,232,493 | 2,783,614 | ||||||
| Income Tax Provision |
1,100,802 | 721,845 | ||||||
|
|
|
|
|
|||||
| Net Income |
$ | 3,131,691 | $ | 2,061,769 | ||||
|
|
|
|
|
|||||
| Net Income Per Common Share—Basic |
$ | 0.43 | $ | 0.28 | ||||
|
|
|
|
|
|||||
| Net Income Per Common Share—Diluted |
$ | 0.42 | $ | 0.28 | ||||
|
|
|
|
|
|||||
| Weighted Average Number of Common Shares Outstanding—Basic |
7,324,568 | 7,271,403 | ||||||
| Dilutive effect of options outstanding |
104,406 | 198,357 | ||||||
|
|
|
|
|
|||||
| Weighted Average Number of Common Shares Outstanding—Diluted |
7,428,974 | 7,469,760 | ||||||
|
|
|
|
|
|||||
| Dividends Declared Per Common Share |
$ | 0.28 | $ | 0.28 | ||||
|
|
|
|
|
|||||
See Notes to the Consolidated Financial Statements.
32
Table of Contents
CONSOLIDATED STATEMENTS OF COMPREHENSIVE INCOME AND CHANGES IN
SHAREHOLDERS’ EQUITY
For the years ended January 31
| 2012 | 2011 | |||||||
| Comprehensive Income: |
||||||||
| Net Income |
$ | 3,131,691 | $ | 2,061,769 | ||||
| Other Comprehensive Loss, net of taxes and reclassification adjustments: |
||||||||
| Foreign currency translation adjustments |
(151,777 | ) | (65,677 | ) | ||||
| Unrealized gain on securities available for sale |
6,535 | 14,722 | ||||||
|
|
|
|
|
|||||
| Other comprehensive loss |
(145,242 | ) | (50,955 | ) | ||||
|
|
|
|
|
|||||
| Comprehensive Income |
$ | 2,986,449 | $ | 2,010,814 | ||||
|
|
|
|
|
|||||
| Shareholders’ Equity |
||||||||
| Common Stock: |
||||||||
| Balance at beginning of year |
$ | 433,017 | $ | 416,146 | ||||
| Par value from the exercise of employee stock options |
941 | 7,029 | ||||||
| Employee option exercise and buyback |
13,871 | 9,842 | ||||||
|
|
|
|
|
|||||
| Balance at end of year |
$ | 447,829 | $ | 433,017 | ||||
|
|
|
|
|
|||||
| Additional Paid-In Capital: |
||||||||
| Balance at beginning of year |
$ | 36,586,226 | $ | 34,712,369 | ||||
| Proceeds from the exercise of employee stock options |
79,565 | 505,609 | ||||||
| Share-based compensation |
207,884 | 333,240 | ||||||
| Tax benefit of employee stock options |
305,656 | 384,503 | ||||||
| Contribution of treasury shares to employee stock options plan |
10,136 | 10,773 | ||||||
| Employee option exercise and buyback |
774,737 | 639,732 | ||||||
|
|
|
|
|
|||||
| Balance at end of year |
$ | 37,964,204 | $ | 36,586,226 | ||||
|
|
|
|
|
|||||
| Retained Earnings: |
||||||||
| Balance at beginning of year |
$ | 26,842,890 | $ | 26,816,899 | ||||
| Net income |
3,131,691 | 2,061,769 | ||||||
| Dividends paid |
(2,055,214 | ) | (2,035,778 | ) | ||||
|
|
|
|
|
|||||
| Balance at end of year |
$ | 27,919,367 | $ | 26,842,890 | ||||
|
|
|
|
|
|||||
| Treasury Stock: |
||||||||
| Balance at beginning of year |
$ | (9,840,052 | ) | $ | (8,030,335 | ) | ||
| Shares issued to employee stock ownership plan |
88,150 | 148,605 | ||||||
| Purchase of treasury stock |
— | (975,682 | ) | |||||
| Purchase of common stock from related parties |
(1,037,903 | ) | (982,640 | ) | ||||
|
|
|
|
|
|||||
| Balance at end of year |
$ | (10,789,805 | ) | $ | (9,840,052 | ) | ||
|
|
|
|
|
|||||
| Accumulated Other Comprehensive Income: |
||||||||
| Balance at beginning of year |
$ | 266,513 | $ | 317,468 | ||||
| Other comprehensive loss |
(145,242 | ) | (50,955 | ) | ||||
|
|
|
|
|
|||||
| Balance at end of year |
121,271 | 266,513 | ||||||
|
|
|
|
|
|||||
| Total Shareholders’ Equity |
$ | 55,662,866 | $ | 54,288,594 | ||||
|
|
|
|
|
|||||
See Notes to the Consolidated Financial Statements.
33
Table of Contents
CONSOLIDATED STATEMENTS OF CASH FLOWS
For the years ended January 31
| 2012 | 2011 | |||||||
| Cash Flows from Operating Activities: |
||||||||
| Net Income |
$ | 3,131,691 | $ | 2,061,769 | ||||
| Adjustments to Reconcile Net Income to Net Cash Provided By Operating Activities: |
||||||||
| Depreciation and Amortization |
1,575,665 | 1,575,935 | ||||||
| Employee Stock Ownership Plan Contribution |
100,000 | 80,000 | ||||||
| Share-Based Compensation |
207,884 | 333,240 | ||||||
| Deferred Income Tax Benefit |
(207,726 | ) | (134,386 | ) | ||||
| Excess Tax Benefit From Share-Based Compensation |
(305,656 | ) | (384,503 | ) | ||||
| Legal Settlement Receivable |
— | 1,495,051 | ||||||
| Loss on Sale of Asheboro Operations |
617,877 | — | ||||||
| Loss on Sale of Securities Available for Sale |
— | 30,961 | ||||||
| Changes in Assets and Liabilities, Net of Impact of Divestiture: |
||||||||
| Accounts Receivable |
(688,507 | ) | (1,939,117 | ) | ||||
| Inventories |
(4,508 | ) | (2,365,609 | ) | ||||
| Accounts Payable and Accrued Expenses |
679,291 | 791,685 | ||||||
| Income Taxes Payable |
562,147 | (290,837 | ) | |||||
| Other |
(195,841 | ) | 93,375 | |||||
|
|
|
|
|
|||||
| Net Cash Provided by Operating Activities |
5,472,317 | 1,347,564 | ||||||
| Cash Flows from Investing Activities: |
||||||||
| Proceeds from Sales/Maturities of Securities Available for Sale |
10,155,000 | 9,644,039 | ||||||
| Purchases of Securities Available for Sale |
(8,570,791 | ) | (12,957,711 | ) | ||||
| Additions to Property, Plant and Equipment |
(1,154,693 | ) | (2,089,858 | ) | ||||
|
|
|
|
|
|||||
| Net Cash Provided by/Used in Investing Activities |
429,516 | (5,403,530 | ) | |||||
| Cash Flows from Financing Activities: |
||||||||
| Proceeds (Contributions) from Common Shares Issued Under Employee Benefit Plans and Employee Stock Option Plans, Net of Payment of Minimum Tax Withholdings |
(168,789 | ) | 434,016 | |||||
| Cash Settlement of Stock Options |
— | (186,054 | ) | |||||
| Purchases of Treasury Stock |
— | (975,682 | ) | |||||
| Excess Tax Benefit from Share-Based Compensation |
305,656 | 384,503 | ||||||
| Dividends Paid |
(2,055,214 | ) | (2,035,778 | ) | ||||
|
|
|
|
|
|||||
| Net Cash Used in Financing Activities |
(1,918,347 | ) | (2,378,995 | ) | ||||
|
|
|
|
|
|||||
| Net Increase (Decrease) in Cash and Cash Equivalents |
3,983,486 | (6,434,961 | ) | |||||
| Cash and Cash Equivalents, Beginning of Year |
7,720,135 | 14,155,096 | ||||||
|
|
|
|
|
|||||
| Cash and Cash Equivalents, End of Year |
$ | 11,703,621 | $ | 7,720,135 | ||||
|
|
|
|
|
|||||
| Supplemental Information: |
||||||||
| Cash Paid During the Period for: |
||||||||
| Income Taxes, Net of Refunds |
$ | 740,041 | $ | 1,080,994 | ||||
See Notes to the Consolidated Financial Statements.
34
Table of Contents
NOTES TO CONSOLIDATED FINANCIAL STATEMENTS
January 31, 2012 and 2011
Note 1—Summary of Significant Accounting Policies
Basis of Presentation: The accompanying financial data has been prepared by us pursuant to the rules and regulations of the U.S. Securities and Exchange Commission (SEC) and is in conformity with U.S. generally accepted accounting principles. Our fiscal year end is January 31. Unless otherwise stated, all years and dates refer to our fiscal year.
Principles of Consolidation: The consolidated financial statements include the accounts of Astro-Med, Inc. and its subsidiaries. All material intercompany accounts and transactions are eliminated in consolidation.
Reclassification: Certain amounts in prior year’s financial statements have been reclassified to conform to the current year’s presentation.
Use of Estimates: The presentation of financial statements in conformity with generally accepted accounting principles in the U.S. requires management to make estimates and assumptions that affect these financial statements and accompanying notes. Some of the more significant estimates relate to the allowances for doubtful accounts and credits, inventory valuation, impairment of long-lived assets and goodwill, income taxes, share-based compensation and warranty reserves. Management’s estimates are based on the facts and circumstances available at the time estimates are made, past historical experience, risk of loss, general economic conditions and trends, and management’s assessments of the probable future outcome of these matters. Consequently, actual results could differ from those estimates.
Cash and Cash Equivalents: Highly liquid investments with an original maturity of 90 days or less are considered to be cash equivalents. Similar investments with original maturities beyond three months are classified as securities available for sale. Cash of $1,929,000 and $1,103,000 was held in foreign bank accounts at January 31, 2012 and 2011, respectively.
Securities Available for Sale: Securities available for sale are carried at fair value based on quoted market prices, where available. The difference between cost and fair value, net of related tax effects, is recorded as a component of accumulated other comprehensive income in shareholders’ equity.
Property, Plant and Equipment: Property, plant and equipment are stated at cost less accumulated depreciation. Depreciation is provided on the straight-line basis over the estimated useful lives of the assets (land improvements—10 to 20 years; buildings and improvements—10 to 45 years; machinery and equipment—3 to 10 years). Depreciation expense was $1,510,000 for fiscal 2012 and $1,504,000 for 2011.
Revenue Recognition: Astro-Med’s product sales are recognized when all of the following criteria have been met: persuasive evidence of an arrangement exists; price to the buyer is fixed or determinable; delivery has occurred and legal title and risk of loss have passed to the customer; and collectability is reasonably assured. Returns and customer credits are infrequent and are recorded as a reduction to sales. Rights of return are not included in sales arrangements. Revenue associated with products that contain specific customer acceptance criteria is not recognized before the customer acceptance criteria are satisfied. Discounts from list prices are recorded as a reduction to sales. Amounts billed to customers for shipping and handling fees are included in sales while related shipping and handling costs are included in cost of sales.
In October 2009, the Financial Accounting Standards Board (“FASB”) amended the accounting standards for revenue recognition to remove tangible products containing software components and non-software components that function together to deliver the product’s essential functionality from the scope of industry-specific software revenue recognition guidance. In October 2009, the FASB also amended the accounting standards for multiple-element revenue arrangements to:
(i) provide updated guidance on how the elements in a multiple-element arrangement should be separated, and how the consideration should be allocated;
35
Table of Contents
(ii) require an entity to allocate revenue amongst the elements in an arrangement using estimated selling prices (“ESP”) if a vendor does not have vendor-specific objective evidence (“VSOE”) of the selling price or third-party evidence (“TPE”) of the selling price; and
(iii) eliminate the use of the residual method and require an entity to allocate revenue using the relative selling price method.
We adopted this accounting guidance for applicable transactions originating on or materially modified after February 1, 2011. The impact of this adoption was not material to our financial position and results of operations during fiscal 2012.
The majority of our equipment contains embedded operating systems and data management software which is included in the purchase price of the equipment. The software is deemed incidental to the systems as a whole as it is not sold separately or marketed separately and its production costs are minor as compared to those of the hardware system. Therefore, the Company’s hardware appliances are considered non-software elements and are not subject to the industry-specific software revenue recognition guidance.
Our multiple-element arrangements are generally comprised of a combination of equipment, software, installation and/or training services. Hardware and software elements are typically delivered at the same time and revenue is recognized when all the revenue recognition criteria for each unit are met. Delivery of installation and training services will vary based on certain factors such as the complexity of the equipment, staffing availability in a geographic location and customer preferences, and can range from a few days to a few months. Service revenue is deferred and recognized over the contractual period or as services are rendered and accepted by the customer. All of our equipment contains embedded operating systems and data management software which is included in the purchase price of the equipment. The software is deemed incidental to the system as a whole as it is not sold separately or marketed separately and its production costs are minor as compared to those of hardware system.
We have evaluated the deliverables in our multiple-element arrangements and concluded that they are separate units of accounting if the delivered item or items have value to the customer on a standalone basis and for an arrangement that includes a general right of return relative to the delivered item(s), delivery or performance of the undelivered item(s) is considered probable and substantially in our control. We allocate revenue to each element in our multiple-element arrangements based upon their relative selling prices. We determine the selling price for each deliverable based on a selling price hierarchy. The selling price for a deliverable is based on VSOE if available, third-party evidence (“TPE”) if VSOE is not available, or estimated selling price (“ESP”) if neither VSOE nor TPE is available. Revenue allocated to each element is then recognized when the basic revenue recognition criteria for that element have been met.
Infrequently, Astro-Med recognizes revenue for non-recurring engineering (NRE) fees for product modification orders upon completion of agreed-upon milestones. Revenue is deferred for any amounts received prior to completion of milestones. Certain of our NRE arrangements include formal customer acceptance provisions. In such cases, we determine whether we have obtained customer acceptance for the specific milestone before recognizing revenue. NRE fees have not been significant in the periods presented herein.
Infrequently, Astro-Med receives requests from customers to hold product purchased from us for the customer’s convenience. Revenue is recognized for such bill and hold arrangements in accordance with the requirements of SAB No. 104 which requires, among other things, the existence of a valid business purpose for the arrangement; the transfer of ownership of the purchased product; a fixed delivery date that is reasonable and consistent with the buyer’s business purpose; the readiness of the product for shipment; the use of customary payment terms; no continuing performance obligation by us and segregation of the product from our inventories.
Research and Development Costs: The Company complies with the guidance provided in FASB ASC 730, “Research and Development” by charging any costs to expense when incurred, as well as by disclosing in the financial statements the amount of R&D charged to expense. These charges include: salaries and benefits,
36
Table of Contents
external engineering service costs, engineering related information costs and supplies. The Company also complies with ASC 985-20, “Costs of Computer Software to be Sold, Leased or Marketed” and ASC 350-40, “Internal-Use Software” in accounting for the costs of software either developed or acquired.
Foreign Currency: The financial statements of foreign subsidiaries are measured using the local currency as the functional currency. Foreign currency denominated assets and liabilities are translated into U.S. dollars at year-end exchange rates with the translation adjustment recorded as a component of accumulated comprehensive income in shareholders’ equity. Revenues and costs are translated at average exchange rates during the year. We do not provide for U.S. income taxes on foreign currency translation adjustments associated with our German subsidiary since its undistributed earnings are considered to be permanently invested. Our net foreign exchange losses were $27,000 and $44,000 for fiscal 2012 and 2011, respectively.
Advertising: Astro-Med expenses advertising costs as incurred. Advertising costs including advertising production, trade shows and other activities are designed to enhance demand for our products and amounted to approximately $1,128,000 and $1,187,000 in fiscal 2012 and 2011, respectively.
Health Insurance Reimbursement Reserve: Astro-Med reimburses a portion of employee health insurance deductibles and co-payments. The total reimbursement amounted to approximately $613,000 and $538,000 in 2012 and 2011, respectively. We accrued approximately $150,000 and $135,000 at January 31, 2012 and 2011, respectively, for estimated outstanding reimbursements due to employees, including a reserve for incurred but not reported amounts.
Long-Lived Assets: Long-lived assets to be held and used are reviewed for impairment whenever events or changes in circumstances indicate that the carrying amount of such assets may not be recoverable in accordance with the guidance provided in ASC 360, “Property, Plant and Equipment.” Determination of recoverability is based on an estimate of undiscounted future cash flows resulting from the use of the asset and its eventual disposition. Measurement of an impairment loss for long-lived assets that management expects to hold and use is based on the fair value of the asset.
Goodwill: Management evaluates the recoverability of goodwill annually or more frequently if events or changes in circumstances, such as declines in sales, earnings or cash flows, or material adverse changes in the business climate, indicate that the carrying value of an asset might be impaired. During the fourth quarter of fiscal 2012, we adopted new accounting guidance which simplifies goodwill impairment testing. Under the new guidance, goodwill is first qualitatively assessed to determine whether further impairment testing is necessary. Factors that management considers in this assessment include macroeconomic conditions, industry and market considerations, overall financial performance (both current and projected), changes in management and strategy and changes in the composition or carrying amount of net assets. If this qualitative assessment indicates that it is more likely than not that the fair value of a reporting unit is less than its carrying amount, a two step process is then performed. Step one compares the fair value of the reporting unit with its carrying value, including goodwill. If the carrying amount exceeds the fair value of the reporting unit, step two is required to determine if there is an impairment of the goodwill. Step two compares the implied fair value of the reporting unit goodwill to the carrying amount of the goodwill. We estimate the fair value of our reporting units using the income approach based upon a discounted cash flow model. We believe that this approach is appropriate because it provides a fair value estimate based upon the reporting unit’s expected long –term operating cash flow performance. In addition, the Company uses the market approach, which compares the reporting unit to publicly-traded companies and transactions involving similar business, to support the conclusions based upon the income approach. The income approach requires the use of many assumptions and estimates including future revenue, expenses, capital expenditures, and working capital, as well as discount factors and income tax rates.
We performed a qualitative assessment for our 2012 analysis of goodwill. Based on this assessment, management does not believe that it is more likely than not that the carrying value of the reporting units exceed their fair values. Accordingly, no further testing was performed as management believes that there are no impairment issues in regards to goodwill at this time.
37
Table of Contents
Income Taxes: Astro-Med uses the liability method of accounting for income taxes. Under this method, deferred tax assets and liabilities are determined based on the differences between the financial reporting basis and tax basis of the assets and liabilities and are measured using enacted tax rates that will be in effect when the differences are expected to reverse. An allowance against deferred tax assets is recognized when it is more-likely-than-not that some portion or all of the deferred tax assets will not be realized. At January 31, 2012 and 2011, a valuation allowance was provided for deferred tax assets attributable to certain state R&D credit carryforwards.
Astro-Med accounts for uncertain tax positions in accordance with the guidance provided in ASC 740, “Accounting for Income Taxes.” This guidance describes a recognition threshold and measurement attribute for the financial statement disclosure of tax positions taken or expected to be taken in a tax return and requires recognition of tax benefits that satisfy a more-likely-than-not threshold. ASC 740 also provides guidance on de-recognition, classification, interest and penalties, accounting in interim periods, disclosure and transition.
Net Income Per Common Share: Net income per common share has been computed and presented in accordance with the guidance provided in ASC 260, “Earnings per Share.” Basic net income per share is based on the weighted average number of shares outstanding during the period. Diluted net income per share is based on the basic weighted average number of shares and potential common shares for stock options outstanding during the period using the treasury stock method. In fiscal years 2012 and 2011, there were 664,690 and 752,397 options that were not included in the computation of diluted net income per common share because their inclusion would be anti-dilutive.
Allowance for Doubtful Accounts: In circumstances where we are aware of a customer’s inability to meet its financial obligations, an allowance is established. The majority of accounts are individually evaluated on a regular basis and allowances are established to state such receivables at their net realizable value. The remainder of the allowance is based upon historical write-off experience and current market assessments.
Fair Value of Financial Instruments: Our financial instruments consist of cash and cash equivalents, investment securities, accounts receivable, a note receivable and accounts payable. The carrying amount reflected in the consolidated balance sheets for cash and cash equivalents, accounts receivable and accounts payable approximates fair value due to the short-term nature of these items. Investment securities, all of which are available for sale, are carried in the consolidated balance sheets at fair value based on quoted market prices, when available. The note receivable is a long-term asset and is carried in the consolidated balance sheets at fair value based on the present value of the discounted cash flows over the life of the note.
Comprehensive Income: In accordance with the guidance provided in ASC 220, “Comprehensive Income,” we report the change in net assets during the period from non-owner sources by major components and as a single total. The consolidated statement of comprehensive income has been included with the consolidated statement of shareholders’ equity on page 33. Accumulated other comprehensive income at January 31, 2012 consists of net unrealized gains on available for sale securities of $15,121 and net translation gains on foreign operations of $106,150.
Share-Based Compensation: We account for stock options granted to employees and directors using the FASB guidance included in ASC 718, “Stock Compensation.” Effective as of February 1, 2006, we adopted the “modified prospective” transition method provided in ASC 718. Under this method, share-based compensation is recognized in the consolidated statement of operation for share-based payment awards granted prior to, but not yet vested as of February 1, 2006, based on the grant date fair value estimated in accordance with prior authoritative guidance and for share-based payment awards granted subsequent to February 1, 2006, based on the grant date fair value estimated in accordance with the provisions of ASC 718.
In accordance with ASC 718, share-based compensation expense is based on the estimated fair value of each option on the date of grant using the Black-Scholes option-pricing model. Our estimate of share-based compensation requires a number of complex and subjective assumptions including our stock price volatility, employee exercise patterns (expected life of the options), the risk-free interest rate and the Company’s dividend
38
Table of Contents
yield. The stock price volatility assumption is based on the historical weekly price data of our common stock over a period equivalent to the weighted average expected life of our options. Management evaluated whether there were factors during that period which were unusual and would distort the volatility figure if used to estimate future volatility and concluded that there were no such factors. In determining the expected life of the option grants, the Company has observed the actual terms of prior grants with similar characteristics and the actual vesting schedule of the grant and has assessed the expected risk tolerance of different option groups. The risk-free interest rate is based on the actual U.S. Treasury zero coupon rates for bonds matching the expected term of the option as of the option grant date. The dividend assumption is based upon the prior year’s average dividend yield. No compensation expense is recognized for options that are forfeited for which the employee does not render the requested service.
The cash flow from the tax benefits that are a result of tax deductions in excess of the compensation cost recognized for those options (excess tax benefits) are classified as a cash inflow from financing activities and a cash outflow from operating activity in accordance with the guidance provided by ASC 718. Tax deductions from certain stock option exercises are treated as being realized when they reduce taxes payable in accordance with relevant tax law.
Recent Accounting Pronouncements:
Goodwill
In September 2011, the Financial Accounting Standards Board (FASB) issued Accounting Standard Update (ASU) 2011-08, “Intangibles—Goodwill and Other (Topic 350): Testing Goodwill for Impairment” which is intended to reduce the complexity and costs related to the testing goodwill for impairment. ASU 2011-08 allows an entity the option to make a qualitative evaluation about the likelihood of goodwill impairment in order to determine whether it is necessary to perform the two-step quantitative goodwill impairment test already included in Topic 350. An entity will no longer be required to calculate the fair value of a reporting unit unless the entity determines, based on its qualitative assessment, that it is more likely than not that the fair value of the reporting unit is less than its carrying amount. ASU 2011-08 also expands upon the examples of events and circumstances that an entity should consider between annual impairment tests in determining whether it is more likely than not that the fair value of a reporting unit is less than its carrying amount. This amended guidance is effective for annual and interim goodwill impairment tests performed for fiscal years beginning after December 15, 2011, however early adoption is permitted. We have elected to early adopt ASU-2011-08 and have applied the provisions to our fiscal 2012 analysis of goodwill. The adoption of ASU 2011-08 did not have a material effect on our consolidated financial position or results of operations.
Comprehensive Income
In June 2011, the FASB issued ASU 2011-05, “Presentation of Comprehensive Income,” which requires entities to present the components of net income and other comprehensive income either as one continuous statement or as two consecutive statements. ASU 2011-05 eliminates the option to present the components of other comprehensive income as part of the statement of changes in shareholders’ equity. While ASU 2011-05 changes the presentation of comprehensive income, it does not change the components that are recognized in net income or comprehensive income under current accounting guidance. ASU 2011-05 also requires entities to present reclassification adjustments out of accumulated other comprehensive income by component in both the statement in which net income is presented and the statement in which other comprehensive income is presented. In December 2011, the FASB issued ASU 2011-12, “Deferral of the Effective Date for Amendments to the Presentation of Reclassification of Items Out of Accumulated Other Comprehensive Income in Accounting Standard Update No. 2011-05,” which indefinitely defers the guidance related to the presentation of reclassification adjustments. ASU 2011-05 is effective for interim and annual periods beginning after December 15, 2011, and must be applied retrospectively. We will adopt this guidance in our first quarter ended April 28, 2012. Since ASU 2011-05 impacts presentation only, the adoption of this guidance will not have any effect on our consolidated financial position or results of operations.
39
Table of Contents
Fair Value Measurements
In May 2011, the FASB issued ASU 2011-04, “Amendments to Achieve Common Fair Value Measurement and Disclosure Requirements in U.S. GAAP and IFRSs,” which is intended to improve the comparability of fair value measurements presented and disclosed in financial statements prepared in accordance with U.S. GAAP and IFRS. ASU 2011-04 does not extend the use of fair value accounting, but provides guidance on how it should be applied where its use is already required or permitted by other standards within U.S. GAAP or IFRSs. ASU 2011-04 changes the wording used to describe many requirements in U.S. GAAP for measuring fair value and for disclosing information about fair value measurements. Additionally, ASU 2011-04 clarifies the FASB’s intent about the application of existing fair value measurement. This update is effective for interim and annual periods beginning after December 15, 2011. We do not expect the provisions of ASU 2011-04 to have a material effect on our consolidated financial position or results of operations.
Except for ASU’s discussed above, all other ASUs issued by the FASB as of the filing date of this Annual Report on Form 10-K are not expected to have a material effect on our consolidated financial statements.
Note 2—Divestiture
On January 30, 2012, we completed the sale of our label manufacturing operations in Asheboro, North Carolina to Label Line Ltd., the original owner of the Asheboro operations. The Asheboro operations were part of the QuickLabel System segment. The net sales price of $1,000,000 was received in the form of a promissory note in consideration for the inventory and equipment of the Asheboro operations. The promissory note issued by the Buyer is fully secured by a first lien on various collateral of the Buyer, including the Asheboro plant and plant assets. The note bears interest at a rate equal to the lesser of the United States prime rate as of January 30, 2013 plus 50 basis points or six percent per annum and is payable in sixteen quarterly installments of principal and interest commencing on January 30, 2013.
The divestiture resulted in a net book loss of $681,440, which is included in Operating Income in the accompanying consolidated statements of operations for the year ended January 31, 2012 and includes $64,000 related to closing costs and $265,000 related to the write-off of intangibles. As we have expanded our label manufacturing operations in Canada, Germany and West Warwick, Rhode Island, the sale of the Asheboro operations will not impact our continued involvement in label manufacturing within the QuickLabel segment.
The terms of the sale also include an agreement for Astro-Med to provide the Buyer with additional financing in form of a revolving line of credit in the amount of $600,000, which is fully secured by first lien on various collateral of the Buyer, including the Asheboro plant and plant assets. This line of credit bears interest at a rate equal to the United States prime rate plus an additional margin of two percent of the outstanding credit balance and has an initial term of one-year from the date of the sale which may be extended for consecutive one-year terms on mutual agreement of the parties. There were no outstanding borrowings due as of January 31, 2012. The terms of the sale also included a three-year purchase commitment for the Company to purchase $3,250,000 of inventory from the Buyer. The disposal did not qualify as a discontinued operation due to our continuing involvement with the Asheboro operation.
Note 3—Securities Available for Sale
Pursuant to our investment policy, securities available for sale include state and municipal securities with various contractual or anticipated maturity dates ranging from one month to three years. These securities are carried at fair value, with unrealized gains and losses reported as a component of accumulated other comprehensive income in shareholders’ equity until realized. Realized gains and losses from the sale of available for sale securities, if any, are determined on a specific identification basis. A decline in the fair value of any available for sale security below cost that is determined to be other than temporary will result in a write-down of its carrying amount to fair value. No such impairment charges were recorded for any period presented. All short-term investment securities have original maturities greater than 90 days.
40
Table of Contents
The fair value, amortized cost and gross unrealized gains and losses of the securities are as follows:
| Amortized Cost |
Gross Unrealized Gains |
Gross Unrealized Losses |
Fair Value | |||||||||||||
| January 31, 2012 |
||||||||||||||||
| State and Municipal Obligations |
$ | 11,313,013 | $ | 22,933 | $ | (22 | ) | $ | 11,335,924 | |||||||
|
|
|
|
|
|
|
|
|
|||||||||
| Amortized Cost |
Gross Unrealized Gains |
Gross Unrealized Losses |
Fair Value | |||||||||||||
| January 31, 2011 |
||||||||||||||||
| State and Municipal Obligations |
$ | 12,897,221 | $ | 15,949 | $ | (2,938 | ) | $ | 12,910,232 | |||||||
|
|
|
|
|
|
|
|
|
|||||||||
The contractual maturity dates of these securities are as follows:
| January 31, | ||||||||
| 2012 | 2011 | |||||||
| Less than one year |
$ | 8,494,269 | $ | 8,749,743 | ||||
| One to three years |
2,841,655 | 4,160,489 | ||||||
|
|
|
|
|
|||||
| $ | 11,335,924 | $ | 12,910,232 | |||||
|
|
|
|
|
|||||
Actual maturities are expected to differ from contractual dates as a result of sales or earlier issuer redemptions.
Note 4—Inventories
Inventories are stated at the lower of cost (first-in, first-out) or market and include material, labor and manufacturing overhead. The components of inventories are as follows:
| January 31, | ||||||||
| 2012 | 2011 | |||||||
| Materials and Supplies |
$ | 9,204,853 | $ | 8,450,985 | ||||
| Work-in-Progress |
1,274,397 | 982,092 | ||||||
| Finished Goods |
3,649,349 | 4,971,837 | ||||||
|
|
|
|
|
|||||
| $ | 14,128,599 | $ | 14,404,914 | |||||
|
|
|
|
|
|||||
Included within finished goods inventory is $1,324,490 and $1,413,198 of demonstration equipment at January 31, 2012 and 2011, respectively.
Note 5—Accrued Expenses
Accrued expenses consisted of the following:
| January 31, | ||||||||
| 2012 | 2011 | |||||||
| Warranty |
$ | 343,102 | $ | 258,082 | ||||
| Professional fees |
245,994 | 117,911 | ||||||
| R&D outsourcing |
167,400 | 165,750 | ||||||
| Health insurance reimbursement reserve |
150,000 | 135,000 | ||||||
| Dealer commissions |
148,645 | 187,733 | ||||||
| Other |
752,534 | 886,039 | ||||||
|
|
|
|
|
|||||
| $ | 1,807,675 | $ | 1,750,515 | |||||
|
|
|
|
|
|||||
41
Table of Contents
Note 6—Line of Credit
The Company has a $5,000,000 revolving bank line of credit with Wells Fargo Bank. Borrowings under this line of credit bear interest at either a fluctuating 75 basis points below the base rate, as defined in the agreement, or at a fixed rate 150 basis points above LIBOR. At January 31, 2012, there were no borrowings against this line and the entire line is currently available.
Note 7—Shareholders’ Equity
Common Stock: During fiscal 2012, the Company did not repurchase any shares of its common stock. The Company repurchased 138,200 shares of its common stock for $975,682 in fiscal 2011. As of January 31, 2012, the Company’s Board of Directors has authorized the purchase of up to an additional 500,000 shares Company’s common stock on the open market.
During fiscal 2012 and 2011, certain of the Company’s employees delivered a total of 139,895 and 132,475 shares respectively, of the Company’s common stock to satisfy the exercise price for stock options exercised and related taxes. The shares delivered were valued at a total of $1,037,903 and $982,640 respectively and are included with the treasury stock in the accompanying consolidated balance sheet at January 31, 2012 and 2011. These transactions did not impact the number of shares authorized for repurchase under the Company’s current repurchase program.
Astro-Med maintains the following benefit plans involving its common stock:
Stock Plans: As of January 31, 2012, Astro-Med has one equity incentive plan (“2007 Equity Incentive Plan”) under which incentive stock options, non-qualified stock options, restricted stock and other equity-based awards may be granted to directors, officers and certain employees. To date, only options have been granted under this plan. Options granted to employees vest over four years. An aggregate of 1,000,000 shares were authorized for awards under the 2007 Equity Incentive Plan. The exercise price of each stock option will be established at the discretion of the Compensation Committee; however, any incentive stock options granted under the 2007 Equity Incentive Plan must be at an exercise price of not less than fair market value at the date of grant. The 2007 Equity Incentive Plan provides for an automatic annual grant of ten-year options to purchase 5,000 shares of stock to each non-employee director upon the adjournment of each shareholders’ meeting. Each such option is exercisable at the fair market value as of the grant date and vests immediately prior to the next succeeding shareholders’ meeting. During fiscal 2012 and 2011, 20,000 and 15,000 shares, respectively, were awarded each year to non-employee directors. At January 31, 2012, 683,444 shares were available for grant under the 2007 Equity Incentive Plan.
Summarized option data for all plans is as follows:
| Number of Shares |
Option Price Per Share |
Weighted Average Option Price Per Share |
||||||||||
| Options Outstanding, January 31, 2011 |
1,219,183 | $ | 2.40–11.90 | $ | 7.03 | |||||||
| Options Granted |
55,000 | $ | 7.36–8.10 | $ | 7.91 | |||||||
| Options Exercised |
(289,417 | ) | $ | 2.40–7.36 | $ | 2.85 | ||||||
| Options Expired |
(96,669 | ) | $ | 3.14–11.90 | $ | 8.64 | ||||||
|
|
|
|
|
|
|
|||||||
| Options Outstanding, January 31, 2012 |
888,097 | $ | 2.40–11.90 | $ | 8.27 | |||||||
|
|
|
|
|
|
|
|||||||
| Options Exercisable, January 31, 2012 |
737,839 | $ | 2.40–11.90 | $ | 8.43 | |||||||
42
Table of Contents
Set forth below is a summary of options outstanding at January 31, 2012:
| Outstanding |
Exercisable | |||||||||||||||||||
| Range of Exercise prices |
Options | Weighted Average Exercise Price |
Remaining Contractual Life |
Options | Weighted Average Exercise Price |
|||||||||||||||
| $ 2.40 - 5.78 |
52,885 | $ | 3.46 | 3 | 52,885 | $ | 3.46 | |||||||||||||
| $ 6.22 - $9.59 |
681,106 | $ | 7.92 | 5 | 530,848 | $ | 8.04 | |||||||||||||
| $ 9.81 - $11.90 |
154,106 | $ | 11.49 | 5 | 154,106 | $ | 11.47 | |||||||||||||
|
|
|
|
|
|||||||||||||||||
| 888,097 | 737,839 | |||||||||||||||||||
|
|
|
|
|
|||||||||||||||||
The fair value of each stock option granted was estimated on the grant date using the Black-Scholes option-pricing model with the following weighted average assumptions:
| Years Ended January 31, | ||||
| 2012 | 2011 | |||
| Risk-free interest rate |
0.94%–2.00% | 2.11%–2.42% | ||
| Expected life (years) |
5 | 5 | ||
| Expected volatility |
39.07%–39.43% | 40.66%–41.46% | ||
| Expected dividend yield |
3.50%–3.89% | 3.35%–3.67% | ||
The weighted average fair value of options granted during fiscal 2012 and 2011 was $2.02 and $2.11, respectively. As of January 31, 2012, there was $183,841 of unrecognized compensation expense related to the unvested stock options granted under the plans. The expense is to be recognized over a weighted average of two years. Share-based compensation expense has been recognized as follows:
| Years Ended January 31, | ||||||||
| 2012 | 2011 | |||||||
| Cost of Sales |
$ | 35,749 | $ | 60,457 | ||||
| Operating Expenses |
172,135 | 272,783 | ||||||
|
|
|
|
|
|||||
| Total |
$ | 207,884 | $ | 333,240 | ||||
|
|
|
|
|
|||||
As of January 31, 2012, the aggregate intrinsic value (the aggregate difference between the closing stock price of the Company’s common stock on January 31, 2012, and the exercise price of the outstanding options) that would have been received by the option holders if all options had been exercised was $447,710 for all exercisable options and $547,874 for all options outstanding. The weighted average remaining contractual terms for these options are 4.0 years for options that are exercisable and 4.7 years for all options outstanding. The total aggregate intrinsic value of options exercised during fiscal 2012 and 2011 was $1,320,485 and $1,094,579, respectively.
Employee Stock Purchase Plan (ESPP): Astro-Med’s ESPP allows eligible employees to purchase shares of common stock at a 15% discount from fair market value on the date of purchase. A total of 247,500 shares were initially reserved for issuance under this plan. Summarized plan activity is as follows:
| Years Ended January 31, | ||||||||
| 2012 | 2011 | |||||||
| Shares reserved, beginning |
77,008 | 84,518 | ||||||
| Shares purchased |
(6,801 | ) | (7,510 | ) | ||||
|
|
|
|
|
|||||
| Shares reserved, ending |
70,207 | 77,008 | ||||||
|
|
|
|
|
|||||
43
Table of Contents
Employee Stock Ownership Plan: Astro-Med has an Employee Stock Ownership Plan (ESOP) providing retirement benefits to all eligible employees. Annual contributions in amounts determined by the Company’s Board of Directors are invested by the ESOP’s Trustees in shares of common stock of Astro-Med. Contributions may be in cash or stock. Astro-Med’s contributions (paid or accrued) amounted to $100,000 and $80,000 in fiscal 2012 and 2011, respectively which were recorded as compensation expense. All shares owned by the ESOP have been allocated to participants.
During the first quarter of fiscal 2011, the Company purchased approximately 200,000 stock options held by certain key executives. The options had an exercise price of $5.45 and were due to expire on March 20, 2010. The purchase price paid by the Company for the options was approximately $250,000, representing the closing price for the Astro-Med’s common stock on March 3, 2010, less a 10% discount and the exercise price for each of the options. The original underlying stock options were granted during fiscal 2000 and there was no unrecognized compensation expense associated with the options. This transaction was charged to equity. The cash settlement of these options during the prior year was a one-time event, as the Company has not historically settled any options for cash and has no plans to do so again in the future.
Note 8—Income Taxes
The components of income before income taxes are as follows:
| Years Ended January 31, | ||||||||
| 2012 | 2011 | |||||||
| Domestic |
$ | 2,485,615 | $ | 1,772,680 | ||||
| Foreign |
1,746,878 | 1,010,934 | ||||||
|
|
|
|
|
|||||
| $ | 4,232,493 | $ | 2,783,614 | |||||
|
|
|
|
|
|||||
The components of the provision for income taxes are as follows:
| Years Ended January 31, | ||||||||
| 2012 | 2011 | |||||||
| Current: |
||||||||
| Federal |
$ | 707,637 | $ | 699,622 | ||||
| State |
84,579 | 170,930 | ||||||
| Foreign |
516,312 | (14,321 | ) | |||||
|
|
|
|
|
|||||
| 1,308,528 | 856,231 | |||||||
|
|
|
|
|
|||||
| Deferred: |
||||||||
| Federal |
(216,322 | ) | (191,938 | ) | ||||
| State |
(15,056 | ) | (27,024 | ) | ||||
| Foreign |
23,652 | 84,576 | ||||||
|
|
|
|
|
|||||
| (207,726 | ) | (134,386 | ) | |||||
|
|
|
|
|
|||||
| $ | 1,100,802 | $ | 721,845 | |||||
|
|
|
|
|
|||||
44
Table of Contents
The provision for income taxes differs from the amount computed by applying the statutory federal income tax rate (34%) to income before income taxes due to the following:
| Years Ended January 31, | ||||||||
| 2012 | 2011 | |||||||
| Income tax provision at statutory rate |
$ | 1,439,048 | $ | 946,428 | ||||
| State taxes, net of federal tax effect |
77,330 | 201,992 | ||||||
| Officers life insurance |
(93,100 | ) | 12,466 | |||||
| Change in valuation allowance |
34,990 | 65,202 | ||||||
| Change in reserves related to ASC 740 liability |
60,957 | (241,098 | ) | |||||
| Meals and entertainment |
41,063 | 59,580 | ||||||
| Domestic product deduction |
(78,135 | ) | (44,162 | ) | ||||
| Share-based compensation |
53,656 | 76,162 | ||||||
| Tax-exempt income |
(26,949 | ) | (21,983 | ) | ||||
| Prior year tax filing true up adjustment |
(156,615 | ) | (143,014 | ) | ||||
| R&D credits |
(175,059 | ) | (108,093 | ) | ||||
| Other, net |
(76,384 | ) | (81,635 | ) | ||||
|
|
|
|
|
|||||
| $ | 1,100,802 | $ | 721,845 | |||||
|
|
|
|
|
|||||
The components of deferred income tax expense arise from various temporary differences and relate to items included in the statement of operations. The tax effects of temporary differences that gave rise to significant portions of the deferred tax assets and liabilities are as follows:
| January 31, | ||||||||
| 2012 | 2011 | |||||||
| Deferred Tax Assets: |
||||||||
| Inventory Reserves |
$ | 1,692,247 | $ | 1,507,591 | ||||
| Stock-Based Compensation |
380,221 | 360,883 | ||||||
| R&D Credits |
279,938 | 244,948 | ||||||
| Vacation Accrual |
355,046 | 400,343 | ||||||
| Deferred Service Contract Revenue |
239,503 | 300,844 | ||||||
| Reserve for Doubtful Accounts |
150,555 | 190,578 | ||||||
| Other |
806,987 | 554,397 | ||||||
|
|
|
|
|
|||||
| 3,904,497 | 3,559,584 | |||||||
| Deferred Tax Liabilities: |
||||||||
| Accumulated Tax Depreciation in Excess of Book Depreciation |
911,255 | 980,925 | ||||||
| Deferred Tax Gain on Sale of Real Estate |
1,235,098 | 1,235,098 | ||||||
| Intangibles/Amortization |
465,906 | 420,182 | ||||||
| Currency Translation Adjustment |
155,392 | 157,572 | ||||||
| Other |
132,434 | 4,111 | ||||||
|
|
|
|
|
|||||
| 2,900,085 | 2,797,888 | |||||||
|
|
|
|
|
|||||
| Subtotal |
1,004,412 | 761,696 | ||||||
| Valuation Allowance |
(279,938 | ) | (244,948 | ) | ||||
|
|
|
|
|
|||||
| Net Deferred Tax Assets |
$ | 724,474 | $ | 516,748 | ||||
|
|
|
|
|
|||||
At January 31, 2012, we have state net operating loss carryforwards of $417,000, which can be used to offset future tax liabilities and expire at various dates beginning in fiscal 2015. At January 31, 2012 we have state research and development credit carryforwards of approximately $424,000, which can be used to offset future tax liabilities and expire at various dates beginning in fiscal 2012.
45
Table of Contents
The valuation allowance at January 31, 2012 relates to certain state research and development tax credit carryforwards which are expected to expire unused. The change in the valuation allowance is approximately $35,000 and represents a reserve against the additional state research and development credits generated during the current year net of federal benefit.
The Company reasonably believes that it is possible that some unrecognized tax benefits, accrued interest and penalties could decrease income tax expense in the next year due to either the review of previously filed tax returns or the expiration of certain statutes of limitation. The Company estimates the reversal of the unrecognized tax benefit to be approximately $241,000, excluding interest and penalties. A reconciliation of unrecognized tax benefits, excluding interest and penalties follows:
| 2012 | 2011 | |||||||
| Balance at February 1 |
$ | 726,661 | $ | 875,225 | ||||
| Increases in prior period tax positions |
30,839 | 26,788 | ||||||
| Increases in current period tax positions |
78,571 | 72,140 | ||||||
| Reductions related to lapse of statute of limitations |
(56,528 | ) | (247,492 | ) | ||||
|
|
|
|
|
|||||
| Balance at January 31 |
$ | 779,543 | $ | 726,661 | ||||
|
|
|
|
|
|||||
If the $779,543 is recognized, $443,337 would decrease the effective tax rate in the period in which each of the benefits is recognized and the remainder would be offset by a reversal of deferred tax assets.
During fiscal 2012 and 2011 the Company recognized $32,839 and $60,127, respectively, of potential interest and penalties, which are included as a component of income tax expense in the accompanying statement of operations. At January 31, 2012 and 2011, the Company had accrued potential interest and penalties of $453,000 and $420,000, respectively.
The Company and its subsidiaries file income tax returns in U.S. federal jurisdictions, various state jurisdictions, and various foreign jurisdictions. The Company is no longer subject to U.S. federal examinations prior to 2008.
At January 31, 2012, the Company has indefinitely reinvested $2,632,000 of the cumulative undistributed earnings of its foreign subsidiary in Germany, all of which would be subject to U.S. taxes if repatriated to the U.S. Through January 31, 2012, the Company has not provided deferred income taxes on the undistributed earnings of this subsidiary because such earnings are considered to be indefinitely reinvested. Non-U.S. income taxes are, however, provided on these undistributed earnings.
Note 9—Contractual Obligations
The following table summarizes our contractual obligations:
| Total | 2013 | 2014 | 2015 | 2016 | 2017 and Thereafter |
|||||||||||||||||||
| Purchase Commitments* |
$ | 8,746,353 | $ | 6,212,976 | $ | 1,533,377 | $ | 1,000,000 | — | — | ||||||||||||||
| Operating Lease Obligations |
$ | 726,007 | $ | 335,145 | $ | 245,356 | $ | 110,688 | $ | 34,818 | — | |||||||||||||
|
|
|
|
|
|
|
|
|
|
|
|
|
|||||||||||||
| $ | 9,472,360 | $ | 6,548,121 | $ | 1,778,733 | $ | 1,110,688 | $ | 34,818 | $ | — | |||||||||||||
|
|
|
|
|
|
|
|
|
|
|
|
|
|||||||||||||
| * | Purchase commitments consists primarily of inventory and equipment purchase orders made in the ordinary course of business, including the purchase commitment agreement interest into with Buyer of the Asheboro operations as described in Note 2. |
The Company incurred rent and lease expenses in the amount of $706,000 and $641,000 for the fiscal years 2012 and 2011, respectively.
46
Table of Contents
Note 10—Nature of Operations, Segment Reporting and Geographical Information
The Company’s operations consist of the design, development, manufacture and sale of specialty data recorder and acquisition systems, label printing and applicator systems, neuropsychological instrumentation systems and consumable supplies. The Company organizes and manages its business as a portfolio of products and services designed around a common theme of data acquisition and information output. The Company reports three reporting segments consistent with its sales product groups: Test & Measurement (T&M), QuickLabel Systems (QuickLabel), and Grass Technologies (Grass).
T&M produces data recording equipment used worldwide for a variety of recording, monitoring and troubleshooting applications for the aerospace, automotive, metal mill, power and telecommunications industries. QuickLabel produces an array of high-technology digital label printers, labeling software and consumables for a variety of commercial industries worldwide. Grass produces a range of instrumentation equipment and supplies for clinical neurophysiology (EEG and epilepsy monitoring), polysomnography (PSG—Sleep Monitoring) and biomedical research applications used worldwide by universities, medical centers and companies engaged in a variety of clinical and research activities. The accounting policies of the reporting segments are the same as those described in the summary of significant accounting policies herein. The Company evaluates segment performance based on the segment profit before corporate and financial administration expenses.
Business is conducted in the United States and through foreign affiliates in Canada and Europe. Manufacturing activities are primarily conducted in the United States. Sales and service activities outside the United States are conducted through wholly-owned entities and, to a lesser extent, through authorized distributors and agents. Transfer prices are intended to produce gross profit margins as would be associated with an arms-length transaction.
Summarized below are the Net Sales and Segment Operating Profit (both in dollars and as a percentage of Net Sales) for each reporting segment:
| ($ in thousands) | Net Sales | Segment Operating Profit | Segment Operating Profit % of Net Sales |
|||||||||||||||||||||
| 2012 | 2011 | 2012 | 2011 | 2012 | 2011 | |||||||||||||||||||
| T&M |
$ | 17,138 | $ | 14,837 | $ | 2,425 | $ | 1,200 | 14.1 | % | 8.1 | % | ||||||||||||
| QuickLabel |
43,586 | 39,500 | 2,553 | 1,847 | 5.9 | % | 4.7 | % | ||||||||||||||||
| Grass |
18,469 | 16,679 | 3,592 | 3,358 | 19.5 | % | 20.1 | % | ||||||||||||||||
|
|
|
|
|
|
|
|
|
|
|
|
|
|||||||||||||
| Total |
$ | 79,193 | $ | 71,016 | 8,570 | 6,405 | 10.8 | % | 9.0 | % | ||||||||||||||
|
|
|
|
|
|
|
|
|
|||||||||||||||||
| Corporate Expenses |
3,972 | 3,749 | ||||||||||||||||||||||
| Loss on Sale of Asheboro* |
(681 | ) | — | |||||||||||||||||||||
| Gain on Legal Settlement |
— | 104 | ||||||||||||||||||||||
|
|
|
|
|
|||||||||||||||||||||
| Operating Income |
3,917 | 2,760 | ||||||||||||||||||||||
| Other Income, Net |
316 | 24 | ||||||||||||||||||||||
|
|
|
|
|
|||||||||||||||||||||
| Income Before Income Taxes |
4,233 | 2,784 | ||||||||||||||||||||||
| Income Tax Provision |
1,101 | 722 | ||||||||||||||||||||||
|
|
|
|
|
|||||||||||||||||||||
| Net Income |
$ | 3,132 | $ | 2,062 | ||||||||||||||||||||
|
|
|
|
|
|||||||||||||||||||||
| * | The Asheboro operations were part of the QuickLabel Systems segment. |
No customer accounted for greater than 10% of net sales in fiscal 2012 and 2011.
47
Table of Contents
Other information by segment is presented below:
| ($ in thousands) | Assets | |||||||
| 2012 | 2011 | |||||||
| T&M |
$ | 10,300 | $ | 10,205 | ||||
| QuickLabel |
21,260 | 21,714 | ||||||
| Grass |
11,054 | 11,780 | ||||||
| Corporate* |
24,448 | 21,300 | ||||||
|
|
|
|
|
|||||
| Total |
$ | 67,062 | $ | 64,999 | ||||
|
|
|
|
|
|||||
| * | Corporate assets consist of cash and cash equivalents, securities available for sale, income tax accounts and miscellaneous fixed assets. |
| ($ in thousands) | Depreciation and Amortization |
Capital Expenditures | ||||||||||||||
| 2012 | 2011 | 2012 | 2011 | |||||||||||||
| T&M |
$ | 567 | $ | 455 | $ | 497 | $ | 324 | ||||||||
| QuickLabel |
806 | 751 | 535 | 1,664 | ||||||||||||
| Grass |
203 | 370 | 123 | 102 | ||||||||||||
|
|
|
|
|
|
|
|
|
|||||||||
| Total |
$ | 1,576 | $ | 1,576 | $ | 1,155 | $ | 2,090 | ||||||||
|
|
|
|
|
|
|
|
|
|||||||||
Geographical Data
Presented below is selected financial information by geographic area:
| ($ in thousands) | Net Sales | Long-Lived Assets | ||||||||||||||
| 2012 | 2011 | 2012 | 2011 | |||||||||||||
| United States |
$ | 55,004 | $ | 50,614 | $ | 10,031 | $ | 11,352 | ||||||||
| Europe |
14,915 | 12,016 | 646 | 705 | ||||||||||||
| Asia |
3,882 | 3,450 | — | — | ||||||||||||
| Canada |
3,145 | 3,014 | 494 | 485 | ||||||||||||
| Central and South America |
1,406 | 1,059 | — | — | ||||||||||||
| Other |
841 | 863 | — | — | ||||||||||||
|
|
|
|
|
|
|
|
|
|||||||||
| Total |
$ | 79,193 | $ | 71,016 | $ | 11,171 | $ | 12,542 | ||||||||
|
|
|
|
|
|
|
|
|
|||||||||
Long-lived assets excludes goodwill assigned to the following segments: T&M $0.7 million and Grass $1.6 million at January 31, 2012 and 2011.
Note 11—Profit-Sharing Plan
Along with the ESOP described in Note 7, Astro-Med sponsors a Profit-Sharing Plan (the “Plan”) which provides retirement benefits to all eligible domestic employees. The Plan allows participants to defer a portion of their cash compensation and contribute such deferral to the Plan through payroll deductions. The Company makes matching contributions up to specified levels. The deferrals are made within the limits prescribed by Section 401(k) of the Internal Revenue Code.
All contributions are deposited into trust funds. It is the policy of the Company to fund any contributions accrued. The Company’s annual contribution amounts are determined by the Board of Directors. Contributions paid or accrued amounted to $259,290 and $253,362 in fiscal 2012 and 2011, respectively.
48
Table of Contents
Note 12—Product Warranty Liability
Astro-Med offers a manufacturer’s warranty for the majority of its hardware products. The specific terms and conditions of warranty vary depending upon the product sold and country in which the Company does business. For products sold in the United States, the Company provides a basic limited warranty, including parts and labor. The Company estimates the warranty costs based on historical claims experience and records a liability in the amount of such estimates at the time product revenue is recognized. The Company regularly assesses the adequacy of its recorded warranty liabilities and adjusts the amounts as necessary. Activity in the product warranty liability is as follows:
| January 31, | ||||||||
| 2012 | 2011 | |||||||
| Balance, beginning of the year |
$ | 258,082 | $ | 260,235 | ||||
| Warranties issued |
660,756 | 499,906 | ||||||
| Settlements made |
(575,736 | ) | (502,059 | ) | ||||
|
|
|
|
|
|||||
| Balance, end of the year |
$ | 343,102 | $ | 258,082 | ||||
|
|
|
|
|
|||||
Note 13—Concentration of Risk
Credit is generally extended on an uncollateralized basis to almost all customers after review of credit worthiness. Concentration of credit and geographic risk with respect to accounts receivable is limited due to the large number and general dispersion of accounts which constitute the Company’s customer base. The Company periodically performs on-going credit evaluations of its customers. The Company has not historically experienced significant credit losses on collection of its accounts receivable.
Excess cash is invested principally in investment grade government and state municipal securities. The Company has established guidelines relative to diversification and maturities that maintain safety of principal, liquidity and yield. These guidelines are periodically reviewed and modified to reflect changes in market conditions. The Company has not historically experienced any significant losses on its cash equivalents or investments.
Note 14—Commitments and Contingencies
Astro-Med is subject to contingencies, including legal proceedings and claims arising in the normal course of business that cover a wide range of matters including, among others, contract and employment claims, workers compensation claims, product liability, warranty and modification, adjustment or replacement of component parts of units sold.
Direct costs associated with the estimated resolution of contingencies are accrued at the earliest date at which it is deemed probable that a liability has been incurred and the amount of such liability can be reasonably estimated. While it is impossible to ascertain the ultimate legal and financial liability with respect to contingent liabilities, including lawsuits, the Company believes that the aggregate amount of such liabilities, if any, in excess of amounts provided or covered by insurance, will not have a material adverse effect on the consolidated financial position or results of operations. It is possible, however, that future results of operations for any particular future period could be materially affected by changes in our assumptions or strategies related to these contingencies or changes out of the Company’s control.
49
Table of Contents
Note 15—Fair Value Measurements
We measure our financial assets at fair value on a recurring basis in accordance with the guidance provided in ASC 820, “Fair Value Measurement and Disclosures” which defines fair value as the price that would be received to sell an asset or paid to transfer a liability in an orderly transaction between market participants at the measurement date. In addition, ASC 820 establishes a three-tiered hierarchy for inputs used in management’s determination of fair value of financial instruments that emphasizes the use of observable inputs over the use of unobservable inputs by requiring that observable inputs be used when available. Observable inputs are inputs that reflect management’s belief about the assumptions market participants would use in pricing a financial instrument based on the best information available in the circumstances.
The fair value hierarchy is summarized as follows:
| • | Level 1—Quoted prices in active markets for identical assets or liabilities; |
| • | Level 2—Inputs other than Level 1 that are observable, either directly or indirectly, such as quoted prices for similar assets or liabilities; quoted prices in markets that are not active or other inputs that are observable or can be corroborated by observable market data for substantially the full term of the assets or liabilities; and |
| • | Level 3—Unobservable inputs that are supported by little or no market activity and that are significant to the fair value of the assets or liabilities |
Assets measured at fair value on a recurring basis are summarized below:
| January 31, 2012 |
Level 1 | Level 2 | Level 3 | Total | ||||||||||||
| Money market funds (included in cash and cash equivalents) |
$ | 5,922,179 | $ | — | $ | — | $ | 5,922,179 | ||||||||
| State and municipal obligations (included in Securities available for sale) |
11,335,924 | — | — | 11,335,924 | ||||||||||||
| Note Receivable |
— | 969,700 | — | 969,700 | ||||||||||||
|
|
|
|
|
|
|
|
|
|||||||||
| Total |
$ | 17,258,103 | $ | 969,700 | $ | — | $ | 18,227,803 | ||||||||
|
|
|
|
|
|
|
|
|
|||||||||
| January 31, 2011 |
Level 1 | Level 2 | Level 3 | Total | ||||||||||||
| Money market funds (included in cash and cash equivalents) |
$ | 4,926,983 | $ | — | $ | — | $ | 4,926,983 | ||||||||
| State and municipal obligations (included in Securities available for sale) |
12,910,232 | — | — | 12,910,232 | ||||||||||||
|
|
|
|
|
|
|
|
|
|||||||||
| Total |
$ | 17,837,215 | $ | — | $ | — | $ | 17,837,215 | ||||||||
|
|
|
|
|
|
|
|
|
|||||||||
We did not have any transfers of investments into or out of Level 1 or Level 2 during fiscal 2012.
For our money market funds and state and municipal obligations, we utilize the market approach to measure fair value. The market approach is based on using quoted market prices for identical assets.
For our Note Receivable we utilized the income approach to measure fair value by discounting the present value of the Note. The discount rate used is based on similar rates used for high credit ratings and highly collateralized lending.
Note 16—Life Insurance Proceeds
During the second quarter of fiscal 2012, we recognized income on key-man life insurance proceeds of $300,000. This income is included in other income in the accompanying consolidated statements of operations for the year end January 31, 2012.
50
Table of Contents
SCHEDULE II—VALUATION AND QUALIFYING ACCOUNTS AND RESERVES
| Description |
Balance at Beginning of Year |
Provision Charged to Operations |
Deductions(2) | Balance at End of Year |
||||||||||||
| Allowance for Doubtful Accounts(1): |
||||||||||||||||
| Year Ended January 31, |
||||||||||||||||
| 2012 |
$ | 546,870 | $ | 22,272 | $ | (140,733 | ) | $ | 428,409 | |||||||
| 2011 |
$ | 518,789 | $ | 81,981 | $ | (53,900 | ) | $ | 546,870 | |||||||
| (1) | The allowance for doubtful accounts has been netted against accounts receivable as of the respective balance sheet dates. |
| (2) | Uncollectible accounts written off, net of recoveries, also includes foreign exchange adjustment. |
51