Attached files
| file | filename |
|---|---|
| 8-K - FORM 8-K - GULFMARK OFFSHORE INC | h81044e8vk.htm |
Exhibit 99.1

| GulfMark Offshore, Inc. March 2011 Investor Presentation |

| Cautionary Statement Regarding Forward-Looking Statements This presentation contains certain forward-looking statements within the meaning of the Private Securities Litigation Reform Act of 1995, which involve known and unknown risk, uncertainties and other factors. Among the factors that could cause actual results to differ materially are: the price of oil and gas and its effect on industry conditions; industry volatility; fluctuations in the size of the offshore marine vessel fleet in areas where the Company operates; changes in competitive factors; delay or cost overruns on construction projects and other material factors that are described from time to time in the Company's filings with the SEC, including the Company's Form 10-K for the year ended December 31, 2010. Consequently, the forward-looking statements contained herein should not be regarded as representations that the projected outcomes can or will be achieved. . NYSE: GLF www.GulfMark.com Forward-Looking Statements |

| Long-Term Revenue & EBITDA (In Millions of Dollars) * Note: Adjusted for Special Items, See Supporting Information at the end of this Presentation |

| 4 Geographic Revenue Diversification Revenue Breakout by Region - Year Ended December 31, 2010 |
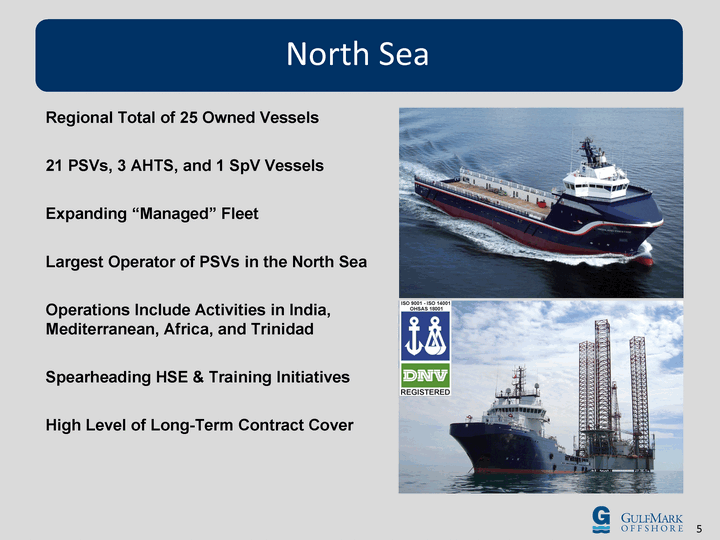
| North Sea Regional Total of 25 Owned Vessels 21 PSVs, 3 AHTS, and 1 SpV Vessels Expanding "Managed" Fleet Largest Operator of PSVs in the North Sea Operations Include Activities in India, Mediterranean, Africa, and Trinidad Spearheading HSE & Training Initiatives High Level of Long-Term Contract Cover |

| Americas Regional Total of 35 Owned Vessels Mexico - 2 AHTS Vessels and 1 Crewboat Brazil - 3 Large PSVs, 4 PSVs, 1 SpV and 1 AHTS Trinidad / Suriname / French Guiana - 4 PSV's, 3 FSV's, and 1 Crewboat Gulf of Mexico - 12 PSV's, 3 Fast Supply and 1 Crewboat (Crewboat is managed, 1 PSV trades on worldwide basis). Average Fleet Age of 5.2 years |

| Gulf of Mexico: Deepwater Utilization on Recovery Decreased Exposure to U.S. Gulf of Mexico by Approximately 50% Lower Utilization, But Also Lower Revenue Exposure in the U.S. Gulf of Mexico Option Value of Positioning Vessels on Short-Term Contracts in Trinidad Ability to Quickly Capitalize on a Recovery in the U.S. Gulf of Mexico Supply Constraint of Deepwater Vessels Due to the Disproportionate Movement of Higher Specification Vessels Out of the Gulf of Mexico as Compared to Lower Specification Vessels Vessel Differentiation Based on Safety, Quality, and Training Due to the Deepwater Horizon Event, We Anticipate a Preference for Our Highly Trained Mariners and the Modern Safety Equipment on Our Vessels Aggressively Dry-Docking and Modifying Existing Fleet in Anticipation of U.S. Gulf of Mexico Recovery |
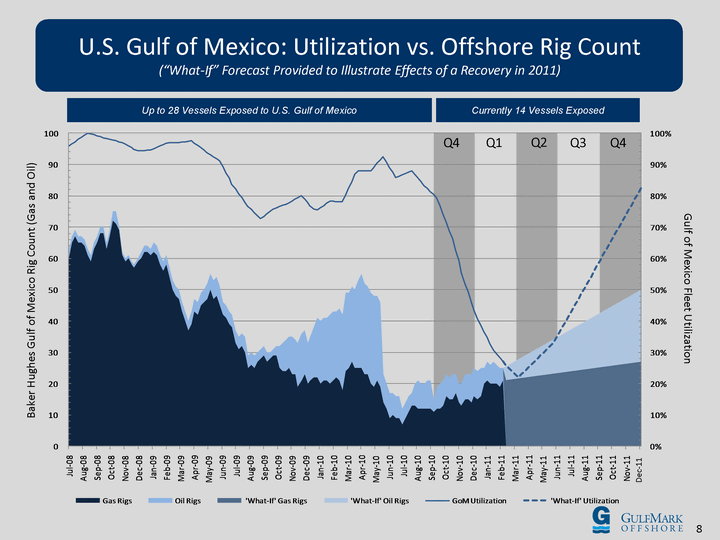
| U.S. Gulf of Mexico: Utilization vs. Offshore Rig Count ("What-If" Forecast Provided to Illustrate Effects of a Recovery in 2011) Baker Hughes Gulf of Mexico Rig Count (Gas and Oil) Gulf of Mexico Fleet Utilization Q4 Q1 Q2 Q3 Q4 Up to 28 Vessels Exposed to U.S. Gulf of Mexico Currently 14 Vessels Exposed Dec-11 |
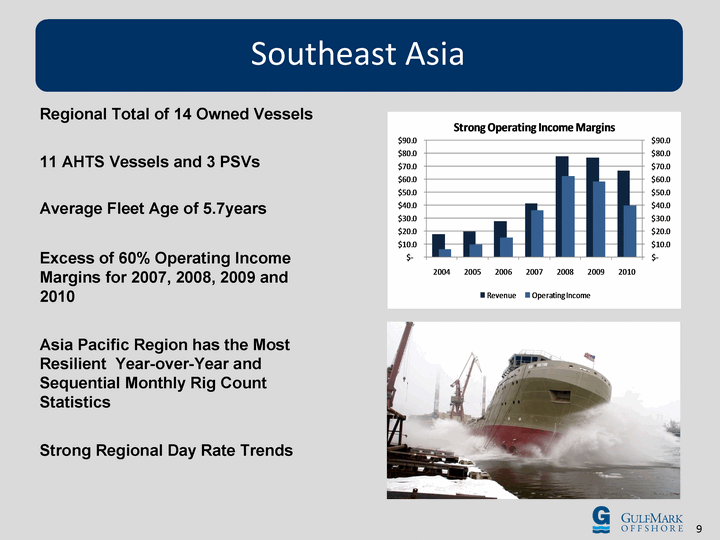
| Southeast Asia Regional Total of 14 Owned Vessels 11 AHTS Vessels and 3 PSVs Average Fleet Age of 5.7years Excess of 60% Operating Income Margins for 2007, 2008, 2009 and 2010 Asia Pacific Region has the Most Resilient Year-over-Year and Sequential Monthly Rig Count Statistics Strong Regional Day Rate Trends |
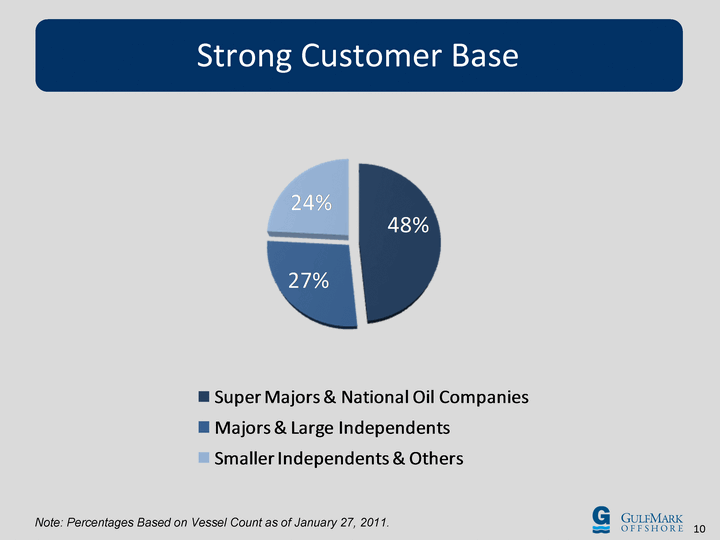
| Strong Customer Base Note: Percentages Based on Vessel Count as of January 27, 2011. |

| The GulfMark Fleet |
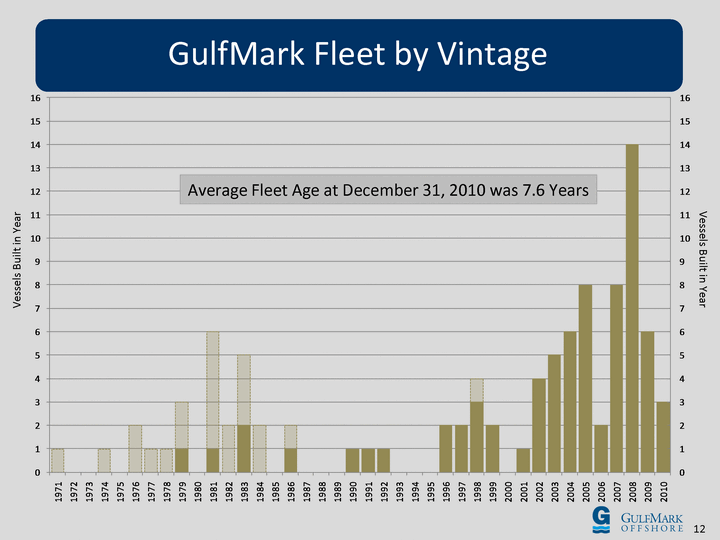
| GulfMark Fleet by Vintage Vessels Built in Year Vessels Built in Year Average Fleet Age at December 31, 2010 was 7.6 Years |

| Worldwide Vessel Fleet by Category Source: Pareto Securities Equity Research - March 2011 Worldwide Vessel Fleet by Category |
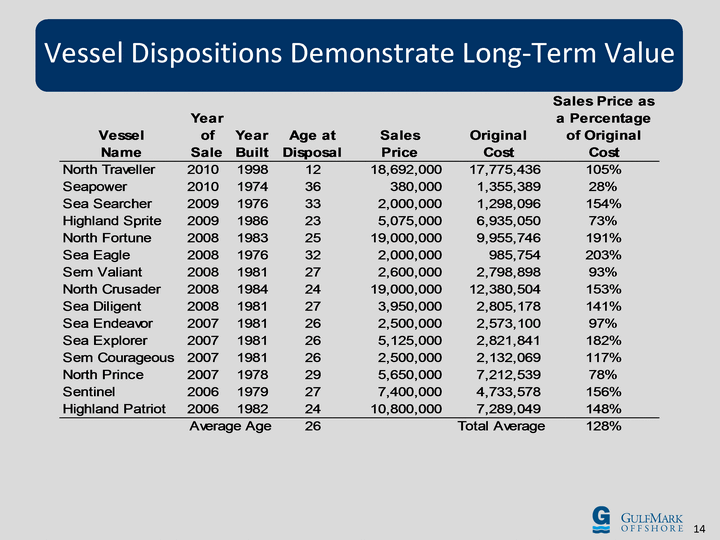
| Vessel Dispositions Demonstrate Long-Term Value |
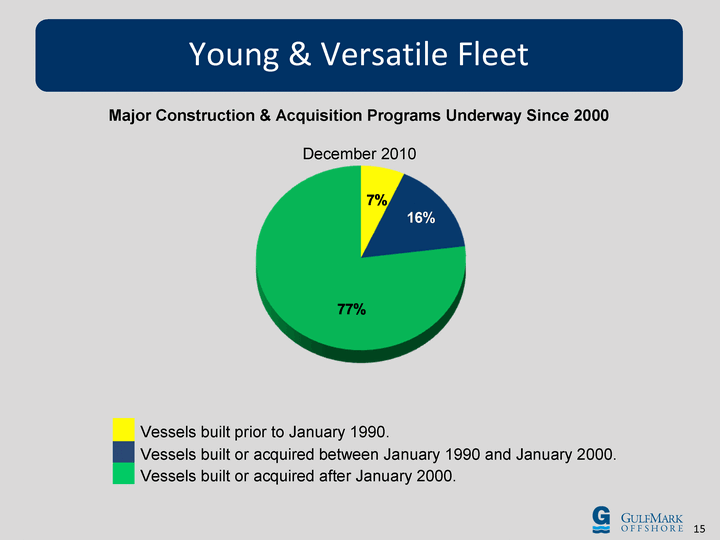
| December 2010 Vessels built prior to January 1990. Vessels built or acquired between January 1990 and January 2000. Vessels built or acquired after January 2000. Young & Versatile Fleet Major Construction & Acquisition Programs Underway Since 2000 |

| Financial Information |
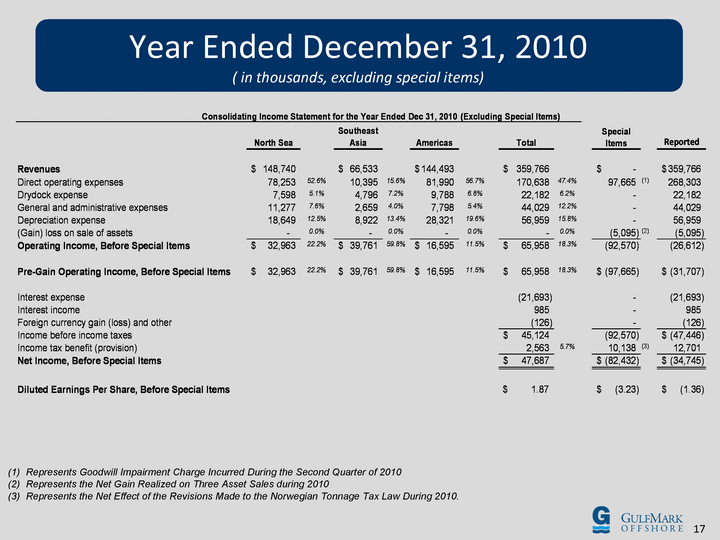
| Year Ended December 31, 2010 ( in thousands, excluding special items) Represents Goodwill Impairment Charge Incurred During the Second Quarter of 2010 Represents the Net Gain Realized on Three Asset Sales during 2010 Represents the Net Effect of the Revisions Made to the Norwegian Tonnage Tax Law During 2010. |
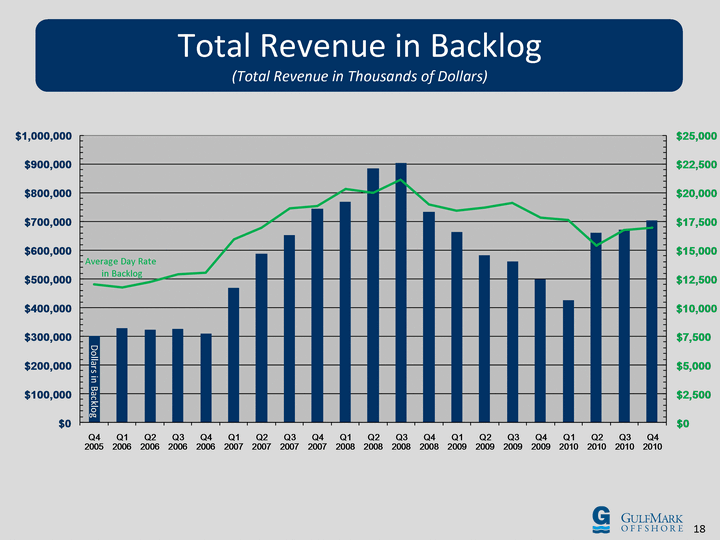
| Total Revenue in Backlog (Total Revenue in Thousands of Dollars) Average Day Rate in Backlog |

| Consistent Reduction in Net Debt Position (dollars in thousands) Net-Debt to Total Book Capitalization Net-Debt Finalization of New-Build Program |
| Industry Leaders in HSE Performance & People Development Strong Demand for Modern Offshore Marine Equipment Global Presence and Operations Expertise Financial Stability & Flexibility to Pursue Opportunities Growth though Acquisition and New Construction Young, Versatile, High-Specification Fleet Investment Highlights |

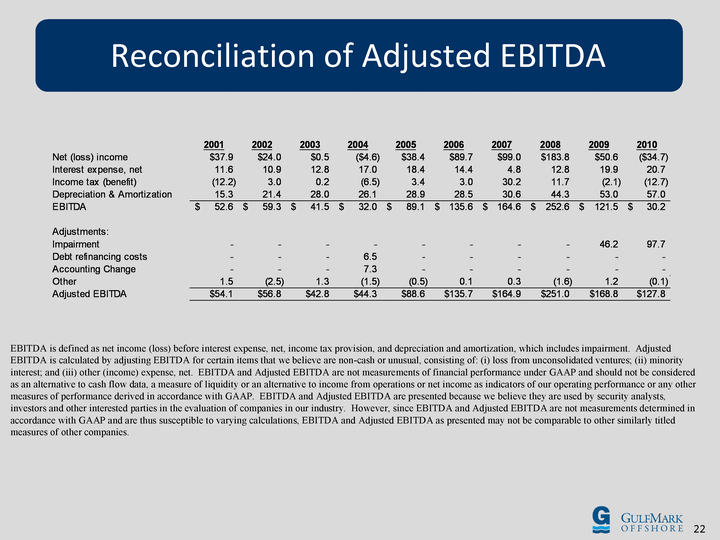
| EBITDA is defined as net income (loss) before interest expense, net, income tax provision, and depreciation and amortization, which includes impairment. Adjusted EBITDA is calculated by adjusting EBITDA for certain items that we believe are non-cash or unusual, consisting of: (i) loss from unconsolidated ventures; (ii) minority interest; and (iii) other (income) expense, net. EBITDA and Adjusted EBITDA are not measurements of financial performance under GAAP and should not be considered as an alternative to cash flow data, a measure of liquidity or an alternative to income from operations or net income as indicators of our operating performance or any other measures of performance derived in accordance with GAAP. EBITDA and Adjusted EBITDA are presented because we believe they are used by security analysts, investors and other interested parties in the evaluation of companies in our industry. However, since EBITDA and Adjusted EBITDA are not measurements determined in accordance with GAAP and are thus susceptible to varying calculations, EBITDA and Adjusted EBITDA as presented may not be comparable to other similarly titled measures of other companies. Reconciliation of Adjusted EBITDA |
