Attached files
| file | filename |
|---|---|
| EX-32.2 - PEETS COFFEE & TEA INC | v215045_ex32-2.htm |
| EX-31.1 - PEETS COFFEE & TEA INC | v215045_ex31-1.htm |
| EX-21.1 - PEETS COFFEE & TEA INC | v215045_ex21-1.htm |
| EX-23.1 - PEETS COFFEE & TEA INC | v215045_ex23-1.htm |
| EX-31.2 - PEETS COFFEE & TEA INC | v215045_ex31-2.htm |
| EX-32.1 - PEETS COFFEE & TEA INC | v215045_ex32-1.htm |
UNITED STATES
SECURITIES AND EXCHANGE COMMISSION
Washington, DC 20549
______________
FORM 10-K
|
x
|
ANNUAL REPORT PURSUANT TO SECTION 13 OR 15(d) OF THE SECURITIES EXCHANGE ACT OF 1934
|
for the fiscal year ended January 2, 2011
OR
|
¨
|
TRANSITION REPORT PURSUANT TO SECTION 13 OR 15(d) OF THE SECURITIES EXCHANGE ACT OF 1934
|
Commission file number 0-32233
PEET’S COFFEE & TEA, INC.
(Exact Name of Registrant as Specified in Its Charter)
______________________________
|
Washington
|
91-0863396
|
|
(State or Other Jurisdiction of
|
(I.R.S. Employer
|
|
Incorporation or Organization)
|
Identification No.)
|
1400 Park Avenue
Emeryville, California 94608-3520
(Address of Principal Executive Offices)(Zip Code)
(510) 594-2100
(Registrant’s telephone number, including area code)
Securities registered pursuant to Section 12(b) of the Act:
|
Title of each class
|
Name of each exchange on which registered
|
|
|
Common Stock, no par value
|
The Nasdaq National Market
|
Securities registered pursuant to Section 12(g) of the Act:
None
________________________
Indicate by check mark whether the registrant is well-known, seasoned filer (as defined in Rule 405 under the Securities Act). Yes ¨ No x
Indicate by check mark whether the registrant is not required to file reports pursuant to Section 13 or Section 15(d) of the Securities Act. Yes ¨ No x
Indicate by check mark whether the registrant (1) has filed all reports required to be filed by Section 13 or 15(d) of the Securities Exchange Act of 1934 during the preceding 12 months (or for such shorter period that the registrant was required to file such reports), and (2) has been subject to such filing requirements for the past 90 days. Yes x No ¨
Indicate by check mark whether the registrant has submitted electronically and posted on its corporate Web site, if any, every Interactive Data File required to be submitted and posted pursuant to Rule 405 of Regulation S-T (§ 232.405 of this chapter) during the preceding 12 months (or for such shorter period that the registrant was required to submit and post such files). Yes ¨ No ¨
Indicate by check mark if disclosure of delinquent filers pursuant to Item 405 of Regulation S-K is not contained herein, and will not be contained, to the best of registrant’s knowledge, in definitive proxy or information statements incorporated by reference in Part III of this Form 10-K or any amendment to this Form 10-K. x
Indicate by check mark whether the registrant is a large accelerated filer, an accelerated filer, a non-accelerated filer, or a smaller reporting company. See the definitions of “large accelerated filer,” “accelerated filer” and “smaller reporting company” in Rule 12b-2 of the Exchange Act.
Large Accelerated Filer ¨ Accelerated Filer x Non-Accelerated Filer ¨ Smaller reporting company ¨
Indicate by check mark whether the registrant is a shell company (as defined in Exchange Act Rule 12b-2). Yes ¨ No x
The approximate aggregate market value of the voting stock held by non-affiliates of the registrant based on the closing price and shares of the Common Stock outstanding on July 4, 2010 (the registrant's most recently completed second quarter), as reported by the Nasdaq National Market, was $497,235,214. Shares of Common Stock held by each officer, director and each person known to the Company to hold 5% or more of the outstanding Common Stock have been excluded as such persons may be deemed to be affiliates of the Company. Such determination of affiliate status is not necessarily a conclusive determination for other purposes.
As of March 11, 2011, 13,076,221 shares of registrant’s Common Stock were outstanding.
DOCUMENTS INCORPORATED BY REFERENCE
Portions of the proxy statement related to the registrant's 2010 annual meeting of shareholders, which proxy statement will be filed under the Securities Exchange Act of 1934 within 120 days of the end of the registrant's fiscal year ended January 2, 2011, are incorporated by reference into Part III of this annual report on Form 10-K.
|
TABLE OF CONTENTS
|
||
|
Page #
|
||
|
PART I
|
||
|
Item 1.
|
Business
|
2
|
|
Item 1A.
|
Risk Factors
|
6
|
|
Item 1B.
|
Unresolved Staff Comments
|
11
|
|
Item 2.
|
Properties
|
11
|
|
Item 3.
|
Legal Proceedings
|
11
|
|
Item 4.
|
Reserved
|
12
|
|
PART II
|
||
|
Item 5.
|
Market for Registrant’s Common Equity, Related Stockholder Matters and Issuer Purchases of Equity Securities
|
13
|
|
Item 6.
|
Selected Consolidated Financial Data
|
16
|
|
Item 7.
|
Management’s Discussion and Analysis of Financial Condition and Results of Operations
|
17
|
|
Item 7A.
|
Quantitative and Qualitative Disclosures About Market Risk
|
26
|
|
Item 8
|
Financial Statements and Supplementary Data
|
26
|
|
Item 9
|
Changes in and Disagreements with Accountants on Accounting and Financial Disclosure
|
26
|
|
Item 9A.
|
Controls and Procedures
|
26
|
|
PART III
|
||
|
Item 10.
|
Directors, Executive Officers and Corporate Governance
|
28
|
|
Item 11.
|
Executive Compensation
|
28
|
|
Item 12.
|
Security Ownership of Certain Beneficial Owners and Management and Related Stockholder Matters
|
28
|
|
Item 13.
|
Certain Relationships and Related Transactions, and Director Independence
|
28
|
|
Item 14.
|
Principal Accountant Fees and Services
|
28
|
|
PART IV
|
||
|
Item 15.
|
Exhibits and Financial Statement Schedules
|
29
|
|
Signatures
|
32
|
References to “we”, “us”, “our”, “Peet’s”, and the “Company” in this annual report on Form 10-K refer to Peet’s Coffee & Tea, Inc.
FORWARD-LOOKING STATEMENTS
This annual report on Form 10-K (this "report") contains forward-looking statements, including in the sections entitled "Business," "Risk Factors" and "Management’s Discussion and Analysis of Financial Condition and Results of Operations." These statements involve known and unknown risks, uncertainties and other factors that may cause our actual results, performance or achievements to be materially different from any future results, performances or achievements expressed or implied by the forward-looking statements. Forward-looking statements include statements about:
|
|
·
|
our expectations regarding the cost and availability of high-quality Arabica coffee beans;
|
|
|
·
|
our expectations regarding commodity cost fluctuations other than coffee
|
|
|
·
|
our expectations regarding the uninterrupted operation of our roasting and distribution facility;
|
|
|
·
|
our ability to successfully implement our business strategy including our ability to market our products and increase our brand recognition;
|
|
|
·
|
the impact on our business of the recent recession or a worsening of the United States and global economies;
|
|
|
·
|
the impact of potential litigation or disputes on our business;
|
|
|
·
|
our ability to continue leasing our retail locations and obtain leases for new stores;
|
|
|
·
|
our ability to promote and enhance our brand;
|
|
|
·
|
our ability to hire and retain well-qualified management and other personnel;
|
|
|
·
|
our ability to attract and retain customers;
|
|
|
·
|
our expectations regarding consumers’ tastes and preferences;
|
|
|
·
|
our ability to successfully compete in our markets; and
|
|
|
·
|
our expectations regarding revenue growth, cost of sales and related occupancy and operating expenses for 2011.
|
You can identify forward-looking statements by the words "may," "should," "could," "predict," "potential," "continue," "expect," "anticipate," "future," "intend," "plan," "believe," "estimate" and similar expressions (or the negative of such expressions.) Forward-looking statements reflect our current views and expectations with respect to future events, are based on estimates and assumptions, and are subject to risks, uncertainties and other important factors. We discuss many of these risks, uncertainties and other important factors in this report in greater detail in the section entitled "Risk Factors" under Part I, Item 1A below. Given these risks, uncertainties and other important factors, you should not place undue reliance on these forward-looking statements. Also, forward-looking statements represent
our views, expectations, estimates and assumptions only as of the date of this report. You should read this report and the documents that we incorporate by reference in and have filed as exhibits to this report, completely and with the understanding that our actual future results may be materially different from what we expect.
Except as required by law, we assume no obligation to update any forward-looking statements publicly, or to update the reasons actual results could differ materially from those anticipated in any forward-looking statements, even if new information becomes available in the future.
1
PART I
Item 1. Business
Peet's Coffee & Tea is a specialty coffee roaster and marketer of fresh roasted whole bean coffee and tea. We sell our Peet’s brand coffee through multiple channels of distribution, including grocery stores, home delivery, office, restaurant and foodservice accounts and Company-owned and operated stores in six states. In addition, we sell Godiva® Chocolatier brand coffees in our grocery channel. We operate our business through two reportable segments: retail and specialty. See Note 14, “Segment Information” in the “Notes to Consolidated Financial Statements” included elsewhere in this report.
Our corporate website is located at www.peets.com. Our annual report on Form 10-K, quarterly reports on Form 10-Q and current reports on Form 8-K, as well as any amendments or exhibits to those reports, are available free of charge through our website at www.peets.com as soon as reasonably practicable after we file them with, or furnish them to, the Securities and Exchange Commission (“SEC”). The content on any website referred to in this report is not incorporated by reference into this report unless expressly noted. The Company was organized as a Washington corporation in 1971.
Company Retail Stores
As of January 2, 2011 we operated 192 retail stores in six states through which we sell whole bean coffee, beverages and pastries, tea, and other related items. Our stores are designed to facilitate the sale of fresh whole bean coffee and to encourage customer trial of our coffee through coffee beverages. Each store has a dedicated staff person at the bean counter to take orders and assist customers with questions on coffee origins and home brewing. Upon order, beans are scooped and ground to the customer's specific requirements. At our beverage counter, we sell freshly-brewed coffees and coffee-based beverages to promote customer familiarity, sampling, and sales of whole-bean coffees. To ensure that our freshness standards
are consistently met, it is our policy not to serve brewed coffee that is more than 30 minutes old and every espresso-based drink is made to order using freshly pulled shots of espresso and freshly steamed milk. Retail stores comprised 61.4%, 64.6% and 65.9% of net revenue for the fiscal years 2010, 2009 and 2008, respectively. See “Item 2. Properties” for further discussion about our retail stores.
Specialty
Grocery
We sell our products through a network of grocery stores, mass merchandisers and club stores, including Safeway, Stop & Shop, Ralph’s, Kroger, Publix, Whole Foods Market, Target and Walmart. To support these sales, we have developed a direct store delivery (“DSD”) selling and merchandising system. Peet's DSD route sales representatives deliver directly to their stores anywhere between one to four times per week, properly shelve the product, rotate to ensure freshness, sell and erect free-standing displays and forge store-level selling relationships. In addition, we ship directly to certain customers depending on the customer and product offering. We currently have 73 company-operated DSD route sales representatives and
approximately 219 independent distributors to support grocery accounts primarily in the western U.S., eastern seaboard and other selected markets. In addition to our Peet’s brand, in 2009, we began selling Godiva brand coffees to establish a competitive position in the flavored coffee segment in grocery stores, mass merchandisers and drug stores. Grocery comprised 22.9%, 20.1% and 18.1% of net revenue for the fiscal years 2010, 2009 and 2008, respectively.
Home Delivery
Our home delivery channel offers our customers the ability to have fresh-roasted coffee and hand-packed tea shipped directly from our roastery to their door and a wider selection of coffees and teas than available in our retail stores or at our grocery store partners. For our most loyal home delivery customers, we provide an automatic recurring delivery coffee and tea service. We offer our home delivery services on our website, peets.com, and through our team of customer service representatives who assist customers in placing orders, as well as choosing gifts. As coffee and tea experts, the customer service team also provides in-depth coffee and tea information to our customers, guiding them through their coffee and tea explorations. Home delivery comprised 5.1%, 5.5% and 6.3% of net revenue for the fiscal years
2010, 2009 and 2008, respectively.
Foodservice and Office
In the foodservice and office business, we have a staff of sales and account managers who make sales calls to potential accounts and conduct quality audits at our existing accounts. Additionally, we have established relationships with foodservice and office distributors to expand our account base in select markets and channels. These distributors have their own sales and account management resources. We have two models for servicing our foodservice accounts and distributing our products: “We Proudly Brew” (“WPB”) accounts and licensing accounts. WPB accounts are foodservice accounts where Peet’s supplies the equipment and product to brew and resell our products. Licensing accounts involve the creation of a full Peet’s beverage store
within another location such as an airport, grocery store or college campus. The license partner is responsible for the build-out and management of the unit, and we provide training and operations oversight. The office coffee channel is a distributor-based business where we sell to specialty distributors who in turn sell our products for brewing to individual offices. Foodservice and office comprised 10.6%, 9.8% and 9.7% of net revenue for the fiscal years 2010, 2009 and 2008, respectively.
2
Our Coffee
Coffee Beans
Coffee is an agricultural crop that undergoes quality changes depending on weather in coffee-producing countries. In addition, coffee is a trade commodity and, in general, its price can fluctuate depending on: weather patterns in coffee-producing countries; economic and political conditions affecting coffee-producing countries; foreign currency fluctuations; the ability of coffee-producing countries to agree to export quotas; and general economic conditions that make commodities more or less attractive investment options. We purchase only high-quality Arabica coffee beans, which are considered superior to beans traded in the commodity market. The Arabica beans purchased by us tend to trade on
a negotiated basis at a substantial premium above commodity coffee prices, depending upon the supply and demand at the time of purchase. We procure coffee from 23 countries, with a large percentage of coffee coming from Central and South America, and over 30 different exporters, brokers and growers. Our access to high-quality Arabica beans depends on our relationships with coffee brokers, exporters and growers, with whom we have built long-term relationships to ensure a steady supply of coffee beans. We believe that, as a result of our reputation that has been built over 40 years, we have access to some of the highest-quality coffee beans from the finest estates and growing regions around the world and we are occasionally presented with opportunities to purchase unique and special coffees.
Unlike roasted coffee beans, green coffee beans are not highly perishable. We generally turn our inventory of green coffee beans two to three times per year. We carry approximately $13 million to $30 million of green coffee beans in our inventory. We currently use fixed-price and not-yet-priced purchase commitments, but in the past have used and may potentially in the future use coffee futures and coffee futures options to manage coffee supply and price risk.
Our Roasting Method
Our roasting method was first developed by Alfred Peet and further honed by our talented and skilled roasting personnel. We roast by hand in small batches, and we rely on the skills and training of each roaster to maximize the flavor and potential in our beans. Our roasters undergo an extensive apprenticeship program to learn our roasting method and to gain the skills necessary to roast coffee at Peet’s and make a long-term commitment to our artisan craft.
Coffee Types and Blends
Beyond sourcing and roasting, we have developed a reputation for expert coffee blending. Our blends, such as Major Dickason’s Blend®, are well regarded by our customers for their uniqueness, consistency and special flavor characteristics. We sell approximately 28 types of coffee as regular menu items, including approximately 16 blends and 12 single origin coffees such as Colombia, Guatemala San Sebastian, Sumatra and Kenya. We also offer a line of high-end reserve coffees including JR Reserve Blend® and Kona, and we have also featured seasonal reserve coffees such as Jamaica Blue Mountain. We are active in seeking, roasting and selling unique special lot and one-time coffees. On average, we offer four to six such
coffees every year, including our Anniversary Blend and Holiday Blend.
In our grocery channel, we also offer a variety of Godiva brand coffees, including several year-round and seasonal flavored coffees, such as Chocolate Truffle and Pumpkin Spice, in addition to a Breakfast Blend.
Tea, Food and Merchandise
Peet’s offers a line of hand selected whole leaf and bagged tea. Our quality standards for tea are very high. We purchase tea directly from importers and brokers and store and pack the tea at our facility in Alameda, California. We offer a limited line of specialty food items, such as high-quality baked goods, chocolates, and other snacks. These products are carefully selected for quality and uniqueness.
Our merchandise program consists of items such as brewing equipment for coffee and tea, paper filters and brewing accessories and branded and non-branded cups, saucers, travel mugs and serveware. We do not emphasize these items, but we carry them in retail stores and offer them through home delivery as a means to reinforce our commitment to premium home-brewed coffee and tea.
3
Competitive Positioning
The specialty coffee category is highly competitive and fragmented among various distribution channels. Starbucks Corporation is the largest competitor in the category. The major distribution channels are coffeehouses (our retail segment) and grocery stores (part of our specialty segment). The specialty coffee market generates most of its sales from coffeehouses that currently number over 25,000 in the United States, according to the National Coffee Association. In addition, coffee is sold by coffee roasters like Peet’s to foodservice operators, direct to consumers through websites and mail order, offices and other places where coffee is consumed or purchased for home consumption.
In the coffeehouse business, Starbucks is our primary competition, but we also compete with small single-unit independently owned coffeehouses and regional or local chains such as Coffee Bean & Tea Leaf, Tully’s and Seattle’s Best (Starbucks). In addition, consumers may purchase prepared coffee beverages at countless locations such as convenience stores, bakeries and restaurants.
Outside of the coffeehouse business, Starbucks is also our primary competitor but we also compete with Green Mountain Coffee Roasters, Illy Caffé, Millstone (J.M. Smucker), Seattle’s Best (Starbucks), and Dunkin’ Donuts as well as numerous smaller, regional brands. In addition, we indirectly compete with more mainstream brands as Maxwell House (Kraft) and Folgers (J.M. Smucker). In the grocery channel, Kraft and J.M. Smucker are the largest players since Kraft distributes its own brands, while J.M. Smucker licenses and distributes the Dunkin’ Donuts brand in addition to its Folgers and Millstone brands.
Over the last several years, the coffee industry has seen two trends that could have a significant impact on the future of the industry and our performance. The first is the “mainstreaming” of specialty coffee as consumers have been upgrading their coffee purchases to higher quality coffee. Today, specialty coffee is growing rapidly and driving almost all of the growth in the coffee category. The second trend is the emergence of coffee makers intended to brew a single cup at a time. The single cup coffee market is still in its early stages, but is growing rapidly. The United States single cup market is currently dominated by Green Mountain Coffee Roasters (“GMCR”) with its cartridge-based Keurig® K-Cup brewing system. Starbucks and GMCR announced in March 2011 that Starbucks is “the exclusive, licensed super-premium coffee brand produced by GMCR for the Keurig Single-Cup brewing system.” There are also several other large, well funded participants with cartridge or pod-based systems competing in this market including Nestle (Nespresso® and Dolce Gusto®), Kraft (Tassimo®), Sara Lee (Senseo®
) and Mars (Flavia®). These two trends could impact our future prospects positively and negatively depending on how we are positioned to compete relative to these trends. Currently, most, but not all, single cup cartridge- or pod-based brewing systems are proprietary and could require us to come to an agreement with the owner of the brewing system to have Peet’s-branded coffee and tea available in cartridges that work in the brewers. This could positively or negatively impact us depending on whether or not we make an agreement to participate in a proprietary single cup system and, if we do, how well that single cup system performs in the marketplace.
We believe that our customers choose among specialty coffee brands based on the total value proposition that includes quality, variety, convenience, personal taste preference, and price. We believe that our market share in the specialty category in all channels is driven by the quality of our product, which is based on a differentiated position built on our bean selectivity, freshness standards and artisan-roasting style. Because of the fragmented nature of the specialty coffee market, we cannot accurately estimate our market share across the whole category.
Our roasted coffee that is sold to the end consumer is priced in tiers. Our regular menu coffees are currently priced in our retail locations within a range of $11.95 to $21.95 per pound. Our line of high-end reserve coffee is priced between $49.90 and $79.90 per pound. In the grocery channel, we sell our coffee in 12 ounce packages at prices established by the grocery store. Most grocery stores sell Peet’s at a price between $7.99 and $10.99 and Godiva between $6.99 and $9.99 for a 12 ounce bag.
Intellectual Property
We regard intellectual property and other proprietary rights as important to our success. We place high value on our Peet's trade name, and we own several trademarks and service marks that have been registered with the United States Patent and Trademark Office, including Peet’s®, Peet’s Coffee & Tea®, peets.com®, Peet’s Coffee®, Peet’s Tea®, Blend 101®, e-Cup®, Espresso Forte®, Fresh Truth®, Gaia Organic Blend®, Garuda Blend®, JR Reserve Blend®, Major Dickason's Blend®, P-Cup®, Peetniks®, Pride of the Port®, Pumphrey’s Blend®, Summer House®, Snow Leopard® and Tea Crafted From Experience®. We also have registered trademarks on our stylized logo and our P-mug design. In addition, we have applications pending with the United States Patent and Trademark Office for the mark Uzuri African Blend™. We own registered trademarks for our name and logo in Argentina, Australia, Brazil, Canada, Chile, China, Colombia, the European Union, Hong Kong, Japan, Paraguay, Philippines, Singapore, South Korea, Taiwan and Thailand. We have
filed additional applications for trademark protection in Indonesia. In addition to peets.com and coffee.com, we own several other domain names relating to coffee, Peet’s and our roasting process.
In addition to registered and pending trademarks, we consider the packaging for our coffee beans (consisting of dark brown coloring with African-style motif and lettering with a white band running around the lower quarter of the bag) and the design of the interior of our stores (consisting of dark wood fixtures, classic lighting, granite countertops and understated color) to be strong identifiers of our brand. Although we consider our packaging and store design to be essential to our brand identity, we have not applied to register these trademarks and trade dress, and thus cannot rely on the legal protections afforded by trademark registration.
4
Our ability to differentiate our brand from those of our competitors depends, in part, on the strength and enforcement of our trademarks. We must constantly protect against any infringement by competitors. If a competitor infringes on our trademark rights, we may have to litigate to protect our rights, in which case, we may incur significant expenses and divert significant attention from our business operations.
Information Systems
The information systems installed at Peet’s are used to manage our operations and increase the productivity of our workforce. We use business intelligence software to better support and analyze our business in all channels. We have a retail point-of-sale system that we believe increases store productivity, provides a higher level of service to our customers and maintains timely information for performance evaluation. We have an integrated labor and scheduling system in our retail stores that enhances productivity and customer service as well as an inventory management system. Our grocery route management system includes integration with a handheld device and software for ordering, invoicing customers and inventory management. In 2009, we completed
the development and implementation of a new $7.1 million enterprise resource planning (ERP) system.
Our website offers a variety of customer-centered features and is fully integrated with our e-commerce and internal order processing and fulfillment systems. Our multi-channel store locator assists our customers in finding our retail, licensed and grocery locations. Additionally, customers with stored value cards can check their balance as well as reload their card online. We also offer in-depth information about our history, involvement in the community and our commitment to sustainable business practices. Our information technology and marketing employees work together to optimize our e-commerce business and deliver our digital marketing programs across all of our business channels
Employees
As of March 11, 2011, we employed a workforce of 3,523 people, approximately 765 of whom work approximately 40 hours per week and are considered full-time employees. We consider our relationship with our employees to be good. Since 1979, we have offered a comprehensive benefits package to all employees who work at least 21 hours per week and have worked at least 500 total hours for the Company. We believe that our competitive benefits package is a critical element in our effort to attract and retain our employees.
Government Regulation
Our coffee roasting operations and our retail stores are subject to various governmental laws, regulations, and licenses relating to customs, health and safety, building and land use, and environmental protection. Our roasting facility is subject to state and local air-quality and emissions regulations. If we encounter difficulties in obtaining any necessary licenses or complying with these laws and regulations, then:
|
|
·
|
The opening of new retail locations could be delayed;
|
|
|
·
|
The operation of existing retail locations or our coffee roasting operations could be interrupted; or
|
|
|
·
|
Our product offerings could be limited.
|
We believe that we are in compliance in all material respects with all such laws and regulations and that we have obtained all material licenses that are required for the operation of our business. We are not aware of any environmental regulations that have or that we believe will have a material adverse effect on our operations.
Executive Officers of the Registrant
Set forth below is information with respect to the names, ages, positions and offices of our executive officers as of March 11, 2011.
|
Name
|
Age
|
Position
|
||
|
Patrick J. O'Dea
|
49
|
Chief Executive Officer, President and Director
|
||
|
Thomas P. Cawley
|
50
|
Chief Financial Officer, Vice President and Secretary
|
||
|
Kay L. Bogeajis
|
56
|
Vice President, Retail Operations
|
||
|
Shawn Conway
|
|
45
|
|
Vice President, Chief Supply Chain Officer
|
5
Patrick J. O'Dea has served as Chief Executive Officer and President and as a director since May 2002. From 1997 to 2001, he was Chief Executive Officer of Archway/Mother’s Cookies and Mother’s Cake and Cookie Company. From 1995 to 1997, Mr. O’Dea was the Vice President and General Manager of the Specialty Cheese Division of Stella Foods. From 1984 to 1995, he was with Procter & Gamble, where he marketed several of the company’s snack and beverage brands.
Thomas P. Cawley has served as Chief Financial Officer since July 2003. From 2000 to 2003, he was at Gap, Inc. serving as Chief Financial Officer, Gap Brand. From 1986 to 2000, Mr. Cawley was at PepsiCo/Yum Brands most recently as Chief Financial Officer of Pizza Hut. Previous to 1986, Mr. Cawley was with The Quaker Oats Company and General Foods.
Kay L. Bogeajis has served as Vice President, Retail Operations since she joined the Company in October 2007. From January 2003 to October 2007, Ms. Bogeajis served as Vice President, Western Operations for Taco Bell Corporation, a Yum! Brands, Inc. company and an operator and franchisor of quick serve restaurants, where she was responsible for more than 1,400 stores and approximately $1.4 billion in system-wide sales. From 2001 to 2003, she was Vice President Systemwide Operations for Taco Bell. Previously, she held prominent retail operations and sales positions with Taco Bell, Frito-Lay, Inc., a PepsiCo company, and Burger King Corporation.
Shawn Conway has served as Vice President, Chief Supply Chain Officer since he joined the Company in January 2010. In March 2011, he was elected as an Executive Officer of the Company. From 2002 to 2010, he was at SKYY Spirits, an alcoholic beverages producer and the North American subsidiary of Gruppo Campari, most recently as Senior Vice President of Operations. Prior to SKYY Spirits Mr. Conway served in numerous senior finance and operations roles including Chief Financial Officer of Gateway Learning Corporation, General Manager of New Ventures at Dreyer’s Grand Ice Cream, as well as various roles within the Clorox Company.
Item 1A. Risk Factors
We may not be successful in the implementation of our business strategy or our business strategy may not be successful, either of which will impede our growth and operating results.
Our business strategy emphasizes expansion through multiple channels of distribution. Our ability to implement this business strategy depends on our ability to:
|
|
·
|
market our products on a national scale and over the internet;
|
|
|
·
|
enter into distribution and other strategic arrangements with third-party retailers and other potential distributors of our coffee;
|
|
|
·
|
increase our brand recognition on a national scale;
|
|
|
·
|
effectively compete in emerging where consumers purchase their coffee such as single serve;
|
|
|
·
|
identify and lease strategic locations suitable for new stores; and
|
|
|
·
|
manage growth in administrative overhead and distribution costs likely to result from the planned expansion of our retail and non-retail distribution channels.
|
We do not know whether we will be able to successfully implement our business strategy or whether our business strategy will be successful. Our revenue and operating results will be adversely affected if we fail to implement our business strategy or if we divert resources to a business strategy that ultimately proves unsuccessful.
Because our business is highly dependent on a single product, specialty coffee, if the demand for specialty coffee decreases, our business could suffer.
Sales of specialty coffee constituted approximately 84% of our 2010 and 2009 net revenue and 83% of our 2008 net revenue. Demand for specialty coffee is affected by many factors, including:
|
|
·
|
Consumer tastes and preferences;
|
|
|
·
|
National, regional and local economic conditions;
|
|
|
·
|
Demographic trends; and
|
|
|
·
|
Perceived or actual health benefits or risks.
|
Because we are highly dependent on consumer demand for specialty coffee, a shift in consumer preferences away from specialty coffee would harm our business more than if we had more diversified product offerings. If customer demand for specialty coffee decreases, our sales would decrease accordingly.
6
If we fail to continue to develop and maintain our brand, our business could suffer.
We believe that maintaining and developing our brand is critical to our success and that the importance of brand recognition may increase as a result of competitors offering products similar to ours. Because the majority of our retail stores are located on the West Coast, primarily in California, our brand recognition remains largely regional. Our brand building initiative involves increasing the availability of our products in grocery stores, license locations and foodservice locations to increase awareness of our brand and create and maintain brand loyalty. If our brand building initiative is unsuccessful, we may never recover the expenses incurred in connection with these efforts and we may be unable to increase our future revenue or implement
our business strategy.
Our success in promoting and enhancing the Peet's brand will also depend on our ability to provide customers with high-quality products and customer service. Although we take measures to ensure that we sell only fresh roasted whole bean coffee and that our retail employees properly prepare our coffee beverages, we have no control over our whole bean coffee products once purchased by customers. Accordingly, customers may prepare coffee from our whole bean coffee inconsistent with our standards, store our whole bean coffee for long periods of time or resell our whole bean coffee without our consent, which in each case, potentially affects the quality of the coffee prepared from our products. If customers do not perceive our products and service to
be of high-quality, then the value of our brand may be diminished and, consequently, our ability to implement our business strategy may be adversely affected.
Coffee costs have increased significantly over the past year and increases in the cost of high-quality Arabica coffee beans could impact the profitability of our business.
In second half of 2010 and first quarter of 2011, we have experienced a dramatic rise in the costs of Arabica coffee traded on New York Board of Trade. In mid-March 2011, coffee commodity prices reached a 35-year high at a level approximately 50% higher than they were six months earlier and over 100% higher than they were a year earlier. While we do not purchase coffee on the commodity markets, price movements in the commodity trading of Arabic coffee beans impact the prices we pay. We expect the coffee commodity market to continue to be challenging as the market continues to be influenced by worldwide demand, the weakness of the dollar, speculative trading and weather and as Brazil – the largest coffee producing company – enters a
cyclically low production year in its biennial crop cycle.
Coffee cost is our second largest cost line item after personnel costs and in 2010 represented approximately 15% of our net revenue. In order to manage coffee costs we purchase and hold large quantities of inventory and use future fixed-price purchase commitments. As of January 2, 2011, between our ending inventory and our fixed-price commitments, we had approximately 21 million pounds of coffee at fixed prices for use in 2011 and 2012. Our requirements for green coffee for 2011 are expected to be approximately 28 to 30 million pounds. Since the coffee we purchase comes from over 20 different countries and creates 28 different types of coffee (including 12 single origin coffees), these coffees are not necessarily interchangeable or substitutable and therefore the covered needs of specific origin coffees varies due to differing growing seasons and origin specific
situations.
We have historically raised prices in each of our channels to offset the higher costs and we did increase prices in each channel in the fourth quarter of 2010 or the first quarter of 2011. Given the concentration of coffee in our cost structure, if coffee costs do not decline and we are unable to pass along increased coffee costs to our customers through further price increases, our profitability is likely to decrease. We will continue to monitor these markets and take actions we feel are appropriate to minimize the impact on us in the short and long term.
Decreases in the availability of high-quality Arabica coffee beans could impact the profitability and growth of our business.
In addition to the cost implications of the above-described factors affecting worldwide coffee production and demand, if we are not able to purchase sufficient quantities of high-quality Arabica beans due to those or other factors, we may not be able to fulfill the demand for our coffee, our revenue may decrease and our ability to expand our business may be negatively impacted.
Besides coffee, we face exposure to other commodity cost fluctuations, which could impair our profitability.
In addition to the increase in coffee costs discussed in the risk factor above, we are exposed to cost fluctuation in other commodities, including, in particular, milk, natural gas and gasoline. In addition, an increase in the cost of fuel could indirectly lead to higher electricity costs, transportation costs and other commodity costs. Much like coffee costs, the costs of these commodities depend on various factors beyond our control, including economic and political conditions, foreign currency fluctuations, and global weather patterns. To the extent we are unable to pass along such costs to our customers through price increases, our margins and profitability will decrease.
7
The recent recession or a worsening of the United States and global economy could materially adversely affect our business.
Our revenues and performance depend significantly on consumer confidence and spending, which have deteriorated due to the recession and may remain depressed for the foreseeable future. Some of the factors that could influence the levels of consumer confidence and spending include, without limitation, continuing conditions in the residential real estate and mortgage markets, access to credit, labor and healthcare costs, increases in fuel and other energy costs, elevated unemployment levels and other macroeconomic factors affecting consumer spending behavior. These and other economic factors could have a material adverse effect on demand for our products and on our financial condition and operating results.
Because our business is based primarily in California, a worsening of economic conditions, a decrease in consumer spending or a change in the competitive conditions in this market may substantially decrease our revenue and may adversely impact our ability to implement our business strategy.
Our California retail stores generated approximately 55% of our 2010 net revenue and approximately 60% of our 2009 and 2008 net revenue and a substantial portion of the revenue from our other distribution channels is generated in California. We expect that our California operations will continue to generate a substantial portion of our revenue. In addition, our California retail stores provide us with means for increasing brand awareness, building customer loyalty and creating a premium specialty coffee brand. As a result, if the current economic downturn and decrease in consumer spending in California continues or worsens, it may not only lead to a substantial decrease in revenue, but may also adversely impact our ability to market our brand,
build customer loyalty, or otherwise implement our business strategy.
Complaints or claims by current, former or prospective employees or governmental agencies could adversely affect us.
We are subject to a variety of laws and regulations which govern such matters as minimum wages, overtime and other working conditions, meal and rest periods, various family leave mandates and a variety of other laws enacted, or rules and regulations promulgated, by federal, state and local governmental authorities that govern these and other employment matters. We have been, and in the future may be, the subject of complaints or litigation from current, former or prospective employees or governmental agencies. In addition, successful complaints against our competitors may spur similar lawsuits against us. For instance, in 2003, two lawsuits (which have since been settled) were filed against us alleging misclassification of employment position and sought damages, restitution, reclassification and attorneys’
fees and costs. In 2008, a lawsuit (which has since been settled) was filed alleging that store managers based in California were not paid overtime wages, were not provided meal or rest periods, were not provided accurate wage statements and were not reimbursed for business expenses. In addition, on February 23, 2010, a complaint was filed by non-exempt employees on their own behalf and on behalf of employees similarly situated alleging claims for unpaid overtime, unpaid meal and rest period premiums, unpaid business expenses, unpaid minimum wages, untimely wages paid at time of termination, untimely payment of wages, failure to pay vacation wages and non-compliant wage statements. These types of claims and litigation involving current, former or prospective employees could divert our management’s time and attention from our business operations and might result in substantial costs of defense, settlement or other disposition, which could have a material adverse effect on our
results of operations in one or more fiscal periods.
Potential claims and litigation could have a material adverse effect on us.
In addition to employment-related claims, Peet’s may be subject to various other claims and litigation. For example, in August 2010, a public interest group sued a number of companies, including us, that sell “ready to drink” coffee in California for allegedly failing to issue clear and reasonable warnings with regard to potential exposures to acrylamide in accordance with California Health and Safety Code section 25249.6 (“Proposition 65”), and in 2007 Peet’s was involved as defendants in lawsuits relating to Peet’s stock option granting practices. Although option-related actions have been dismissed, Peet’s remains subject to the ongoing Proposition 65 litigation and could in the future become subject to other claims and litigation, which could involve, for
example, securities law claims, commercial disputes, public health matters and disputes relating to intellectual property. Lawsuits could divert management’s time and attention from day-to-day operations, often result in significant legal expenses, and can result in outcomes that have a material adverse effect on our business, financial condition, results of operations, cash flows and its stock price.
Labor conditions in the grocery business could negatively impact our grocery business.
There have been grocery strikes in the past that have negatively impacted our grocery business and it is possible that future grocery strikes in places where we have large distribution may adversely impact our grocery business.
8
Government mandatory healthcare requirements could adversely affect our profits.
The Company offers healthcare benefits to all employees who work at least 21 hours a week and meet service eligibility requirements. In the past, some states, including California, have proposed legislation mandating that employers pay healthcare premiums into a state run fund for all employees immediately upon hiring or pay a penalty for failing to do so. If legislation similar to this was to be enacted in California, or in the other states in which we do business, it could have an adverse affect on the Company’s results of operations. In addition, comprehensive health care legislation (the Patient Protection and Affordable Care Act and the Health Care and Education Affordability Reconciliation Act of 2010) was passed and signed into law in
March, 2010. Due to the breadth and complexity of this legislation, the phased-in nature of the implementation, and the lack of implementing regulations, it is difficult to predict the financial and operational impacts this legislation will have on us. Our expenses may significantly increase over the long-term as a result of this legislation.
Because we rely heavily on common carriers to ship our coffee on a daily basis, any disruption in their services or increase in shipping costs could adversely affect our business.
We rely on a number of common carriers to deliver coffee to our customers and retail stores. We consider roasted coffee a perishable product and we rely on these common carriers to deliver fresh roasted coffee on a daily basis. We have no control over these common carriers and the services provided by them may be interrupted as a result of labor shortages, contract disputes or other factors. If we experience an interruption in these services, we may be unable to ship our coffee in a timely manner. A delay in shipping could:
|
|
·
|
have an adverse impact on the quality of the coffee shipped, and thereby adversely affect our brand and reputation;
|
|
|
·
|
result in the disposal of an amount of coffee that could not be shipped in a timely manner; and
|
|
|
·
|
require us to contract with alternative, and possibly more expensive, common carriers.
|
Any significant increase in shipping costs could lower our profit margins or force us to raise prices, which could cause our revenue and profits to suffer.
We depend on the expertise of key personnel. If these individuals leave or change their role within our Company without effective replacements, our operations may suffer.
The success of our business is dependent to a large degree on our management and our coffee roasters and purchasers. If members of our management leave without effective replacements, our ability to implement our business strategy could be impaired. If we lost the services of our coffee roasters and purchasers, our ability to source and purchase a sufficient supply of high-quality coffee beans and roast coffee beans consistent with our quality standards could suffer. In either case, our business and operations could be adversely affected.
We may not be able to hire or retain additional management and other personnel and our recruiting and training costs may increase as a result of turnover, both of which may increase our costs and reduce our profits and may adversely impact our ability to implement our business strategy.
The success of our business depends upon our ability to attract and retain highly motivated, well-qualified management and other personnel, including technical personnel and retail employees. We face significant competition in the recruitment of qualified employees. Our ability to execute our business strategy may suffer if:
|
|
·
|
we are unable to recruit or retain a sufficient number of qualified employees;
|
|
|
·
|
the costs of employee compensation or benefits increase substantially; or
|
|
|
·
|
the costs of outsourcing certain tasks to third-party providers increase substantially.
|
A significant interruption in the operation of our roasting and distribution facility could potentially disrupt our operations.
We have only one roasting and distribution facility that roasts Peet’s coffee. A significant interruption in the operation of our roasting and distribution facility, whether as a result of a natural disaster, pandemic or other causes, could significantly impair our ability to operate our business. Since we only roast our coffee to order, we do not carry inventory of roasted coffee in our roasting plant. Therefore, a disruption in service in our roasting facility would impact our sales in our retail and specialty channels almost immediately. Moreover, our roasting and distribution facility and most of our stores are located near several major earthquake faults and our roastery is located directly on the bay in Alameda. The impact of a major earthquake or
tsunami on our facilities, infrastructure and overall operations is difficult to predict and an earthquake or tsunami could seriously disrupt our entire business.
A major earthquake or tsunami could seriously disrupt our entire business.
Our roasting and distribution facility and several dozens of our stores are located near several major earthquake faults and near the water in the San Francisco Bay area. The impact of a major earthquake and/or tsunami in the San Francisco Bay area on our facilities, infrastructure and overall operations is difficult to predict, and an earthquake or tsunami could seriously disrupt our entire business. Our insurance may not adequately cover our losses and expenses in the event of an earthquake. As a result, a major earthquake or tsunami in the San Francisco Bay area could not only seriously disrupt our business, but may also lead to substantial losses.
9
Our costs could be negatively affected by an unpredictable workers' compensation environment.
The majority of our employees are located in California, which has experienced higher workers compensation costs and rates than other states. For the policy years beginning March 2002 through February 2008 our workers' compensation insurance program was a modified self-insured program with a high deductible and an overall program ceiling to limit exposure. For those years, we have established a reserve of $0.5 million. However, the settlement costs for the remaining claims for those years could exceed our reserves. For the policy years beginning March 1, 2008, we have purchased a guaranteed cost policy. As a result, for 2008 and subsequent policy years, we remain exposed to premium fluctuations due to California’s unpredictable workers compensation environment and rising costs and our
historical worker compensation experience. Settlement costs in excess of our reserves (for claims before March 2008) or an increase in insurance premiums could impair our profitability.
Our roasting methods are not proprietary, so competitors may be able to duplicate them, which could harm our competitive position.
We consider our roasting methods essential to the flavor and richness of our roasted whole bean coffee and, therefore, essential to our brand. Because we do not hold any patents for our roasting methods, it may be difficult for us to prevent competitors from copying our roasting methods. If our competitors copy our roasting methods, the value of our brand may be diminished, and we may lose customers to our competitors. In addition, competitors may be able to develop roasting methods that are more advanced than our roasting methods, which may also harm our competitive position.
Competition in the specialty coffee market is intense and could affect our profits and outlook.
The specialty coffee category is highly competitive and fragmented among various distribution channels. Our major distribution channels remain coffeehouses (our retail segment) and grocery stores (part of our specialty segment), but coffee is sold by coffee roasters like Peet’s to foodservice operators, direct to consumers through websites and mail order, offices and other places where coffee is consumed or purchased for home consumption.
In addition, the single cup coffee market, though still in the early stages, is growing rapidly. The United States single cup market is currently dominated by Green Mountain Coffee Roasters (“GMCR”) with its cartridge-based Keurig® K-Cup brewing system. Starbucks and GMCR announced in March 2011 that Starbucks is “the exclusive, licensed super-premium coffee brand produced by GMCR for the Keurig Single-Cup brewing system.” There are also several other large, well funded participants with cartridge- or pod-based systems competing in this market including Nestle (Nespresso and Dolce Gusto), Kraft (Tassimo), Sara Lee (Senseo) and Mars (Flavia). Currently, most, but not all, single cup cartridge- or
pod-based brewing systems are proprietary and could require us to come to an agreement with the owner of the brewing system to have Peet’s-branded coffee and tea available in cartridges that work in the brewers. If the single cup cartridge or pod-based market of proprietary brewing systems continues to grow rapidly at the expense of the non-proprietary single cup brewing methods or existing drip brewing methods and we do not participate in that market segment, our revenue and profit margins could be negatively impacted in the future.
Many of Peet’s competitors, including Starbucks, GMCR, Millstone (J.M. Smucker) Nestle and Kraft, are much larger and have greater financial resources than we do. As a result, these competitors may greater flexibility and resources to react to changes in the market. For instance, we were unable to purchase Diedrich Coffee in 2009, because GMCR, the eventual purchaser of Diedrich Coffee, had substantially greater financial resources than us and was able to pay a substantially higher purchase price for Diedrich Coffee. Our competitors may continue to use their size and financial resources to impair our ability to execute our business strategy and reduce our profit margins in the future.
Adverse public or medical opinion about caffeine may harm our business.
Our specialty coffee contains significant amounts of caffeine and other active compounds, the health effects of some of which are not fully understood. A number of research studies conclude or suggest that excessive consumption of caffeine may lead to increased heart rate, nausea and vomiting, restlessness and anxiety, depression, headaches, tremors, sleeplessness and other adverse health effects. An unfavorable report on the health effects of caffeine or other compounds present in coffee could significantly reduce the demand for coffee, which could harm our business and reduce our sales and profits. In addition, we could become subject to litigation relating to the existence of such compounds in our coffee; litigation that could be costly and
could divert management attention.
10
Adverse publicity regarding product quality or food and beverage safety, whether or not accurate, may harm our business.
We may be the subject of complaints or litigation from customers alleging beverage and food-related illnesses, injuries suffered on the premises or other quality, health or operational concerns. Adverse publicity resulting from such allegations may materially adversely affect us, regardless of whether such allegations are true or whether we are ultimately held liable. In addition, any litigation relating to such allegations could be costly and could divert management attention.
Item 1B. Unresolved Staff Comments
Not Applicable.
Item 2. Properties
Peet’s headquarters are located in Emeryville, California. The lease for our main office space devoted to general corporate and business channel overhead and a call center for the home delivery business is approximately 60,000 square feet and extends to October 2015 with two five-year extension options. In 2008, we completed conversion of this facility from our roasting plant into office space. In addition, we have a lease for a second office and warehouse space totaling approximately 8,000 square feet through April 30, 2013.
In December 2006, we purchased approximately 460,000 square feet of land and a 138,000 square foot building with related site improvements in Alameda, California, for the purpose of operating a new roasting and distribution facility. The final purchase price of the facility and the land was $18.6 million. We transitioned our operations to this facility and were effectively at full production capability by May 2007.
In 2010, we opened 2 new stores and we closed 2 stores upon the expiration of their leases. Our retail locations are all company-owned and operated in leased facilities. Our stores are typically located in urban neighborhoods, suburban shopping centers (usually consisting of grocery, specialty and service stores) and on high-traffic streets.
The following table lists the number of retail locations as of January 2, 2011:
|
Location
|
Number
|
|||
|
Northern California
|
126 | |||
|
Southern California
|
41 | |||
|
Illinois
|
2 | |||
|
Oregon
|
8 | |||
|
Massachusetts
|
5 | |||
|
Washington
|
7 | |||
|
Colorado
|
3 | |||
|
Total
|
192 | |||
Item 3. Legal Proceedings
In 2008, we were sued in California Superior Court, Alameda County by three former employees on behalf of themselves and all other California store managers. The plaintiffs alleged that store managers based in California were not paid overtime wages, were not provided meal or rest periods, were not provided accurate wage statements and were not reimbursed for business expenses. On December 16, 2009, we reached a tentative settlement pursuant to which we would deny any liability but agree to maximum payment of $2.6 million, including plaintiff’s attorney’s fees. The California Superior Court approved the final settlement on September 1, 2010. Based on the final settlement amount, we recorded into income a credit of $93,000 during the thirteen weeks ended October 3, 2010 based
on the difference between the original $2.6 million recorded liability and the anticipated settlement payment. These costs are shown separately as litigation-related expenses in the consolidated statements of income.
On February 23, 2010, we were sued in Orange County Superior Court by two former employees, on behalf of themselves and all other non-exempt employees similarly situated in the state of California naming us as a defendant. One of the plaintiffs was removed by an amended complaint and the remaining plaintiff alleges claims for unpaid overtime, unpaid meal and rest period premiums, unpaid business expenses, unpaid minimum wages, untimely wages paid at time of termination, untimely payment of wages, failure to pay vacation wages, violation of California Business & Professions Code section 17200 and non-compliant wage statements, and seeks injunctive relief, restitution, monetary damages, penalties under the California Labor Code Private Attorneys General Act, costs and attorneys’ fees, penalties,
and prejudgment interest. At this time, it is not feasible to predict the outcome of or a range of loss, should a loss occur, from this proceeding. We have previously settled two employment-related lawsuits certified as a class: In addition to the $2.5 million settlement in 2010 discussed above, we made a final settlement payment for $2.1 million in 2004 of another class action lawsuit.
11
On February 2, 2010, the Council for Education and Research on Toxics (“CERT”), a public interest group, issued a series of pre-litigation notices of intent to sue a number of companies, including us, which sell “ready to drink” coffee in California for allegedly failing to issue clear and reasonable warnings with regard to potential exposures to acrylamide in accordance with Proposition 65. We were among a number of companies named in an action filed in California Superior Court, Los Angeles County, on August 7, 2010. On December 14, 2010, CERT served a new 60-day notice letter to us and other companies alleging additional violations of Proposition 65 arising from potential acrylamide exposures from coffee sold at retail and brewed and consumed elsewhere. We intend to
vigorously defend against these claims. As this matter is at a very early stage, at this time, we are not able to predict the probability of the outcome or estimate of loss, if any, related to this matter.
We may from time to time become involved in certain legal proceedings in the ordinary course of business. We are not a party to any other legal proceedings that management believes would have a material adverse effect on the financial position or results of operations of the Company.
Item 4. Reserved
12
PART II
Item 5. Market for Registrant’s Common Equity, Related Stockholder Matters and Issuer Purchases of Equity Securities
Market for the Registrant’s Stock
The Company’s common stock is traded on the Nasdaq National Market under the symbol ‘‘PEET’’. The following table sets forth, for the periods indicated, the high and low closing prices for our common stock as reported on the Nasdaq National Market for each quarter during the last two fiscal years.
|
High
|
Low
|
|||||||
|
Fiscal Year Ended January 2, 2011
|
||||||||
|
Fourth Quarter
|
$ | 42.73 | $ | 33.20 | ||||
|
Third Quarter
|
41.93 | 33.34 | ||||||
|
Second Quarter
|
41.63 | 35.69 | ||||||
|
First Quarter
|
41.66 | 31.82 | ||||||
|
Fiscal Year Ended January 3, 2010
|
||||||||
|
Fourth Quarter
|
$ | 41.58 | $ | 27.51 | ||||
|
Third Quarter
|
28.54 | 25.20 | ||||||
|
Second Quarter
|
29.00 | 21.33 | ||||||
|
First Quarter
|
23.54 | 19.41 | ||||||
As of March 11, 2011, there were approximately 361 registered holders of record of the Company’s common stock. On March 11, 2011, the last sale price reported on the Nasdaq National Market for the common stock was $42.80 per share.
Dividend Policy
We have not declared or paid any dividends on our capital stock since becoming a public company. We expect to retain any future earnings to fund the development and expansion of our business. Therefore, we do not anticipate paying cash dividends on our common stock in the foreseeable future.
Issuer Purchases of Equity Securities
In October 2008, our Board of Directors authorized the repurchase up to one million shares of common stock, with no deadline or target date for completion. During the year ended January 2, 2011, we repurchased and retired 735,888 shares of common stock at an average price of $38.64 per share in accordance with this program. No shares remain available for purchase under this program.
In September 2010, our Board of Directors authorized the repurchase up to one million additional shares of common stock, with no deadline or target date for completion. During the year ended January 2, 2011, we repurchased and retired 194,549 shares of common stock at an average price of $40.57 per share in accordance with this program. From January 3, 2011 through March 11, 2011, we repurchased and retired 390,795 shares of common stock at an average price of $40.99 per share in accordance with this program. As of March 11, 2011, 414,656 shares remain available for purchase under this program. Repurchases under this program may be made from time to time on the open market at prevailing market prices or in negotiated transactions off
the market.
13
The following table sets forth all purchases made by us or any “affiliated purchaser” as defined in Rule 10b-18(a)(3) of the Exchange Act of the Company’s common stock during the fourth fiscal quarter of 2010.
|
Period
|
Total Number of
Shares
Purchased
|
Average Price
Paid per Share
|
Total Number of
Shares Purchased as
Part of Publicly
Announced Plans or
Programs
|
Maximum Number of Shares that
May Yet Be Purchased Under the
Plans or Programs
|
||||||||||||
|
October 4, 2010 -
November 7, 2010
|
- | $ | - | 994,781 | 1,005,219 | |||||||||||
|
November 8, 2010 -
December 5, 2010
|
67,000 | $ | 38.64 | 1,061,781 | 938,219 | |||||||||||
|
December 6, 2010 -
January 2, 2011
|
132,768 | $ | 41.48 | 1,194,549 | 805,451 | |||||||||||
14
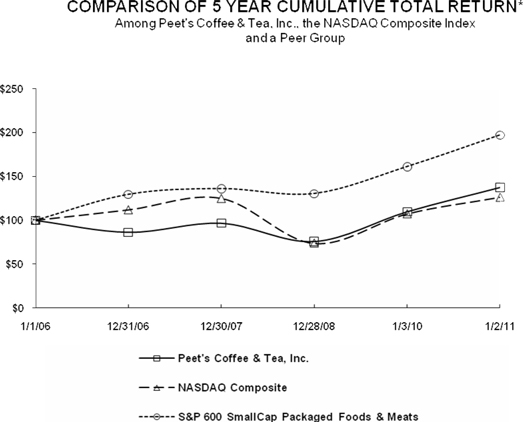
Performance Graph*
The following graph depicts the Company’s total return to shareholders from January 1, 2006 through January 2, 2011, relative to the performance of the NASDAQ Composite Index, and the Standard & Poor’s Smallcap 600 Consumer Goods Sector, Packaged Foods & Meats Industry. All indices shown in the graph have been reset to a base of 100 as of January 1, 2006, assume an investment of $100 on that date and the reinvestment of dividends paid since that date, calculated on a monthly basis. Since becoming a public company, the Company has not paid cash dividends on its common stock. The points represent index levels based on the last trading day of the Company’s fiscal year. The chart set forth below was prepared by Research Data Group, Inc., which holds a license to provide the
indices used herein. The stock price performance shown in the graph is not necessarily indicative of future price performance.
*This section is not “soliciting material”, is not deemed “filed” with the SEC and is not to be incorporated by reference in any of our filings under the Securities Act or the Securities Exchange Act made before or after the date hereof and irrespective of any general incorporation language in any such filing.
15
Item 6. Selected Consolidated Financial Data
The table below shows selected consolidated financial data for our last five fiscal years. Our fiscal year is based on a 52 or 53-week year and ends on the Sunday closest to the last day in December.
The following selected consolidated financial data should be read in conjunction with our consolidated financial statements and related notes and “Management’s Discussion and Analysis of Financial Condition and Results of Operations” included elsewhere in this report.
Selected Consolidated Financial Data
(in thousands, except per share data)
| Year | ||||||||||||||||||||
|
2010
|
2009
|
2008
|
2007
|
2006
|
||||||||||||||||
|
(52 weeks)
|
(53 weeks)
|
(52 weeks)
|
(52 weeks)
|
(52 weeks)
|
||||||||||||||||
|
Statement of Income Data:
|
||||||||||||||||||||
|
Net revenue
|
$ | 333,808 | $ | 311,270 | $ | 284,822 | $ | 249,389 | $ | 210,493 | ||||||||||
|
Cost of sales and related occupancy expenses
|
154,892 | 142,776 | 133,537 | 118,389 | 98,928 | |||||||||||||||
|
Operating expenses
|
109,646 | 106,652 | 98,844 | 85,800 | 72,272 | |||||||||||||||
|
Transaction related expenses/(income)
|
970 | (4,183 | ) | - | - | - | ||||||||||||||
|
Litigation related expenses
|
(93 | ) | 2,957 | - | - | - | ||||||||||||||
|
General and administrative expenses
|
25,088 | 24,508 | 22,519 | 22,682 | 20,634 | |||||||||||||||
|
Depreciation and amortization expenses
|
15,767 | 15,167 | 12,921 | 10,912 | 8,609 | |||||||||||||||
|
Income from operations
|
27,538 | 23,393 | 17,001 | 11,606 | 10,050 | |||||||||||||||
|
Gain on sale of marketable securities
|
- | 7,305 | - | - | - | |||||||||||||||
|
Interest income, net
|
8 | 112 | 726 | 1,446 | 2,456 | |||||||||||||||
|
Income before income taxes
|
27,546 | 30,810 | 17,727 | 13,052 | 12,506 | |||||||||||||||
|
Income tax provision
|
10,045 | 11,558 | 6,562 | 4,675 | 4,690 | |||||||||||||||
|
Net income
|
$ | 17,501 | $ | 19,252 | $ | 11,165 | $ | 8,377 | $ | 7,816 | ||||||||||
|
Net income per share:
|
||||||||||||||||||||
|
Basic
|
$ | 1.34 | $ | 1.48 | $ | 0.81 | $ | 0.61 | $ | 0.57 | ||||||||||
|
Diluted
|
$ | 1.28 | $ | 1.44 | $ | 0.80 | $ | 0.59 | $ | 0.55 | ||||||||||
|
Shares used in calculation of net income per share:
|
||||||||||||||||||||
|
Basic
|
13,038 | 12,997 | 13,723 | 13,724 | 13,733 | |||||||||||||||
|
Diluted
|
13,643 | 13,349 | 13,997 | 14,120 | 14,202 | |||||||||||||||
|
Balance Sheet Data:
|
||||||||||||||||||||
|
Cash and cash equivalents
|
$ | 44,629 | $ | 47,934 | $ | 4,719 | $ | 15,312 | $ | 7,692 | ||||||||||
|
Working capital
|
81,621 | 67,188 | 36,422 | 38,380 | 37,254 | |||||||||||||||
|
Total assets
|
208,832 | 204,803 | 176,352 | 177,547 | 153,005 | |||||||||||||||
|
Total shareholders' equity
|
172,500 | 165,056 | 143,907 | 147,253 | 127,439 | |||||||||||||||
See discussion of Transaction related expenses/(income), litigation related expenses, and gain on sale of marketable securities in 2010 and 2009 in “Item 7. Management’s Discussion and Analysis of Financial Condition and Results of Operations.”
16
Item 7. Management’s Discussion and Analysis of Financial Condition and Results of Operations
You should read the following discussion and analysis in conjunction with our consolidated financial statements and related notes included elsewhere in this report. Except for historical information, the discussion below contains forward-looking statements within the meaning of Section 21E of the Securities Exchange Act of 1934. The fiscal year ended January 2, 2011 (fiscal 2010) included 52 weeks, the fiscal year ended January 3, 2010 (fiscal 2009) included 53 weeks, and the fiscal year ended December 28, 2008 (fiscal 2008) included 52 weeks.
Company Overview and Industry Outlook
Peet’s is a specialty coffee roaster and marketer of fresh, deep-roasted whole bean coffee and tea sold through multiple channels of distribution for home and away-from-home enjoyment. Founded in Berkeley, California in 1966, Peet's has established a loyal customer base with strong brand awareness in California. Our growth strategy is based on the sale of whole bean coffee, tea and high-quality beverages in multiple channels of distribution including our own retail stores, grocery, home delivery, and foodservice and office accounts throughout the United States.
We expect the specialty coffee industry, fueled by continued consumer interest in high-quality coffee and related products, to continue to grow. We believe that growth opportunities exist in all of our distribution channels and that our specialty segment can expand to geographies where we do not have a retail presence. Our first priority has been to develop primarily in the western U.S. markets where we already have a presence and higher customer awareness. In the long-term, we expect to continue to open new retail stores in strategic west coast locations that meet our demographic profile. In grocery, we expect to continue to expand into new markets in addition to the western U.S., eastern seaboard and other selected markets, although the full extent of our penetration will depend upon the growth
of the specialty coffee category in those markets. We will continue to partner with distributors and companies to expand our presence in the foodservice and office environment.
Our goals for 2011 are a continuation of the strategy that the Company has undertaken for the past 3 years which focuses on: growing the Company’s specialty business by increasing market share in existing geographies and expanding to new markets and channels, improving operating margins in our retail business, and delivering sustainable cost improvements across the Company. Results in 2010 reflect the success of achieving these objectives. In 2010, we grew our grocery business 24% on a comparable 52-week basis, with growth in both existing markets and new distribution. We significantly improved operating margins in our retail business by continuing to focus on labor and other operational improvements. In addition, while growing the
business, we have leveraged the Company’s infrastructure, gaining efficiencies in the roasting plant and reducing operating expenses.
In second half of 2010 and first quarter of 2011, we have experienced a dramatic rise in the costs of Arabica coffee traded on New York Board of Trade. In mid-March 2011, coffee commodity prices reached a 35-year high at a level approximately 50% higher than they were six months earlier and over 100% higher than they were a year earlier. While we do not purchase coffee on the commodity markets, price movements in the commodity trading of Arabica coffee beans impact the prices we pay. We expect the coffee commodity market to continue to be challenging as the market continues to be influenced by worldwide demand, the weakness of the dollar, speculative trading and weather and as producers in Brazil—the world’s largest coffee producing country—enter a cyclically low
production year in its biennial crop cycle.
Coffee cost is our second largest cost line item after personnel costs and in 2010 represented approximately 15% of our net revenue. In order to manage coffee costs we purchase and hold large quantities of inventory and use future fixed-price purchase commitments. As of January 2, 2011, between our ending inventory and our fixed-price commitments, we had approximately 21 million pounds of coffee at fixed prices for use in 2011 and 2012. We estimate approximately 2 million pounds will be available for 2012. Our requirements for green coffee for 2011 are expected to be approximately 28 to 30 million pounds. Since the coffee we purchase comes from over 20 different countries and creates 28 different types of coffee (including 12 single origin coffees), these coffees are not necessarily interchangeable or substitutable and therefore the covered needs of specific origin coffees
varies due to differing growing seasons and origin specific situations.
We have historically raised prices in each of our channels to offset the higher costs and we did increase prices in each channel in the fourth quarter of 2010 or the first quarter of 2011. Given the concentration of coffee in our cost structure, if coffee costs do not decline and we are unable to pass along increased coffee costs to our customers through further price increases, our profitability is likely to decrease. We will continue to monitor these markets and take actions we feel are appropriate to minimize the impact on us in the short and long term.
17
Business Segments
Our coffee and related items are sold through multiple channels of distribution that provide broad market exposure to potential purchasers of fresh roasted whole bean coffee. We are indifferent as to where consumers purchase our coffees and teas, and believe that our specialty and retail segments are synergistic. However, we also recognize that the economics and distribution models of our retail stores and other distribution channels are different enough that we have chosen to report them as separate segments under ASC 280, “Segment Reporting”. Therefore, we currently have two reportable segments, consisting of:
|
|
·
|
Retail stores, which consist of our company owned retail stores; and
|
|
|
·
|
Specialty, which consist of Peet’s and Godiva branded sales to grocery stores, and Peet’s sales to foodservice and office accounts, and home delivery customers.
|
Business Categories
In addition to our reportable segments, we measure our business by monitoring the volume and revenue growth of two distinct business categories:
|
|
·
|
Whole bean coffee and related products, consisting of products for home brewing, tea and packaged foods; and
|
|
|
·
|
Beverages and pastries.
|
We believe these business categories are useful in understanding our results of operations for the periods presented because we operate our stores and record revenue through these two categories. Our stores are primarily designed to facilitate the sale of fresh whole bean coffee and hand-crafted coffee beverages. The format of our stores replicates that of a specialty grocer. Beans are freshly scooped from bins under the counter, weighed on counter top scales and hand packed into branded bags. In addition, our stores are also designed to encourage customer trial of our coffee through coffee beverages. Each store has a beverage bar that is dedicated to the sale of prepared beverages and artisan baked pastries.
Results of Operations
The following discussion on results of operations should be read in conjunction with “Item 6. Selected Consolidated Financial Data,” the consolidated financial statements and accompanying notes and the other financial data included elsewhere in this report.
Our fiscal year is based on a 52 or 53-week year. The fiscal year ends on the Sunday closest to the last day of December. 2010 was a 52-week year, 2009 was a 53-week year, and 2008 was a 52-week year. Percent data may not sum due to rounding.
18
Statement of operations data as a percent of net revenue
|
2010
|
2009
|
2008
|
||||||||||
|
Statement of income as a percent of net revenue:
|
||||||||||||
|
Net revenue
|
100.0 | % | 100.0 | % | 100.0 | % | ||||||
|
Cost of sales and related occupancy expenses
|
46.4 | 45.9 | 46.9 | |||||||||
|
Operating expenses
|
32.8 | 34.3 | 34.7 | |||||||||
|
Transaction related expenses/(income)
|
0.3 | (1.3 | ) | - | ||||||||
|
Litigation related expenses
|
- | 0.9 | - | |||||||||
|
General and administrative expenses
|
7.5 | 7.9 | 7.9 | |||||||||
|
Depreciation and amortization expenses
|
4.7 | 4.9 | 4.5 | |||||||||
|
Income from operations
|
8.2 | 7.5 | 6.0 | |||||||||
|
Gain on sale of marketable securities
|
- | 2.3 | - | |||||||||
|
Interest income, net
|
- | - | 0.3 | |||||||||
|
Income before income taxes
|
8.3 | 9.9 | 6.2 | |||||||||
|
Income tax provision
|
3.0 | 3.7 | 2.3 | |||||||||
|
Net income
|
5.3 | % | 6.2 | % | 3.9 | % | ||||||
|
Percent of net revenue by business segment:
|
||||||||||||
|
Retail stores
|
61.4 | % | 64.6 | % | 65.9 | % | ||||||
|
Specialty
|
38.6 | 35.4 | 34.1 | |||||||||
|
Percent of net revenue by business category:
|
||||||||||||
|
Whole bean coffee and related products
|
55.8 | % | 54.1 | % | 53.0 | % | ||||||
|
Beverages and pastries
|
44.2 | 45.9 | 47.0 | |||||||||
|
Cost of sales and related occupancy expenses as a percent of segment revenue:
|
||||||||||||
|
Retail stores
|
43.2 | % | 43.7 | % | 45.5 | % | ||||||
|
Specialty
|
51.5 | 49.9 | 49.6 | |||||||||
|
Operating expenses as a percent of segment revenue:
|
||||||||||||
|
Retail stores
|
40.3 | % | 41.6 | % | 42.4 | % | ||||||
|
Specialty
|
20.9 | 20.9 | 19.8 | |||||||||
|
Percent increase (decrease) from prior year:
|
||||||||||||
|
Net revenue
|
7.2 | % | 9.3 | % | 14.2 | % | ||||||
|
Retail stores
|
2.0 | 7.1 | 11.5 | |||||||||
|
Specialty
|
16.9 | 13.4 | 19.9 | |||||||||
|
Cost of sales and related occupancy expenses
|
8.5 | 6.9 | 12.8 | |||||||||
|
Operating expenses
|
2.8 | 7.9 | 15.2 | |||||||||
|
Transaction related expenses/(income)
|
(123.2 | ) | 100.0 | - | ||||||||
|
Litigation related expenses
|
(103.1 | ) | 100.0 | - | ||||||||
|
General and administrative expenses
|
2.4 | 8.8 | (0.7 | ) | ||||||||
|
Depreciation and amortization expenses
|
4.0 | 17.4 | 18.4 | |||||||||
|
Selected operating data:
|
||||||||||||
|
Number of retail stores in operation
|
||||||||||||
|
Beginning of the year
|
192 | 188 | 166 | |||||||||
|
Store openings
|
2 | 8 | 23 | |||||||||
|
Store closures
|
(2 | ) | (4 | ) | (1 | ) | ||||||
|
End of the year
|
192 | 192 | 188 | |||||||||
19
2010 (52 weeks) Compared with 2009 (53 weeks)
Net revenue
Net revenue for 2010 increased as a result of continued expansion of our retail and specialty segments offset by the impact of an extra week in fiscal year 2009. The table below sets forth net revenues for 2010 and 2009 on an actual and on a non-GAAP 52-week basis by business segment as well as business category.
|
Impact of 2009 53rd Week
|
||||||||||||||||||||||||||||
|
52 weeks
|
53 weeks
|
Non-Gaap 2009
|
Increase/
|
|||||||||||||||||||||||||
|
(dollars in thousands)
|
2010
|
2009
|
Increase/(Decrease)
|
2009 53rd week
|
52 weeks*
|
(Decrease)
|
||||||||||||||||||||||
|
Retail stores:
|
||||||||||||||||||||||||||||
|
Whole bean coffee, tea, and related products
|
$ | 57,862 | $ | 58,579 | $ | (717 | ) | -1.2% | $ | 1,335 | $ | 57,244 | 1.1% | |||||||||||||||
|
Beverages and pastries
|
147,254 | 142,560 | 4,694 | 3.3% | 2,339 | 140,221 | 5.0% | |||||||||||||||||||||
|
Total Retail stores
|
$ | 205,116 | $ | 201,139 | $ | 3,977 | 2.0% | $ | 3,675 | $ | 197,465 | 3.9% | ||||||||||||||||
|
Specialty:
|
||||||||||||||||||||||||||||
|
Grocery
|
$ | 76,303 | $ | 62,662 | $ | 13,641 | 21.8% | $ | 1,271 | $ | 61,391 | 24.3% | ||||||||||||||||
|
Foodservice and office
|
35,330 | 30,248 | 5,082 | 16.8% | 449 | 29,799 | 18.6% | |||||||||||||||||||||
|
Home delivery
|
17,059 | 17,221 | (162 | ) | -0.9% | 197 | 17,024 | 0.2% | ||||||||||||||||||||
|
Total Specialty
|
$ | 128,692 | $ | 110,131 | $ | 18,561 | 16.9% | $ | 1,917 | $ | 108,214 | 18.9% | ||||||||||||||||
|
Total net revenue
|
$ | 333,808 | $ | 311,270 | $ | 22,538 | 7.2% | $ | 5,591 | $ | 305,679 | 9.2% | ||||||||||||||||
*The 2009 52-week revenue numbers are non-GAAP financial measures, which exclude revenues from the 53rd week of 2009 (the last week of fiscal 2009). We present in order to give the investor the ability to compare our 2010, 2009 and 2008 revenues on a comparable 52-week basis. Management compares revenues on similar 52-week basis to assess revenue growth on a year-over-year.
In the retail segment, net revenue increased primarily as a result of increased sales from stores operating for over one year. We opened 2 new stores in 2010 and 8 new stores in 2009, and closed 2 and 4 stores, respectively. The increase in beverage and pastry sales was primarily related to sales from stores operating over one year and by new product introductions facilitated by our new reach-in coolers, which we installed in a substantial number of our stores in 2010. The slower growth on a comparable 52-week basis in whole bean and related products was primarily due to continuing cannibalization of bean sales in retail stores as we increased the availability and sales levels of Peet’s coffee in grocery stores.
The growth in net revenue in grocery was due to increased share in existing markets and to a lesser extent, to new grocery stores added during the year and the introduction of Godiva coffee in the fourth quarter of 2009. Foodservice and office net revenue increased over the prior year primarily due to increased office coffee distribution, the 10 new licensed partner locations opened during the year and 71 additional “We Proudly Brew” accounts that serve Peet’s coffee in their own branded locations. Net revenue in the home delivery channel did not grow due to cannibalization from our grocery business expanding in the eastern U.S.
We expect continued revenue growth in 2011 from sales in existing stores, the maturation of the stores we opened in 2010 and 2009, continued expansion of our grocery and foodservice businesses and the expected opening of 4-5 new stores.
Cost of sales and related occupancy expenses
Cost of sales and related occupancy expenses consist of product costs, including manufacturing costs, rent and other occupancy costs. As a percent of net revenue, cost of sales increased from 45.9% in 2009 to 46.4% in 2010. The increase from last year was primarily due to higher commodity costs and a shift in revenue mix towards the grocery channel where both Peet’s and Godiva brands have lower gross margins than our retail business, partially offset by the impact of a price increase in retail in the fourth quarter and lower operating costs at the roasting facility as a percentage of sales.
We expect cost of sales and related occupancy expenses as a percent of net revenue in 2011 to be higher due to increased coffee costs.
Operating expenses
Operating expenses consist of both retail and specialty operating costs, such as employee labor and benefits, repairs and maintenance, supplies, training, travel and banking and card processing fees. Operating expenses as a percent of net revenue for 2010 decreased 1.5% to 32.8%. The decrease was primarily due to the favorable shift in revenue mix towards the grocery and other specialty channels, which have lower operating expenses than our retail business, to the store closure costs in fiscal 2009, and due to leverage of retail overhead costs.
We expect operating expenses as a percent of net revenue in 2011 to continue to improve.
20
Transaction related expenses/(income)
Transaction related expenses/(income) in 2010 includes legal and related expenses of $1.0 million we incurred by responding to the subpoena we received from the Federal Trade Commission (FTC) in connection with the FTC's anti-trust review of the acquisition of Diedrich Coffee by GMCR. In 2009, the net income consists of an $8.5 million break-up fee received for the termination of a definitive agreement for Peet’s to acquire Diedrich Coffee, net of $4.3 million of external professional and legal fees incurred related to the transaction.
Litigation related expenses
Litigation related expenses in 2010 consist of a $93,000 reduction in costs incurred related to finalizing the settlement of a wage and hour class action lawsuit that was filed in July 2008 against the Company compared to the $3.0 million estimate for this settlement recorded in 2009.
As discussed in Item 3. “Legal Proceedings”, we currently are subject to an employee-related complaint and a complaint related to Proposition 65. At this time, it is not feasible to predict the outcome of or a range of loss, should a loss occur, from these proceedings or the expenses we will incur in 2011 to defend these proceedings.
General and administrative expenses
General and administrative expenses in 2010 were $25.1 million, or 7.5% of net revenue, compared to $24.5 million, or 7.9% of net revenue in 2009. As a percent of net revenue, expenses improved due to leverage of costs on higher sales, partially offset by increases in payroll related expenses.
Depreciation and amortization expenses
Depreciation and amortization expenses increased slightly over prior year as recent retail and infrastructure investments are beginning to be offset by assets becoming fully depreciated.
Interest income, net
We invest in U.S. government, agency, municipal and equity securities. Interest income includes interest income and gains or losses from the sale of these instruments. We earned $8,000 in interest income in 2010, compared to $112,000 in 2009, due primarily to lower interest rates on investments. The Company does not have exposure in its investment portfolio to subprime mortgages or auction rate securities.
Gain on sale of marketable securities
During 2009, the Company recorded a gain on the sale of stock of $7.3 million for stock of Diedrich Coffee that we acquired and sold within the year. We do not anticipate making investments in public companies or yielding similar gains in the future.
Income tax provision
The effective income tax rate for 2010 was 36.4% compared to 37.5% in 2009. Our effective rate decreased 1.1%, primarily due to the statutory increase in the domestic production deduction from 6% to 9% of taxable income in 2010.
2009 (53 weeks) Compared with 2008 (52 weeks)
Net revenue
Net revenue for 2009 increased over 2008 as a result of continued expansion of our retail and specialty segments and the impact of an extra week in fiscal year 2009. The table below sets forth net revenues for 2009 and 2008 on an actual and on a non-GAAP 52-week basis by business segment as well as business category.
21
|
Impact of 2009 53rd Week
|
||||||||||||||||||||||||||||
|
53 weeks
|
52 weeks
|
Non-Gaap 2009
|
Increase/
|
|||||||||||||||||||||||||
|
2009
|
2008
|
Increase/(Decrease)
|
2009 53rd week
|
52 weeks*
|
(Decrease)
|
|||||||||||||||||||||||
|
Retail stores:
|
||||||||||||||||||||||||||||
|
Whole bean coffee, tea, and related products
|
$ | 58,579 | $ | 55,097 | $ | 3,482 | 6.3% | $ | 1,335 | $ | 57,244 | 3.9% | ||||||||||||||||
|
Beverages and pastries
|
142,560 | 132,622 | 9,938 | 7.5% | 2,339 | 140,221 | 5.7% | |||||||||||||||||||||
|
Total Retail stores
|
$ | 201,139 | $ | 187,719 | $ | 13,420 | 7.1% | $ | 3,675 | $ | 197,465 | 5.2% | ||||||||||||||||
|
Specialty:
|
||||||||||||||||||||||||||||
|
Grocery
|
$ | 62,662 | $ | 51,490 | $ | 11,172 | 21.7% | $ | 1,271 | $ | 61,391 | 19.2% | ||||||||||||||||
|
Foodservice and office
|
30,248 | 27,517 | 2,731 | 9.9% | 449 | 29,799 | 8.3% | |||||||||||||||||||||
|
Home delivery
|
17,221 | 18,096 | (875 | ) | -4.8% | 197 | 17,024 | -5.9% | ||||||||||||||||||||
|
Total Specialty
|
$ | 110,131 | $ | 97,103 | $ | 13,028 | 13.4% | $ | 1,917 | $ | 108,214 | 11.4% | ||||||||||||||||
|
Total net revenue
|
$ | 311,270 | $ | 284,822 | $ | 26,448 | 9.3% | $ | 5,591 | $ | 305,679 | 7.3% | ||||||||||||||||
*The 2009 52-week revenue numbers are non-GAAP financial measures, which exclude revenues from the 53rd week of 2009 (the last week of fiscal 2009). We present in order to give the investor the ability to compare our 2010, 2009 and 2008 revenues on a comparable 52-week basis. Management compares revenues on similar 52-week basis to assess revenue growth on a year-over-year basis.
In the retail segment, net revenue increased as a result of increased sales from new stores and the sales they generated in their first 12 months. Growth was flat compared to the prior year for stores operating for over one year. We opened 8 new stores in 2009 and 23 new stores in 2008. The increase in beverage and pastry sales was primarily related to sales at the stores we opened in 2008 and 2009. The slower growth in whole bean and related products on a comparable 52-week basis was primarily due to continuing cannibalization of bean sales in retail stores as we increased the availability and sales levels of Peet’s coffee in grocery stores and our own new retail stores.
The growth in net revenue in grocery was due to increased share in existing markets and to a lesser extent, to new grocery stores added during the year and the introduction of Godiva coffee in the fourth quarter of 2009. Foodservice and office net revenue increased over 2008 primarily due to increased office coffee distribution, the 25 new licensed partner locations opened during 2009, and 144 additional “We Proudly Brew” accounts that serve Peet’s coffee in their own branded locations. Net revenue in the home delivery channel declined primarily due to cannibalization from our grocery business expanding in the eastern U.S.
Cost of sales and related occupancy expenses
Cost of sales and related occupancy expenses consist of product costs, including manufacturing costs, rent and other occupancy costs. As a percent of net revenue, cost of sales decreased from 46.9% in 2008 to 45.9% in 2009. The decrease from last year was primarily due to a decrease in shipping costs and milk costs, partially offset by increased green coffee costs, leverage of costs related to the roasting facility that opened in 2007, waste management in retail, and increased prices in retail.
Operating expenses
Operating expenses consist of both retail store and specialty operating costs, such as employee labor and benefits, repairs and maintenance, supplies, training, travel and banking and card processing fees. Operating expenses as a percent of net revenue for 2009 decreased 0.4% to 34.3%. The decrease was primarily due to leverage of retail overhead costs, in addition to cost improvements at the store level, partially offset by higher costs associated with expanding the grocery business and expenses incurred in closing four underperforming stores in 2009.
Transaction related expenses/(income)
Transaction related expenses/(income) in 2009 consists of an $8.5 million break-up fee received for the termination of a definitive agreement for Peet’s to acquire Diedrich, net of $4.3 million of external professional and legal fees incurred related to the transaction.
Litigation related expenses
Litigation related expenses in 2009 consist of $3.0 million of costs incurred related to the pending settlement of a wage and hour class action lawsuit that was filed in July 2008 against the Company.
22
General and administrative expenses
General and administrative expenses in 2009 were $24.5 million, or 7.9% of net revenue, compared to $22.5 million, or 7.9% in 2008. As a percent of net revenue, expenses were flat compared to 2008 as increases in headcount and payroll related expenses were offset by leverage of other costs on higher sales.
Depreciation and amortization expenses
Depreciation and amortization expenses increased in 2009 primarily due to the 31 stores we opened during 2009 and 2008 and the implementation of a new ERP system during the year.
Interest income, net
We invest in U.S. government, agency, municipal and guaranteed student loan obligations. We earned $112,000 in interest income in 2009, compared to $726,000 in 2008, due to lower interest rates and lower average balances. The Company does not have exposure in its investment portfolio to subprime mortgages or auction rate securities.
Gain on sale of marketable securities
During 2009, the Company recorded a gain on the sale of stock of $7.3 million for stock of Diedrich Coffee that we acquired and sold within the year. We do not anticipate making investments in public companies or yielding similar gains in the future.
Income tax provision
The effective income tax rate for 2009 was 37.5% compared to 37.0% in 2008. Our effective rate increased 0.5% primarily due to a lower impact from tax-exempt interest income and the domestic production deduction.
Liquidity and Capital Resources
At January 2, 2011, we had $44.6 million in cash and cash equivalents. Working capital was $81.6 million as of January 2, 2011 compared to $67.2 million at January 3, 2010.
Net cash provided by operations was $24.8 million in 2010 compared to $41.9 million in 2009. Operating cash flows were lower than the prior year period primarily due to increased green coffee inventories and other changes in working capital, including payment of the litigation reserve recorded in 2009 that was paid in 2010. In addition, prior year net cash from operations included the net transaction related gain of $4.2 million.
Net cash used in investing activities was $15.2 million in 2010. Investing activities primarily relate to purchases of property and equipment, and sales and maturities of marketable securities. During 2010, purchases of marketable securities totaled $4.2 million. There were no proceeds from the sale of marketable securities, compared to $16.2 million received in 2009. Cash paid for property and equipment totaling $11.6 million included:
|
|
·
|
$6.2 million to build-out new stores and remodel existing ones;
|
|
|
·
|
$2.9 million used for additional equipment and machinery for our roasting facility;
|
|
|
·
|
$1.6 million used for information technology support and other software and hardware to support infrastructure; and
|
|
|
·
|
$0.9 million used for our grocery handheld system, foodservice kiosks and other equipment for specialty.
|
Net cash used in financing activities was $12.9 million in 2010, primarily for the purchase of our common stock, offset by proceeds from stock option exercises.
Our 2011 capital expenditures are expected to be approximately $12.0 million. Approximately $5.0 million is expected to be used for the opening of an estimated 4 new retail stores and for remodeling and improvements to existing stores. Approximately $4.0 million is expected to be used for information technology software and hardware to support our growth. Approximately $1.5 million is expected to be used for equipment and machinery to improve effectiveness and increase capacity at our roasting facility. The balance is expected to be used for equipment for the foodservice and grocery channels. We expect to finance these capital expenditures with our cash and marketable securities and with operating cash flows.
23
The following table summarizes the Company’s contractual obligations and the timing and effect that such commitments are expected to have on the Company’s liquidity and capital requirements in future periods as of January 2, 2011:
|
Payments Due by Period
|
||||||||||||||||||||
|
(in thousands)
|
||||||||||||||||||||
|
Less than
|
||||||||||||||||||||
|
Contractual obligations
|
Total
|
1 year
|
1-3 years
|
4-5 years
|
After 5 years
|
|||||||||||||||
|
Equipment operating leases
|
$ | 2,150 | $ | 861 | $ | 1,115 | $ | 174 | $ | - | ||||||||||
|
Retail store operating leases (1)
|
92,873 | 16,444 | 31,284 | 24,714 | 20,431 | |||||||||||||||
|
Fixed-price coffee purchase commitments
|
29,731 | 29,731 | - | - | - | |||||||||||||||
|
Not-yet-priced coffee commitments
|
26,572 | 25,423 | 1,149 | - | - | |||||||||||||||
|
Development commitments (2)
|
1,672 | 1,672 | - | - | - | |||||||||||||||
|
Total contractual cash obligations
|
$ | 152,998 | $ | 74,131 | $ | 33,548 | $ | 24,888 | $ | 20,431 | ||||||||||
|
|
(1)
|
Payments for maintenance, insurance, taxes and contingent rent for which we are obligated are excluded. In fiscal 2010 these charges totaled approximately $3.5 million.
|
|
|
(2)
|
Contractual obligations for purchases of leasehold improvements for equipment and leasehold improvements for retail locations.
|
The Company has excluded from the table above uncertain tax liabilities as defined in ASC 740, “Unrecognized Tax Benefits,” due to the uncertainty of the period of payment. As of January 2, 2011, the Company has a $0.2 million liability for uncertain tax positions (see Note 6. “Income Taxes” in the “Notes to Consolidated Financial Statements” included elsewhere in this report).
For the next twelve months, we expect our cash flows from operations and cash and marketable securities to be sufficient for our operating and capital requirements, our existing share purchase program and our contractual obligations as they come due. The Company also has $50 million available through a credit agreement entered into on December 21, 2010 with Wells Fargo Bank, National Association, the proceeds of which may be used in the general corporate purposes, including funding working capital, capital expenditures, share repurchases and other needs. The line of credit has a maturity date of December 1, 2013. The Company’s obligations under the line of credit are unconditionally guaranteed by Peet’s Operating Company, Inc. in the
principal amount up to $50 million.
The credit agreement contains customary affirmative and negative covenants. The credit agreement also includes financial covenants that require the Company to maintain a specified leverage ratio and a minimum amount of net income. The credit agreement includes customary events of default that permit the Bank to accelerate the Company’s outstanding obligations, including nonpayment of principal, interest, fees or other amounts, violation of covenants, failure to make any payments when due with respect to certain other debt or certain failures to comply with the terms of such other debt, entry of certain judgments, inaccuracy of representations and warranties, occurrence of any event or condition that has a material adverse effect, and upon the
occurrence of bankruptcy and other insolvency events and certain events relating to a dissolution or liquidation of the Company or Peet’s Operating Company, Inc. During the year and as of January 2, 2011, there were no borrowings under this agreement. Total unused borrowing capacity under the credit agreement was $50.0 million as of January 2, 2011.
Off Balance Sheet Arrangements
The Company has no off balance sheet arrangements that require disclosure pursuant to Item 303(a)(4) of Regulation S-K.
Inflation
Over the past decade there has been very little inflation in the United States and as a result we have not seen a measurable impact of inflation on our results of operations. However, as discussed above, we have experienced price increases in commodities that we use, specifically coffee and milk, which we believe are due to more localized supply and demand issues or market dynamics rather than inflation measured by the Consumer Price Index. General inflation would have the largest impact on wage rates, which could have a material impact on our results since wages are our largest single cost. Therefore, we cannot predict what effect inflation may have on our results of operations in the future.
24
Critical Accounting Policies, Judgments and Estimates
The preparation of financial statements in conformity with generally accepted accounting principles requires the appropriate application of certain accounting policies and judgments, many of which require us to make estimates and assumptions about future events and their impact on amounts reported in our financial statements and related notes. Since future events and their impact cannot be determined with certainty, the actual results will inevitably differ from our estimates. Such differences could be material to the financial statements.
We believe our application of accounting policies, and the estimates inherently required therein, are reasonable. These accounting policies and estimates are periodically reevaluated, and adjustments are made when facts and circumstances dictate a change. Historically, we have found our application of accounting policies to be appropriate, and actual results have not differed materially from those determined using necessary estimates.
Our accounting policies are more fully described in Note 1 "Summary of Significant Accounting Policies" in the “Notes to Consolidated Financial Statements,” included elsewhere in this report. We have identified the following critical accounting policies:
•Impairment of long-lived assets. When facts and circumstances indicate that the carrying value of long-lived assets may be impaired, an evaluation of recoverability is performed by comparing the carrying values of the assets to projected undiscounted future cash flows in addition to other quantitative and qualitative analyses. Property, plant and equipment assets are grouped at the lowest level for which there is identifiable cash flows when assessing impairment. Cash flows for retail net assets are identified at the individual store level. Upon indication that the carrying values of such assets may not be recoverable, the Company recognizes an impairment loss by a charge against current operations for an amount equal to the difference between
the carrying value and the assets’ fair value. The fair value of the retail net asset is estimated using the discounted cash flows of the assets. Long-lived assets to be disposed of are reported at the lower of their carrying amount or fair value, less estimated costs to sell. Judgments made by the Company related to the expected useful lives of long-lived assets and the ability of the Company to realize undiscounted cash flows in excess of the carrying amounts of such assets are affected by factors such as the ongoing maintenance and improvements of the assets, changes in economic conditions and changes in operating performance. The Company considers the economic environment when estimating future cash flows and in 2009 and 2010 considered the recession in our future sales assumptions. Based on analysis using changes in certain assumptions that could be reasonably possible, management believes the effect on the expense recognized for 2010 would not be material.
•Income taxes. In establishing deferred income tax assets and liabilities, we make judgments and interpretations based on enacted tax laws and published tax guidance applicable to our operations. We record deferred tax assets and liabilities and evaluate the need for valuation allowances to reduce deferred tax assets to realizable amounts. Changes in our valuation of the deferred tax assets or changes in the income tax provision and reserves may affect our annual effective income tax rate. Changes in tax laws and rates could also affect recorded deferred tax assets and liabilities in the future. Management is not aware of any such changes that would have a material effect on the Company’s results of operations, cash
flows or financial position. On January 1, 2007, we adopted the provisions of ASC 740, “Income Taxes,” which requires that we recognize in our financial statements the impact of a tax position, if that position is more likely than not of being sustained on audit, based on the technical merits of the position.
•Stock-based compensation. The Company accounts for stock-based compensation in accordance with the fair value recognition provisions of ASC 718, “Compensation—Stock Compensation”. We use the Black-Scholes-Merton option-pricing model, which requires assumptions requiring a high degree of judgment. These assumptions include estimating the length of time employees will retain their vested stock options before exercising them, the estimated volatility of our common stock price over the expected term and the number of options that will ultimately not complete their vesting requirements. Changes in the subjective assumptions could materially affect the estimate of the fair value of stock-based compensation; however, based on
analysis using changes in certain assumptions that could be reasonably possible, management believes the effect on the expense recognized for 2010 would not be material.
Recent Accounting Pronouncements
On January 21, 2010, the Financial Accounting Standards Board “FASB” issued an Accounting Standards Update “ASU” on improving disclosures about fair value measurements, which amends the ASC on Fair Value Measurements and Disclosures to add new requirements for disclosures about transfers into and out of Levels 1 and 2 and separate disclosures about purchases, sales, issuances, and settlements relating to Level 3 measurements. The ASU also clarifies existing fair value disclosures about the level of disaggregation and about inputs and valuation techniques used to measure fair value. We adopted the requirements of this ASU commencing the first day of our 2010 fiscal year. This ASU will not have an impact to our consolidated financial statements except to require us to provide increased disclosure.
25
Item 7A. Quantitative and Qualitative Disclosures about Market Risk
We invest excess cash in interest-bearing, U.S. government, agency, municipal and guaranteed student loan obligations. These financial instruments are all subject to fluctuations of daily interest rates. Therefore our investment portfolio is exposed to market risk from these changes.
The supply and price of coffee are subject to significant volatility and can be affected by multiple factors in the producing countries, including weather, political and economic conditions. In addition, green coffee bean prices have been affected in the past, and may be affected in the future, by the actions of certain organizations and associations that have historically attempted to influence commodity prices of green coffee beans through agreements establishing export quotas or restricting coffee supplies worldwide.
We currently use fixed-price purchase commitments, but in the past have used and may potentially in the future use coffee futures and coffee futures options to manage coffee supply and price risk.
Fixed-Price and Not-Yet-Priced Purchase Commitments
We enter into fixed-price purchase commitments in order to secure an adequate supply of quality green coffee beans and fix our cost of green coffee beans. These commitments are made with established coffee brokers and are denominated in U.S. dollars. We also enter into “not-yet-priced” commitments based on a fixed premium over the New York “C” market with the option to fix the price at any time. As of January 2, 2011, we had approximately $29.7 million in open fixed-priced purchase commitments and approximately $26.6 million in not-yet-priced commitments priced for a total of approximately $56.3 million with delivery dates ranging from January 2011 through April 2012. See Note 13, “Commitments and
Contingencies,” in the “Notes to Consolidated Financial Statements” included elsewhere in this report. We believe, based on relationships established with our suppliers, that the risk of non-delivery on such purchase commitments is low.
Item 8. Financial Statements and Supplementary Data
All information required by this item is included in Item 15 of this annual report on Form 10-K and is incorporated in this item by reference.
Item 9. Changes in and Disagreements with Accountants on Accounting and Financial Disclosure
None.
Item 9A. Controls and Procedures
Disclosure Controls and Procedures
We conducted an evaluation, under the supervision and with the participation of our management, including our Chief Executive Officer and our Chief Financial Officer, of the effectiveness of the design and operation of our disclosure controls and procedures (as defined in Rules 13a-15(e) and 15d-15(e) under the Securities Exchange Act of 1934, as amended (the “Exchange Act”)). Based on the foregoing, our Chief Executive Officer and Chief Financial Officer have concluded that our disclosure controls and procedures were effective as of the end of the period covered by this annual report.
Management’s Report on Internal Control over Financial Reporting
Our management is responsible for establishing and maintaining adequate internal control over financial reporting, as such term is defined in Exchange Act Rule 13a-15(f). The Company’s internal control system was designed to provide reasonable assurance to the Company’s management and board of directors regarding the preparation and fair presentation of published financial statements. All internal control systems, no matter how well designed, have inherent limitations. Therefore, even those systems determined to be effective can provide only reasonable assurance with respect to financial statement preparation and presentation. Under the supervision and with the participation of our management, including our Chief Executive Officer and our Chief Financial Officer, as directed by our board of
directors, we conducted an evaluation of the effectiveness of our internal control over financial reporting based on the framework in Internal Control – Integrated Framework issued by the Committee of Sponsoring Organizations of the Treadway Commission (“COSO”). Based on our evaluation under the COSO framework, our management concluded that our internal control over financial reporting was effective to the reasonable assurance level as of January 2, 2011.
26
The registered independent public accounting firm of Deloitte & Touche LLP has issued a report on the effectiveness of the Company’s internal control over financial reporting as of January 2, 2011. See page F-2 of the consolidated financial statements included elsewhere in this report.
Changes in Internal Control over Financial Reporting
There were no changes in the Company’s internal control over financial reporting identified in connection with the evaluation required by paragraph (d) of Exchange Act Rules 13a-15(e) or 15d-15(e) that was conducted during the last fiscal quarter that have materially affected, or are reasonably likely to materially affect, the Company’s internal control over financial reporting.
27
PART III
Item 10. Directors, Executive Officers and Corporate Governance
Information with respect to continuing directors and nominees of the Company, committees of the Board of Directors and the Company’s Code of Business Conduct and Ethics is set forth under the caption “Proposal 1 - Election of Directors" in the Company's proxy statement relating to its 2011 Annual Meeting of Shareholders (the “Proxy Statement”) and is incorporated by reference into this Form 10-K. The Proxy Statement will be filed with the SEC in accordance with Rule 14a-6(c) promulgated under the Securities Exchange Act of 1934, as amended (the "Exchange Act."). With the exception of the foregoing information and other information specifically incorporated by reference into this Form 10-K, the Proxy Statement is not being filed as a part
hereof. Information respecting executive officers of the Company is set forth at Part I of this Form 10-K under the caption “Business—Executive Officers of the Registrant.”
Information with respect to compliance with Section 16(a) of the Exchange Act is set forth under the caption "Section 16(a) Beneficial Ownership Reporting Compliance" in the Proxy Statement and is incorporated by reference into this Form 10-K.
The Company has adopted the Peet’s Coffee & Tea, Inc. Code of Business Conduct and Ethics that applies to all officers, directors and employees. The Code of Business Conduct and Ethics is available on our website at www.peets.com. If the Company makes any substantive amendments to the Code of Business Conduct and Ethics or grants any waiver from a provision of the code to any executive officer or director, the Company will promptly disclose the nature of the amendment or waiver on its website.
Item 11. Executive Compensation
Information concerning executive and director compensation required by Item 11 is set forth under the caption "Executive Compensation" in the Proxy Statement and is incorporated by reference into this Form 10-K.
Item 12. Security Ownership of Certain Beneficial Owners and Management and Related Stockholder Matters
Information concerning security ownership of certain beneficial owners and management and equity compensation plans required by Item 12 is set forth under the caption "Security Ownership of Certain Beneficial Owners and Management" and "Executive Compensation—Equity Compensation Plan Information" in the Proxy Statement and is incorporated by reference into this Form 10-K.
Item 13. Certain Relationships and Related Transactions, and Director Independence
Information concerning certain relationships and related transactions required by Item 13 is set forth under the caption "Certain Transactions" in the Proxy Statement and is incorporated by reference into this Form 10-K. Information concerning director independence required by Item 13 is set forth under the caption "Proposal 1- Election of Directors—Independence of the Board of Directors” in the Proxy Statement and is incorporated by reference into this Form 10-K.
Item 14. Principal Accountant Fees and Services
Information concerning principal accountant fees and services required by Item 14 is set forth under the caption "Proposal 5- Ratification of Selection of Independent Registered Public Accounting Firm" in the Proxy Statement and is incorporated by reference into this Form 10-K.
28
PART IV
Item 15. Exhibits and Financial Statement Schedules
The following documents are filed as part of this Form 10-K.
(a)(1) Index to Consolidated Financial Statements.
The following Consolidated Financial Statements of Peet’s Coffee & Tea, Inc. and its subsidiaries are filed as part of this Form 10-K:
|
Page
|
|
|
Report of Independent Registered Public Accounting Firm
|
F-2
|
|
Consolidated Balance Sheets as of January 2, 2011 and January 3, 2010
|
F-3
|
|
Consolidated Statements of Income for the Years Ended January 2, 2011, January 3, 2010 and
|
F-4
|
|
December 28, 2008
|
|
|
Consolidated Statements of Shareholders' Equity for the Years Ended January 2, 2011,
|
F-5
|
|
January 3, 2010 and December 28, 2008
|
|
|
Consolidated Statements of Cash Flows for the Years January 2, 2011,
|
F-6
|
|
January 3, 2010 and December 28, 2008
|
|
|
Notes to Consolidated Financial Statements
|
F-7
|
(a)(2) Index to Financial Statement Schedule.
Schedules are omitted because they are not applicable, not required or because the required information is included in the Consolidated Financial Statements or Notes thereto.
(a)(3) Listing of Exhibits
|
Exhibit
|
Description
|
|
|
3.1
|
Amended and Restated Articles of Incorporation. Incorporated by reference to Exhibit 3.6 to the Company’s Amendment No. 2 to its Registration Statement on Form S-1 filed with the SEC on December 22, 2000 (File. No. 333-47976).
|
|
|
3.2
|
Amended and Restated Bylaws. Incorporated by reference to Exhibit 3.8 to the Company’s Amendment No. 1 to its Registration Statement on Form S-1 filed with the SEC on December 1, 2000 (File. No. 333-47976).
|
|
|
4.1
|
Form of common stock certificate. Incorporated by reference to Exhibit 4.1 to the Company’s Amendment No. 2 to its Registration Statement on Form S-1 filed with the SEC on December 22, 2000 (File. No. 333-47976).
|
|
|
10.1
|
Peet’s Coffee & Tea, Inc. 2010 Equity Incentive Plan. Incorporated by reference to Exhibit 10.1 to the Company’s current report on Form 8-K filed with the SEC on May 24, 2010 (File. No. 000-32233). (1)
|
|
|
10.2
|
Forms of Stock Option Grant Notice and Stock Option Agreement under 2010 Equity Incentive Plan. Incorporated by reference to Exhibit 10.2 to the Company’s current report on Form 8-K filed with the SEC on May 24, 2010 (File. No. 000-32233). (1)
|
|
|
10.3
|
Forms of Restricted Stock Unit Grant Notice and Restricted Stock Unit Agreement under 2010 Equity Incentive Plan. Incorporated by reference to Exhibit 10.3 to the Company’s current report on Form 8-K filed with the SEC on May 24, 2010 (File. No. 000-32233). (1)
|
29
|
10.4
|
1997 Equity Incentive Plan and form of Stock Option Agreement. Incorporated by reference to Exhibit 10.7 to the Company’s Amendment No. 3 to its Registration Statement on Form S-1 filed with the SEC on January 17, 2001 (File. No. 333-47976). (1)
|
|
|
10.5
|
Peet’s Operating Company, Inc. Savings and Retirement Plan. Incorporated by reference to Exhibit 10.8 to the Company’s Amendment No. 1 to its Registration Statement on Form S-1 filed with the SEC on December 1, 2000 (File. No. 333-47976). (1)
|
|
|
10.6
|
2000 Equity Incentive Plan amended and restated September 4, 2008. Incorporated by reference to Exhibit 99.1 to the Company's current report on Form 8-K filed with the SEC on September 8, 2008 (File No. 000-32233). (1)
|
|
|
10.7
|
2000 Employee Stock Purchase Plan and form of Offering. Incorporated by reference to Exhibit 10.11 to the Company’s Amendment No. 2 to its Registration Statement on Form S-1 filed with the SEC on December 22, 2000 (File. No. 333-47957). (1)
|
|
|
10.8
|
Key Employee Severance Benefit Plan amended and restated December 31, 2007. Incorporated by reference to Exhibit 10.7 to the Company's annual report on Form 10-K for the year ended December 30, 2007(File No. 000-32233). (2)
|
|
|
10.9
|
Change of Control Stock Award Acceleration Plan amended and restated May 18, 2010. Incorporated by reference to Exhibit 10.1 to the Company's current report on Form 8-K filed with the SEC on June 9, 2010(File No. 000-32233). (1)
|
|
|
10.10
|
Form of Indemnity Agreement between the registrant and each of its directors and officers. Incorporated by reference to Exhibit 10.21 to the Company’s annual report on Form 10-K for the year ended December 31, 2000 (File No. 000-32233). (2)
|
|
|
10.11
|
Peet's Coffee & Tea, Inc. Key Employment Agreement for Patrick J. O’Dea, Chief Executive Officer, dated as of May 6, 2002. Incorporated by reference to Exhibit 10.17 to the Company's quarterly report on Form 10-Q for the quarter ended June 30, 2002 (File No. 000-32233). (2)
|
|
|
10.12
|
Peet's Coffee & Tea, Inc. Amended and Restated 2000 Non-Employee Director Stock Option Plan as amended and restated March 16, 2010. Incorporated by reference to Exhibit 10.1 to the Company's quarterly report on Form 10-Q for the quarter ended July 4, 2010 (File No. 000-32233). (1)
|
|
|
10.13
|
Peet's Coffee & Tea, Inc. Key Employment Agreement for Thomas P. Cawley, Chief Financial Officer, dated as of June 25, 2003. Incorporated by reference to Exhibit 10.17 to the Company's quarterly report on Form 10-Q for the quarter ended September 28, 2003 (File No. 000-32233). (2)
|
|
|
10.14
|
Nonqualified Deferred Compensation Plan dated December 1, 2003. Incorporated by reference to Exhibit 10.30 to the Company’s quarterly report on Form 10-Q for the quarter ended March 28, 2004 (File No. 000-32233). (2)
|
|
|
10.15
|
Credit Agreement by and between Peet’s Coffee & Tea, Inc. and Wells Fargo Bank, National Association, dated December 21, 2010. Incorporated by reference to Exhibit 10.1 to the Company’s current report on Form 8-K filed with the SEC on December 21, 2010 (File No. 000-32233).
|
|
|
10.16
|
Peet's Coffee & Tea, Inc. Key Employment Agreement for P. Christine Lansing, Vice President, General Manager Consumer Business, dated as of October 3, 2005. Incorporated by reference to Exhibit 10.17 to the Company’s annual report on Form 10-K for the year ended December 28, 2008 (File No. 000-3233). (2)
|
|
|
21.1
|
Subsidiaries of the registrant.
|
|
|
23.1
|
Consent of Deloitte & Touche LLP.
|
|
|
24.1
|
Power of Attorney (see signature page to this Form 10-K)
|
|
|
31.1
|
Certification of the Company's Chief Executive Officer, Patrick J. O'Dea, pursuant to Rule 13a-14(a) under the Securities Exchange Act of 1934, as amended.
|
30
|
31.2
|
Certification of the Company's Chief Financial Officer, Thomas P. Cawley, pursuant to Rule 13a-14(a) under the Securities Exchange Act of 1934, as amended.
|
||||
|
32.1
|
Certification of the Company's Chief Executive Officer, Patrick J. O'Dea, pursuant to Section 906 of Sarbanes-Oxley Act of 2002.
|
||||
|
32.2
|
Certification of the Company's Chief Financial Officer, Thomas P. Cawley, pursuant to Section 906 of Sarbanes-Oxley Act of 2002.
|
||||
| (1) | Compensatory plan or arrangement. | ||||
| (2) | Management contract. | ||||
31
SIGNATURES
Pursuant to the requirements of Section 13 or 15(d) of the Securities Exchange Act of 1934, the registrant has duly caused this report to be signed on its behalf by the undersigned, thereunto duly authorized.
|
Date: March 17, 2011
|
PEET’S COFFEE & TEA, INC.
|
||
|
By:
|
/s/ Patrick J. O'Dea
|
||
|
Patrick J. O'Dea
|
|||
|
President and Chief Executive Officer
|
|||
POWER OF ATTORNEY
KNOW ALL PERSONS BY THESE PRESENTS, that each person whose signature appears below constitutes and appoints Patrick J. O'Dea and Thomas P. Cawley and each of them, as his true and lawful attorneys-in-fact and agents, with full power of substitution and resubstitution, for him and in his name, place, and stead, in any and all capacities, to sign any and all amendments to this report and to file the same, with all granting unto said attorneys-in-fact and agents, and each of them, full power and authority to do and perform each and every act and thing requisite and necessary to be done in connection therewith, as fully to all intents and purposes as he might or could do in person, hereby ratifying and confirming all that said attorneys-in-fact and agents, or any of
them, or their or his substitute or substitutes, may lawfully do or cause to be done by virtue hereof.
Pursuant to the requirements of the Securities Exchange Act of 1934, this report has been signed below by the following persons on behalf of the registrant and in the capacities and on the dates indicated.
|
Signature
|
Title
|
Date
|
||
|
/s/ PATRICK J. O'DEA
|
President, Chief Executive Officer and
|
March 17, 2011
|
||
|
Patrick J. O'Dea
|
Director (Principal Executive Officer)
|
|||
|
/s/ THOMAS P. CAWLEY
|
Vice President, Chief Financial Officer
|
March 17, 2011
|
||
|
Thomas P. Cawley
|
and Secretary (Principal Financial and
|
|||
|
Accounting Officer)
|
||||
|
/s/ JEAN-MICHEL VALETTE
|
Chairman
|
March 17, 2011
|
||
|
Jean-Michel Valette
|
||||
|
/s/ GERALD BALDWIN
|
Director
|
March 17, 2011
|
||
|
Gerald Baldwin
|
||||
|
/s/ HILARY BILLINGS
|
Director
|
March 17, 2011
|
||
|
Hilary Billings
|
||||
|
/s/ DAVID DENO
|
Director
|
March 17, 2011
|
||
|
David Deno
|
||||
|
/s/ TED W. HALL
|
Director
|
March 17, 2011
|
||
|
Ted W. Hall
|
||||
|
/s/ MICHAEL LINTON
|
Director
|
March 17, 2011
|
||
|
Michael Linton
|
||||
|
/s/ ELIZABETH SARTAIN
|
Director
|
March 17, 2011
|
||
|
Elizabeth Sartain
|
32
INDEX TO CONSOLIDATED FINANCIAL STATEMENTS
|
Page
|
|
|
Report of Independent Registered Public Accounting Firm
|
F-2
|
|
Consolidated Balance Sheets as of January 2, 2011 and January 3, 2010
|
F-3
|
|
Consolidated Statements of Income for the Years Ended January 2, 2011, January 3, 2010,
|
F-4
|
|
and December 28, 2008
|
|
|
Consolidated Statements of Shareholders' Equity for the Years Ended January 2, 2011,
|
F-5
|
|
January 3, 2010, and December 28, 2008
|
|
|
Consolidated Statements of Cash Flows for the Years January 2, 2011, January 3, 2010,
|
F-6
|
|
and December 28, 2008
|
|
|
Notes to Consolidated Financial Statements
|
F-7
|
F-1
REPORT OF INDEPENDENT REGISTERED PUBLIC ACCOUNTING FIRM
Board of Directors and Shareholders of Peet’s Coffee & Tea, Inc.:
We have audited the accompanying consolidated balance sheets of Peet’s Coffee & Tea, Inc. and subsidiaries (the "Company") as of January 2, 2011 and January 3, 2010, and the related consolidated statements of income, shareholders' equity, and cash flows for each of the three fiscal years in the period ended January 2, 2011. We also have audited the Company's internal control over financial reporting as of January 2, 2011, based on criteria established in Internal Control — Integrated Framework issued by the Committee of Sponsoring Organizations of the Treadway Commission. The Company's management is responsible for these financial statements, for maintaining effective internal control over financial reporting, and for its
assessment of the effectiveness of internal control over financial reporting, included in the accompanying “Management’s Report on Internal Control over Financial Reporting”. Our responsibility is to express an opinion on these financial statements and an opinion on the Company's internal control over financial reporting based on our audits.
We conducted our audits in accordance with the standards of the Public Company Accounting Oversight Board (United States). Those standards require that we plan and perform the audit to obtain reasonable assurance about whether the financial statements are free of material misstatement and whether effective internal control over financial reporting was maintained in all material respects. Our audits of the financial statements included examining, on a test basis, evidence supporting the amounts and disclosures in the financial statements, assessing the accounting principles used and significant estimates made by management, and evaluating the overall financial statement presentation. Our audit of internal control over financial reporting included obtaining an understanding of
internal control over financial reporting, assessing the risk that a material weakness exists, and testing and evaluating the design and operating effectiveness of internal control based on the assessed risk. Our audits also included performing such other procedures as we considered necessary in the circumstances. We believe that our audits provide a reasonable basis for our opinions.
A Company's internal control over financial reporting is a process designed by, or under the supervision of, the Company's principal executive and principal financial officers, or persons performing similar functions, and effected by the Company's board of directors, management, and other personnel to provide reasonable assurance regarding the reliability of financial reporting and the preparation of financial statements for external purposes in accordance with generally accepted accounting principles. A Company's internal control over financial reporting includes those policies and procedures that (1) pertain to the maintenance of records that, in reasonable detail, accurately and fairly reflect the transactions and dispositions of the assets of the Company; (2) provide reasonable assurance that
transactions are recorded as necessary to permit preparation of financial statements in accordance with generally accepted accounting principles and that receipts and expenditures of the Company are being made only in accordance with authorizations of management and directors of the Company; and (3) provide reasonable assurance regarding prevention or timely detection of unauthorized acquisition, use, or disposition of the Company's assets that could have a material effect on the financial statements.
Because of the inherent limitations of internal control over financial reporting, including the possibility of collusion or improper management override of controls, material misstatements due to error or fraud may not be prevented or detected on a timely basis. Also, projections of any evaluation of the effectiveness of the internal control over financial reporting to future periods are subject to the risk that the controls may become inadequate because of changes in conditions, or that the degree of compliance with the policies or procedures may deteriorate.
In our opinion, the consolidated financial statements referred to above present fairly, in all material respects, the financial position of Peet’s Coffee & Tea, Inc. and subsidiaries as of January 2, 2011 and January 3, 2010, and the results of their operations and their cash flows for each of the three fiscal years in the period ended January 2, 2011, in conformity with accounting principles generally accepted in the United States of America. Also, in our opinion, the Company maintained, in all material respects, effective internal control over financial reporting as of January 2, 2011, based on the criteria established in Internal Control — Integrated Framework issued by the Committee of Sponsoring Organizations of the
Treadway Commission.
/s/ DELOITTE & TOUCHE LLP
San Francisco, California
March 17, 2011
F-2
PEET’S COFFEE & TEA, INC.
CONSOLIDATED BALANCE SHEETS
(In thousands, except share amounts)
|
January 2,
|
January 3,
|
|||||||
|
2011
|
2010
|
|||||||
|
ASSETS
|
||||||||
|
Current assets
|
||||||||
|
Cash and cash equivalents
|
$ | 44,629 | $ | 47,934 | ||||
|
Short-term marketable securities
|
4,183 | - | ||||||
|
Accounts receivable, net
|
14,852 | 15,209 | ||||||
|
Inventories
|
33,534 | 25,936 | ||||||
|
Deferred income taxes - current
|
4,420 | 3,592 | ||||||
|
Prepaid expenses and other
|
7,798 | 5,863 | ||||||
|
Total current assets
|
109,416 | 98,534 | ||||||
|
Property, plant and equipment, net
|
97,279 | 103,494 | ||||||
|
Other assets, net
|
2,137 | 2,775 | ||||||
|
Total assets
|
$ | 208,832 | $ | 204,803 | ||||
|
LIABILITIES AND SHAREHOLDERS' EQUITY
|
||||||||
|
Current liabilities
|
||||||||
|
Accounts payable and other accrued liabilities
|
$ | 9,138 | $ | 13,669 | ||||
|
Accrued compensation and benefits
|
11,555 | 10,832 | ||||||
|
Deferred revenue
|
7,102 | 6,845 | ||||||
|
Total current liabilities
|
27,795 | 31,346 | ||||||
|
Deferred income taxes - non current
|
46 | 321 | ||||||
|
Deferred lease credits
|
7,023 | 7,059 | ||||||
|
Other long-term liabilities
|
1,468 | 1,021 | ||||||
|
Total liabilities
|
36,332 | 39,747 | ||||||
|
Shareholders' equity
|
||||||||
|
Common stock, no par value; authorized 50,000,000 shares;
|
||||||||
|
issued and outstanding:13,063,000 and 13,104,000 shares
|
81,995 | 92,054 | ||||||
|
Accumulated other comprehensive income
|
2 | - | ||||||
|
Retained earnings
|
90,503 | 73,002 | ||||||
|
Total shareholders' equity
|
172,500 | 165,056 | ||||||
|
Total liabilities and shareholders' equity
|
$ | 208,832 | $ | 204,803 | ||||
See notes to consolidated financial statements.
F-3
PEET’S COFFEE & TEA, INC.
CONSOLIDATED STATEMENTS OF INCOME
(In thousands, except per share amounts)
|
2010
|
2009
|
2008
|
||||||||||
|
(52 weeks)
|
(53 weeks)
|
(52 weeks)
|
||||||||||
|
Retail stores
|
$ | 205,116 | $ | 201,139 | $ | 187,719 | ||||||
|
Specialty sales
|
128,692 | 110,131 | 97,103 | |||||||||
|
Net revenue
|
333,808 | 311,270 | 284,822 | |||||||||
|
Cost of sales and related occupancy expenses
|
154,892 | 142,776 | 133,537 | |||||||||
|
Operating expenses
|
109,646 | 106,652 | 98,844 | |||||||||
|
Transaction related expenses/(income)
|
970 | (4,183 | ) | - | ||||||||
|
Litigation related expenses
|
(93 | ) | 2,957 | - | ||||||||
|
General and administrative expenses
|
25,088 | 24,508 | 22,519 | |||||||||
|
Depreciation and amortization expenses
|
15,767 | 15,167 | 12,921 | |||||||||
|
Total costs and expenses from operations
|
306,270 | 287,877 | 267,821 | |||||||||
|
Income from operations
|
27,538 | 23,393 | 17,001 | |||||||||
|
Gain on sale of marketable securities
|
- | 7,305 | - | |||||||||
|
Interest income, net
|
8 | 112 | 726 | |||||||||
|
Income before income taxes
|
27,546 | 30,810 | 17,727 | |||||||||
|
Income tax provision
|
10,045 | 11,558 | 6,562 | |||||||||
|
Net income
|
$ | 17,501 | $ | 19,252 | $ | 11,165 | ||||||
|
Net income per share:
|
||||||||||||
|
Basic
|
$ | 1.34 | $ | 1.48 | $ | 0.81 | ||||||
|
Diluted
|
$ | 1.28 | $ | 1.44 | $ | 0.80 | ||||||
|
Shares used in calculation of net income per share:
|
||||||||||||
|
Basic
|
13,038 | 12,997 | 13,723 | |||||||||
|
Diluted
|
13,643 | 13,349 | 13,997 | |||||||||
See notes to consolidated financial statements.
F-4
PEET'S COFFEE & TEA, INC.
CONSOLIDATED STATEMENTS OF SHAREHOLDERS' EQUITY
(In thousands)
|
Accumulated
|
||||||||||||||||||||||||
|
Common Stock
|
Other
|
Total
|
||||||||||||||||||||||
|
Shares
|
Retained
|
Comprehensive
|
Shareholders'
|
Comprehensive
|
||||||||||||||||||||
|
Outstanding
|
Amount
|
Earnings
|
Income (Loss)
|
Equity
|
Income
|
|||||||||||||||||||
|
Balance at December 30, 2007
|
13,932 | $ | 104,616 | $ | 42,585 | $ | 52 | $ | 147,253 | |||||||||||||||
|
Stock options exercised, including tax benefit
|
133 | 2,484 | 2,484 | |||||||||||||||||||||
|
Stock sold in Employee Stock Purchase Progam
|
50 | 939 | 939 | |||||||||||||||||||||
|
Stock-based compensation
|
2,711 | 2,711 | ||||||||||||||||||||||
|
Stock purchased in accordance with share purchase program
|
(941 | ) | (20,627 | ) | (20,627 | ) | ||||||||||||||||||
|
Net unrealized loss on marketable securities, net of tax of $12
|
(18 | ) | (18 | ) | $ | (18 | ) | |||||||||||||||||
|
Net income
|
11,165 | 11,165 | 11,165 | |||||||||||||||||||||
|
Balance at December 28, 2008
|
13,174 | $ | 90,123 | $ | 53,750 | $ | 34 | $ | 143,907 | $ | 11,147 | |||||||||||||
|
Stock options exercised, including tax benefit
|
202 | 4,521 | 4,521 | |||||||||||||||||||||
|
Stock sold in Employee Stock Purchase Progam
|
51 | 956 | 956 | |||||||||||||||||||||
|
Stock-based compensation
|
3,018 | 3,018 | ||||||||||||||||||||||
|
Stock purchased in accordance with share purchase program
|
(323 | ) | (6,564 | ) | (6,564 | ) | ||||||||||||||||||
|
Net unrealized loss on marketable securities, net of tax of $23
|
(34 | ) | (34 | ) | $ | (34 | ) | |||||||||||||||||
|
Net income
|
19,252 | 19,252 | 19,252 | |||||||||||||||||||||
|
Balance at January 3, 2010
|
13,104 | $ | 92,054 | $ | 73,002 | $ | - | $ | 165,056 | $ | 19,218 | |||||||||||||
|
Stock options exercised, including tax benefit
|
872 | 22,417 | 22,417 | |||||||||||||||||||||
|
Stock sold in Employee Stock Purchase Progam
|
17 | 497 | 497 | |||||||||||||||||||||
|
Stock-based compensation
|
3,354 | 3,354 | ||||||||||||||||||||||
|
Stock purchased in accordance with share purchase program
|
(930 | ) | (36,327 | ) | (36,327 | ) | ||||||||||||||||||
|
Net unrealized gain on marketable securities, net of tax of $2
|
2 | 2 | $ | 2 | ||||||||||||||||||||
|
Net income
|
17,501 | 17,501 | 17,501 | |||||||||||||||||||||
|
Balance at January 2, 2011
|
13,063 | $ | 81,995 | $ | 90,503 | $ | 2 | $ | 172,500 | $ | 17,503 | |||||||||||||
See notes to consolidated financial statements.
F-5
PEET’S COFFEE & TEA, INC.
CONSOLIDATED STATEMENTS OF CASH FLOWS
(In thousands)
|
Fifty-two
|
Fifty-three
|
Fifty-two
|
||||||||||
|
weeks ended
|
weeks ended
|
weeks ended
|
||||||||||
|
January 2,
|
January 3,
|
December 28,
|
||||||||||
|
2011
|
2010
|
2008
|
||||||||||
|
Cash flows from operating activities:
|
||||||||||||
|
Net income
|
$ | 17,501 | $ | 19,252 | $ | 11,165 | ||||||
|
Adjustments to reconcile net income to net cash provided by
|
||||||||||||
|
operating activities:
|
||||||||||||
|
Depreciation and amortization
|
17,959 | 17,279 | 15,113 | |||||||||
|
Amortization of interest purchased
|
16 | 36 | 193 | |||||||||
|
Stock-based compensation
|
3,354 | 3,018 | 2,711 | |||||||||
|
Excess tax benefit from exercise of stock options
|
(5,501 | ) | (892 | ) | (462 | ) | ||||||
|
Tax benefit from exercise of stock options
|
4,936 | 695 | 285 | |||||||||
|
Gain on sale of marketable securities
|
- | (7,305 | ) | - | ||||||||
|
Loss on disposition of assets and asset impairment
|
129 | 1,141 | 900 | |||||||||
|
Deferred income taxes
|
(1,103 | ) | 2,710 | 322 | ||||||||
|
Changes in other assets and liabilities:
|
||||||||||||
|
Accounts receivable, net
|
357 | (3,285 | ) | (3,637 | ) | |||||||
|
Inventories
|
(7,598 | ) | 188 | (1,641 | ) | |||||||
|
Prepaid expenses and other current assets
|
(1,935 | ) | 1,330 | (2,908 | ) | |||||||
|
Other assets
|
47 | 161 | (21 | ) | ||||||||
|
Accounts payable, accrued liabilities and deferred revenue
|
(3,809 | ) | 6,887 | 1,464 | ||||||||
|
Deferred lease credits and other long-term liabilities
|
411 | 695 | 1,960 | |||||||||
|
Net cash provided by operating activities
|
24,764 | 41,910 | 25,444 | |||||||||
|
Cash flows from investing activities:
|
||||||||||||
|
Purchases of property, plant and equipment
|
(11,603 | ) | (14,505 | ) | (25,930 | ) | ||||||
|
Proceeds from sales of property, plant and equipment
|
19 | 11 | 67 | |||||||||
|
Changes in restricted investments
|
558 | 877 | (87 | ) | ||||||||
|
Proceeds from sales and maturities of marketable securities
|
- | 16,183 | 7,857 | |||||||||
|
Purchases of marketable securities
|
(4,195 | ) | (371 | ) | (917 | ) | ||||||
|
Net cash (used in)/provided by investing activities
|
(15,221 | ) | 2,195 | (19,010 | ) | |||||||
|
Cash flows from financing activities:
|
||||||||||||
|
Net proceeds from issuance of common stock
|
17,978 | 4,782 | 3,138 | |||||||||
|
Purchase of common stock
|
(36,327 | ) | (6,564 | ) | (20,627 | ) | ||||||
|
Excess tax benefit from exercise of stock options
|
5,501 | 892 | 462 | |||||||||
|
Net cash used in financing activities
|
(12,848 | ) | (890 | ) | (17,027 | ) | ||||||
|
(Decrease) increase in cash and cash equivalents
|
(3,305 | ) | 43,215 | (10,593 | ) | |||||||
|
Cash and cash equivalents, beginning of period
|
47,934 | 4,719 | 15,312 | |||||||||
|
Cash and cash equivalents, end of period
|
$ | 44,629 | $ | 47,934 | $ | 4,719 | ||||||
|
Non-cash investing activities:
|
||||||||||||
|
Capital expenditures incurred, but not yet paid
|
$ | 412 | $ | 156 | $ | 734 | ||||||
|
Other cash flow information:
|
||||||||||||
|
Cash paid for income taxes
|
7,227 | 7,213 | 8,293 | |||||||||
See notes to consolidated financial statements.
F-6
PEET'S COFFEE & TEA, INC.
NOTES TO CONSOLIDATED FINANCIAL STATEMENTS
|
|
1.
|
Summary of Significant Accounting Policies
|
Organization
Peet's Coffee & Tea, Inc., a Washington corporation (the ‘‘Company”), sells fresh roasted coffee, hand selected tea, and related merchandise in several distribution channels, including grocery, home delivery, foodservice and office accounts and company-operated retail stores. At January 2, 2011 and January 3, 2010, the Company operated 192 retail stores in California, Colorado, Illinois, Oregon, Massachusetts and Washington.
Principles of Consolidation — The consolidated financial statements include the accounts of the Company and its subsidiaries. All intercompany transactions have been eliminated in consolidation.
Year End — The Company's fiscal year end is the Sunday closest to December 31. The fiscal years ended January 2, 2011 and December 28, 2008 included 52 weeks. The fiscal year ended January 3, 2010 included 53 weeks.
Use of Estimates — The preparation of financial statements in conformity with accounting principles generally accepted in the United States of America (“GAAP”) requires management to make estimates and assumptions that affect the reported amounts of assets and liabilities and disclosures of contingent assets and liabilities at the date of the financial statements and the reported amounts of revenues and expenses during the reporting period. Actual results could differ from those estimates.
Cash and Cash Equivalents — The Company considers all liquid investments with original maturities of three months or less to be cash equivalents.
Investments — Marketable securities are classified as available-for-sale and are recorded at fair value. Any unrealized gains and losses are recorded in other comprehensive income. Gains and losses are due to fluctuations in interest rates and are considered temporary impairments as management has the intent and ability to hold the securities to recovery.
Inventories — Raw materials consist primarily of green coffee beans. Finished goods include roasted coffee, tea, accessory products, spices, and packaged foods. All products are valued at the lower of cost or market using the first-in, first-out method, except green bean and roasted coffee, which are valued at the average cost. Inventory cost includes certain indirect costs related to the purchasing, transportation and warehousing of coffee, tea and merchandise. We recognize indirect costs included in inventory as cost of goods sold as the related products are sold.
Property, plant and equipment — Property, plant and equipment are stated at cost. Depreciation and amortization are recorded on the straight-line method over the estimated useful lives, which range from 2 to 40 years. Leasehold improvements are amortized using the straight-line method over the lesser of the estimated useful life or the term of the related lease, consistent with the period used for recognizing rent expense and deferred lease credits, which range from 5 to 10 years. Repairs and maintenance costs are expensed as incurred.
Intangible and other assets — Intangible and other assets include lease rights, contract acquisition costs, deposits, and restricted cash. Lease rights represent payments made to lessors and others to secure retail locations and are amortized on the straight-line method over the life of the related lease from 5 to 10 years. The cost of intangible assets, primarily lease rights, subject to amortization was $472,000 at January 2, 2011 and $1,066,000 at January 3, 2010. The related accumulated amortization was $1,013,000 and $980,000 at January 2, 2011 and January 3, 2010, respectively. Amortization expense for
2010, 2009, and 2008 was $33,000, $84,000, and $94,000, respectively. Future amortization expense for 2011 through 2015 is estimated at $15,000, $11,000, $10,000, $10,000 and $8,000, respectively.
Restricted cash of $1,891,000 and $2,449,000 as of January 2, 2011 and January 3, 2010, respectively, represents collateral for the Company’s high deductible workers’ compensation policy and is classified in other assets, net on the consolidated balance sheets.
F-7
Impairment of Long-Lived Assets — When facts and circumstances indicate that the carrying value of long-lived assets may be impaired, an evaluation of recoverability is performed by comparing the carrying values of the assets to projected future cash flows in addition to other quantitative and qualitative analyses. Property, plant and equipment assets are grouped at the lowest level for which there is identifiable cash flows when assessing impairment. Cash flows for retail net assets are identified at the individual store level. Upon indication that the carrying values of such assets may not be recoverable, the Company recognizes an impairment loss by a charge against current operations for an amount equal to the difference
between the carrying value and the assets’ fair value. The fair value of the retail net asset is estimated using the discounted cash flows of the assets. Long lived assets to be disposed of are reported at the lower of their carrying amount or fair value, less estimated costs to sell. The Company considers the economic environment when estimating future cash flows and in 2010 and 2009 considered the recession in our future sales assumptions. In 2010, there were no impairment losses recorded for underperforming stores. Impairment losses for underperforming stores of $128,000 and $630,000 were recorded during 2009 and 2008, respectively, which were classified as operating expenses on the consolidated statements of income.
Accrued Workers’ Compensation and Benefits — The Company records an estimated liability for the self-insured portion of workers' compensation claims. The liability is determined based on an actuarial assessment of information received from the Company’s insurance carrier including claims paid, filed and reserved for and historical experience. As of January 2, 2011 and January 3, 2010 the Company had $552,000 and $1,015,000, respectively, accrued for workers' compensation. For claims incurred during the policy years beginning March 1, 2008, the Company purchased a guaranteed cost insurance policy and therefore our self-insured claims exposure is limited to incidents prior to March 1, 2008.
Revenue Recognition — Net revenue is recognized at the point of sale at our Company-operated retail stores. Revenue from specialty, consisting of packaged coffee sales through home delivery, grocery, foodservice and office accounts, is recognized when the product is received by the customer. The majority of the Company’s distribution to grocery stores is through employees or independent distributors who do not take title to the inventory and revenue is recognized when the product is delivered to the grocer. In addition, we have distributors where title does pass to the distributor and revenue net of commissions is recorded upon delivery to the distributor.
Revenue from stored value gift cards and home delivery advanced payments is recognized upon redemption or receipt of product by the customer. Cash received in advance of product delivery is recorded in deferred revenue on the accompanying consolidated balance sheets.
All revenue is recognized net of any discounts, returns, allowances and sales incentives, including coupon redemptions and rebates. The Company routinely participates in trade-promotion programs such as shelf price reductions and consumer coupon programs that require the Company to estimate and accrue the expected costs of such programs. Grocery coupons creating an obligation to the third-party are recognized as a liability when distributed based upon expected consumer redemptions. The Company maintains liabilities based on historical experience and management’s judgment at the end of each period for the estimated expenses incurred, but unpaid for these programs. Net revenue includes an allowance for grocery sales returns for
coffee exceeding our freshness standards based on historical experience and current trends. The Company establishes an allowance for estimated doubtful accounts based on historical experience and current trends. Net revenue is presented net of any taxes collected from customers and remitted to government entities.
A summary of the allowance for doubtful accounts is as follows (in thousands):
|
Balance at
|
Additions
|
|||||||||||||||
|
Beginning
|
Charged to
|
Write-offs
|
Balance at
|
|||||||||||||
|
of Year
|
Expense
|
and Other
|
End of Year
|
|||||||||||||
|
Allowance for doubtful accounts
|
||||||||||||||||
|
Year ended January 2, 2011
|
$ | 132 | $ | 187 | $ | (36 | ) | $ | 283 | |||||||
|
Year ended January 3, 2010
|
136 | (4 | ) | - | 132 | |||||||||||
|
Year ended December 28, 2008
|
72 | 64 | - | 136 | ||||||||||||
The Company records shipping revenue in net revenue. The Company recorded shipping revenue of $1,789,000, $1,948,000 and $2,593,000 related to home delivery sales in 2010, 2009 and 2008, respectively.
Cost of sales and related occupancy expenses — Cost of sales and related occupancy expenses consist primarily of coffee and other product costs. It also includes plant manufacturing (including depreciation), freight and distribution costs. Occupancy expenses include rent and related expenses such as utilities.
F-8
Operating expenses — Operating expenses consist of both retail store and specialty operating costs, such as employee labor and benefits, independent distributor commissions, repairs and maintenance, supplies, training, travel and banking and card processing fees.
Preopening costs — Costs incurred in connection with the start-up and promotion of new store openings are expensed as incurred.
Advertising costs — Advertising costs are expensed as incurred. Advertising expense was $4,248,000, $4,944,000 and $4,439,000 in 2010, 2009 and 2008, respectively.
Operating leases — Certain of the Company's lease agreements provide for tenant improvement allowances, rent holidays, scheduled rent increases and/or contingent rent provisions during the term of the lease. For purposes of recognizing incentives and minimum rental expenses, rent is expensed on a straight-line basis, and the Company records the difference between the recognized rental expense and amounts payable under the lease to deferred lease credits and other long-term liabilities over the lease term, which may or may not coincide with the commencement of the lease. Tenant improvement allowances are amortized as a reduction in rent expense over the term of the lease. If the original lease term
is less than the Company’s anticipated rental period, one or more stated option terms are included in the straight-line computation. Certain leases provide for contingent rents, which are determined as a percentage of gross sales in excess of specified levels. The Company records a contingent rent liability in accounts payable on the consolidated balance sheets and the corresponding rent expense when specified levels have been achieved or when management determines that achieving the specified levels during the fiscal year is probable. When ceasing operations under operating leases, in cases where the lease contract specifies a termination fee due to the landlord, the Company records such expense at the time written notice is given to the landlord. In cases where terms, including termination fees, are yet to be negotiated with the landlord, the Company will record the expense upon the earlier of the cease-use date or signing of an agreement with the
landlord. Finally, in cases where the landlord does not allow the Company to prematurely exit its lease, but allows for subleasing, the Company estimates the fair value of any sublease income that can be generated from the location and expenses the present value of the excess of remaining lease payments to the landlord over the projected sublease income at the cease-use date.
Gift Cards — The Company sells stored value gift cards in its retail stores and through its web site. The gift cards do not have an expiration date. The Company recognizes income from gift cards when the likelihood of the gift card being redeemed by the customer is remote (gift card breakage) and we determine that we do not have a legal obligation to remit the unredeemed gift cards to the relevant jurisdictions. We determine the gift card breakage rate based upon our historical redemption patterns. We apply an estimated gift card breakage rate after the card has been dormant for 24 months, when based on historical information, we determine the likelihood of redemption becomes remote. Gift card breakage income of
$634,000, $580,000 and $497,000 in 2010, 2009 and 2008, respectively, is included in operating expenses in the consolidated statements of income.
Income Taxes — The Company accounts for income taxes using the liability method. Under this method, deferred tax assets and liabilities are determined based on differences between the financial reporting and tax bases of assets and liabilities and are measured using the enacted tax rates and laws that are expected to be in effect when the differences are expected to reverse. The Company is subject to periodic audits by the Internal Revenue Service and other state and local taxing authorities. These audits may challenge certain of the Company’s tax positions such as the timing and amount of income and deductions and the allocation of taxable income to various tax jurisdictions. Income tax contingencies are accounted for in
accordance with ASC 740, “Income Taxes,” and may require significant management judgment in estimating final outcomes. Actual results could materially differ from these estimates and could significantly affect the Company’s effective tax rate and cash flows in future years.
Fair Value Measurements –The accounting guidance for fair value measurements and disclosure defines and establishes a framework for measuring fair value and expands related disclosures. For financial assets and financial liabilities, this accounting guidance was effective for the Company beginning in fiscal 2008. Beginning in fiscal 2009, the Company adopted fair value measurements and disclosure requirements for all nonfinancial assets and nonfinancial liabilities. See Note 2. “Fair Value of Financial Instruments.”
Comprehensive Income – Comprehensive income includes all changes in equity during the period, except those resulting from transactions with shareholders of the Company. It has two components: net income and other comprehensive income. Accumulated other comprehensive income reported on the Company’s consolidated balance sheets consists of unrealized gains and losses, net of applicable taxes, on available-for-sale securities.
F-9
Stock-Based Compensation — On January 2, 2006, the Company adopted the fair value recognition provisions of ASC 718, “Compensation-Stock Compensation,” using the modified-prospective-transition method. The fair value of each stock award is estimated on the grant date using the Black-Scholes-Merton option-pricing model based on assumptions for volatility, risk-free interest rates, expected life of the option, and dividends (if any). Such amounts have been reduced by the Company’s estimate of forfeitures of all unvested awards. The expected term of the options represents the estimated period of time from date of option grant until exercise and is based on historical experience of similar
awards, giving consideration to the contractual terms, vesting schedules and expectations of future employee behavior. For grants prior to July 3, 2006 expected stock price volatility was estimated using only the historical volatility of the Company’s stock. Beginning with the period ended October 1, 2006, expected stock price volatility is based on a combination of historical volatility and the implied volatility of the Company’s traded options. The risk-free interest rate is based on the implied yield available on U.S. Treasury zero-coupon issues with an equivalent term. The Company has not paid dividends in the past and does not plan to pay dividends in the near future. Additional disclosure requirements of ASC 718 are set forth in Note 9, “Stock Options, Employee Purchase and Deferred Compensation Plans”.
Stock-based compensation expense and related tax benefit was recognized as follows in the consolidated statements of income (in thousands):
|
2010
|
2009
|
2008
|
||||||||||
|
Stock-based compensation expense
|
$ | 3,227 | $ | 2,866 | $ | 2,441 | ||||||
|
ESPP expense
|
127 | 152 | 270 | |||||||||
|
Total
|
$ | 3,354 | $ | 3,018 | $ | 2,711 | ||||||
|
Cost of sales and related occupancy expenses
|
$ | 535 | $ | 294 | $ | 213 | ||||||
|
Operating expenses
|
1,009 | 1,209 | 1,287 | |||||||||
|
General and administrative expenses
|
1,810 | 1,515 | 1,211 | |||||||||
|
Total
|
$ | 3,354 | $ | 3,018 | $ | 2,711 | ||||||
|
Tax benefit
|
$ | 1,365 | $ | 1,229 | $ | 1,105 | ||||||
The fair value of each restricted stock unit awards “RSU” is equal to the stock price on the date of grant. The fair value of each option grant and ESPP award is estimated on the date of grant using the Black-Scholes-Merton option-pricing model with the following assumptions:
|
Stock Options
|
ESPP
|
|||||||||||||||||||||||
|
2010
|
2009
|
2008
|
2010
|
2009
|
2008
|
|||||||||||||||||||
|
Expected term in years
|
5.8 | 5.7 | 5.3 | 0.3 | 0.5 | 0.5 | ||||||||||||||||||
|
Expected stock price volatility
|
36.5 | % | 37.6 | % | 34.4 | % | 33.4 | % | 36.9 | % | 31.4 | % | ||||||||||||
|
Risk-free interest rate
|
2.2 | % | 2.9 | % | 3.6 | % | 1.6 | % | 2.7 | % | 2.6 | % | ||||||||||||
|
Expected dividend yield
|
0.0 | % | 0.0 | % | 0.0 | % | 0.0 | % | 0.0 | % | 0.0 | % | ||||||||||||
|
Estimated fair value per option granted
|
$ | 13.92 | $ | 10.57 | $ | 8.83 | $ | 8.21 | $ | 5.96 | $ | 5.58 | ||||||||||||
|
Estimated fair value per RSU awarded
|
$ | 37.14 | $ | - | $ | - | $ | - | $ | - | $ | - | ||||||||||||
Net Income per Share — Basic net income per share is computed as net income divided by the weighted average number of common shares outstanding for the period. Diluted net income per share reflects the potential dilution that could occur from common shares issued through stock options. Anti-dilutive shares of 168,838, 1,166,422, and 1,258,510 have been excluded from diluted weighted average shares outstanding in 2010, 2009, and 2008, respectively.
The number of incremental shares from the assumed exercise of stock options was calculated by applying the treasury stock method. The following table summarizes the differences between basic weighted average shares outstanding and diluted weighted average shares outstanding used to compute diluted net income per share (in thousands):
|
2010
|
2009
|
2008
|
||||||||||
|
Basic weighted average shares outstanding
|
13,038 | 12,997 | 13,723 | |||||||||
|
Incremental shares from assumed exercise of stock options
|
605 | 352 | 274 | |||||||||
|
Diluted weighted average shares outstanding
|
13,643 | 13,349 | 13,997 | |||||||||
F-10
Recently Issued Accounting Standards
On January 21, 2010, the Financial Accounting Standards Board (“FASB”) issued an Accounting Standards Update (“ASU”) relating to Fair Value Measurements and Disclosures, to add new requirements for disclosures about transfers into and out of fair value measurement Levels 1 and 2 and separate disclosures about purchases, sales, issuances, and settlements relating to Level 3 fair value measurements. The ASU also clarifies existing fair value disclosures about the level of disaggregation and about inputs and valuation techniques used to measure fair value. The Company is subject to the requirements of this ASU commencing the first day of its 2010 fiscal year. This ASU did not have an impact to the Company’s condensed consolidated financial statements except to the
extent it required the Company to provide increased disclosure.
|
2.
|
Fair Value of Financial Instruments
|
ASC 820, “Fair Value Measurements and Disclosures,” defines fair value as the exchange price that would be received for an asset or paid to transfer a liability (an exit price) in the principal or most advantageous market for the asset or liability in an orderly transaction between market participants on the measurement date. ASC 820 also establishes a fair value hierarchy which requires an entity to maximize the use of observable inputs and minimize the use of unobservable inputs when measuring fair value. The standard describes three levels of inputs that may be used to measure fair value:
Level 1 - Quoted prices in active markets for identical assets or liabilities.
Level 2 - Inputs other than quoted prices included within Level 1 that are either directly or indirectly observable.
Level 3 - Unobservable inputs that are supported by little or no market activity, therefore requiring an entity to develop its own assumptions about the assumptions that market participants would use in pricing.
Recurring Fair Value Measurements
In accordance with accounting principles generally accepted in the United States, certain assets and liabilities are required to be recorded at fair value on a recurring basis. The Company has the following assets that are adjusted to fair value on a recurring basis.
Short-term marketable securities
The fair values of our investments in short-term marketable securities were determined using quoted market prices from daily exchange traded markets. The fair values of these instruments were based on the closing price as of the balance sheet date and were classified as Level 1. The Company had short-term marketable securities of $4.2 million at January 2, 2011. There were no short-term marketable securities at January 3, 2010.
Unrealized gains or losses on short-term marketable securities are recorded in accumulated other comprehensive income at each measurement date.
Assets and Liabilities Measured at Fair Value on a Non-Recurring Basis
The Company measures certain non-financial assets and liabilities, including long-lived assets, at fair value on a non-recurring basis. In 2010, the Company was not required to measure any non-financial assets and liabilities at fair value. In 2009, the Company recorded a charge of $128,000 related to the impairment of assets at an under-performing store. The fair market value of these assets was determined using the income approach and Level 3 inputs, which required management to make estimates about future cash flows. Management estimates the amount and timing of future cash flows based on its experience and knowledge of the retail market in which each store operates. This impairment charge is included in operating expenses in the accompanying consolidated statements of income. The Company was
not required to measure any other significant non-financial assets and liabilities at fair value.
The carrying value of cash and equivalents, restricted cash, receivables and accounts payable approximates fair value.
F-11
|
3.
|
Inventories
|
The Company's inventories consist of the following at year end 2010 and 2009 (in thousands):
|
2010
|
2009
|
|||||||
|
Green coffee
|
$ | 23,200 | $ | 16,228 | ||||
|
Other inventory
|
10,334 | 9,708 | ||||||
|
Total
|
$ | 33,534 | $ | 25,936 | ||||
|
4.
|
Property, Plant and Equipment
|
Property, plant and equipment consist of the following at year end 2010 and 2009 (in thousands):
|
2010
|
2009
|
|||||||
|
Leasehold improvements
|
$ | 75,157 | $ | 73,406 | ||||
|
Furniture, fixtures and equipment
|
89,598 | 82,345 | ||||||
|
Plant equipment
|
17,986 | 18,882 | ||||||
|
Construction in progress
|
1,288 | 1,033 | ||||||
|
Building
|
14,238 | 14,238 | ||||||
|
Land
|
8,902 | 8,902 | ||||||
|
Total
|
207,169 | 198,806 | ||||||
|
Less: Accumulated depreciation
|
(109,890 | ) | (95,312 | ) | ||||
|
Property, plant and equipment, net
|
$ | 97,279 | $ | 103,494 | ||||
Depreciation expense was $17,926,000 in 2010, $17,194,000 in 2009, and $15,010,000 in 2008. Construction in progress includes retail stores under construction and related fixtures, manufacturing plant equipment, and other capital projects not yet placed in service.
|
5.
|
Marketable Securities
|
At January 2, 2011, the Company maintained marketable securities classified as available-for-sale as follows (in thousands). At January 3, 2010, there were no short-term marketable securities. Gross unrealized holding gains at January 2, 2011 are due to fluctuations in interest rates.
|
Amortized
|
Gross Unrealized
|
Fair
|
||||||||||
|
Cost
|
Holding Gains
|
Value
|
||||||||||
|
State and local government obligations
|
$ | 4,179 | $ | 4 | $ | 4,183 | ||||||
|
Total marketable securities - short-term
|
$ | 4,179 | $ | 4 | $ | 4,183 | ||||||
There were no sales of available-for-sale securities in 2010. During 2009, the Company sold available-for-sale securities for net proceeds from marketable securities of $16,183,000, with realized gains of $7,305,000. Realized gains and losses are determined on the specific identification method. As of January 2, 2011, the Company had total unrealized losses of $2,000 reported in shareholders’ equity as a component of accumulated other comprehensive income or loss, net of any related tax effect.
F-12
|
6.
|
Income Taxes
|
The income tax provision consists of the following (in thousands):
|
2010
|
2009
|
2008
|
||||||||||
|
Current:
|
||||||||||||
|
Federal
|
$ | 8,984 | $ | 6,830 | $ | 4,178 | ||||||
|
State
|
2,572 | 2,051 | 2,071 | |||||||||
|
Total
|
11,556 | 8,881 | 6,249 | |||||||||
|
Deferred:
|
||||||||||||
|
Federal
|
(1,110 | ) | 2,751 | 889 | ||||||||
|
State
|
(401 | ) | (74 | ) | (576 | ) | ||||||
|
Total
|
(1,511 | ) | 2,677 | 313 | ||||||||
|
Total
|
$ | 10,045 | $ | 11,558 | $ | 6,562 | ||||||
The difference between the effective income tax rate and the United States federal income tax rate is summarized as follows:
|
2010
|
2009
|
2008
|
||||||||||
|
Statutory Federal rate
|
35.0 | % | 35.0 | % | 35.0 | % | ||||||
|
State income taxes less federal benefit
|
5.7 | 5.7 | 5.7 | |||||||||
|
Tax-exempt interest
|
0.0 | (0.1 | ) | (0.8 | ) | |||||||
|
Domestic production deduction
|
(3.2 | ) | (1.4 | ) | (1.6 | ) | ||||||
|
Hiring tax credits
|
(1.5 | ) | (1.6 | ) | (1.5 | ) | ||||||
|
Other,net
|
0.4 | (0.1 | ) | 0.2 | ||||||||
|
Total
|
36.4 | % | 37.5 | % | 37.0 | % | ||||||
Deferred tax assets (liabilities) consist of the following at year end 2010 and 2009 (in thousands):
|
Credit carryforwards
|
$ | 747 | $ | 487 | ||||
|
Scheduled rent
|
2,829 | 2,870 | ||||||
|
Accrued reserves
|
1,287 | 2,391 | ||||||
|
Accrued compensation
|
3,133 | 953 | ||||||
|
State taxes
|
394 | 530 | ||||||
|
Stock options
|
3,969 | 4,077 | ||||||
|
Other
|
312 | 54 | ||||||
|
Gross deferred tax assets
|
12,671 | 11,362 | ||||||
|
Property, plant and equipment
|
(8,491 | ) | (8,159 | ) | ||||
|
Other
|
194 | 68 | ||||||
|
Gross deferred tax liabilities
|
(8,297 | ) | (8,091 | ) | ||||
|
Net deferred tax assets
|
$ | 4,374 | $ | 3,271 |
The Company adopted ASC 740, “Unrecognized Tax Benefits,” as of January 1, 2007.
The following table summarizes the activity related to unrecognized tax benefits (in thousands):
|
2010
|
2009
|
2008
|
||||||||||
|
Beginning gross unrecognized tax benefit
|
$ | 123 | $ | 109 | $ | 85 | ||||||
|
Gross increases for the current period
|
38 | 14 | 24 | |||||||||
|
Ending gross unrecognized tax benefit
|
$ | 161 | $ | 123 | $ | 109 | ||||||
F-13
The amount of unrecognized tax benefits that would increase the Company’s tax rate if recognized is $161,000. This relates to state exposures from not filing a state tax return. It is the Company’s policy to recognize interest and penalties in the tax provision. Related to the unrecognized tax benefits noted above, the Company accrued penalties and interest of $15,000 for each of 2010, 2009 and 2008. In total, as of January 2, 2011, the Company has recognized a liability for penalties and interest of $69,000. The total amounts for the years ended January 3, 2010 and December 28, 2008 were $57,000 and $43,000, respectively. We do not expect our unrecognized tax benefits to change significantly over the next 12 months.
The Company files income tax returns in the U.S. federal jurisdiction and various state jurisdictions. The Company’s federal income tax returns for the years 2002 through 2006 were effectively settled with the Internal Revenue Service. The Company’s federal income tax returns for 2007 through 2009 are open tax years and 2007 and 2008 federal income tax returns are currently under audit by the Internal Revenue Service. The Company’s returns for the state of California tax for 2006 through 2009 are open tax years. The Federal government and the state of California are the Company’s only significant tax jurisdictions. The Company also files in numerous state jurisdictions with varying statutes of limitations.
No valuation allowance for deferred tax assets was recorded as management believes it is more likely than not that all of the deferred tax assets will be realized. The Company has California Enterprise Zone credit carryforwards of $747,000 that do not expire.
|
7.
|
Employee Benefit Plan
|
The Company's 401(k) plan covers substantially all employees that are 21 years of age and older. Employees may contribute up to 100% of their annual salary up to a maximum of $16,500. The Company matches 50% of amounts contributed by its employees after one year of employment, subject to a maximum of 5% of the employees’ eligible compensation contributed to the plan. The Company’s contribution was $676,000, $646,000 and $589,000 in 2010, 2009 and 2008, respectively. The plan does not offer investments in Company stock.
|
8.
|
Stock Purchase Program
|
On October 27, 2008, the Board of Directors approved a stock purchase program providing for the purchase of up to one million shares of the Company’s common stock, with no deadline for completion and the Company announced its plan on October 28, 2008 on Form 8-K. During the years ended January 2, 2011, and January 3, 2010, the Company purchased and retired 735,888 and 264,112 shares, respectively, at an average price of $38.64 and $20.32, respectively, in accordance with this stock purchase program. As of January 2, 2011, No shares remain available for purchase under this stock purchase program.
On September 2, 2010, the Board of Directors authorized the Company to purchase up to one million additional shares of the Company’s common stock. During the year ended January 2, 2011, the Company purchased and retired 194,549 shares of common stock, at an average price of $40.57. 805,451 shares remain available for purchase under this stock purchase plan. Purchases under this stock purchase program would be made from time to time on the open market at prevailing market prices or in negotiated transactions off the market.
|
9.
|
Stock Option, Employee Purchase and Deferred Compensation Plans
|
On May 18, 2010, the Company’s shareholders approved the Peet’s Coffee & Tea, Inc. 2010 Equity Incentive Plan (the “2010 Plan”). The 2010 Plan is intended as the successor to and continuation of the Peet’s Coffee & Tea, Inc. 2000 Equity Incentive Plan (“Prior Plan”). Under the 2010 Plan, the Company may grant incentive stock options, no statutory stock options, stock appreciation rights, restricted stock awards, restricted stock unit awards (“RSUs”), performance stock awards, performance cash awards, and other stock awards. The aggregate number of shares of common stock that may be issued pursuant to stock awards from and after May 18, 2010 shall not exceed 700,000 shares plus shares underlying options under the
Prior Plan that expire or terminate, less one share for each share of stock issued pursuant to an option or stock appreciation right under the Prior Plan after January 3, 2010 and 1.8 shares for each share of stock issued pursuant to a restricted stock award, restricted stock unit award, performance stock award, performance cash award, or other stock award. No additional stock awards will be granted under the Prior Plan.
In 2001, the Company adopted the 2000 Non-Employee Director Plan that provides for the automatic grant of non statutory stock options to purchase shares of common stock to non-employee directors, which is administered by the Board of Directors. The aggregate number of shares of common stock that may be issued under the plan is 750,000. The shareholder approval on May 18, 2010 of the 2010 Equity Incentive Plan amended the 2000 Non-Employee Director Plan such that it eliminated the evergreen feature that automatically increased the share reserve. The exercise price of options granted will be equal to the fair market value of the common stock on the date of grant and have a term no more than ten years from the date granted. Stock options vest according to a pre-determined vest
schedule set at grant date. In 2010, 2009, and 2008, the Company granted non-employee director options to purchase an aggregate of 35,000, 35,000, and 47,500, shares of common stock, respectively.
F-14
The aggregate intrinsic value in the table below is before applicable income taxes, based on the Company’s closing stock price of $41.74 as of the last business day of the year, which would have been received by the optionees had all options been exercised on that date. As of January 2, 2011, total unrecognized stock-based compensation expense related to nonvested stock options was approximately $5.6 million, which is expected to be recognized over a weighted average period of approximately 29 months.
As of January 2, 2011, there were 562,274 shares available for grant under the 2010 stock option plan, no shares available for grant under the 2000 stock option plan, and 171,850 shares available for grant under the 2000 Non-Employee Director stock option plan. Changes in stock options were as follows:
|
Weighted Average
|
Aggregate
|
|||||||||||||||
|
Weighted Average
|
Remaining
|
Intrinsic
|
||||||||||||||
|
Options
|
Exercise Price
|
Contractual
|
Value
|
|||||||||||||
|
Outstanding
|
Per Share
|
Life (Years)
|
(in thousands)
|
|||||||||||||
|
Outstanding at December 30, 2007
|
2,579,363 | $ | 21.36 | 6.40 | $ | 21,028 | ||||||||||
|
Granted
|
351,464 | 23.72 | ||||||||||||||
|
Canceled
|
(101,303 | ) | 27.19 | |||||||||||||
|
Exercised
|
(133,505 | ) | 16.50 | |||||||||||||
|
Outstanding at December 28, 2008
|
2,696,019 | $ | 21.68 | 5.82 | $ | 8,753 | ||||||||||
|
Granted
|
382,014 | 26.28 | ||||||||||||||
|
Canceled
|
(112,374 | ) | 25.46 | |||||||||||||
|
Exercised
|
(201,434 | ) | 19.02 | |||||||||||||
|
Oustanding at January 3, 2010
|
2,764,225 | $ | 22.35 | 5.50 | $ | 30,400 | ||||||||||
|
Granted
|
258,530 | 36.41 | ||||||||||||||
|
Canceled
|
(132,013 | ) | 26.54 | |||||||||||||
|
Exercised
|
(872,052 | ) | 20.06 | |||||||||||||
|
Oustanding at January 2, 2011
|
2,018,690 | $ | 24.87 | 5.63 | $ | 34,050 | ||||||||||
|
Vested or expected to vest, January 2, 2011
|
1,939,853 | $ | 24.63 | 5.56 | $ | 33,194 | ||||||||||
|
Exercisable at January 2, 2011
|
1,251,760 | $ | 21.95 | 4.21 | $ | 24,770 | ||||||||||
The aggregate intrinsic value of stock options exercised was $17,083,000 $2,864,000, and $1,169,000 in 2010, 2009, and 2008, respectively.
The following table summarizes stock option information at year end 2010:
|
Options Outstanding
|
Options Exercisable
|
|||||||||||||||||||
|
Weighted Average
|
||||||||||||||||||||
|
Remaining
|
||||||||||||||||||||
|
Range of
|
Number of
|
Contractual
|
Weighted Average
|
Number of
|
Weighted Average
|
|||||||||||||||
|
Exercise Prices
|
Options
|
Life (Years)
|
Exercise Price
|
Options
|
Exercise Price
|
|||||||||||||||
|
$7.23 to $17.47
|
475,456 | 1.77 | $ | 15.44 | 475,456 | $ | 15.44 | |||||||||||||
|
$21.35 to $25.96
|
408,653 | 5.78 | 23.48 | 286,104 | 23.44 | |||||||||||||||
|
$25.97 to $26.48
|
500,957 | 7.03 | 26.39 | 276,439 | 26.43 | |||||||||||||||
|
$26.50 to $33.57
|
423,441 | 6.32 | 28.96 | 211,261 | 28.58 | |||||||||||||||
|
$35.12 to $39.51
|
210,183 | 9.36 | 37.07 | 2,500 | 35.87 | |||||||||||||||
|
$7.23 to $39.51
|
2,018,690 | 5.63 | $ | 24.87 | 1,251,760 | $ | 21.95 | |||||||||||||
F-15
Changes in Restricted Stock Units were as follows:
|
Weighted Average
|
Aggregate
|
|||||||||||||||
|
Number of
|
Weighted Average
|
Remaining
|
Intrinsic
|
|||||||||||||
|
Units
|
Grant Date
|
Contractual
|
Value
|
|||||||||||||
|
Outstanding
|
Fair Value
|
Life (Years)
|
(in thousands)
|
|||||||||||||
|
Outstanding at January 3, 2010
|
- | $ | - | - | $ | - | ||||||||||
|
Granted
|
27,035 | 37.14 | ||||||||||||||
|
Vested
|
- | - | ||||||||||||||
|
Forfeited, cancelled or expired
|
(2,134 | ) | 37.11 | |||||||||||||
|
Outstanding at January 2, 2011
|
24,901 | $ | 37.14 | 2.92 | $ | 1,004 | ||||||||||
During 2001, the Company adopted the 2000 Employee Stock Purchase Plan ("ESPP"), where eligible employees can choose to have up to 15% of their annual earnings withheld to purchase the Company's common stock. The purchase price of stock is 85% of the lower of the beginning of the offering period or end of the offering period market price. The Company authorized 200,000 shares of common stock available for issuance under the plan, which will be increased as of each annual meeting of the Company's shareholders, beginning 2002 until 2020, by the least of 200,000 shares or 1.5% of the number of shares of common stock outstanding on that date. However, the Board of Directors has the authority to designate a smaller number of shares by which the authorized number of shares of common
stock will be increased on that date. During 2010, 2009, and 2008, employees purchased 17,145, 51,323, and 49,861 shares, respectively, of the Company's common stock under the plan at a weighted-average per share price of $28.95, $18.51, and $18.76, respectively. At January 2, 2011, 1,447,220 shares remain available for future issuance.
Effective December 1, 2003, the Company adopted a Nonqualified Deferred Compensation Plan (the "Plan") for certain executive employees. The purpose of the Plan is to offer those employees an opportunity to elect to defer the receipt of compensation in order to provide termination of employment and related benefits taxable pursuant to section 451 of the Internal Revenue Code of 1986, as amended (the "Code"). The Plan is intended to be a "top-hat" plan (i.e., an unfunded deferred compensation plan maintained for a select group of management or highly-compensated employees) under sections 201(2), 301(a)(3) and 401(a)(1) of the Employee Retirement Income Security Act of 1974 ("ERISA"). The long-term liability related to compensation deferrals under the Plan was $1,219,000 and $824,000 as of
January 2, 2011 and January 3, 2010, respectively, which is included in deferred lease credits and other long-term liabilities. The related asset is classified in cash and cash equivalents on the consolidated balance sheets.
|
10.
|
Line of Credit
|
On December 21, 2010, the Company entered into a credit agreement with Wells Fargo Bank, National Association (the “Bank”). The credit agreement provides for a $50 million revolving line of credit, the proceeds of which may be used in the general corporate purposes, including funding working capital, capital expenditures, share repurchases and other needs. The line of credit has a maturity date of December 1, 2013. This credit agreement replaces the Company’s agreement with the Bank that matured on December 1, 2010 and under which there were no borrowings.
The Company’s obligations under the line of credit are unconditionally guaranteed by Peet’s Operating Company, Inc. in the principal amount up to $50 million. The line of credit has a maturity date of December 1, 2013.
Amounts drawn under the credit agreement will bear interest (computed on the basis of a 360-day year, actual days elapsed) either (i) at a fluctuating rate, determined on a daily basis, per annum of the Daily One-Month LIBOR Spread above the rate of interest equal to LIBOR then in effect for delivery for a 1 month period, or (ii) at a fixed rate per annum of the Fixed LIBOR spread above LIBOR in effect on the first day of the applicable period commencing on a business day and continuing for 1, 3, or 6 months, as designated by the Company. The Daily One-Month and Fixed LIBOR spreads are based upon the Company’s leverage ratio calculated for the most recent quarter as follows:
|
Leverage Ratio
|
Daily One-Month LIBOR or
Fixed LIBOR Spread
|
|||
|
Greater than 2.00 to 1.00
|
1.50 | % | ||
|
Less than or equal to 2.00 to 1.00
|
1.00 | % | ||
The credit agreement contains customary affirmative and negative covenants. The credit agreement also includes financial covenants that require the Company to maintain a specified leverage ratio and a minimum amount of net income. The credit agreement includes customary events of default that permit the Bank to accelerate the Company’s outstanding obligations, including nonpayment of principal, interest, fees or other amounts, violation of covenants, failure to make any payments when due with respect to certain other debt or certain failures to comply with the terms of such other debt, entry of certain judgments, inaccuracy of representations and warranties, occurrence of any event or condition that has a material adverse effect, and
upon the occurrence of bankruptcy and other insolvency events and certain events relating to a dissolution or liquidation of the Company or Peet’s Operating Company, Inc.
F-16
During the year and as of January 2, 2011, there were no borrowings under this agreement. Total unused borrowing capacity under the credit agreement was $50.0 million as of January 2, 2011.
11. Store Closures
The Company closed 4 underperforming retail locations in 2009. In connection with the store closures, the Company incurred certain costs related to store lease obligations and employee related expenses in 2009 and 2010 as follows:
|
Balance at
|
Additions
|
|||||||||||||||
|
Beginning
|
Charged to
|
Cash
|
Balance at
|
|||||||||||||
|
of Year
|
Expense
|
Payments
|
End of Year
|
|||||||||||||
|
2010
|
||||||||||||||||
|
Lease obligations
|
$ | 443 | $ | 140 | $ | (353 | ) | $ | 230 | |||||||
|
Employee related expenses
|
24 | - | (24 | ) | - | |||||||||||
|
Total
|
$ | 467 | $ | 140 | $ | (377 | ) | $ | 230 | |||||||
|
2009
|
||||||||||||||||
|
Lease obligations
|
$ | - | $ | 443 | $ | - | $ | 443 | ||||||||
|
Employee related expenses
|
- | 24 | - | 24 | ||||||||||||
|
Total
|
$ | - | $ | 467 | $ | - | $ | 467 | ||||||||
As a result of the December 2009 store closures, the Company recorded a non-cash fixed asset write-off of $885,000, which is classified in operating expense in the accompanying consolidated statements of income.
The employee related expenses and lease obligation costs included in the table above are classified in operating expenses and cost of sales and related occupancy expenses, respectively, in the accompanying consolidated statements of income.
There were no lease or other obligations associated with closing the two stores at the end of their lease term in 2010.
12. Transaction Related Expenses/(Income)
In 2009, the Company terminated a definitive agreement to acquire Diedrich Coffee. In 2010 the Company responded to a subpoena it received from the Federal Trade Commission (FTC) in connection with the FTC’s anti-trust review of the acquisition of Diedrich Coffee by Green Mountain Coffee Roasters. As a result, in 2010 the Company incurred $1.0 million of external professional and fees related to the FTC’s anti-trust review. In 2009 the Company recorded transaction income of an $8.5 million break-up fee, net of $4.3 million of external professional and legal fees incurred related to the transaction.
No transaction related expenses/(income) were recorded in fiscal 2008.
|
13.
|
Commitments and Contingencies
|
Leases — The Company leases its Emeryville, California administrative offices and its retail stores and certain equipment under operating leases that expire from 2011 through 2020. Certain leases contain renewal options for an additional five to fifteen years, and also provide for contingent rents to be paid equal to a stipulated percentage of sales. The lease agreements also provide for periodic adjustments to the minimum lease payments based on changes in cost of living indices or other scheduled increases.
Future minimum lease payments required under non-cancelable operating leases subsequent to January 2, 2011 are as follows (amounts in thousands):
F-17
|
Leases
|
||||
|
Years:
|
||||
|
2011
|
$ | 17,305 | ||
|
2012
|
17,017 | |||
|
2013
|
15,382 | |||
|
2014
|
13,715 | |||
|
2015
|
11,173 | |||
|
Thereafter
|
20,431 | |||
|
Total minimum lease payments
|
$ | 95,023 | ||
Rent expense was $16,126,000, $15,957,000 and $14,513,000 for 2010, 2009 and 2008, respectively, including contingent rents of $55,000, $113,000 and $123,000, respectively.
Purchase Commitments — As of January 2, 2011, the Company had outstanding coffee purchase commitments with both fixed prices and prices with a fixed premium over the New York “C” market as follows (amounts in thousands):
|
Purchase
Commitments
|
||||
|
Years:
|
||||
|
2011
|
$ | 55,154 | ||
|
2012
|
1,149 | |||
|
Total minimum purchase commitments
|
$ | 56,303 | ||
Legal Proceedings — On July 14, 2008, a complaint was filed against the Company in California Superior Court, Alameda County, by three former employees on behalf of themselves and all other California store managers. The plaintiffs alleged that store managers based in California were not paid overtime wages, were not provided meal or rest periods, were not provided accurate wage statements and were not reimbursed for business expenses. On December 16, 2009, the Company reached a tentative settlement pursuant to which we would deny any liability but agree to maximum payment of $2.6 million. The
California Superior Court approved the final settlement on September 1, 2010. Based on the final settlement amount, the Company recorded into income a credit of approximately $93,000 during the year ended January 2, 2011 based on the difference between the original $2.6 million recorded liability and the actual settlement payment. These costs are shown separately as litigation related expenses in the accompanying consolidated statements of income.
On February 23, 2010, a complaint was filed in Orange County Superior Court by two former employees, on behalf of themselves and all other non-exempt employees similarly situated in the state of California naming us as a defendant. One of the plaintiffs was removed by an amended complaint and the remaining plaintiff alleges claims for unpaid overtime, unpaid meal and rest period premiums, unpaid business expenses, unpaid minimum wages, untimely wages paid at time of termination, untimely payment of wages, failure to pay vacation wages, violation of California Business & Professions Code section 17200 and non-compliant wage statements and seeks injunctive relief, restitution, monetary damages, penalties under the California Labor Code Private Attorneys General Act, costs and attorneys’ fees, penalties,
and prejudgment interest. At this time, it is not feasible to predict the outcome of or a range of loss, should a loss occur, from this proceeding. The Company has previously settled two employment related lawsuits certified as a class: In addition to the $2.5 million settlement in 2010 discussed above, the Company made a final settlement payment for $2.1 million in 2004 of another class action lawsuit.
On February 2, 2010, the Council for Education and Research on Toxics (“CERT”), a public interest group, issued a series of pre-litigation notices of intent to sue a number of companies, including the Company, which sell “ready to drink” coffee in California for allegedly failing to issue clear and reasonable warnings with regard to potential exposures to acrylamide in accordance with California Health and Safety Code section 25249.6 (“Proposition 65”). The Company was among a number of companies named in an action filed in California Superior Court, Los Angeles County, on August 7, 2010. On December 14, 2010, CERT served a new 60-day notice letter to the Company and other companies alleging additional violations of Proposition 65 arising from potential
acrylamide exposures from coffee sold at retail and brewed and consumed elsewhere. The Company intends to vigorously defend against these claims. As this matter is at a very early stage, at this time, the Company is not able to predict the probability of the outcome or estimate of loss, if any, related to this matter.
F-18
The Company may from time to time become involved in certain legal proceedings in the ordinary course of business. Currently, the Company is not a party to any other legal proceedings that management believes would have a material adverse effect on the financial position or results of operations of the Company.
|
14.
|
Segment Information
|
The Company operates in two reportable segments: retail and specialty. Retail store operations consist of sales of whole bean coffee, beverages, tea and related products through Company-operated retail stores. Specialty consists of whole bean coffee sales through three operating segments: grocery, home delivery, foodservice and office. In accordance with the aggregation criteria of ASC 280, these three operating segments have been aggregated into one reportable segment because, in the Company’s judgment, the specialty operating segments have similar historical economic characteristics and are expected to have similar economic characteristics and similar long-term financial performance in the future. The principal measures and factors we considered in determining
whether the economic characteristics are similar are gross margin percentage, operating profit margin, and competitive risks. In addition, each operating segment has similar products, similar production processes, similar methods of distribution and a similar regulatory environment. The Company believes that disaggregating its operating segments would not provide material additional information.
Management evaluates segment performance primarily based on revenue and segment operating income. The following table presents certain financial information for each segment. Segment income before taxes excludes unallocated marketing expenses and general and administrative expenses. Unallocated assets include cash, coffee inventory in the warehouse, corporate headquarter assets and intangible and other assets.
F-19
|
Retail
|
Specialty
|
Unallocated
|
Total
|
|||||||||||||||||||||||||
|
Percent
|
Percent
|
Percent
|
||||||||||||||||||||||||||
|
of Net
|
of Net
|
of Net
|
||||||||||||||||||||||||||
|
Amount
|
Revenue
|
Amount
|
Revenue
|
Amount
|
Amount
|
Revenue
|
||||||||||||||||||||||
|
2010
|
||||||||||||||||||||||||||||
|
Net revenue (b)
|
$ | 205,116 | 100.0 | % | $ | 128,692 | 100.0 | % | $ | 333,808 | 100.0 | % | ||||||||||||||||
|
Cost of sales and occupancy
|
88,622 | 43.2 | % | 66,270 | 51.5 | % | 154,892 | 46.4 | % | |||||||||||||||||||
|
Operating expenses
|
82,762 | 40.3 | % | 26,884 | 20.9 | % | 109,646 | 32.8 | % | |||||||||||||||||||
|
Litigation related expenses
|
(93 | ) | 0.0 | % | (93 | ) | 0.0 | % | ||||||||||||||||||||
|
Depreciation and amortization
|
11,216 | 5.5 | % | 1,746 | 1.4 | % | $ | 2,805 | 15,767 | 4.7 | % | |||||||||||||||||
|
Segment operating income
|
22,609 | 11.0 | % | 33,792 | 26.3 | % | (28,863 | ) (c) | 27,538 | 8.2 | % | |||||||||||||||||
|
Total assets
|
50,694 | 19,440 | 138,698 | (a) | 208,832 | |||||||||||||||||||||||
|
Capital expenditures
|
6,170 | 876 | 4,557 | 11,603 | ||||||||||||||||||||||||
|
2009
|
||||||||||||||||||||||||||||
|
Net revenue (b)
|
$ | 201,139 | 100.0 | % | $ | 110,131 | 100.0 | % | $ | 311,270 | 100.0 | % | ||||||||||||||||
|
Cost of sales and occupancy
|
87,843 | 43.7 | % | 54,933 | 49.9 | % | 142,776 | 45.9 | % | |||||||||||||||||||
|
Operating expenses
|
83,616 | 41.6 | % | 23,036 | 20.9 | % | 106,652 | 34.3 | % | |||||||||||||||||||
|
Litigation related expenses
|
2,957 | 1.5 | % | 2,957 | 0.9 | % | ||||||||||||||||||||||
|
Depreciation and amortization
|
11,267 | 5.6 | % | 1,758 | 1.6 | % | $ | 2,143 | 15,167 | 4.9 | % | |||||||||||||||||
|
Segment operating income
|
15,457 | 7.7 | % | 30,404 | 27.6 | % | (22,467 | ) (c) | 23,393 | 7.5 | % | |||||||||||||||||
|
Total assets (d)
|
58,578 | 20,682 | 125,543 | (a) | 204,803 | |||||||||||||||||||||||
|
Capital expenditures
|
6,874 | 1,128 | 6,503 | 14,505 | ||||||||||||||||||||||||
|
2008
|
||||||||||||||||||||||||||||
|
Net revenue (b)
|
$ | 187,719 | 100.0 | % | $ | 97,103 | 100.0 | % | $ | 284,822 | 100.0 | % | ||||||||||||||||
|
Cost of sales and occupancy
|
85,343 | 45.5 | % | 48,194 | 49.6 | % | 133,537 | 46.9 | % | |||||||||||||||||||
|
Operating expenses
|
79,587 | 42.4 | % | 19,257 | 19.8 | % | 98,844 | 34.7 | % | |||||||||||||||||||
|
Depreciation and amortization
|
9,970 | 5.3 | % | 1,411 | 1.5 | % | $ | 1,540 | 12,921 | 4.5 | % | |||||||||||||||||
|
Segment operating income
|
12,819 | 6.8 | % | 28,241 | 29.1 | % | (24,059 | ) | 17,001 | 6.0 | % | |||||||||||||||||
|
Total assets
|
59,393 | 18,242 | 98,717 | (a) | 176,352 | |||||||||||||||||||||||
|
Capital expenditures
|
13,423 | 2,272 | 10,235 | 25,930 | ||||||||||||||||||||||||
(a) Unallocated total assets includes cash and marketable securities of $44,629,000, $47,934,000 and $13,319,000 at the end of the years 2010, 2009 and 2008, respectively.
(b) There were no inter-segment revenues for the years 2010, 2009 and 2008, respectively.
(c) Unallocated segement operating income includes transaction related expenses/(income) of $1.0 million in 2010 and an $8.5 million break-up fee received for the termination of a definitive agreement for Peet's to acquire Diedrich, net of $4.3 million of external professional and legal fees incurred related to the transaction in 2009.
(d) The previously reported 2009 Retail Segment total assets incorrectly included $7.1 million of computer related equipment, which should have been included as Unallocated total assets. The 2009 amounts have been corrected accordingly.
Net revenue from the two product lines is as follows (in thousands):
|
2010
|
2009
|
2008
|
||||||||||
|
Whole bean coffee, tea and related products
|
$ | 186,403 | $ | 163,605 | $ | 151,059 | ||||||
|
Beverages and pastries
|
147,405 | 147,665 | 133,763 | |||||||||
|
Total
|
$ | 333,808 | $ | 311,270 | $ | 284,822 | ||||||
F-20
|
15.
|
Quarterly Financial Information (Unaudited, in thousands, except per share data)
|
|
Quarter Ended
|
||||||||||||||||
|
April 4,
|
July 4,
|
October 3,
|
January 2,
|
|||||||||||||
|
2010
|
2010
|
2010
|
2011
|
|||||||||||||
|
Net revenue
|
$ | 81,196 | $ | 80,776 | $ | 80,208 | $ | 91,628 | ||||||||
|
Cost of sales and related occupancy expenses
|
37,539 | 37,377 | 38,138 | 41,838 | ||||||||||||
|
Transaction related expenses/(income)
|
824 | 146 | - | - | ||||||||||||
|
Litigation related expenses
|
- | - | (93 | ) | - | |||||||||||
|
Income from operations
|
4,817 | 6,674 | 5,852 | 10,195 | ||||||||||||
|
Net income
|
3,051 | 4,255 | 3,763 | 6,432 | ||||||||||||
|
Basic income per share
|
0.23 | 0.32 | 0.29 | 0.50 | ||||||||||||
|
Diluted income per share
|
0.22 | 0.31 | 0.28 | 0.48 | ||||||||||||
|
Quarter Ended
|
||||||||||||||||
|
March 29,
|
June 28,
|
September 27,
|
January 3,
|
|||||||||||||
| 2009 | 2009 | 2009 | 2010 | |||||||||||||
|
Net revenue
|
$ | 72,104 | $ | 73,565 | $ | 73,905 | $ | 91,696 | ||||||||
|
Cost of sales and related occupancy expenses
|
32,568 | 32,953 | 34,291 | 42,964 | ||||||||||||
|
Transaction related expenses/(income)
|
- | - | 128 | (4,311 | ) | |||||||||||
|
Litigation related expenses
|
- | - | 146 | 2,811 | ||||||||||||
|
Income from operations
|
4,820 | 5,327 | 3,830 | 9,416 | ||||||||||||
|
Gain on sale of marketable securities
|
- | - | - | 7,305 | ||||||||||||
|
Net income
|
3,053 | 3,408 | 2,469 | 10,322 | ||||||||||||
|
Basic income per share
|
0.23 | 0.26 | 0.19 | 0.79 | ||||||||||||
|
Diluted income per share
|
0.23 | 0.26 | 0.19 | 0.76 | ||||||||||||
Transaction related expenses in the third and fourth quarter of 2010 consists of $1.0 million of professional and legal fees related to the Company’s response to a the subpoena it received from the FTC in connection with the FTC's anti-trust review of the acquisition of Diedrich Coffee by Green Mountain Coffee Roasters.
Litigation related expenses consists of costs incurred related to the pending settlement of a wage and hour class action lawsuit that was filed in July 2008 against the Company. See Note 13, “Commitments and Contingencies,” for further discussion.
Transaction income, net in the fourth quarter of 2009 consists of an $8.5 million break-up fee received for the termination of a definitive agreement for Peet’s to acquire Diedrich, net of $4.2 million of professional and legal fees incurred related to the transaction. Legal fees of $128,000 were incurred in the third quarter of 2009.
During the fourth quarter of 2009, the Company recorded a gain on the sale of stock that we acquired in Diedrich within the year.
F-21