Attached files
| file | filename |
|---|---|
| 8-K - FORM 8-K - MEDCO HEALTH SOLUTIONS INC | c14248e8vk.htm |
Exhibit 99.1

| Barclays Capital 2011 Global Health Care Conference March 17, 2011 David B. Snow, Jr. Chairman and CEO |

| Forward-Looking Statement 2 This presentation contains "forward-looking statements" as that term is defined in the Private Securities Litigation Reform Act of 1995. These statements involve risks and uncertainties that may cause results to differ materially from those set forth in the statements. No forward-looking statement can be guaranteed, and actual results may differ materially from those projected. We undertake no obligation to publicly update any forward-looking statement, whether as a result of new information, future events or otherwise. The forward-looking statements are not historical facts, but rather are based on current expectations, estimates, assumptions and projections about the business and future financial results of the pharmacy benefit management ("PBM") and specialty pharmacy industries, and other legal, regulatory and economic developments. We use words such as "anticipates," "believes," "plans," "expects," "projects," "future," "intends," "may," "will," "should," "could," "estimates," "predicts," "potential," "continue," "guidance" and similar expressions to identify these forward-looking statements. Forward-looking statements in this presentation includes, without limitation, the financial and operational information reflected in Medco's guidance for 2010 and 2011 as well as Medco's estimates for the years 2012 and beyond, which estimates do not constitute guidance or projections and should not be relied on as an estimate or forecast of future performance. Medco's actual results could differ materially from the results contemplated by these forward-looking statements due to a number of factors. Forward-looking statements in this presentation should be evaluated together with the risks and uncertainties that affect our business, particularly those mentioned in the Risk Factors section of the Company's Annual Report on Form 10-K, Quarterly Reports on Form 10-Q and other documents filed from time to time with the Securities and Exchange Commission. The copyrights for the contents of this discussion and the written materials used in this presentation are owned by Medco Health Solutions, Inc., 2010. This presentation contains "forward-looking statements" as that term is defined in the Private Securities Litigation Reform Act of 1995. These statements involve risks and uncertainties that may cause results to differ materially from those set forth in the statements. No forward-looking statement can be guaranteed, and actual results may differ materially from those projected. We undertake no obligation to publicly update any forward-looking statement, whether as a result of new information, future events or otherwise. The forward-looking statements are not historical facts, but rather are based on current expectations, estimates, assumptions and projections about the business and future financial results of the pharmacy benefit management ("PBM") and specialty pharmacy industries, and other legal, regulatory and economic developments. We use words such as "anticipates," "believes," "plans," "expects," "projects," "future," "intends," "may," "will," "should," "could," "estimates," "predicts," "potential," "continue," "guidance" and similar expressions to identify these forward- looking statements. Forward-looking statements in this presentation includes, without limitation, the financial and operational information reflected in Medco's guidance for 2010 and 2011 as well as Medco's estimates for the years 2012 and beyond, which estimates do not constitute guidance or projections and should not be relied on as an estimate or forecast of future performance. Medco's actual results could differ materially from the results contemplated by these forward-looking statements due to a number of factors. Forward-looking statements in this presentation should be evaluated together with the risks and uncertainties that affect our business, particularly those mentioned in the Risk Factors section of the Company's Annual Report on Form 10-K, Quarterly Reports on Form 10-Q and other documents filed from time to time with the Securities and Exchange Commission. The copyrights for the contents of this discussion and the written materials used in this presentation are owned by Medco Health Solutions, Inc., 2011. |
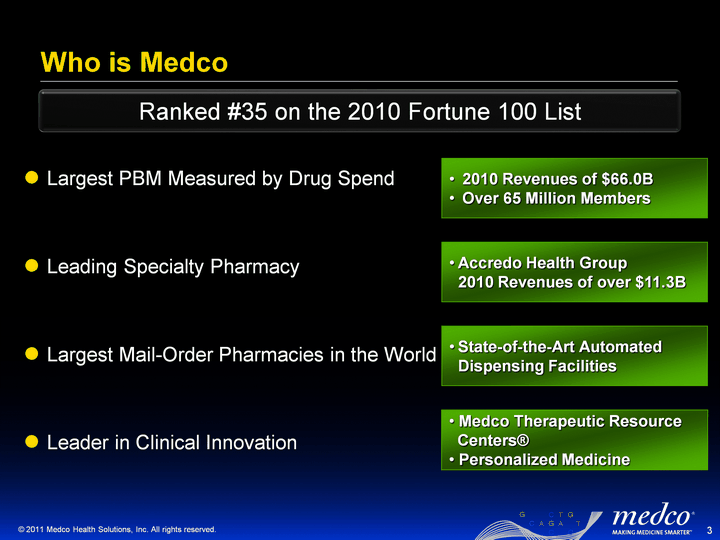
| Who is Medco 3 Largest PBM Measured by Drug Spend Leading Specialty Pharmacy Largest Mail-Order Pharmacies in the World Leader in Clinical Innovation 2010 Revenues of $66.0B Over 65 Million Members Accredo Health Group 2010 Revenues of over $11.3B State-of-the-Art Automated Dispensing Facilities Medco Therapeutic Resource Centers(r) Personalized Medicine Ranked #35 on the 2010 Fortune 100 List |
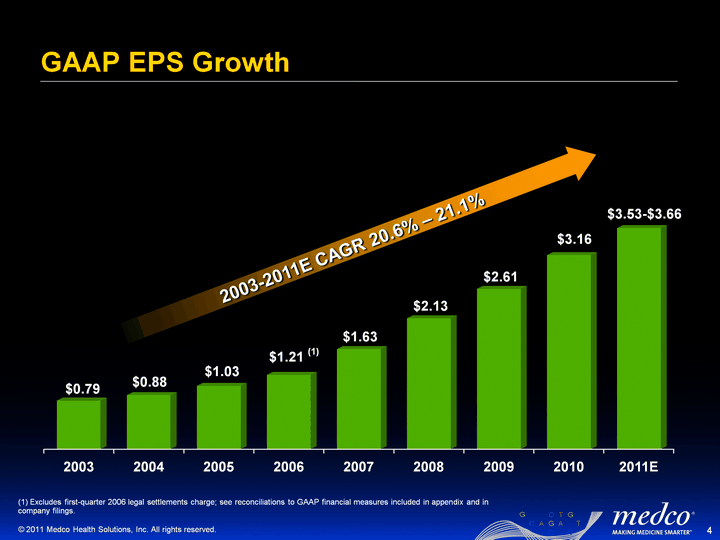
| GAAP EPS Growth 4 (1) Excludes first-quarter 2006 legal settlements charge; see reconciliations to GAAP financial measures included in appendix and in company filings. (CHART) 2003-2011E CAGR 20.6% - 21.1% |
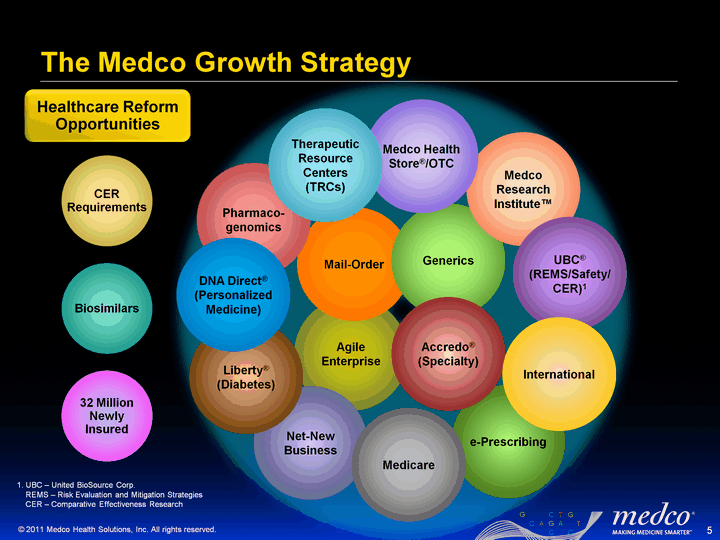
| e-Prescribing Agile Enterprise Mail-Order Generics Accredo(r) (Specialty) Net-New Business Medicare Liberty(r) (Diabetes) Medco Research Institute(tm) Medco Health Store(r)/OTC UBC(r) (REMS/Safety/ CER)1 Pharmaco- genomics DNA Direct(r) (Personalized Medicine) Therapeutic Resource Centers (TRCs) CER Requirements Biosimilars 32 Million Newly Insured The Medco Growth Strategy 5 Healthcare Reform Opportunities International 1. UBC - United BioSource Corp. REMS - Risk Evaluation and Mitigation Strategies CER - Comparative Effectiveness Research |
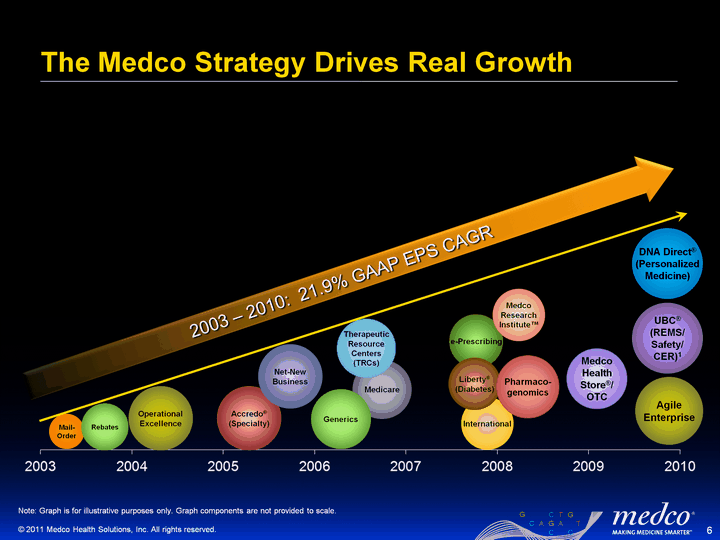
| The Medco Strategy Drives Real Growth 6 Note: Graph is for illustrative purposes only. Graph components are not provided to scale. Accredo(r) (Specialty) Medicare Therapeutic Resource Centers (TRCs) Net-New Business International e-Prescribing Liberty(r) (Diabetes) Mail- Order Rebates Operational Excellence DNA Direct(r) (Personalized Medicine) Pharmaco- genomics Medco Research Institute(tm) Medco Health Store(r)/ OTC Agile Enterprise UBC(r) (REMS/ Safety/ CER)1 Generics 2003 - 2010: 21.9% GAAP EPS CAGR |

| The Medco Growth Strategy 7 Note: Graph is for illustrative purposes only. Graph components are not provided to scale. This information does not constitute guidance or projections, and you should not rely on it as an estimate or forecast of future performance. See slide entitled "Forward-Looking Statements" presented today. Accredo(r) (Specialty) Medicare Therapeutic Resource Centers (TRCs) Net-New Business International e-Prescribing Liberty(r) (Diabetes) Mail- Order Rebates Operational Excellence DNA Direct(r) (Personalized Medicine) Pharmaco- genomics Medco Research Institute(tm) Agile Enterprise UBC(r) (REMS/ Safety/ CER)1 Generics Medco Health Store(r)/ OTC |
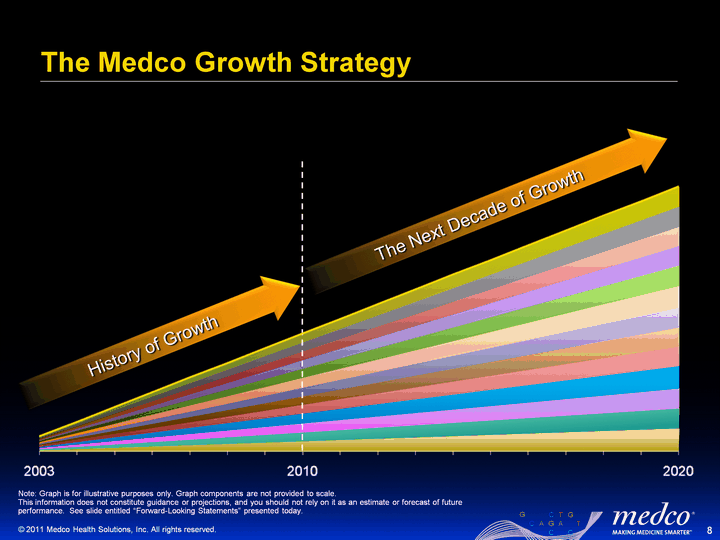
| The Medco Growth Strategy 8 Note: Graph is for illustrative purposes only. Graph components are not provided to scale. This information does not constitute guidance or projections, and you should not rely on it as an estimate or forecast of future performance. See slide entitled "Forward-Looking Statements" presented today. The Next Decade of Growth History of Growth |
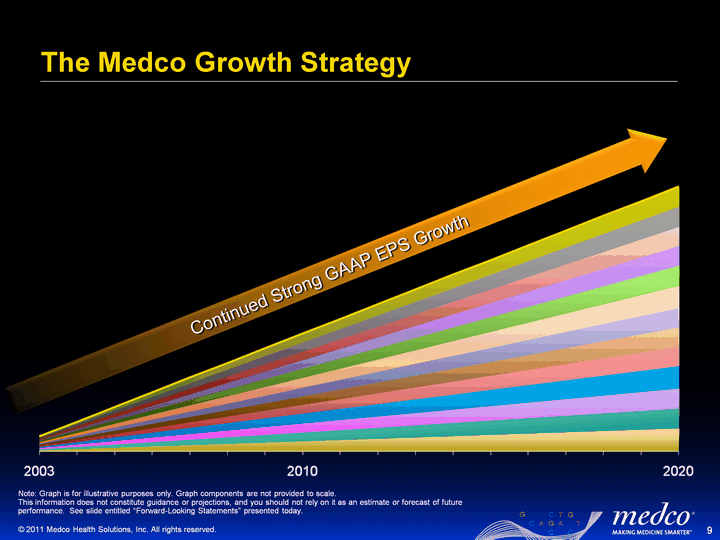
| The Medco Growth Strategy 9 Note: Graph is for illustrative purposes only. Graph components are not provided to scale. This information does not constitute guidance or projections, and you should not rely on it as an estimate or forecast of future performance. See slide entitled "Forward-Looking Statements" presented today. Continued Strong GAAP EPS Growth |

| New Business and Client Retention 10 *As of Fourth-Quarter 2010 Earnings Call on February 22, 2011 Annualized New-Named Sales 2008/2009 Net-New Sales 2010 >$17.2B $5.3B $1.7B 2011* >$13.4B $5.3B $1.5B 2010 and 2011 client retention rates stand at over 99% Completed over 80% of 2011 scheduled and early elective client renewals* 2012 renewals expected in the range of $16 billion to $17 billion -- ~25% of Medco's book of business* |
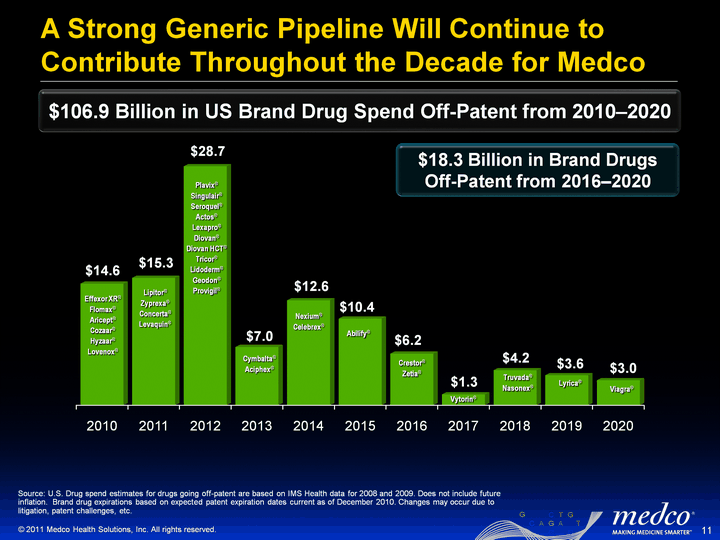
| (CHART) A Strong Generic Pipeline Will Continue to Contribute Throughout the Decade for Medco 11 Source: U.S. Drug spend estimates for drugs going off-patent are based on IMS Health data for 2008 and 2009. Does not include future inflation. Brand drug expirations based on expected patent expiration dates current as of December 2010. Changes may occur due to litigation, patent challenges, etc. $18.3 Billion in Brand Drugs Off-Patent from 2016-2020 $106.9 Billion in US Brand Drug Spend Off-Patent from 2010-2020 Crestor(r) Zetia(r) Effexor XR(r) Flomax(r) Aricept(r) Cozaar(r) Hyzaar(r) Lovenox(r) Lipitor(r) Zyprexa(r) Concerta(r) Levaquin(r) Plavix(r) Singulair(r) Seroquel(r) Actos(r) Lexapro(r) Diovan(r) Diovan HCT(r) Tricor(r) Lidoderm(r) Geodon(r) Provigil(r) Cymbalta(r) Aciphex(r) Nexium(r) Celebrex(r) Abilify(r) Vytorin(r) Viagra(r) Truvada(r) Nasonex(r) Lyrica(r) $14.6 $6.2 $15.3 $28.7 $7.0 $12.6 $10.4 $1.3 $4.2 $3.6 $3.0 |
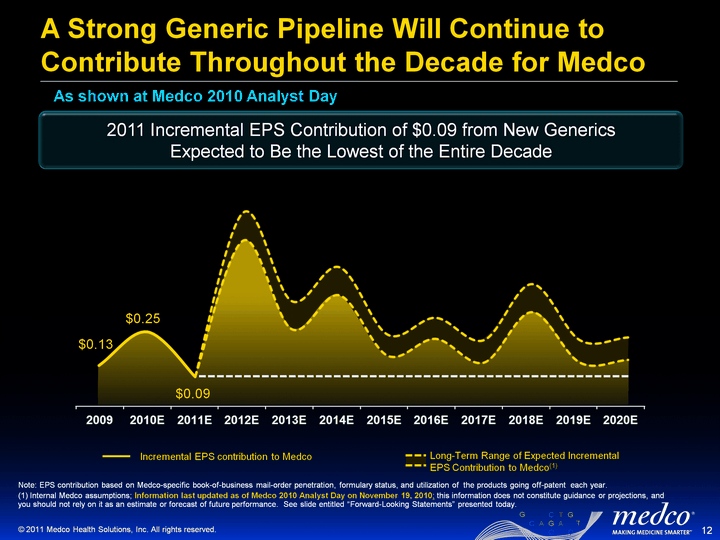
| A Strong Generic Pipeline Will Continue to Contribute Throughout the Decade for Medco 12 Note: EPS contribution based on Medco-specific book-of-business mail-order penetration, formulary status, and utilization of the products going off-patent each year. (1) Internal Medco assumptions; Information last updated as of Medco 2010 Analyst Day on November 19, 2010; this information does not constitute guidance or projections, and you should not rely on it as an estimate or forecast of future performance. See slide entitled "Forward-Looking Statements" presented today. Incremental EPS contribution to Medco Long-Term Range of Expected Incremental EPS Contribution to Medco(1) 2011 Incremental EPS Contribution of $0.09 from New Generics Expected to Be the Lowest of the Entire Decade $0.13 $0.25 $0.09 As shown at Medco 2010 Analyst Day |
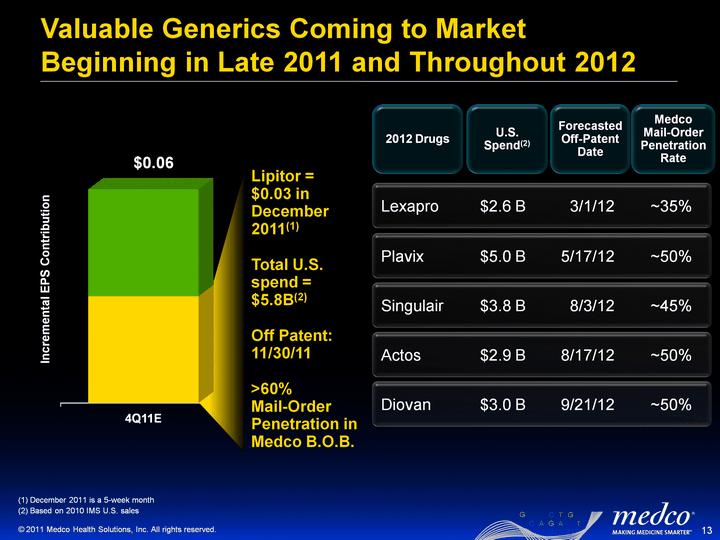
| (CHART) Valuable Generics Coming to Market Beginning in Late 2011 and Throughout 2012 13 $0.06 Plavix $5.0 B 5/17/12 ~50% Actos $2.9 B 8/17/12 ~50% Singulair $3.8 B 8/3/12 ~45% Lexapro $2.6 B 3/1/12 ~35% Diovan $3.0 B 9/21/12 ~50% Incremental EPS Contribution (1) December 2011 is a 5-week month (2) Based on 2010 IMS U.S. sales 2012 Drugs Forecasted Off-Patent Date Medco Mail-Order Penetration Rate U.S. Spend(2) (CHART) Lipitor = $0.03 in December 2011(1) Total U.S. spend = $5.8B(2) Off Patent: 11/30/11 >60% Mail-Order Penetration in Medco B.O.B. (CHART) |
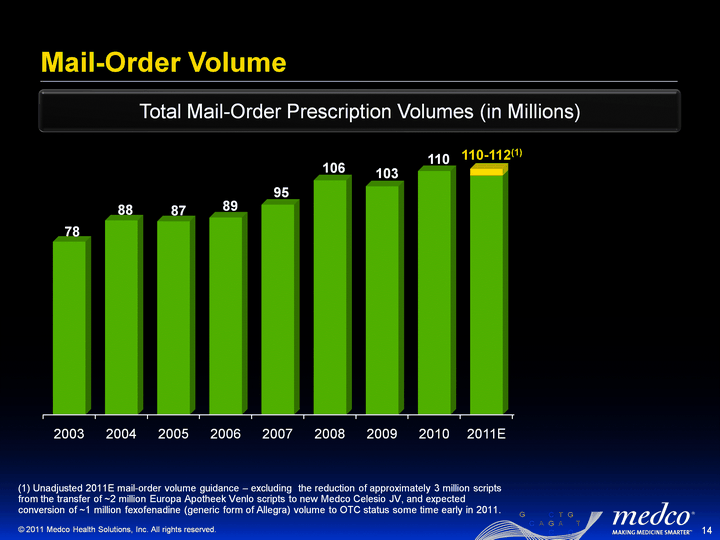
| (CHART) Mail-Order Volume 14 (1) Unadjusted 2011E mail-order volume guidance - excluding the reduction of approximately 3 million scripts from the transfer of ~2 million Europa Apotheek Venlo scripts to new Medco Celesio JV, and expected conversion of ~1 million fexofenadine (generic form of Allegra) volume to OTC status some time early in 2011. Total Mail-Order Prescription Volumes (in Millions) 78 88 87 89 95 106 103 110 110-112(1) |

| (CHART) Mail-Order Volume 15 (1) Unadjusted 2011E mail-order volume guidance - excluding the reduction of approximately 3 million scripts from the transfer of ~2 million Europa Apotheek Venlo scripts to new Medco Celesio JV, and expected conversion of ~1 million fexofenadine (generic form of Allegra) volume to OTC status some time early in 2011. Total Mail-Order Prescription Volumes (in Millions) 78 88 87 89 95 106 103 110 Mail-Order Generic Prescription Volumes Mail-Order Brand Prescription Volumes 110-112(1) |

| Specialty Pharmacy is an Important Growth Engine 16 ($ in Billions) ($ in Millions) 2006 2007 2008 2009 2010 2011E Acute Chronic/Complex 5437 6043 7974.2 9527.5 11349.3 13000 2006 2007 2008 2009 2010 2011E 189 210 281.2 357.1 438.2 500 $5.4 $9.5 $8.0 $6.0 $189 $281 $357 $210 $11.3 $438 ~$13.0 ~$500 CAGR ~19% CAGR ~21% Accredo Net Revenue Accredo Operating Income |
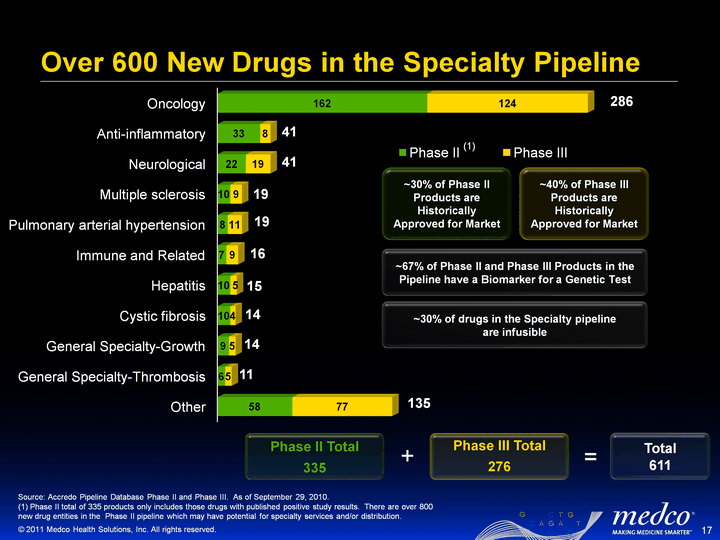
| Over 600 New Drugs in the Specialty Pipeline 17 17 286 41 41 19 19 16 15 14 14 11 135 Phase II Total 335 Phase III Total 276 Total 611 Source: Accredo Pipeline Database Phase II and Phase III. As of September 29, 2010. (1) Phase II total of 335 products only includes those drugs with published positive study results. There are over 800 new drug entities in the Phase II pipeline which may have potential for specialty services and/or distribution. ~40% of Phase III Products are Historically Approved for Market ~30% of Phase II Products are Historically Approved for Market ~67% of Phase II and Phase III Products in the Pipeline have a Biomarker for a Genetic Test + = (1) ~30% of drugs in the Specialty pipeline are infusible |
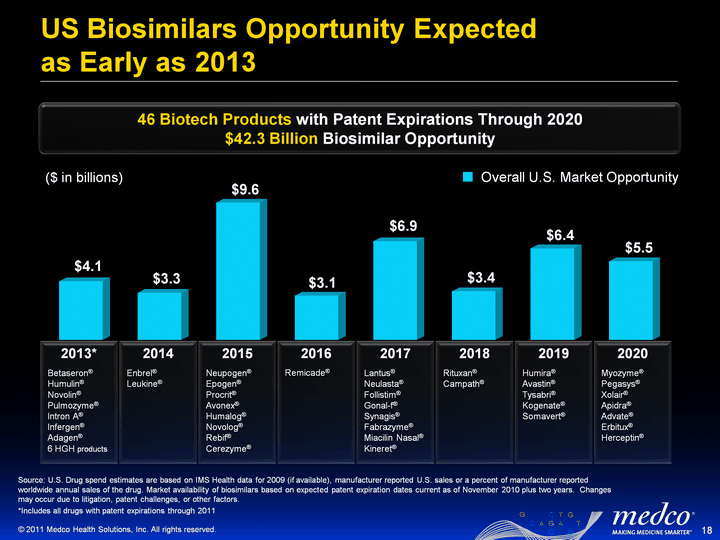
| 2013* Betaseron(r) Humulin(r) Novolin(r) Pulmozyme(r) Intron A(r) Infergen(r) Adagen(r) 6 HGH products US Biosimilars Opportunity Expected as Early as 2013 18 Source: U.S. Drug spend estimates are based on IMS Health data for 2009 (if available), manufacturer reported U.S. sales or a percent of manufacturer reported worldwide annual sales of the drug. Market availability of biosimilars based on expected patent expiration dates current as of November 2010 plus two years. Changes may occur due to litigation, patent challenges, or other factors. *Includes all drugs with patent expirations through 2011 (CHART) Overall U.S. Market Opportunity ($ in billions) 46 Biotech Products with Patent Expirations Through 2020 $42.3 Billion Biosimilar Opportunity 2014 Enbrel(r) Leukine(r) 2015 Neupogen(r) Epogen(r) Procrit(r) Avonex(r) Humalog(r) Novolog(r) Rebif(r) Cerezyme(r) 2016 Remicade(r) 2017 Lantus(r) Neulasta(r) Follistim(r) Gonal-f(r) Synagis(r) Fabrazyme(r) Miacilin Nasal(r) Kineret(r) 2018 Rituxan(r) Campath(r) 2019 Humira(r) Avastin(r) Tysabri(r) Kogenate(r) Somavert(r) 2020 Myozyme(r) Pegasys(r) Xolair(r) Apidra(r) Advate(r) Erbitux(r) Herceptin(r) |
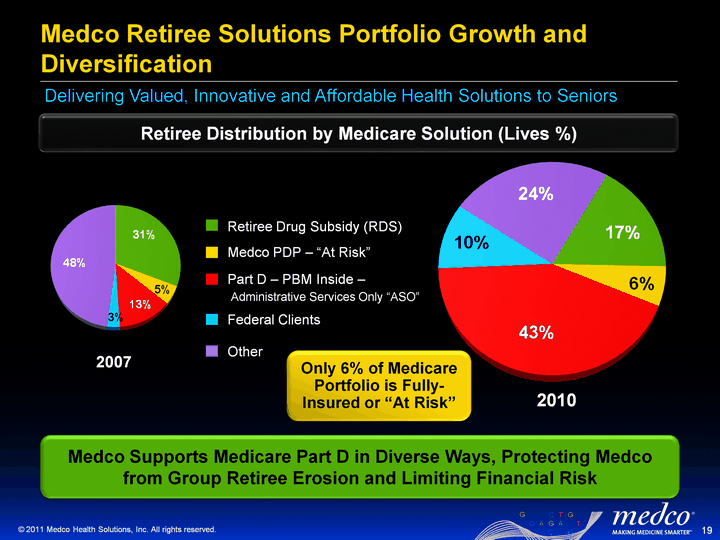
| Medco Supports Medicare Part D in Diverse Ways, Protecting Medco from Group Retiree Erosion and Limiting Financial Risk Medco Retiree Solutions Portfolio Growth and Diversification 19 2007 2010 Retiree Drug Subsidy (RDS) Federal Clients Part D - PBM Inside - Administrative Services Only "ASO" Medco PDP - "At Risk" Other Retiree Distribution by Medicare Solution (Lives %) Delivering Valued, Innovative and Affordable Health Solutions to Seniors Only 6% of Medicare Portfolio is Fully- Insured or "At Risk" |
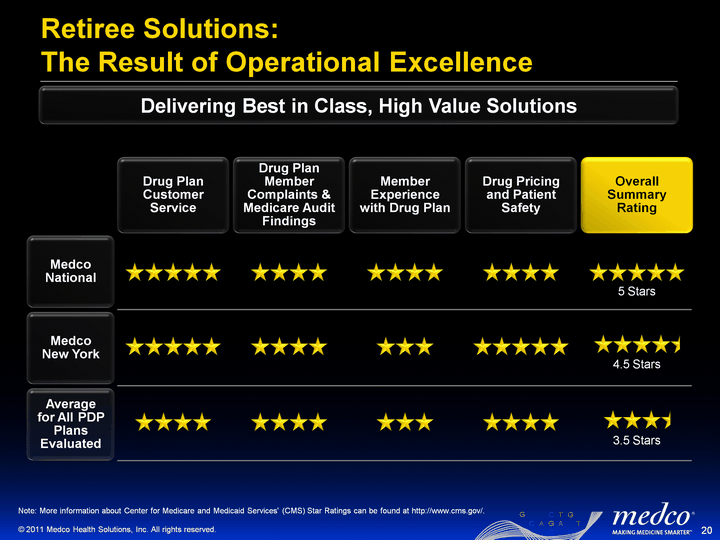
| Retiree Solutions: The Result of Operational Excellence 20 Delivering Best in Class, High Value Solutions Drug Plan Customer Service Drug Plan Member Complaints & Medicare Audit Findings Member Experience with Drug Plan Drug Pricing and Patient Safety Overall Summary Rating Medco National Medco New York 4.5 Stars Average for All PDP Plans Evaluated 3.5 Stars 5 Stars Note: More information about Center for Medicare and Medicaid Services' (CMS) Star Ratings can be found at http://www.cms.gov/. |
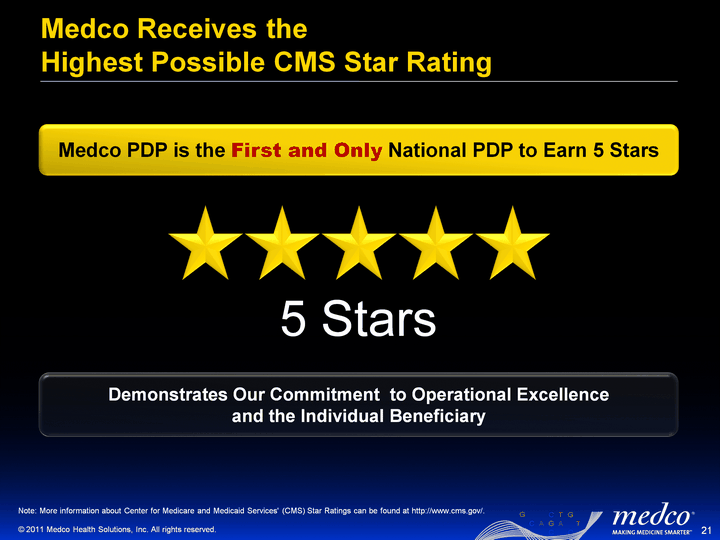
| Medco Receives the Highest Possible CMS Star Rating 21 5 Stars Demonstrates Our Commitment to Operational Excellence and the Individual Beneficiary Medco PDP is the First and Only National PDP to Earn 5 Stars Note: More information about Center for Medicare and Medicaid Services' (CMS) Star Ratings can be found at http://www.cms.gov/. |
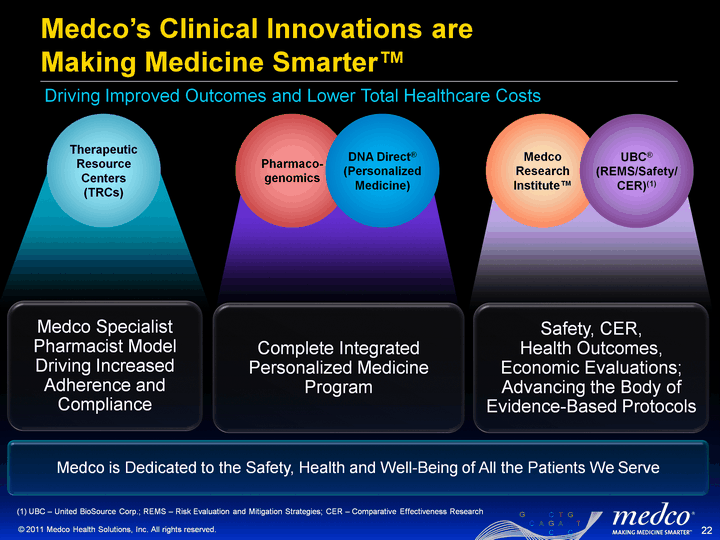
| Medco's Clinical Innovations are Making Medicine Smarter(tm) 22 Driving Improved Outcomes and Lower Total Healthcare Costs Therapeutic Resource Centers (TRCs) Pharmaco- genomics DNA Direct(r) (Personalized Medicine) Medco Specialist Pharmacist Model Driving Increased Adherence and Compliance Complete Integrated Personalized Medicine Program Safety, CER, Health Outcomes, Economic Evaluations; Advancing the Body of Evidence-Based Protocols Medco Research Institute(tm) UBC(r) (REMS/Safety/ CER)(1) Medco is Dedicated to the Safety, Health and Well-Being of All the Patients We Serve (1) UBC - United BioSource Corp.; REMS - Risk Evaluation and Mitigation Strategies; CER - Comparative Effectiveness Research |
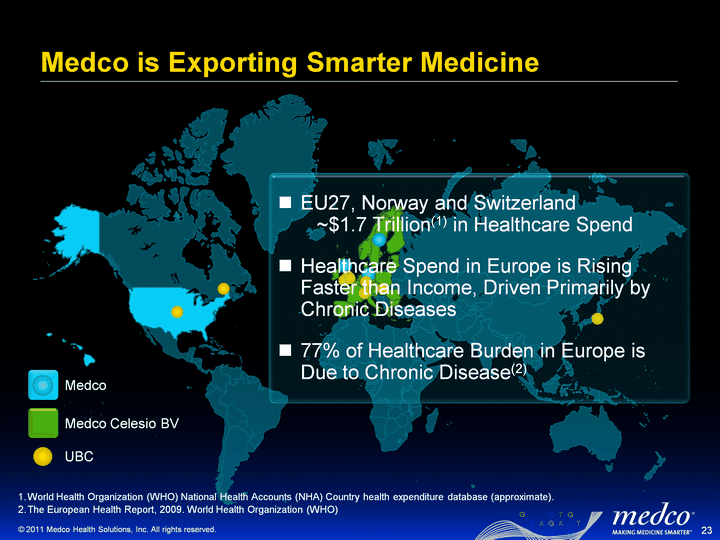
| Medco is Exporting Smarter Medicine 23 1. World Health Organization (WHO) National Health Accounts (NHA) Country health expenditure database (approximate). 2. The European Health Report, 2009. World Health Organization (WHO) Medco Celesio BV Medco UBC EU27, Norway and Switzerland ~$1.7 Trillion(1) in Healthcare Spend Healthcare Spend in Europe is Rising Faster than Income, Driven Primarily by Chronic Diseases 77% of Healthcare Burden in Europe is Due to Chronic Disease(2) |

| Medco Drives Safety and Economic Effectiveness - in the U.S. and Abroad Dorval, Quebec 17 Locations Across USA Geneva, Switzerland Goring-on-Thames, UK Horsham, UK London, UK (2) Lorrach, Germany Prague, Czech Republic Tokyo, Japan 24 USA, Canada, Switzerland, UK, Germany, Japan, Czech Republic World-Wide Post- Approval Research: ~$16 B Market (1) ~15% Industry Growth Rate(1) ~40% Industry Average Gross Margin(1) UBC/Medco analysis ~20% UBC Historical Growth Rate(1) |
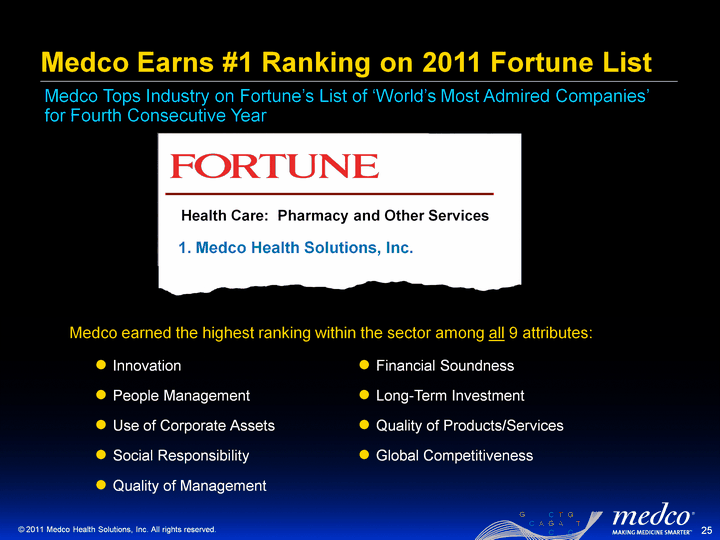
| Medco Earns #1 Ranking on 2011 Fortune List 25 Medco Tops Industry on Fortune's List of 'World's Most Admired Companies' for Fourth Consecutive Year Health Care: Pharmacy and Other Services 1. Medco Health Solutions, Inc. Innovation People Management Use of Corporate Assets Social Responsibility Quality of Management Financial Soundness Long-Term Investment Quality of Products/Services Global Competitiveness Medco earned the highest ranking within the sector among all 9 attributes: |
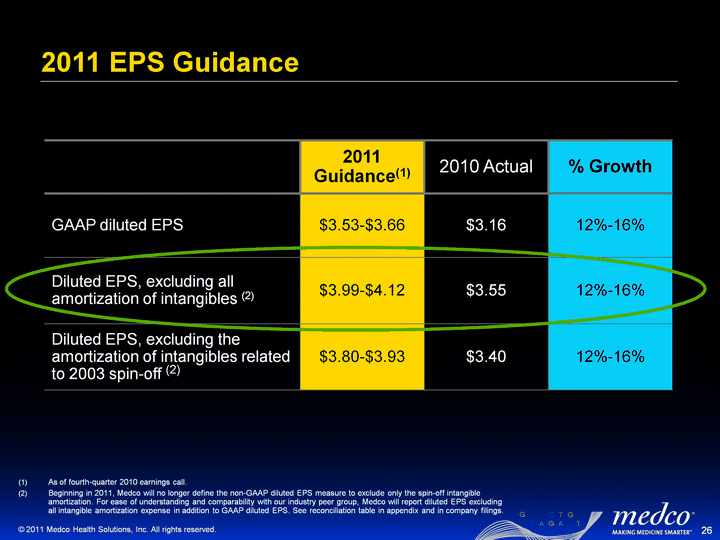
| 2011 EPS Guidance 26 2011 Guidance(1) 2010 Actual % Growth GAAP diluted EPS $3.53-$3.66 $3.16 12%-16% Diluted EPS, excluding all amortization of intangibles (2) $3.99-$4.12 $3.55 12%-16% Diluted EPS, excluding the amortization of intangibles related to 2003 spin-off (2) $3.80-$3.93 $3.40 12%-16% As of fourth-quarter 2010 earnings call. Beginning in 2011, Medco will no longer define the non-GAAP diluted EPS measure to exclude only the spin-off intangible amortization. For ease of understanding and comparability with our industry peer group, Medco will report diluted EPS excluding all intangible amortization expense in addition to GAAP diluted EPS. See reconciliation table in appendix and in company filings. |
| Appendix 27 |
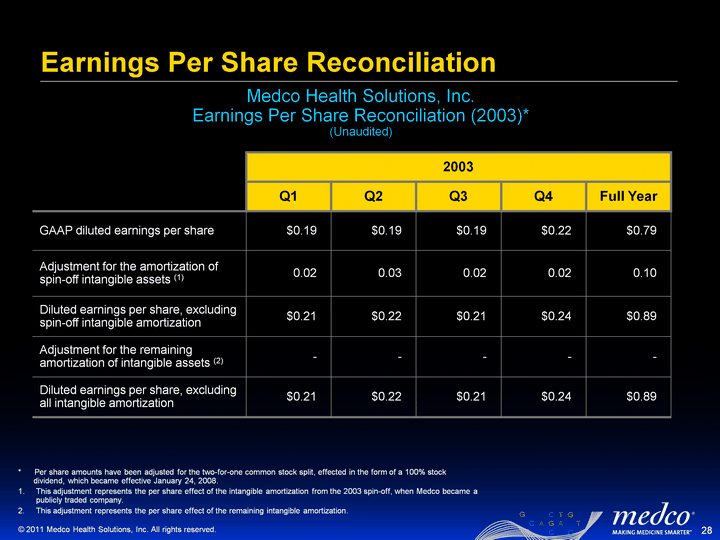
| Earnings Per Share Reconciliation 28 Medco Health Solutions, Inc. Earnings Per Share Reconciliation (2003)* (Unaudited) * Per share amounts have been adjusted for the two-for-one common stock split, effected in the form of a 100% stock dividend, which became effective January 24, 2008. This adjustment represents the per share effect of the intangible amortization from the 2003 spin-off, when Medco became a publicly traded company. This adjustment represents the per share effect of the remaining intangible amortization. 2003 2003 2003 2003 2003 Q1 Q2 Q3 Q4 Full Year GAAP diluted earnings per share $0.19 $0.19 $0.19 $0.22 $0.79 Adjustment for the amortization of spin-off intangible assets (1) 0.02 0.03 0.02 0.02 0.10 Diluted earnings per share, excluding spin-off intangible amortization $0.21 $0.22 $0.21 $0.24 $0.89 Adjustment for the remaining amortization of intangible assets (2) - - - - - Diluted earnings per share, excluding all intangible amortization $0.21 $0.22 $0.21 $0.24 $0.89 |
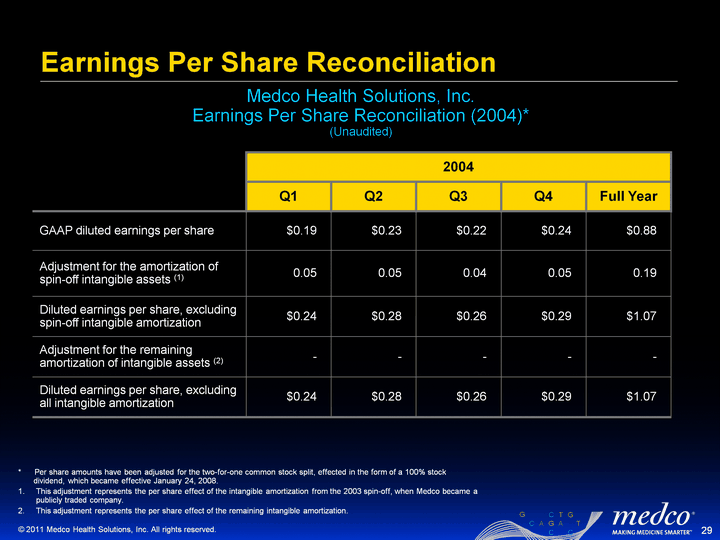
| Earnings Per Share Reconciliation 29 Medco Health Solutions, Inc. Earnings Per Share Reconciliation (2004)* (Unaudited) * Per share amounts have been adjusted for the two-for-one common stock split, effected in the form of a 100% stock dividend, which became effective January 24, 2008. This adjustment represents the per share effect of the intangible amortization from the 2003 spin-off, when Medco became a publicly traded company. This adjustment represents the per share effect of the remaining intangible amortization. 2004 2004 2004 2004 2004 Q1 Q2 Q3 Q4 Full Year GAAP diluted earnings per share $0.19 $0.23 $0.22 $0.24 $0.88 Adjustment for the amortization of spin-off intangible assets (1) 0.05 0.05 0.04 0.05 0.19 Diluted earnings per share, excluding spin-off intangible amortization $0.24 $0.28 $0.26 $0.29 $1.07 Adjustment for the remaining amortization of intangible assets (2) - - - - - Diluted earnings per share, excluding all intangible amortization $0.24 $0.28 $0.26 $0.29 $1.07 |

| Earnings Per Share Reconciliation 30 Medco Health Solutions, Inc. Earnings Per Share Reconciliation (2005)* (Unaudited) * Per share amounts have been adjusted for the two-for-one common stock split, effected in the form of a 100% stock dividend, which became effective January 24, 2008. This adjustment represents the per share effect of the intangible amortization from the 2003 spin-off, when Medco became a publicly traded company. This adjustment represents the per share effect of the remaining intangible amortization. 2005 2005 2005 2005 2005 Q1 Q2 Q3 Q4 Full Year GAAP diluted earnings per share $0.23 $0.24 $0.26 $0.28 $1.03 Adjustment for the amortization of spin-off intangible assets (1) 0.05 0.05 0.05 0.05 0.18 Diluted earnings per share, excluding spin-off intangible amortization $0.28 $0.29 $0.31 $0.33 $1.21 Adjustment for the remaining amortization of intangible assets (2) - - - 0.01 0.01 Diluted earnings per share, excluding all intangible amortization $0.28 $0.29 $0.31 $0.34 $1.22 |
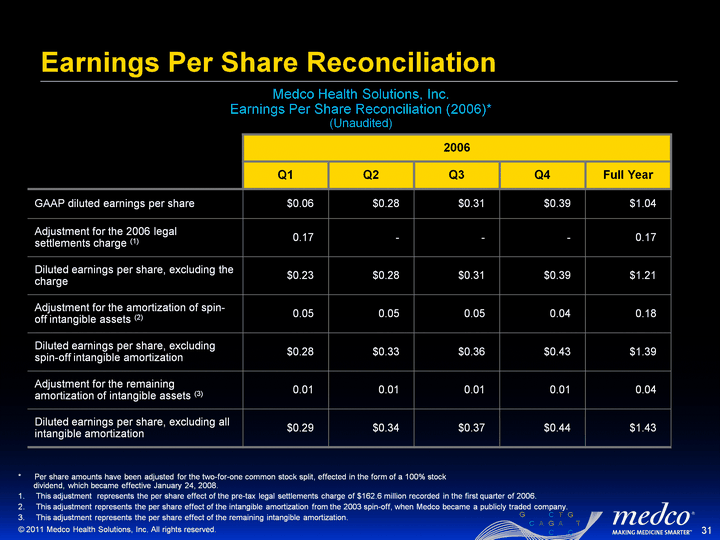
| Earnings Per Share Reconciliation 31 Medco Health Solutions, Inc. Earnings Per Share Reconciliation (2006)* (Unaudited) * Per share amounts have been adjusted for the two-for-one common stock split, effected in the form of a 100% stock dividend, which became effective January 24, 2008. This adjustment represents the per share effect of the pre-tax legal settlements charge of $162.6 million recorded in the first quarter of 2006. This adjustment represents the per share effect of the intangible amortization from the 2003 spin-off, when Medco became a publicly traded company. This adjustment represents the per share effect of the remaining intangible amortization. 2006 2006 2006 2006 2006 Q1 Q2 Q3 Q4 Full Year GAAP diluted earnings per share $0.06 $0.28 $0.31 $0.39 $1.04 Adjustment for the 2006 legal settlements charge (1) 0.17 - - - 0.17 Diluted earnings per share, excluding the charge $0.23 $0.28 $0.31 $0.39 $1.21 Adjustment for the amortization of spin-off intangible assets (2) 0.05 0.05 0.05 0.04 0.18 Diluted earnings per share, excluding spin-off intangible amortization $0.28 $0.33 $0.36 $0.43 $1.39 Adjustment for the remaining amortization of intangible assets (3) 0.01 0.01 0.01 0.01 0.04 Diluted earnings per share, excluding all intangible amortization $0.29 $0.34 $0.37 $0.44 $1.43 |
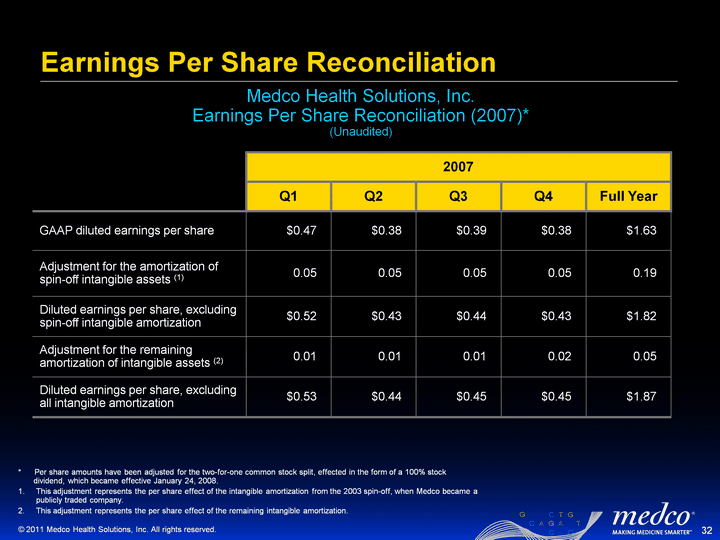
| Earnings Per Share Reconciliation 32 Medco Health Solutions, Inc. Earnings Per Share Reconciliation (2007)* (Unaudited) * Per share amounts have been adjusted for the two-for-one common stock split, effected in the form of a 100% stock dividend, which became effective January 24, 2008. This adjustment represents the per share effect of the intangible amortization from the 2003 spin-off, when Medco became a publicly traded company. This adjustment represents the per share effect of the remaining intangible amortization. 2007 2007 2007 2007 2007 Q1 Q2 Q3 Q4 Full Year GAAP diluted earnings per share $0.47 $0.38 $0.39 $0.38 $1.63 Adjustment for the amortization of spin-off intangible assets (1) 0.05 0.05 0.05 0.05 0.19 Diluted earnings per share, excluding spin-off intangible amortization $0.52 $0.43 $0.44 $0.43 $1.82 Adjustment for the remaining amortization of intangible assets (2) 0.01 0.01 0.01 0.02 0.05 Diluted earnings per share, excluding all intangible amortization $0.53 $0.44 $0.45 $0.45 $1.87 |
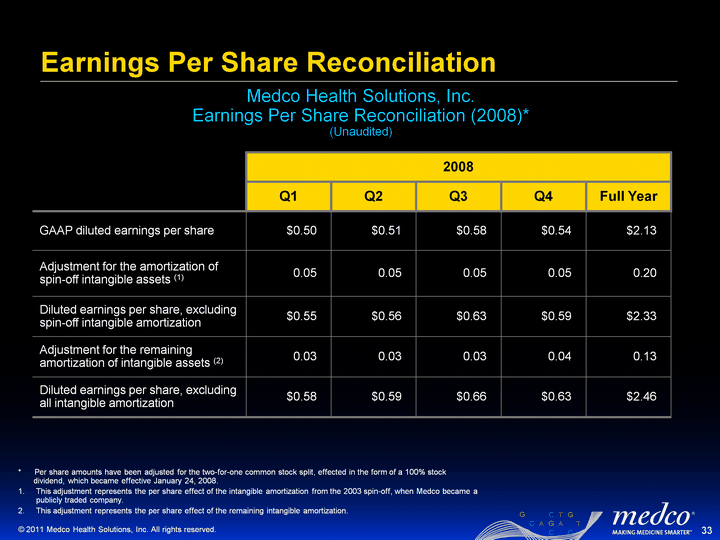
| Earnings Per Share Reconciliation 33 Medco Health Solutions, Inc. Earnings Per Share Reconciliation (2008)* (Unaudited) * Per share amounts have been adjusted for the two-for-one common stock split, effected in the form of a 100% stock dividend, which became effective January 24, 2008. This adjustment represents the per share effect of the intangible amortization from the 2003 spin-off, when Medco became a publicly traded company. This adjustment represents the per share effect of the remaining intangible amortization. 2008 2008 2008 2008 2008 Q1 Q2 Q3 Q4 Full Year GAAP diluted earnings per share $0.50 $0.51 $0.58 $0.54 $2.13 Adjustment for the amortization of spin-off intangible assets (1) 0.05 0.05 0.05 0.05 0.20 Diluted earnings per share, excluding spin-off intangible amortization $0.55 $0.56 $0.63 $0.59 $2.33 Adjustment for the remaining amortization of intangible assets (2) 0.03 0.03 0.03 0.04 0.13 Diluted earnings per share, excluding all intangible amortization $0.58 $0.59 $0.66 $0.63 $2.46 |

| Earnings Per Share Reconciliation 34 Medco Health Solutions, Inc. Earnings Per Share Reconciliation (2009) (Unaudited) This adjustment represents the per share effect of the intangible amortization from the 2003 spin-off, when Medco became a publicly traded company. This adjustment represents the per share effect of the remaining intangible amortization. 2009 2009 2009 2009 2009 Q1 Q2 Q3 Q4 Full Year GAAP diluted earnings per share $0.58 $0.64 $0.69 $0.70 $2.61 Adjustment for the amortization of spin-off intangible assets (1) 0.05 0.05 0.06 0.06 0.22 Diluted earnings per share, excluding spin-off intangible amortization $0.63 $0.69 $0.75 $0.76 $2.83 Adjustment for the remaining amortization of intangible assets (2) 0.04 0.04 0.04 0.03 0.15 Diluted earnings per share, excluding all intangible amortization $0.67 $0.73 $0.79 $0.79 $2.98 |
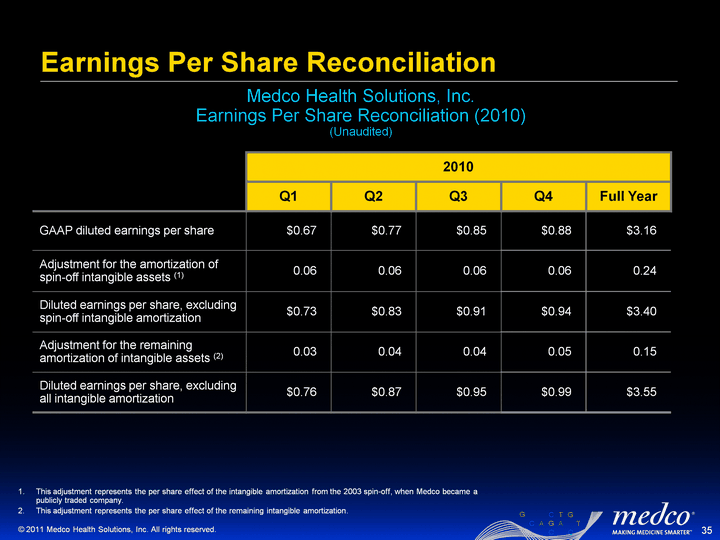
| Earnings Per Share Reconciliation 35 Medco Health Solutions, Inc. Earnings Per Share Reconciliation (2010) (Unaudited) This adjustment represents the per share effect of the intangible amortization from the 2003 spin-off, when Medco became a publicly traded company. This adjustment represents the per share effect of the remaining intangible amortization. 2010 2010 2010 2010 2010 Q1 Q2 Q3 Q4 Full Year GAAP diluted earnings per share $0.67 $0.77 $0.85 $0.88 $3.16 Adjustment for the amortization of spin-off intangible assets (1) 0.06 0.06 0.06 0.06 0.24 Diluted earnings per share, excluding spin-off intangible amortization $0.73 $0.83 $0.91 $0.94 $3.40 Adjustment for the remaining amortization of intangible assets (2) 0.03 0.04 0.04 0.05 0.15 Diluted earnings per share, excluding all intangible amortization $0.76 $0.87 $0.95 $0.99 $3.55 |
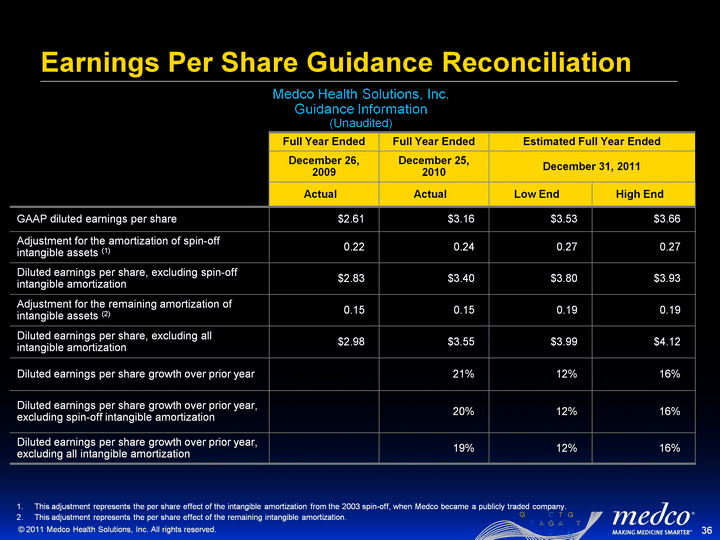
| Earnings Per Share Guidance Reconciliation 36 Medco Health Solutions, Inc. Guidance Information (Unaudited) This adjustment represents the per share effect of the intangible amortization from the 2003 spin-off, when Medco became a publicly traded company. This adjustment represents the per share effect of the remaining intangible amortization. Full Year Ended Full Year Ended Estimated Full Year Ended Estimated Full Year Ended December 26, 2009 December 25, 2010 December 31, 2011 December 31, 2011 Actual Actual Low End High End GAAP diluted earnings per share $2.61 $3.16 $3.53 $3.66 Adjustment for the amortization of spin-off intangible assets (1) 0.22 0.24 0.27 0.27 Diluted earnings per share, excluding spin-off intangible amortization $2.83 $3.40 $3.80 $3.93 Adjustment for the remaining amortization of intangible assets (2) 0.15 0.15 0.19 0.19 Diluted earnings per share, excluding all intangible amortization $2.98 $3.55 $3.99 $4.12 Diluted earnings per share growth over prior year 21% 12% 16% Diluted earnings per share growth over prior year, excluding spin-off intangible amortization 20% 12% 16% Diluted earnings per share growth over prior year, excluding all intangible amortization 19% 12% 16% |
