Attached files
| file | filename |
|---|---|
| 8-K - 8-K - MARKWEST ENERGY PARTNERS L P | a11-8025_18k.htm |
Exhibit 99.1
|
|
INVESTOR PRESENTATION March 2011 |
|
|
Forward-Looking Statements This presentation contains forward-looking statements and information. These forward-looking statements, which in many instances can be identified by words like “could,” “may,” “will,” “should,” “expects,” “plans,” “project,” “anticipates,” “believes,” “planned,” “proposed,” “potential,” and other comparable words, regarding future or contemplated results, performance, transactions, or events, are based on MarkWest Energy Partners, L.P. (“MarkWest” and “Partnership”) current information, expectations and beliefs, concerning future developments and their potential effects on MarkWest. Although we believe that the expectations reflected in the forward-looking statements are reasonable, we can give no assurance that such expectations will prove to be correct, and actual results, performance , distributions , events or transactions could vary significantly from those expressed or implied in such statements and are subject to a number of uncertainties and risks. Among the factors that could cause results, performance, distributions, events or transactions to differ materially from those expressed or implied, are those risks discussed in our Annual Report on Form 10-K for the year ended December 31, 2010, as filed with the SEC. You are urged to carefully review and consider the cautionary statements and other disclosures, including those under the heading “Risk Factors,” made in those documents. If any of the uncertainties or risks develop into actual events or occurrences, or if underlying assumptions prove incorrect, it could cause actual results to vary significantly from those expressed in the presentation, and our business, financial condition, or results of operations could be materially adversely affected. Key uncertainties and risks that may directly affect MarkWest’s performance, future growth, results of operations, and financial condition, include, but are not limited to: Fluctuations and volatility of natural gas, NGL products, and oil prices; A reduction in natural gas or refinery off-gas production which we gather, transport, process, and/or fractionate; A reduction in the demand for the products we produce and sell; Financial credit risks / failure of customers to satisfy payment or other obligations under our contracts; Effects of our debt and other financial obligations, access to capital, or our future financial or operational flexibility or liquidity; Construction, procurement, and regulatory risks in our development projects; Hurricanes, fires, and other natural and accidental events impacting our operations, and adequate insurance coverage; Terrorist attacks directed at our facilities or related facilities; Changes in and impacts of laws and regulations affecting our operations and risk management strategy; and Failure to integrate recent or future acquisitions. 2 |
|
|
Non-GAAP Measures Distributable Cash Flow and Adjusted EBITDA are not measures of performance calculated in accordance with GAAP, and should not be considered separately from or as a substitute for net income, income from operations, or cash flow as reflected in our financial statements. The GAAP measure most directly comparable to Distributable Cash Flow and Adjusted EBITDA is net income (loss). In general, we define Distributable Cash Flow as net income (loss) adjusted for (i) depreciation, amortization, accretion, and other non-cash expense; (ii) amortization of deferred financing costs; (iii) loss on redemption of debt net of current tax benefit; (iv) non-cash (earnings) loss from unconsolidated affiliates; (v) distributions from (contributions to) unconsolidated affiliates (net of affiliate growth capital expenditures); (vi) non-cash compensation expense; (vii) non-cash derivative activity; (viii) losses (gains) on the disposal of property, plant, and equipment (PP&E) and unconsolidated affiliates; (ix) provision for deferred income taxes; (x) cash adjustments for non-controlling interest in consolidated subsidiaries; (xi) losses (gains) relating to other miscellaneous non-cash amounts affecting net income for the period; and (xii) maintenance capital expenditures. We define Adjusted EBITDA as net income (loss) adjusted for (i) depreciation, amortization, accretion, and other non-cash expense; (ii) interest expense; (iii) amortization of deferred financing costs; (iv) loss on redemption of debt net of current tax benefit; (v) losses (gains) on the disposal of PP&E and unconsolidated affiliates; (vi) non-cash derivative activity; (vii) non-cash compensation expense; (viii) provision for income taxes; (ix) adjustments for cash flow from unconsolidated affiliates; (x) adjustment related to non-wholly owned subsidiaries; and (xi) losses (gains) relating to other miscellaneous non-cash amounts affecting net income for the period. Distributable Cash Flow is a financial performance measure used by management as a key component in the determination of cash distributions paid to unitholders. We believe distributable cash flow is an important financial measure for unitholders as an indicator of cash return on investment and to evaluate whether the Partnership is generating sufficient cash flow to support quarterly distributions. In addition, distributable cash flow is commonly used by the investment community because the market value of publicly traded partnerships is based, in part, on distributable cash flow and cash distributions paid to unitholders. Adjusted EBITDA is a financial performance measure used by management, industry analysts, investors, lenders, and rating agencies to assess the financial performance and operating results of the Partnership’s ongoing business operations. Additionally, we believe Adjusted EBITDA provides useful information to investors for trending, analyzing, and benchmarking our operating results from period to period as compared to other companies that may have different financing and capital structures. Please see the Appendix for reconciliations of Distributable Cash Flow and Adjusted EBITDA to net income (loss), respectively 3 |
|
|
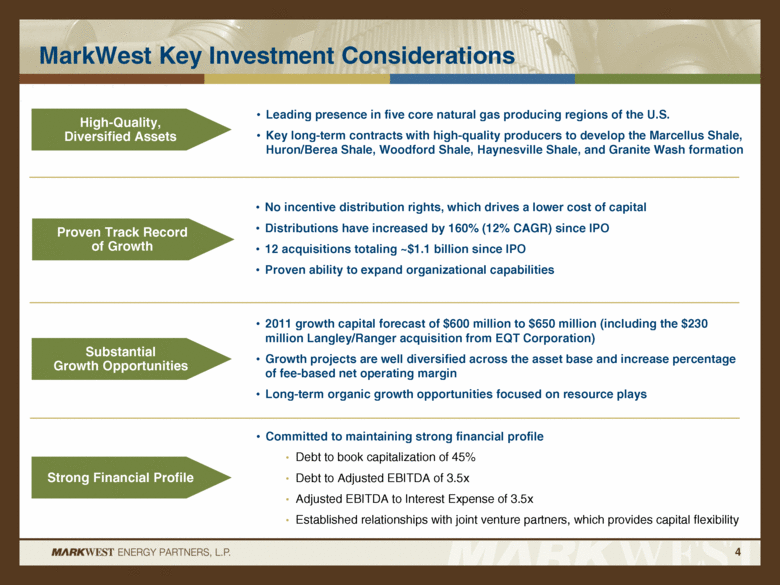
MarkWest Key Investment Considerations 4 Committed to maintaining strong financial profile Debt to book capitalization of 45% Debt to Adjusted EBITDA of 3.5x Adjusted EBITDA to Interest Expense of 3.5x Established relationships with joint venture partners, which provides capital flexibility No incentive distribution rights, which drives a lower cost of capital Distributions have increased by 160% (12% CAGR) since IPO 12 acquisitions totaling ~$1.1 billion since IPO Proven ability to expand organizational capabilities 2011 growth capital forecast of $600 million to $650 million (including the $230 million Langley/Ranger acquisition from EQT Corporation) Growth projects are well diversified across the asset base and increase percentage of fee-based net operating margin Long-term organic growth opportunities focused on resource plays High-Quality, Diversified Assets Proven Track Record of Growth Strong Financial Profile Leading presence in five core natural gas producing regions of the U.S. Key long-term contracts with high-quality producers to develop the Marcellus Shale, Huron/Berea Shale, Woodford Shale, Haynesville Shale, and Granite Wash formation Substantial Growth Opportunities |
|
|
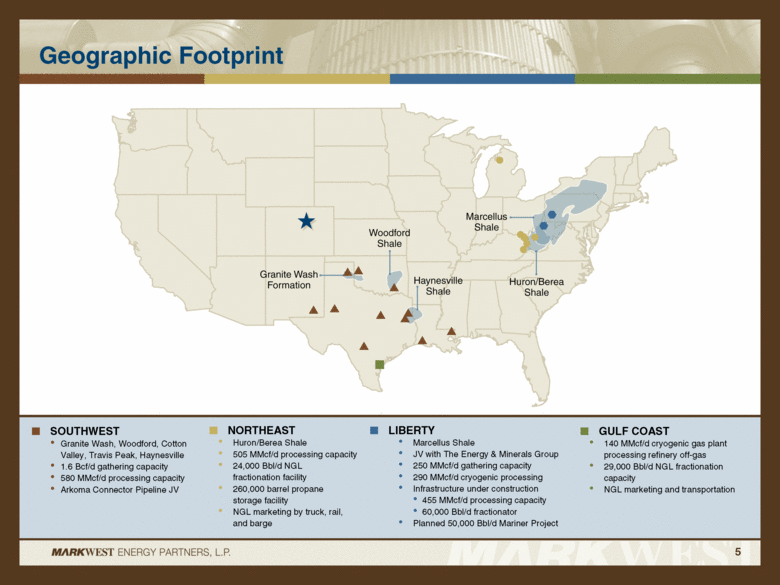
Geographic Footprint SOUTHWEST Granite Wash, Woodford, Cotton Valley, Travis Peak, Haynesville 1.6 Bcf/d gathering capacity 580 MMcf/d processing capacity Arkoma Connector Pipeline JV LIBERTY Marcellus Shale JV with The Energy & Minerals Group 250 MMcf/d gathering capacity 290 MMcf/d cryogenic processing Infrastructure under construction 455 MMcf/d processing capacity 60,000 Bbl/d fractionator Planned 50,000 Bbl/d Mariner Project GULF COAST 140 MMcf/d cryogenic gas plant processing refinery off-gas 29,000 Bbl/d NGL fractionation capacity NGL marketing and transportation NORTHEAST Huron/Berea Shale 505 MMcf/d processing capacity 24,000 Bbl/d NGL fractionation facility 260,000 barrel propane storage facility NGL marketing by truck, rail, and barge 5 |
|
|
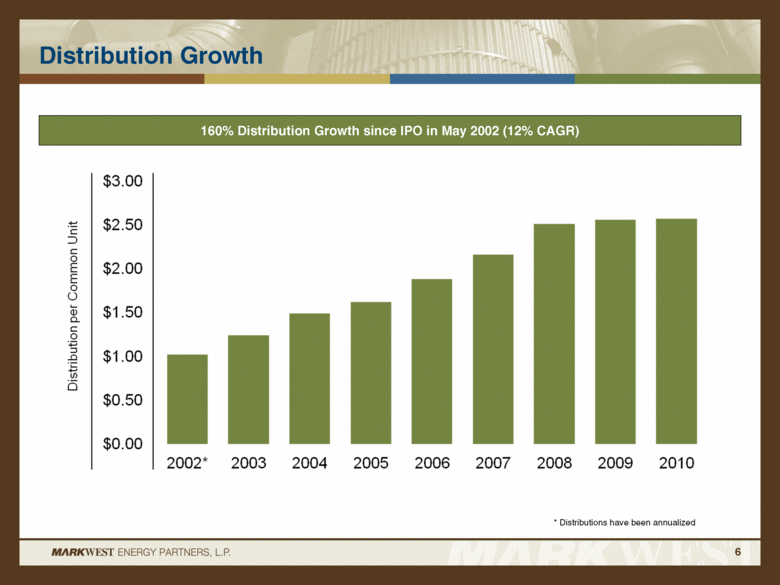
Distribution Growth * Distributions have been annualized 160% Distribution Growth since IPO in May 2002 (12% CAGR) 6 |
|
|
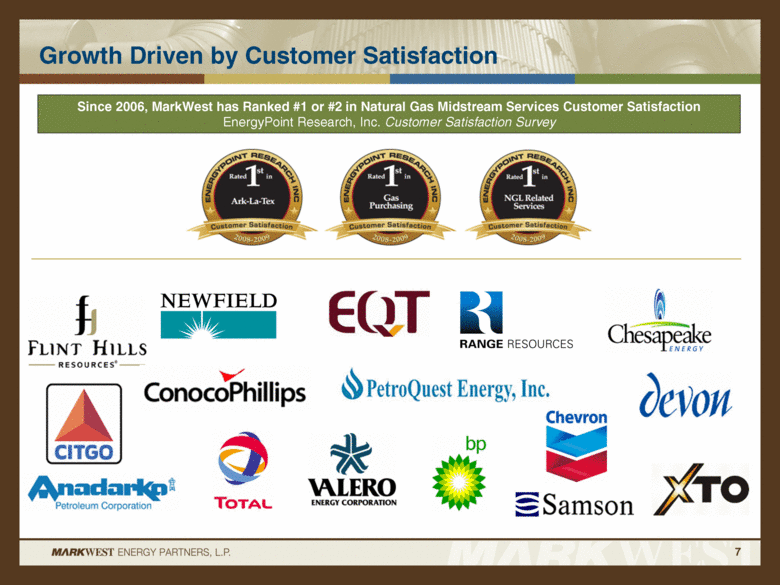
Growth Driven by Customer Satisfaction Since 2006, MarkWest has Ranked #1 or #2 in Natural Gas Midstream Services Customer Satisfaction EnergyPoint Research, Inc. Customer Satisfaction Survey 7 |
|
|
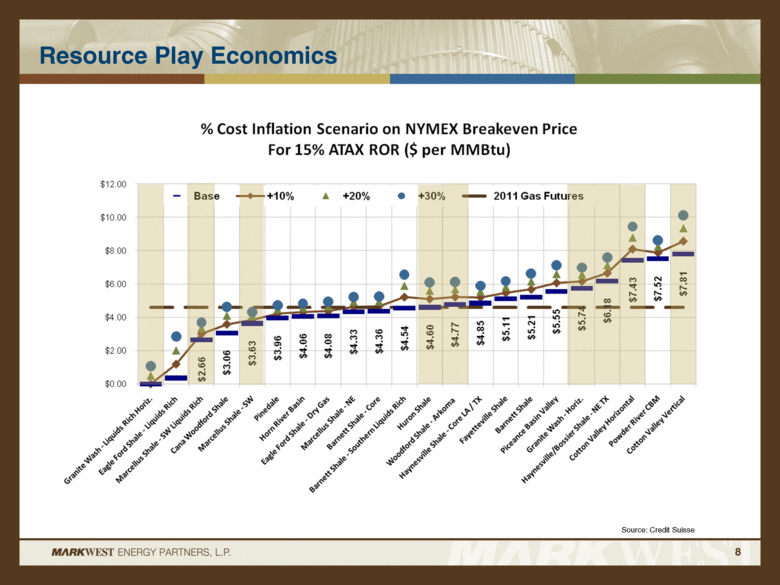
Resource Play Economics 8 Source: Credit Suisse |
|
|
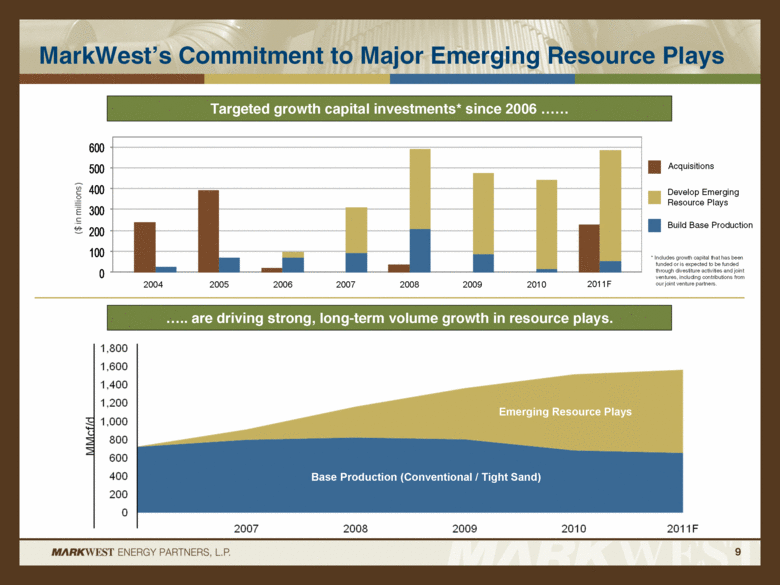
MarkWest’s Commitment to Major Emerging Resource Plays 9 Targeted growth capital investments* since 2006 are driving strong, long-term volume growth in resource plays. * Includes growth capital that has been funded or is expected to be funded through divestiture activities and joint ventures, including contributions from our joint venture partners. Emerging Resource Plays Base Production (Conventional / Tight Sand) 2004 2005 2006 2007 2008 2009 2010 2011F Acquisitions Develop Emerging Resource Plays Build Base Production |
|
|
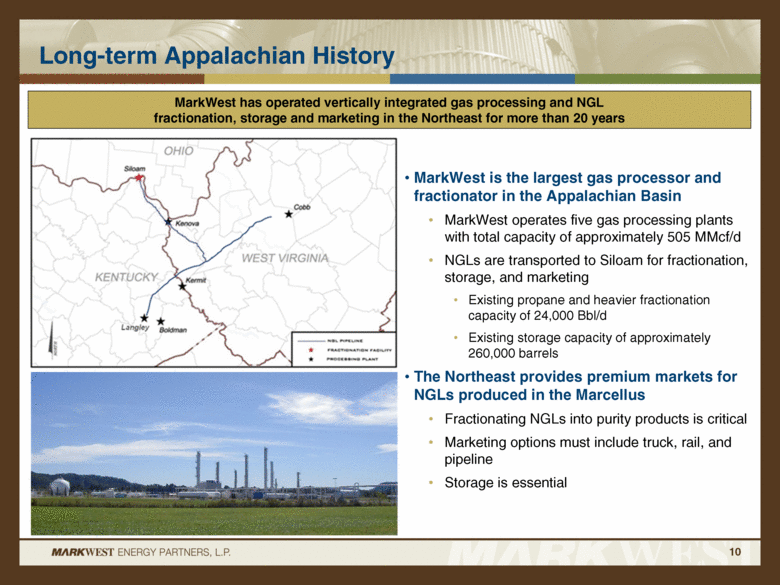
Long-term Appalachian History MarkWest is the largest gas processor and fractionator in the Appalachian Basin MarkWest operates five gas processing plants with total capacity of approximately 505 MMcf/d NGLs are transported to Siloam for fractionation, storage, and marketing Existing propane and heavier fractionation capacity of 24,000 Bbl/d Existing storage capacity of approximately 260,000 barrels The Northeast provides premium markets for NGLs produced in the Marcellus Fractionating NGLs into purity products is critical Marketing options must include truck, rail, and pipeline Storage is essential MarkWest has operated vertically integrated gas processing and NGL fractionation, storage and marketing in the Northeast for more than 20 years 10 |
|
|
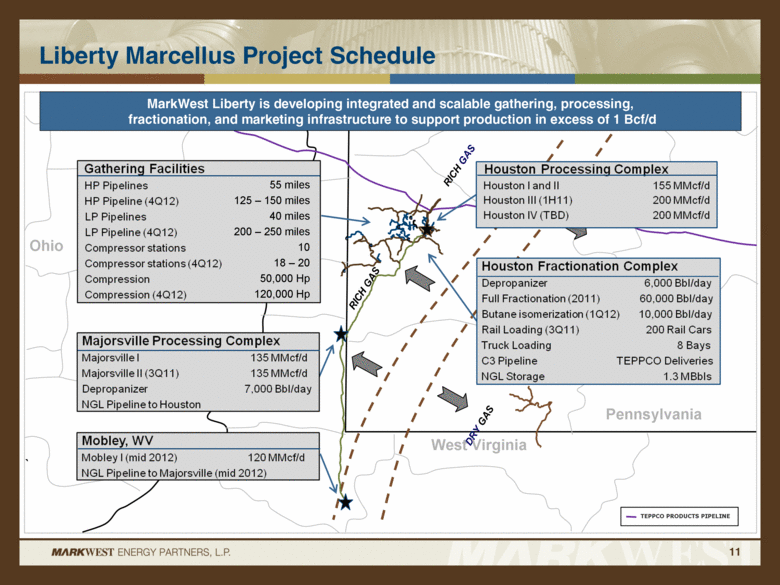
Liberty Marcellus Project Schedule 11 ` Ohio West Virginia Pennsylvania Ohio MarkWest Liberty is developing integrated and scalable gathering, processing, fractionation, and marketing infrastructure to support production in excess of 1 Bcf/d TEPPCO PRODUCTS PIPELINE 55 miles 125 – 150 miles 40 miles 200 – 250 miles 10 18 – 20 50,000 Hp 120,000 Hp |
|
|
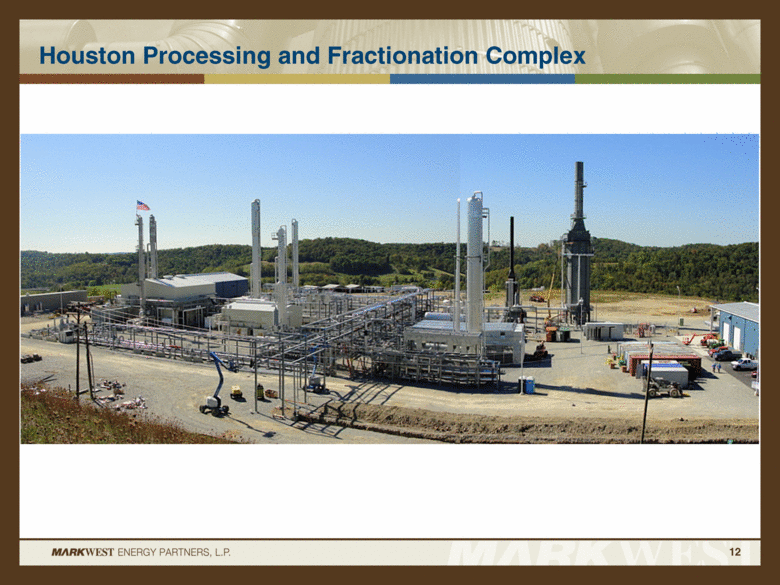
Houston Processing and Fractionation Complex 12 |
|
|
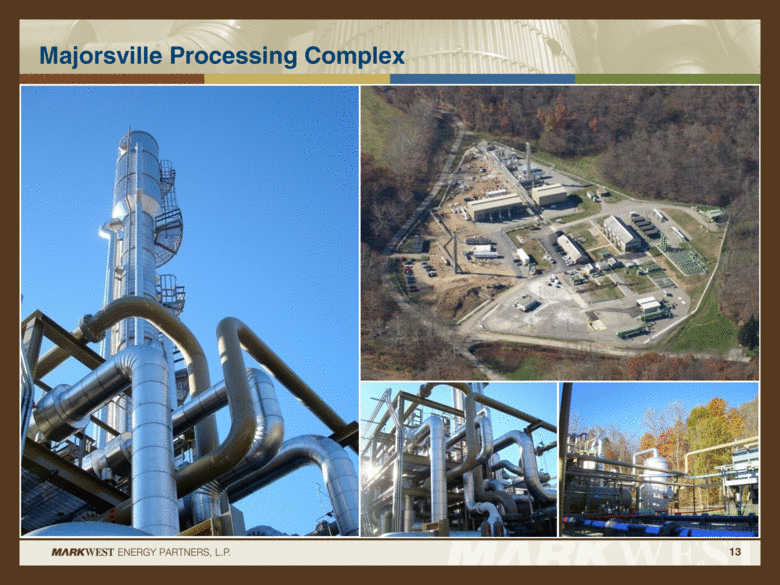
Majorsville Processing Complex 13 |
|
|
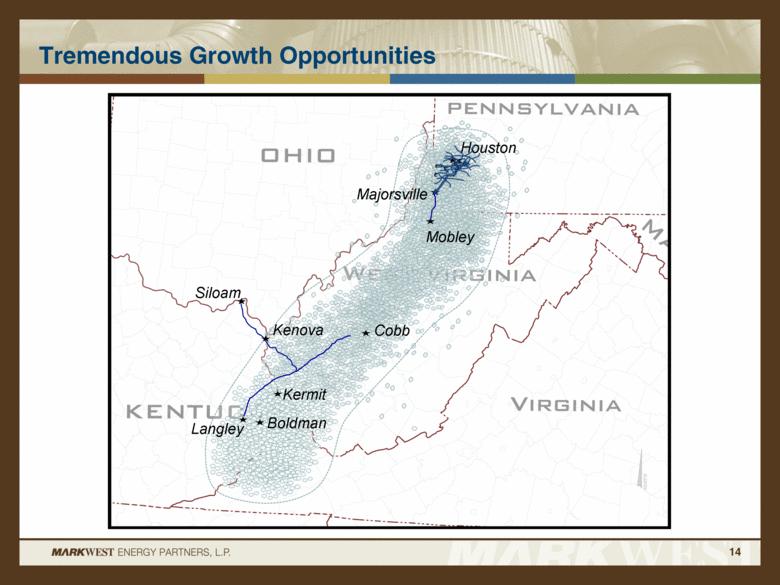
Tremendous Growth Opportunities 14 Siloam Kenova Cobb Kermit Boldman Majorsville Houston Langley Mobley |
|
|
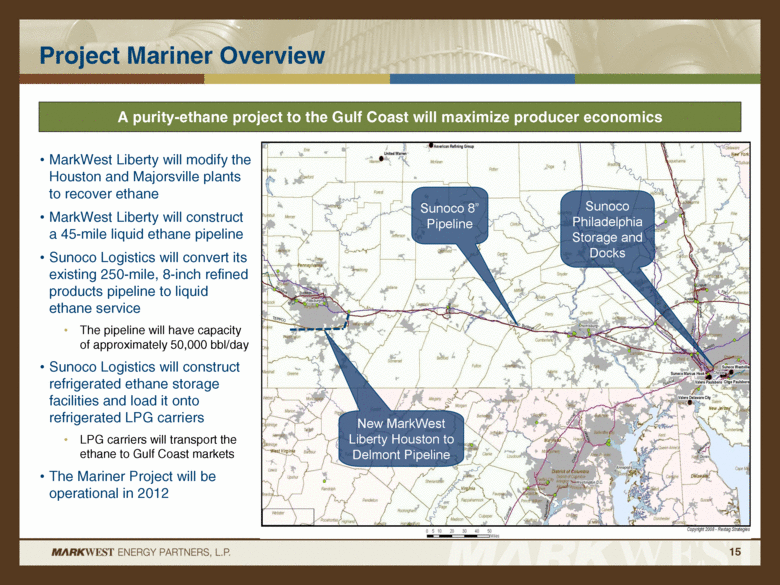
Project Mariner Overview MarkWest Liberty will modify the Houston and Majorsville plants to recover ethane MarkWest Liberty will construct a 45-mile liquid ethane pipeline Sunoco Logistics will convert its existing 250-mile, 8-inch refined products pipeline to liquid ethane service The pipeline will have capacity of approximately 50,000 bbl/day Sunoco Logistics will construct refrigerated ethane storage facilities and load it onto refrigerated LPG carriers LPG carriers will transport the ethane to Gulf Coast markets The Mariner Project will be operational in 2012 A purity-ethane project to the Gulf Coast will maximize producer economics 15 Sunoco 8” Pipeline New MarkWest Liberty Houston to Delmont Pipeline Sunoco Philadelphia Storage and Docks |
|
|
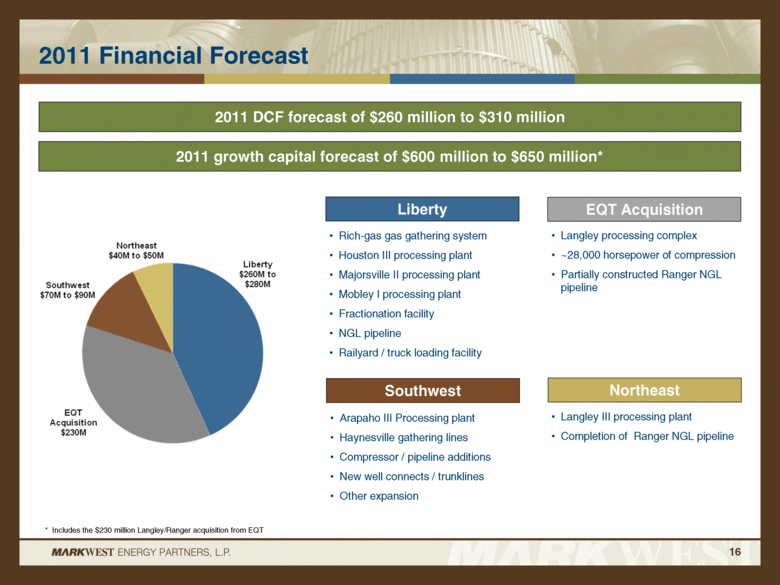
2011 Financial Forecast Rich-gas gas gathering system Houston III processing plant Majorsville II processing plant Mobley I processing plant Fractionation facility NGL pipeline Railyard / truck loading facility 2011 DCF forecast of $260 million to $310 million 16 2011 growth capital forecast of $600 million to $650 million* EQT Acquisition Liberty Northeast Southwest Langley processing complex ~28,000 horsepower of compression Partially constructed Ranger NGL pipeline Arapaho III Processing plant Haynesville gathering lines Compressor / pipeline additions New well connects / trunklines Other expansion Langley III processing plant Completion of Ranger NGL pipeline * Includes the $230 million Langley/Ranger acquisition from EQT |
|
|
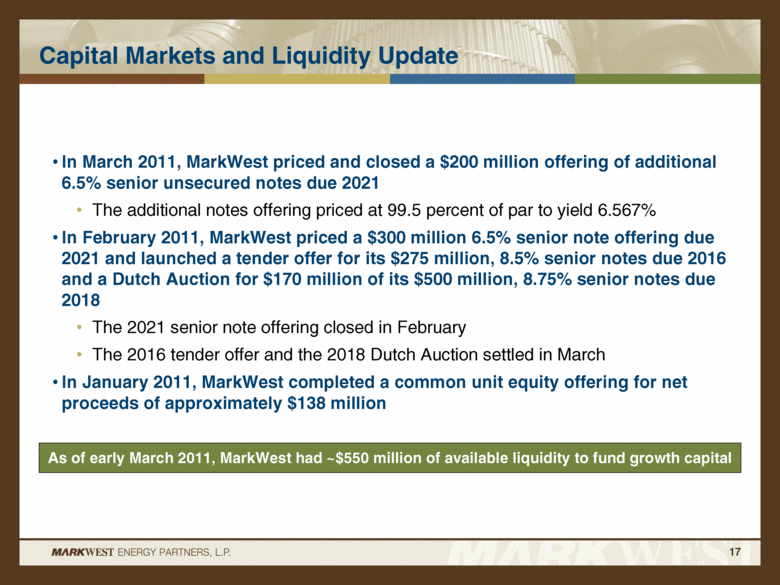
Capital Markets and Liquidity Update In March 2011, MarkWest priced and closed a $200 million offering of additional 6.5% senior unsecured notes due 2021 The additional notes offering priced at 99.5 percent of par to yield 6.567% In February 2011, MarkWest priced a $300 million 6.5% senior note offering due 2021 and launched a tender offer for its $275 million, 8.5% senior notes due 2016 and a Dutch Auction for $170 million of its $500 million, 8.75% senior notes due 2018 The 2021 senior note offering closed in February The 2016 tender offer and the 2018 Dutch Auction settled in March In January 2011, MarkWest completed a common unit equity offering for net proceeds of approximately $138 million As of early March 2011, MarkWest had ~$550 million of available liquidity to fund growth capital 17 |
|
|
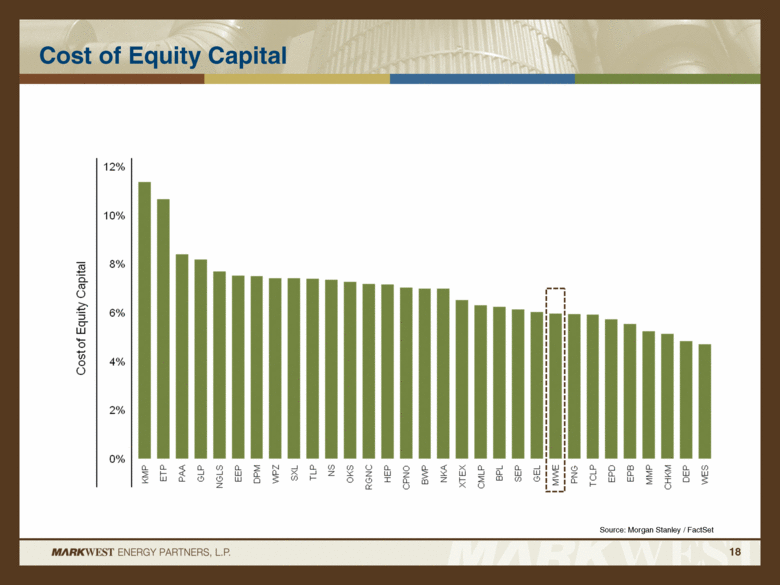
Cost of Equity Capital 18 Source: Morgan Stanley / FactSet |
|
|
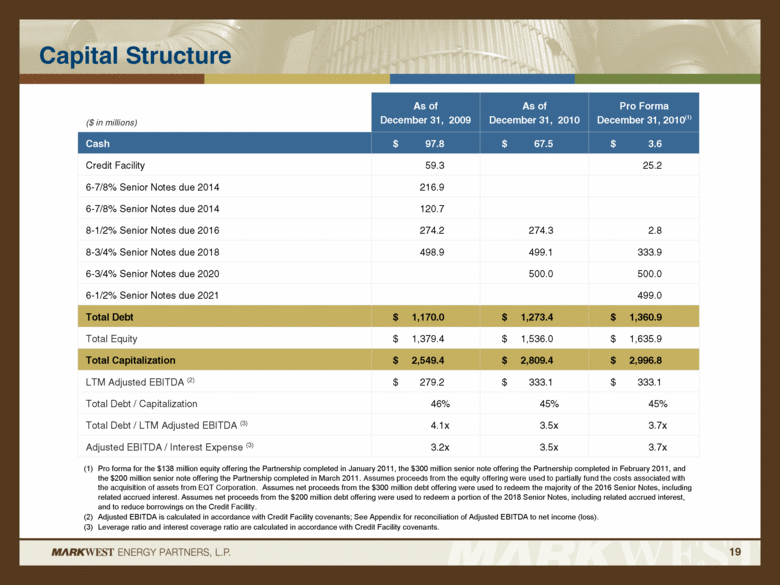
Capital Structure 19 ($ in millions) As of December 31, 2009 As of December 31, 2010 Pro Forma December 31, 2010(1) Cash $ 97.8 $ 67.5 $ 3.6 Credit Facility 59.3 25.2 6-7/8% Senior Notes due 2014 216.9 6-7/8% Senior Notes due 2014 120.7 8-1/2% Senior Notes due 2016 274.2 274.3 2.8 8-3/4% Senior Notes due 2018 498.9 499.1 333.9 6-3/4% Senior Notes due 2020 - 500.0 500.0 6-1/2% Senior Notes due 2021 - - 499.0 Total Debt $ 1,170.0 $ 1,273.4 $ 1,360.9 Total Equity $ 1,379.4 $ 1,536.0 $ 1,635.9 Total Capitalization $ 2,549.4 $ 2,809.4 $ 2,996.8 LTM Adjusted EBITDA (2) $ 279.2 $ 333.1 $ 333.1 Total Debt / Capitalization 46% 45% 45% Total Debt / LTM Adjusted EBITDA (3) 4.1x 3.5x 3.7x Adjusted EBITDA / Interest Expense (3) 3.2x 3.5x 3.7x Pro forma for the $138 million equity offering the Partnership completed in January 2011, the $300 million senior note offering the Partnership completed in February 2011, and the $200 million senior note offering the Partnership completed in March 2011. Assumes proceeds from the equity offering were used to partially fund the costs associated with the acquisition of assets from EQT Corporation. Assumes net proceeds from the $300 million debt offering were used to redeem the majority of the 2016 Senior Notes, including related accrued interest. Assumes net proceeds from the $200 million debt offering were used to redeem a portion of the 2018 Senior Notes, including related accrued interest, and to reduce borrowings on the Credit Facility. Adjusted EBITDA is calculated in accordance with Credit Facility covenants; See Appendix for reconciliation of Adjusted EBITDA to net income (loss). Leverage ratio and interest coverage ratio are calculated in accordance with Credit Facility covenants. |
|
|
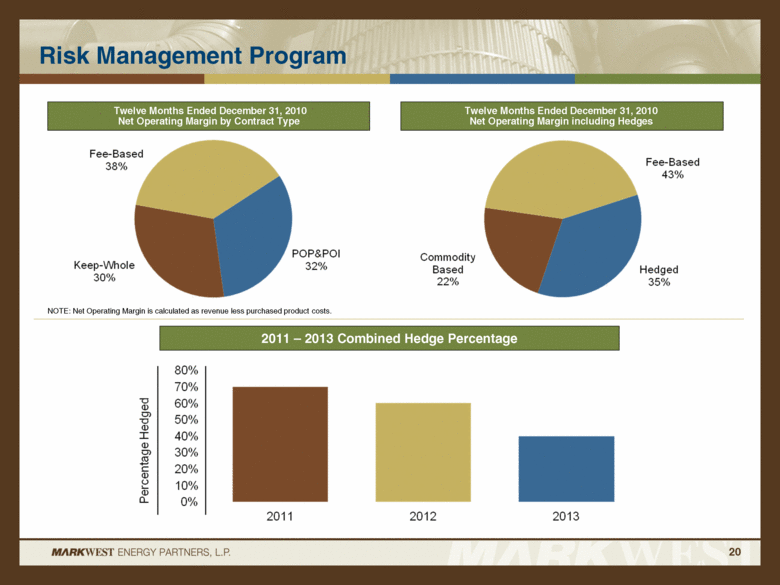
Risk Management Program 20 2011 – 2013 Combined Hedge Percentage Twelve Months Ended December 31, 2010 Net Operating Margin by Contract Type Twelve Months Ended December 31, 2010 Net Operating Margin including Hedges NOTE: Net Operating Margin is calculated as revenue less purchased product costs. |
|
|
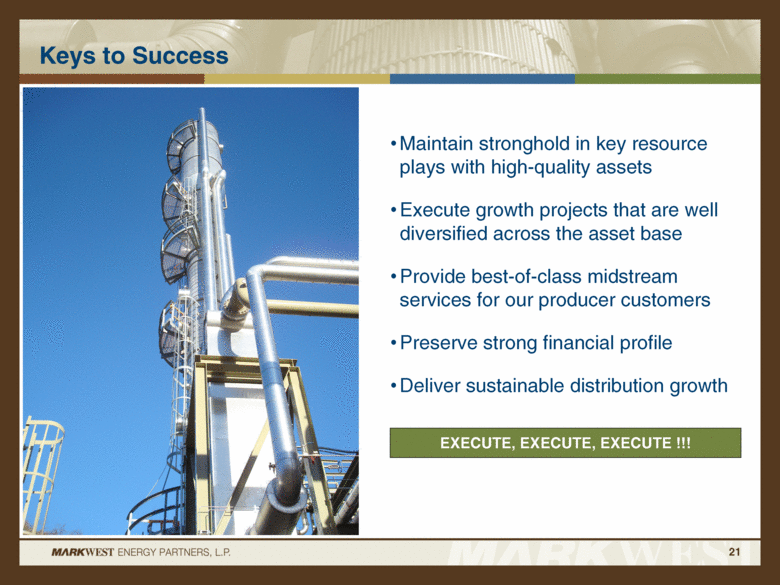
Keys to Success Maintain stronghold in key resource plays with high-quality assets Execute growth projects that are well diversified across the asset base Provide best-of-class midstream services for our producer customers Preserve strong financial profile Deliver sustainable distribution growth EXECUTE, EXECUTE, EXECUTE !!! 21 |
|
|
Appendix 22 |
|
|
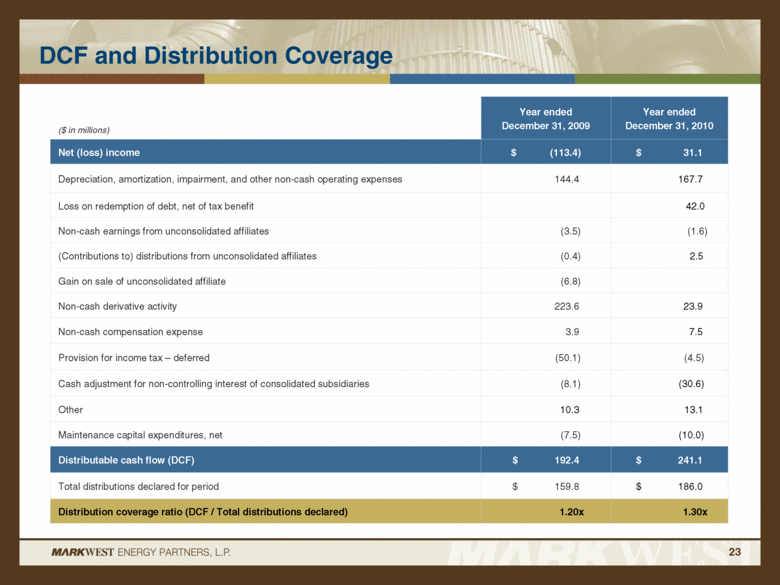
DCF and Distribution Coverage 23 ($ in millions) Year ended December 31, 2009 Year ended December 31, 2010 Net (loss) income $ (113.4) $ 31.1 Depreciation, amortization, impairment, and other non-cash operating expenses 144.4 167.7 Loss on redemption of debt, net of tax benefit 42.0 Non-cash earnings from unconsolidated affiliates (3.5) (1.6) (Contributions to) distributions from unconsolidated affiliates (0.4) 2.5 Gain on sale of unconsolidated affiliate (6.8) Non-cash derivative activity 223.6 23.9 Non-cash compensation expense 3.9 7.5 Provision for income tax – deferred (50.1) (4.5) Cash adjustment for non-controlling interest of consolidated subsidiaries (8.1) (30.6) Other 10.3 13.1 Maintenance capital expenditures, net (7.5) (10.0) Distributable cash flow (DCF) $ 192.4 $ 241.1 Total distributions declared for period $ 159.8 $ 186.0 Distribution coverage ratio (DCF / Total distributions declared) 1.20x 1.30x |
|
|
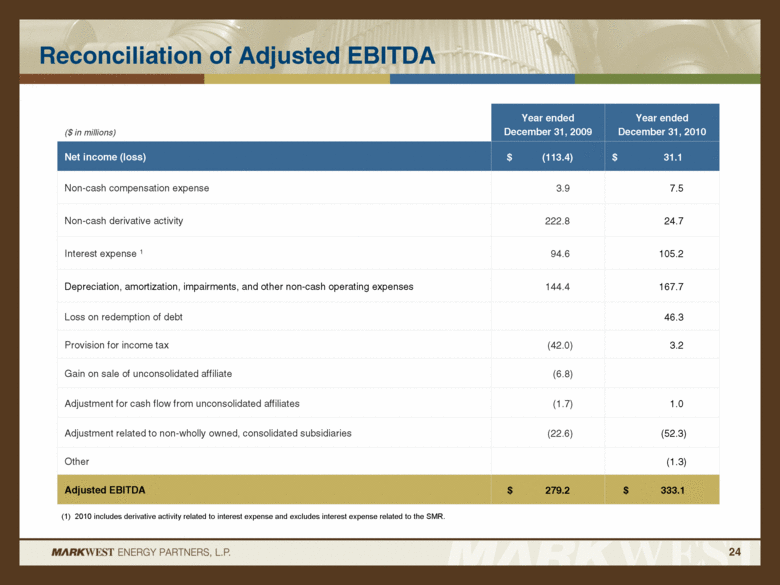
Reconciliation of Adjusted EBITDA 24 ($ in millions) Year ended December 31, 2009 Year ended December 31, 2010 Net income (loss) $ (113.4) $ 31.1 Non-cash compensation expense 3.9 7.5 Non-cash derivative activity 222.8 24.7 Interest expense 1 94.6 105.2 Depreciation, amortization, impairments, and other non-cash operating expenses 144.4 167.7 Loss on redemption of debt 46.3 Provision for income tax (42.0) 3.2 Gain on sale of unconsolidated affiliate (6.8) Adjustment for cash flow from unconsolidated affiliates (1.7) 1.0 Adjustment related to non-wholly owned, consolidated subsidiaries (22.6) (52.3) Other (1.3) Adjusted EBITDA $ 279.2 $ 333.1 (1) 2010 includes derivative activity related to interest expense and excludes interest expense related to the SMR. |
|
|
1515 Arapahoe Street Tower 1, Suite 1600 Denver, Colorado 80202 Phone: 303-925-9200 Investor Relations: 866-858-0482 Email: investorrelations@markwest.com Website: www.markwest.com 25 |