Attached files
| file | filename |
|---|---|
| 8-K - FORM 8-K - Clearwater Paper Corp | d8k.htm |
 0
Clearwater Paper Corporation
Goldman Sachs 2011 Montreal Paper Conference
March 16, 2011
Exhibit 99.1 |
 1
Forward-Looking Statements
This presentation contains, in addition to historical information, certain forward-looking
statements within the meaning of the Private Securities Litigation Reform Act of 1995, including
statements regarding the benefits of, and synergies from, our Cellu Tissue acquisition, internal and
external pulp purchases and sales, pulp requirements, customer purchases of private label
tissue, production capacity of operating divisions, completion of additional converting and paper making capacity, the cost and timing to complete new facilities, future
growth opportunities, sales volumes, input costs, and our financial condition and results of
operations. Words such as “anticipate,” “expect,” “intend,” “will,” “plan,” “target,” “project,”
“believe,” “schedule,” “estimate,” “may,” and similar
expressions are intended to identify such forward-looking statements. These forward-looking statements are based on
management’s current expectations, estimates, assumptions and projections that are subject to
change. Our actual results of operations may differ materially from those expressed or implied
by the forward-looking statements contained in this presentation. Important factors that could cause or contribute to such differences include the risk factors described in Item
1A of Part I of our Form 10-K for the year ended December 31, 2010, as well as the following:
•
an inability to successfully implement our expansion and operating strategies;
•
difficulties with the integration process or the realization of the benefits expected from the
acquisition of Cellu Tissue; •
difficulties with the completion of our new tissue making and converting facilities;
•
the Cellu Tissue acquisition may expose our operations to unidentified liabilities;
•
changes in the cost and availability of wood fiber used in the production of our products;
•
changes in freight costs and disruptions in transportation services;
•
changes in raw material costs and energy availability and costs;
•
changes in customer product preferences and competitors’ product offerings;
•
changes in the United States and international economies and in general economic conditions in the
regions and industries in which we operate; •
cyclical industry conditions;
•
the loss of business from any of our three largest Consumer Products segment customers or a large
Pulp and Paperboard segment customer; •
competitive pricing pressures for our products;
•
reliance on a limited number of third party suppliers for raw materials;
•
our qualification to retain, or ability to utilize, tax credits associated with alternative fuels or
cellulosic biofuels; •
labor disruptions;
•
unforeseen environmental liabilities or expenditures;
•
unanticipated manufacturing or operating disruptions, including equipment malfunction and damage to
our manufacturing facilitates caused by fire or weather- related events and IT system
failures; •
changes in the relationship between supply and demand in the forest products industry, including the
amount of available manufacturing capacity and wood fiber used in manufacturing our
products; •
changes in expenses and required contributions associated with our pension plans;
•
an inability to fund our debt obligations;
•
restrictions on our business from debt covenants and terms;
•
changes in laws, regulations or industry standards affecting our business; and
•
changes in exchange rates between the U.S. dollar and other currencies.
Forward-looking statements contained in this presentation present management’s views only as
of the date of this presentation. We undertake no obligation to publicly update forward-
looking statements, whether as a result of new information, future events or otherwise.
|
 2
Company Overview
Clearwater Paper is a leader in quality private label consumer
tissue
and
exceptional
bleached
paperboard
–
focused
on
helping
our customers build their brands. |
 3
Clearwater Paper Overview
Leading manufacturer of private-label consumer tissue and fully-bleached SBS
paperboard, with approximately
$1.4
billion
in
net
sales
and
$166.8
million
of
Adjusted
EBITDA¹
for
the
twelve months
ended December 31, 2010
Segment
Net
Sales
2,3
Segment
Adjusted
EBITDA¹
Segment
Adjusted
EBITDA
Margin
%
1,4
% of LTM Net Sales²
($ in millions)
Pulp &
Paperboard
(PPD)
$802.9
$110.6
13.8%
$570.1
$ 87.2
15.3%
Consumer
Products
(CPD)
1 See Appendix A: “Financial Detail” for the definitions of Adjusted EBITDA and Segment
Adjusted EBITDA as well as the reconciliation to the most comparable GAAP measures. 2 Net
sales excludes intersegment net sales and transfers. 3 Amounts for Consumer Products
segment include four days of Cellu Tissue results. 4 Segment Adjusted EBITDA margin
percentage calculated by dividing Segment Adjusted EBITDA by Segment Net Sales. |
 $445
$452
$504
$554
$570
$672
$731
$751
$696
$803
2006
2007
2008
2009
2010
$41
$34
$53
$138
$87
$70
$80
$35
$51
$111
9.0%
8.8%
6.0%
13.9%
12.2%
2006
2007
2008
2009
2010
4
Financial Track Record
($ in millions)
Adjusted EBITDA
2,3
Net Sales¹
$1,117
$1,183
$1,255
$1,250
$101
$104
$75
5 Yr Average: $1,236
$174
CPD
PPD
Adj. EBITDA Margin %
4
5 Yr Average: $124
$1,373
$167
1 Excludes intersegment net sales and transfers. Net sales for 2010 for CPD includes four
days of Cellu Tissue results. 2 See Appendix A: “Financial Detail” for the
definition of Adjusted EBITDA and Segment Adjusted EBITDA as well as the reconciliation to the most comparable GAAP measures.
3 Clearwater Paper’s total Adjusted EBITDA includes corporate and eliminations.
4 Adjusted EBITDA margin percentage calculated by dividing Adjusted EBITDA by Net Sales.
|
 5
Total Cost¹:
% of Total
Cost of Sales
2009
2010
Historical Cost Drivers -
Wood Fiber
2008
$325.4 M
28%
$269.7 M
26%
$314.3 M
27%
1 Excludes intersegment amounts
•
Wood fiber includes pulp, wood chips, sawdust and saw logs.
•
Historically, we have been a net buyer of approximately 85,000 tons of pulp
annually. Going forward, we expect to be a net buyer of
approximately 400,000 tons of pulp annually.
•
Historically, we produced approximately 804,000 tons of pulp representing about 92%
of our total annual pulp needs. We expect to continue to produce the
same amount of pulp going forward, which will represent about 68% of our
total annual pulp needs. •
Generally we use a mix of pulp including northern softwood, southern softwood,
northern hardwood, eucalyptus and recycled.
Wood
Fiber |
 6
Total Cost:
% of Total
Cost of Sales
2009
2010
Other Key Historical Cost Drivers
Other
key
cost
drivers
are
chemicals,
energy,
transportation
and
maintenance
Energy
Transportation
2008
Total Cost:
% of Total
Cost of Sales
Total Cost¹:
% of Total
Cost of Sales
$143.0 M
12%
$114.7
10%
$97.3
9%
$92.0
8%
$123.2
10%
$100.3
9%
$117.3
10%
$ 61.9
5%
$70.0
7%
$82.4
7%
$123.2 M
12%
$132.3 M
11%
Maintenance
& Repair
Total Cost:
% of Total
Cost of Sales
Chemicals
1 Excludes related labor costs. |
 7
Strong Financial Performance
($ in Millions)
Clearwater Paper
(Twelve Months Ended
December 31, 2010)
Cellu Tissue
(Period from January 1, 2010
through December 27, 2010)
Combined
Net
Sales
2
$1,373.0
$529.6
$1,902.6
Adjusted EBITDA
3
$166.8
$42.1
$208.9
Adjusted EBITDA Margin %
4
12.2%
7.9%
11.0%
Capacity ('000 TDY
)
Tissue Parent Roll
227
337
564
Tissue Converted
221
241
462
1 Cellu Tissue was acquired on December 27, 2010. Clearwater Paper’s results for 2010
include four days of Cellu Tissue results. 2 Net sales excludes intersegment net sales and
transfers. 3 See Appendix A: “Financial Detail” for the definition of Adjusted
EBITDA as well as the reconciliation to the most comparable GAAP measure. 4 Adjusted
EBITDA margin percentage calculated by dividing Adjusted EBITDA by net sales. |
 8
Pro Forma Sales Mix Change
Acquisition Supports Strategy to Grow the Size and Scope of Consumer
Products Segment
Clearwater Paper
Stand Alone Sales Mix
Twelve Months Ended
December 31, 2010
Period from January 1, 2010
through December 27, 2010
Cellu Tissue
Stand
Alone
Sales
Mix¹
Pro Forma Sales Mix
$1,373 Million
$530 Million
$1,903 Million
1 Cellu Tissue was acquired on December 27, 2010. Clearwater Paper’s
results for 2010 include four days of Cellu Tissue results. Consumer
Products
58%
Pulp &
Paperboard
42%
Consumer
Products
42%
Pulp &
Paperboard
58%
Tissue
77%
Machine-
glazed
22%
Foam
1% |
 9
Consumer Products Segment Overview
•
Committed to maintaining high-quality
products that match the quality of leading
national brands
•
Only U.S. consumer tissue producer that
manufactures solely private label tissue
High-Quality, Premium Products ($ in millions)
1 Cellu Tissue was acquired on December 27, 2010. Clearwater
Paper’s results for 2010 include four days of Cellu Tissue results.
2 See Appendix A: “Financial Detail”
for the definition of Segment Adjusted EBITDA as well as the reconciliation to the
most comparable GAAP measure. $41
$34
$53
$138
$87
$129
$0
$20
$40
$60
$80
$100
$120
$140
$160
2006
2007
2008
2009
2010
PF 2010 |
 10
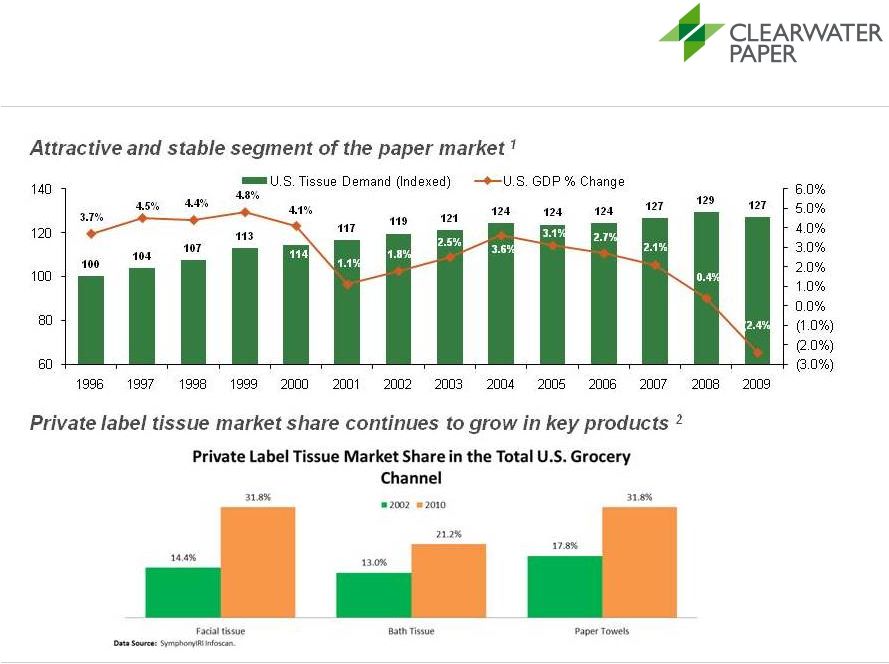
Attractive Industry Characteristics -Tissue
Source: RISI and IRI.
1 Based on converted short tons.
2 Represents market share as a % of sales in U.S. grocery channel.
|
 30%
17%
16%
7%
6%
5%
4%
2%
2%
2%
1%
1%
1%
1%
1%
1%
0%
0%
0%
4%
0.0%
5.0%
10.0%
15.0%
20.0%
25.0%
30.0%
35.0%
11
2010 North American Tissue Market by Producer
Remaining Manufacturing Base Highly Fragmented
Large Brand Manufacturers
Source: Equity research.
1 Represents pro forma Clearwater Paper tissue parent roll capacity combined
with Cellu Tissue tissue parent roll production. 1
The Combined Company Was the Sixth-Largest Manufacturer in
the
North American Tissue Market in 2010 |
 Consumer Products Strategy
Cellu Tissue Acquisition
•
National
manufacturing
footprint
to
complement
existing
national
customer
footprint
•
Ability to service all tissue quality segments (ultra, premium, value and economy)
as well as away-from-home tissue market
•
Strengthen position as one of the leading private label tissue manufacturers
•
Papermaker and converter of tissue products with 14 combined sites throughout North
America
Shelby, NC Expansion
•
Building a 70,000 ton TAD paper machine facility and 7 tissue converting lines
capable of producing ultra grades of private label tissue products
•
Initial 2 converting lines expected to come on-line in second quarter of 2011,
adding 27,000 tons of annual converting capability; paper machine expected
to begin production in the second half of 2012
12 |
 Cellu Tissue Synergies
•
Reduction in Freight Cost
•
Pulp Integration
•
Pulp Purchasing
•
SG&A
•
Parent Roll Integration
•
Efficiency Improvements
•
Scale Benefits
13
$15-$20 Million of Annual Net Cost Savings Expected to Be
Realized by End of 2012 |
 Synergy Opportunity Example
Underutilized
large converting winder in Neenah, WI (formerly Cellu Tissue) can more
efficiently produce Away-from-Home products and 1000 count bathroom
tissue •Actions:
1.
Relocate a wrapper machine from Elwood, IL (formerly CLW) to Neenah, WI
2.
Reposition an underutilized case packer in Neenah, WI
3.
Redirect the existing 1000 count product from Lewiston, ID (formerly CLW) and
Thomaston, GA (formerly CLU) to Neenah, WI
4.
Increase the production schedule of the existing underutilized large
converting winder in Neenah, WI from 5 to 7 days
•Expected Results:
1.
Creates
new
case
capacity
in
the
systems
at
Neenah,
Lewiston
and
Thomaston
2.
Reduces freight
3.
Improves paper machine trim
14 |
 15
Pulp and Paperboard Segment Overview
•
Focus on high-end paperboard products,
such as pharmaceuticals and cosmetics
packaging
–
Superior print surfaces and cleanliness for
discriminating domestic and international
markets
–
Valued industry consulting
–
Effective logistics to meet just-in-time
customer needs
High-Quality, Premium Products ($ in millions)
Segment Adjusted EBITDA
1,2
Net Sales¹
1 Includes Wood Products segment.
2 See Appendix A: “Financial Detail”
for the definition of Segment Adjusted EBITDA as well as the reconciliation to the
most comparable GAAP measure. |
 16
Attractive Industry Characteristics –
Paperboard
Source: RISI.
1 Top 5 manufacturers in 1998 were International Paper, Westvaco,
Temple-Inland, Georgia-Pacific and Potlatch. Top 5 manufacturers in 2010 were International Paper, MeadWestvaco,
Georgia-Pacific, Evergreen Packaging and Clearwater Paper.
2 Based on tons produced.
3 Average price per short ton of 16 pt. SBS folding carton C1S.
|
 17
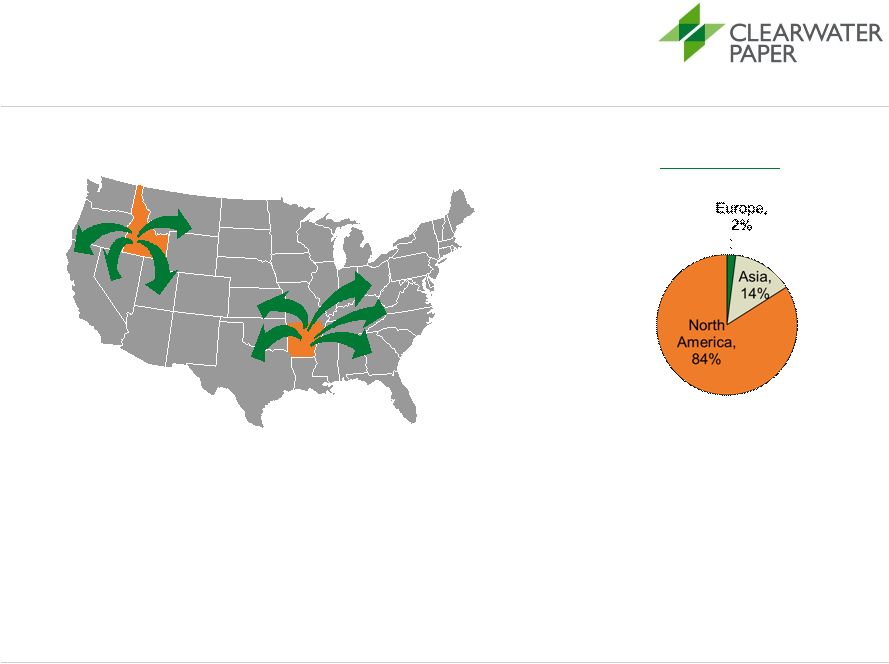
Strategically Positioned Pulp & Paperboard Facilities
Facilities positioned to provide broad geographic
reach and cost-efficient transportation points
•
Idaho Mill
–
Reduced transportation
costs to Asia versus East
Coast competitors
–
One of two bleached
paperboard mills in
Western U.S.
–
423,000 tons of bleached
paperboard produced
in 2010
•
Arkansas Mill
–
Central location reduces freight
costs to Midwest and East Coast
–
Most recently built bleached
paperboard mill in North
America
–
317,000 tons of bleached
paperboard produced in 2010
2010 PPD Sales |
 18
Appendix A: Financial Detail |
 19
External Pulp Purchases –
CLW
External Pulp Purchases –
CLU²
External Pulp Sales
Net Pulp Purchased
Projected¹
Approximate Pulp Flows
2010
134,000
0
(60,000)
74,000
134,000
240,000
0
374,000
1
We expect to eliminate external pulp sales over time and instead utilize that pulp
in our Consumer Products segment. 2
Excludes recycled fiber used at Ladysmith, WI
Pulp Production
External Pulp Purchases
External Pulp Sales
Internal Pulp Requirements
804,000
134,000
(60,000)
878,000
804,000
374,000
0
1,178,000
(92% of requirements)
(68% of requirements)
Projected¹
2010
Net Pulp Purchased
Pulp Integration
(in tons) |
 20
Reconciliation of GAAP to Non-GAAP:
Clearwater Paper EBITDA and Adjusted EBITDA
1 See last page of Appendix A for definitions of EBITDA and Adjusted
EBITDA. ($ in millions)
2006
2007
2008
2009
2010
Net Earnings
$20.9
$25.3
$9.7
$182.5
$73.8
Income Tax Provision
12.4
14.1
5.6
93.2
2.4
Interest Expense
13.0
13.0
13.1
15.5
22.6
Earnings Before Interest and
Income Taxes
46.3
52.4
28.5
291.2
98.8
Depreciation & Amortization
54.3
51.3
47.0
47.4
47.7
EBITDA¹
$100.6
$103.7
$75.4
$338.7
$146.5
Alternative Fuel Mixture Tax
Credit
(170.6)
Debt Retirement Costs
-
-
-
$6.2
-
Cellu Tissue Acquisition
Related Expenses
20.3
Adjusted EBITDA¹
$100.6
$103.7
$75.4
$174.3
$166.8 |
 21
Reconciliation of GAAP to Non-GAAP:
Cellu Tissue EBITDA and Adjusted EBITDA
1 See last page of Appendix A for definitions of EBITDA and Adjusted
EBITDA. ($ in millions)
Cellu Tissue
(Period from January 1, 2010
through December 27, 2010)
Net Loss
$(56.2)
Income Tax Provision
(34.6)
Interest Expense
86.4
Earnings Before Interest and
Income Taxes
(4.4)
Depreciation & Amortization
33.3
EBITDA
1
$28.9
Acquisition Related Expenses
13.2
Adjusted EBITDA¹
$42.1 |
 22
Reconciliation of GAAP to Non-GAAP:
Clearwater Paper Segment EBITDA and Segment Adjusted EBITDA
($ in millions)
1 See last page of Appendix A for definitions of Segment EBITDA and
Segment Adjusted EBITDA. 2006
2007
2008
2009
2010
Consumer Products
Operating Income
$25.7
$17.6
$37.3
$122.1
$63.7
Depreciation
15.8
16.3
15.7
16.0
17.0
Segment EBITDA¹
$41.5
$33.9
$53.0
$138.1
$80.7
Cellu Tissue Acquisition
Related Expenses
-
-
-
-
6.5
Segment Adjusted EBITDA¹
$41.5
$33.9
$53.0
$138.1
$87.2
Pulp & Paperboard
Operating Income¹
$32.2
$45.0
$4.4
$191.9
$81.9
Depreciation
38.1
34.6
30.9
29.9
28.7
Segment EBITDA¹
$70.2
$79.6
$35.3
$221.8
$110.6
Alternative Fuel Mixture Tax
Credits
-
-
-
(170.6)
-
Segment Adjusted EBITDA¹
$70.2
$79.6
$35.3
$51.1
$110.6 |
 23
Definitions of Non-GAAP Measures
Clearwater Paper Definitions of Non-GAAP Measures
EBITDA is a non-GAAP measure that Clearwater Paper management uses to evaluate the cash generating
capacity of Clearwater Paper. The most directly comparable GAAP measure is net earnings.
EBITDA, as defined by Clearwater Paper management, is net earnings adjusted for net interest
expense, income taxes, and depreciation and amortization. It should not be considered as an alternative to net earnings computed under
GAAP.
Adjusted EBITDA is a non-GAAP measure that Clearwater Paper management defines as EBITDA adjusted
for items that we do not believe are indicative of our core operating performance, including
acquisition related expenses and alternative fuel mixture tax credits. The most directly
comparable GAAP measure is net earnings. It should not be considered as an alternative to net
earnings computed under GAAP. Segment EBITDA is a non-GAAP measure used by Clearwater Paper management. The most directly
comparable GAAP measure is segment operating income. Segment EBITDA, as defined by Clearwater
Paper management, is segment operating income adjusted for segment depreciation and
amortization. It should not be considered as an alternative to segment operating income computed under GAAP.
Segment Adjusted EBITDA is a non-GAAP measure that Clearwater Paper management defines as Segment
EBITDA adjusted for nonrecurring expenses or income, including alternative fuel tax
credits. The most directly comparable GAAP measure is segment operating income. It should
not be considered as an alternative to segment operating income computed under GAAP.
|