Attached files
| file | filename |
|---|---|
| EX-31.1 - EX-31.1 - SATCON TECHNOLOGY CORP | a2202706zex-31_1.htm |
| EX-23.2 - EX-23.2 - SATCON TECHNOLOGY CORP | a2202706zex-23_2.htm |
| EX-32.1 - EX-32.1 - SATCON TECHNOLOGY CORP | a2202706zex-32_1.htm |
| EX-31.2 - EX-31.2 - SATCON TECHNOLOGY CORP | a2202706zex-31_2.htm |
| EX-23.1 - EX-23.1 - SATCON TECHNOLOGY CORP | a2202706zex-23_1.htm |
| EX-22.1 - EX-22.1 - SATCON TECHNOLOGY CORP | a2202706zex-22_1.htm |
| EX-10.55 - EX-10.55 - SATCON TECHNOLOGY CORP | a2202706zex-10_55.htm |
| EX-10.56 - EX-10.56 - SATCON TECHNOLOGY CORP | a2202706zex-10_56.htm |
Use these links to rapidly review the document
TABLE OF CONTENTS
TABLE OF CONTENTS
UNITED STATES
SECURITIES AND EXCHANGE COMMISSION
WASHINGTON, D.C. 20549
FORM 10-K
ANNUAL REPORT PURSUANT TO SECTION 13 OR 15(d) OF THE
SECURITIES EXCHANGE ACT OF 1934
For the Year Ended December 31, 2010
Commission file number 1-11512
SATCON TECHNOLOGY CORPORATION
(Exact name of registrant as specified in its charter)
| DELAWARE (State or other jurisdiction of incorporation or organization) |
04-2857552 (I.R.S. Employer Identification Number) |
|
27 Drydock Avenue, Boston, Massachusetts (Address of principal executive offices) |
02210 (Zip Code) |
(617) 897-2400
(Registrant's telephone number, including area code)
Securities registered pursuant to Section 12(b) of the Act:
| Title of Class | Name of Exchange on Which Registered | |
|---|---|---|
| Common Stock, $.01 Par Value | The NASDAQ Stock Market, LLC | |
| Preferred Stock Purchase Rights | The NASDAQ Stock Market, LLC |
Securities registered pursuant to Section 12(g) of the Act: None
Indicate by check mark if the registrant is a well-known seasoned issuer, as defined in Rule 405 of the Securities Act. Yes o No ý
Indicate by check mark if the registrant is not required to file reports pursuant to Section 13 or Section 15(d) of the Act. Yes o No ý
Indicate by check mark whether the registrant (1) has filed all reports required to be filed by Section 13 or 15(d) of the Securities Exchange Act of 1934 during the preceding 12 months (or for such shorter period that the registrant was required to file such reports), and (2) has been subject to such filing requirements for the past 90 days. Yes ý No o
Indicate by check mark whether the registrant has submitted electronically and posted on its corporate Web site, if any, every Interactive Data File required to be submitted and posted pursuant to Rule 405 of Regulation S-T (§232.405 of this chapter) during the preceding 12 months (or for such shorter period that the registrant was required to submit and post such files). Yes o No o
Indicate by check mark if disclosure of delinquent filers pursuant to Item 405 of Regulation S-K is not contained herein, and will not be contained, to the best of registrant's knowledge, in definitive proxy or information statements incorporated by reference in Part III of this Form 10-K or any amendment to this Form 10-K. ý
Indicate by check mark whether the registrant is a large accelerated filer, an accelerated filer, a non-accelerated filer, or a smaller reporting company. See the definitions of "large accelerated filer, "accelerated filer" and "smaller reporting company" in Rule 12b-2 of the Exchange Act. (Check one):
| Large accelerated filer o | Accelerated filer ý | Non-accelerated Filer o (Do not check if a smaller reporting company) |
Smaller reporting company o |
Indicate by check mark whether the registrant is a shell company (as defined in Rule 12b-2 of the Act). Yes o No ý
The aggregate market value of the registrant's Common Stock, $.01 par value per share, held by non-affiliates of the registrant was $205,765,352 based on the last reported sale price of the registrant's Common Stock on the Nasdaq Capital Market as of the close of business on the last business day of the registrant's most recently completed second quarter $2.86. There were 118,908,772 shares of Common Stock outstanding as of March 1, 2011.
DOCUMENTS INCORPORATED BY REFERENCE: Portions of the registrant's Proxy Statement for its 2011 Annual Meeting of Stockholders are incorporated by reference into Part III of this Form 10-K.
2
Statement Regarding Forward-Looking Statements
This Annual Report on Form 10-K contains or incorporates forward-looking statements within the meaning of Section 27A of the Securities Act of 1933 and Section 21E of the Securities Act of 1934. You can identify these forward-looking statements by our use of the words "believes," "anticipates," "plans," "expects," "may," "will," "intends," "estimates," and similar expressions, whether in the negative or in the affirmative. Forward-looking statements include statements regarding our position as a leading provider of power conversion solutions; our ability to create innovative products in the markets we target; the expected demand for our products in the markets we target; our ability to address our customers' needs; our ability to execute on our growth strategy; and our ability to compete in the markets we target. Although we believe that these forward-looking statements reasonably reflect our plans, intentions and expectations disclosed in the forward-looking statements, our actual results could differ materially from the plans, intentions and expectations disclosed in the forward-looking statements we make. We have included important factors in the cautionary statements under the heading "Risk Factors" under Item 1A that we believe could cause our actual results to differ materially from the forward-looking statements that we make. Forward-looking statements contained in this Annual Report speak only as of the date of this report. Subsequent events or circumstances occurring after such date may render these statements incomplete or out of date. We undertake no obligation and expressly disclaim any duty to update such statements.
Overview
Satcon Technology Corporation ("Satcon" or "Company") is a leading clean energy technology provider of utility-grade power conversion solutions for the renewable energy market, primarily the large-scale commercial and utility-scale solar photovoltaic, or PV, markets. We design and deliver advanced power conversion solutions that enable large-scale producers of renewable energy to convert clean energy into grid-connected, efficient and reliable electrical power.
Our power conversion solutions boost total system power production through system intelligence, advanced command and control capabilities, industrial-grade engineering and total lifecycle performance optimization. Our power conversion solutions feature the widest range of power ratings in the solar industry. We also offer system design services and solutions for management, monitoring, and performance measurement to maximize capital investment and improve overall quality and performance over the entire lifespan of an installation.
Revenue Comparison with Prior Years
Consolidated revenues by geographic area for the years ended December 31, 2010, 2009 and 2008 were as follows:
| |
Year Ended December 31, | ||||||||||
|---|---|---|---|---|---|---|---|---|---|---|---|
| |
2010 | 2009 | 2008 | ||||||||
United States |
$ | 76,079,866 | $ | 39,734,485 | $ | 46,371,717 | |||||
International |
97,222,107 | 12,801,148 | 7,921,617 | ||||||||
Total |
$ | 173,301,973 | $ | 52,535,633 | $ | 54,293,334 | |||||
These numbers have been adjusted to reflect the January 2010 sale of our Satcon Applied Technology business unit and the September 2008 sales of our Electronics and Power Systems US
3
business units. See Note D (Discontinued Operations) to the Consolidated Financial Statements included in this Annual Report on Form 10-K.
Industry Background & Market Opportunity
Inverters, which are the engines of power conversion solutions, are essential components for renewable energy systems. Their primary function is to convert direct current (DC) power into alternating current (AC) power. Advanced solar Photovoltaic ("PV") inverters are emerging as the core enabling technology platform for the growth of large-scale distributed power systems. Through a combination of increased capacity, improved output quality and advanced control features, these more powerful, efficient and intelligent inverters are expected to enable a stepped improvement in both the controllability and the overall performance of solar PV production and distribution. We believe they will also be critical elements in improving the performance of future solar PV systems.
As our industry advances, we are committed to providing leadership and developing intellectual property in both the technology and the delivery model. In terms of the technology, our value-driving innovation expands beyond a component focus into building a better system architecture for energy harvest, connecting the panel to the grid. Solstice is our first example of this expanded architectural approach, and we are committed to further innovation in this category. This is what we see as our place in the smart grid—as a provider of solutions and systems that deliver smarter and faster performance on the supply side of the power grid. Our vision is to enable not only better integration of intermittent renewable resources onto the grid, but also to deliver value-added capabilities that will improve the overall performance of the grid itself. We see a future in which the inverter evolves from the electromechanical device that it is now into the digital device of the truly intelligent smart grid network. We are committed to a total systems approach for our customers, including a full range of design services and complete lifecycle management services. Both our design and lifecycle management services are unique in that they are fully localized in geography and specialized in function.
The growth in large-scale solar energy plants has created strong worldwide demand for large-scale solar PV power conversion solutions, and is driving significant innovation in the technologies that are being deployed in order to maximize system performance and grid interoperability. Industry research estimates that the global PV inverter market will grow globally at an average annual growth rate of about 10% from 2011 through 2014, with the majority of this growth expected to come from turn-key utility-scale PV inverters of 500 kW and above, which is a core competency for us.
The strong growth in our market is catalyzed by the interaction of several market trends:
- •
- Socio-political factors and energy supply-demand imbalances are creating an environment ripe for solar power
worldwide. Socio-political unrest in oil-producing countries as well as long-term macroeconomic factors such as
increasing electricity usage, power grid capacity constraints, fossil fuel price volatility, and harmful levels of pollution and greenhouse gases are driving increased demand for solar and other forms
of renewable energy.
- •
- Government incentives are accelerating growth in the power conversion market. Many countries, including Germany, France, Italy, Greece, the United States, Canada, China and India, have set policies, such as renewable portfolio standards, to achieve a certain percentage of their overall energy generation from alternative energy sources. Several countries have committed to generating at least 20 percent of their electrical energy from renewable energy sources by 2020. Governments have also enacted a variety of tax incentives and subsidies to fuel the construction of renewable energy power plants. As our power conversion systems are integral components of many renewable energy power plants, primarily solar PV plants, we expect demand for them to continue to experience growth as a direct result of these government programs.
4
- •
- Utilities are deploying large-scale PV plants which drive power conversion solution
sales. To satisfy mandates, utilities are building increasingly large renewable energy installations, often in the form of large-scale
solar PV plants. These megawatt ("MW") -size plants require the use of large-scale, high-grade power conversion systems. The technical expertise of leading power conversion
companies is becoming increasingly important as utilities become more rigorous in specifications for the systems that connect these plants to the grid.
- •
- PV module price declines are encouraging new solar installations. Solar PV power plants rely on PV arrays, a linked collection of PV modules, to convert solar energy into raw electricity. PV modules have seen significant and continual price declines in recent years due to advances in semiconductor processing technology and the increased availability of silicon, the substance used by a PV panel to generate electricity. The decreased cost of the basic building blocks of solar PV installations increases the attractiveness of solar power economics and helps catalyze the development of new solar plants, which in turn increases demand for power conversion systems.
Within this renewable energy market we believe that the fastest growth area for Satcon involves large-scale, utility-grade renewable energy and distributed power generation. These solutions require power quality control products to manage the performance of individual solar installations and monitor how it will interconnect with larger energy infrastructure (grid). In order to be commercially viable and operate effectively, these solutions must be highly reliable, efficient, and deliver the command and control performance required to profitably manage multi-megawatt solar power plants. Our intellectual property, in the form of technical expertise and innovative product offerings, uniquely positions the company to provide the next generation of large-scale, utility-grade renewable energy projects with the energy storage, power quality, and distributed power systems they will require.
Products
We deliver a full suite of power conversion solutions and services for large commercial and utility-scale renewable energy installations. We produce a broad range of products to provide the critical bridge between clean energy sources and large-scale power grids, helping companies meet the rising demand for clean energy with efficiency and profitability.
Our core solutions for renewable energy consist of utility-grade inverters for solar PV a applications. Inverters convert the DC power generated by these renewable energy sources into useable AC power. They provide the interface with the electric utility grid, an energy storage device, and end user applications. Our inverters' advanced utility-ready features enable simplified grid interconnection and can be easily integrated into supervisory control and data acquisition, or SCADA, systems through standardized communication interfaces. Our Renewable Energy Solutions product family includes the following:
- •
- PowerGate® Plus is, we believe, the world's most widely
deployed large-scale, utility-ready PV inverter with over 1.7 gigawatts sold since its introduction in 2005. PowerGate Plus increases efficiency and maximizes system uptime and power production. By
combining sophisticated system intelligence with in-depth performance monitoring, PowerGate Plus provides power plant operators with an advanced level of command and control.
- •
- Equinox™ is our next generation power conversion solution.
Equinox features superior efficiency combined with three extreme climate packages to provide power plant operators with enhanced levels of system performance and uptime and the PV industry's broadest
thermal operating range. Equinox is built on the foundation of Satcon PowerGate Plus.
- •
- Prism® is a fully integrated one MW medium voltage solution optimized for large-scale commercial and utility-scale PV installations. Incorporating advanced components and our
5
- •
- Solstice™ is the PV industry's first complete power harvesting
and array management solution for large-scale commercial and utility-scale solar PV plants. Solstice is a total system solution enabling intelligent management of the entire PV system while offering
the flexibility of localized control over every component in the array, from the panel, to a single string, to the inverter, to the grid. Solstice breaks large arrays up into smaller, controllable
increments of less than three kW and enables string-level energy harvest, which is then combined with a highly-optimized central power conversion system. A typical PV array only operates at an energy
output of the lowest performing PV panel in the array. With Solstice, power output from each string of panels is independently optimized, allowing each string to operate at its full potential all day.
The result is increased energy production from the entire array by 5-12% compared to the traditional inverter system, enabling a significant improved return on invested capital for our
customers.
- •
- Energy Equity Protection™ is our complete range of lifecycle
management services designed to help customers ensure that their system delivers optimum performance across its entire twenty-plus year life span. Energy Equity Protection includes Satcon
Design Services, APEX™ Project Management, Preventative Maintenance and Warranty Programs, and System Uptime Guarantees. Our Design Services offerings range from straightforward design
consulting to complete end-to-end system design. Our APEX Project Management services are designed to handle project planning and logistics details associated with complex
orders. Our Preventative Maintenance and Warranty Programs keep our customers' inverters running at their maximum efficiency. Our 99% System Uptime Guarantees compensate customers for lost energy
production in the case of a malfunctioning inverter. All of our services are fully localized in geography and specialized in function.
- •
- Other Legacy Power Products. We also provide static transfer switches, static voltage regulators, frequency converters and AC arc furnace line controllers from 5 kilowatts to 100 megawatts.
PowerGate Plus inverter, Prism comes ready to connect a solar PV array to the utility grid, enabling fast installation through a modular prepackaged design.
Revenues by product category for the years ended December 31, 2010, 2009 and 2008 were as follows:
| |
Year Ended December 31, | |||||||||
|---|---|---|---|---|---|---|---|---|---|---|
(Amounts in Millions)
|
2010 | 2009 | 2008 | |||||||
Product Revenue |
||||||||||
Renewable Energy Solutions |
$ | 173.3 | $ | 47.7 | $ | 52.2 | ||||
Other Legacy |
— | 4.8 | 2.1 | |||||||
Total Product Revenue |
$ | 173.3 | $ | 52.5 | $ | 54.3 | ||||
Financial Results by Business Segment
In prior years we have included segment disclosures as it related to the operations of our business units. With the sale in 2008 of our Electronics and Power Systems US business units and the classification in 2009 of our Applied Technology business unit as part of discontinued operations, since 2009 we have viewed our operations as one segment and as one business unit. Accordingly, until such time as circumstances change and we determine that we have reportable segments, we will no longer report this information. See Note S to the Consolidated Financial Statements included in this Annual Report on Form 10-K.
6
Satcon Power Conversion Solution Attributes
We strive to meet our customers' needs by providing power conversion solutions and systems that encompass the following key attributes:
- •
- Innovation. We are committed to innovation in the core
inverter technology, the complete energy harvest architecture, and the comprehensive services delivery model for our customers.
- •
- Performance. Our products use proprietary designs and
technology to ensure that high-quality power is efficiently produced in all operating conditions. Our robust designs deliver high system up-time.
- •
- Reliability. We design and manufacture
high-reliability, long-life power electronics for solar PV and fuel cell applications. We design, manufacture and test our systems for optimal performance over the entire
lifespan of the photovoltaic system. We design our products to support the long-life, always-on requirements of the power quality markets through a comprehensive suite of
programs including support services, system design services, and warranty and preventative maintenance programs.
- •
- Efficiency. We design and manufacture our products to meet
the efficiency needs of our customers as defined by their specifications and the end use of the product. The overall efficiency of a renewable power system, or its ability to deliver power with
minimum energy loss, is vital to its effective commercialization and overall profitability dynamic, and depends on the efficiency of all of its component parts. Our products continually lead in system
yield, harvest, and power production, delivering stepped improvements in PV total system output, due to our advanced state-of-the-art technologies, namely inverters
and architectures such as Solstice.
- •
- Quality. We operate with quality management systems and
are ISO 9001:2000 certified. All of our high power level inverters are Underwriter Laboratory listed as meeting their requirements for safety.
- •
- Delivery Methodology. We deliver a comprehensive range of
services, from design services to complete lifecycle management services for our customers.
- •
- Flexibility. We develop and manufacture our products for use in various renewable energy and power quality systems such as photovoltaics, fuel cells, wind turbines, micro-turbines and UPS systems. Our products are modular and scalable to meet a wide range of power requirements. Our engineers work closely with our customers to address overall systems design issues and to ensure that our products meet their system specifications. A close working relationship between the customers' engineers and our engineers is particularly important in the rapidly evolving renewable energy industry.
Sales, Marketing and Service
We sell our products and services through direct sales personnel, distributor arrangements and sales agent arrangements which comprise a global market presence for Satcon. Our direct sales staff manages our key customer accounts, regional distributors and agents, provides customer support and identifies significant market opportunities in their respective markets.
In order to maximize our customer's return on assets and investment profitability, we offer a suite of services focused on delivering optimized design and total lifecycle management. Our services provide technical support throughout the entire lifespan of a product. We believe these factors are essential to building close, long-term value for our customers, and maintaining our competitive edge.
In each core worldwide market we serve, we have a full local organization encompassing sales, inside sales, pre-sales, project management, field service, and applications engineering. This localized
7
expertise allows us to work closely with our customers to fully understand their requirements and to rapidly respond to the tough challenges that inevitably come up with any large project, ensuring the highest levels of customer satisfaction.
Strategy
Our growth strategy is to leverage our proven execution with industry-leading products, our advanced innovation capabilities, and our global commercial and manufacturing footprint to increase our market share. Our focus continues to be on the following strategies:
- •
- Develop New Technology to Broaden Our High Value
Solutions. Global trends are fueling the development of ever larger solar plants and catalyzing the rapid growth for solar power
conversion solutions. We offer the widest power range of utility-grade power conversion products for the PV industry. We believe the combination of our advanced technology, intellectual property and
industry expertise position us to develop the industry's next generation of power conversion solutions. We believe that continuing to develop new products and technologies that meet the expanding and
demanding needs of our large-scale commercial and utility-scale customers will enhance our competitive position and maximize our growth opportunities.
- •
- Expand Our International Sales and Service Footprint. We
continue to expand and deepen our sales and service operations globally as we aim to increase our market share. We are committed to establishing a large, direct local presence in the European and
Asian countries where we compete, as well as maintaining and building upon the strong relationships we have in North America. We aim to strengthen and extend our existing strategic alliances and
relationships, which may take the form of marketing, sales or distribution agreements. We are actively working to develop alliances and relationships with new partners to extend our global reach and
take advantage of growth opportunities.
- •
- Expand Our International Manufacturing Footprint. Our primary manufacturing operations take place in Ontario, Canada and Shenzhen, China. We also perform certain manufacturing functions at our facilities located in Fremont, California and Boston, Massachusetts. We currently have the capacity to produce approximately 1.5 GW of power conversion systems per year. In addition, we recently established a manufacturing relationship with GCL Solar, one of China's largest PV plant developers, which will enhance our manufacturing capacity for the Asian markets. We expect to increase our manufacturing capacity by approximately 100% by the end of 2011.
Competition
We believe that competitive performance in the marketplace for power conversion and control products depends upon several factors, including product price, technical innovation, product quality and reliability, range of products, range of services, customer service and technical support. We believe the following represent our main competitors:
- •
- Advanced Energy Industries
- •
- Markets: Renewable Energy, Solar
Equipment
- •
- Products: Solar Inverters, Power Systems
- •
- PowerOne
- •
- Markets: Renewable Energy, Power
Conversion
- •
- Products: Solar Inverters, Wind Inverters, Monitoring and Control
8
- •
- PV Powered
- •
- Markets: Renewable Energy, Grid-Tied PV
Inverters
- •
- Products: Residential Solar Inverters, Commercial Solar
Inverters
- •
- Schneider Electric
- •
- Markets: Renewable Energy, Energy
Management
- •
- Products: Solar Inverters, Automation and Control, Electrical
Distribution, Energy Efficiency
- •
- Siemens
- •
- Markets: Industrial Plant Automation, Energy,
Healthcare
- •
- Products: Solar Inverters, Communication Software, Wind
Turbines, Gas Turbines, Steam Turbines, Generators, Compressors & Trains, Fans, Fuel Gasifier, Fuel Cells, Environmental Systems
- •
- SMA Solar Technology
- •
- Markets: Renewable Energy, Solar Inverters, Energy
Systems
- •
- Products: Residential Inverters, Commercial Inverters, Solar
Plants
- •
- Sungrow Power Supply
- •
- Markets: Renewable Energy, Solar and Wind
Equipment
- •
- Products: Solar Inverters, Wind Inverters
Satcon is focused on maintaining our industry-leading position as a provider of large-scale commercial and utility-scale power solutions. Our technical innovation emphasizing product performance and reliability, supported by our commitment to strong customer service and technical support, enables us to continue to compete successfully against our competitors.
Significant Customers
In 2010, no sales to any one customer exceeded 10% of our annual revenue but there were 3 customers (GCL Solar Limited, Enel Green Power S.p.A, and CE Solar, S.R.O) that were classified as significant customers in 2010 due to their gross receivables balance at December 31, 2010 exceeding 10% of our total gross accounts receivables at December 31, 2010 (approximately 34%), and two of these customers balances were backed by irrevocable letters of credit at December 31, 2010.
There was one customer (SunPower Corporation) that was classified as a significant customer in 2009 due to sales to this customer exceeding 10% of our annual revenue (approximately 14%). In addition, there was one customer (Enfinity, NV) that was classified as a significant customer in 2009 due to its gross receivable balance at December 31, 2009 exceeding 10% of our total gross receivables at December 31, 2009 (approximately 10%).
Backlog
Our backlog consists primarily of orders for power control systems. At December 31, 2010, our backlog was approximately $103 million all of which is scheduled to be shipped during 2011. Many of our contracts and sales orders may be canceled at any time with limited or no penalty.
9
Research and Development
We believe that the continued and timely development of new products and enhancements to our existing products is necessary to maintain our competitive position. We use technologies developed by our business units, together with information supplied by our distributors and customers, to design and develop new products and product enhancements and to reduce the time-to-market for our products.
We expended approximately $15.7 million, $8.4 million, and $5.1 million on internally funded research and development during the years ended December 31, 2010, 2009 and 2008, respectively.
Manufacturing
We manufacture our products at our facilities located in Burlington, Ontario, Canada, Boston, Massachusetts, Fremont, California and through our contract manufacturing partner in Asia. Our overall manufacturing process at these facilities and with our contract manufacturer has a current production capacity of approximately 1.5 gigawatts per year.
Reducing product cost is essential to our ability to further penetrate the market with our power conversion solutions and service offerings. We believe that most of the raw materials used in our products are readily available from a variety of vendors. Additionally, we design and develop our products to use commodity parts in order to simplify the manufacturing process. We have made and expect to continue to make technological improvements that reduce the costs to manufacture our products.
Our manufacturing facilities are subject to certain environmental laws and regulations, particularly with respect to industrial waste and emissions. Compliance with these laws and regulations has not had a material impact on our capital expenditures or competitive position.
Intellectual Property
Our success and competitiveness depend on our ability to develop and maintain the proprietary aspects of our technology and operate without infringing on the proprietary rights of others. We rely on a combination of patent, trademark, trade secret and copyright law and contract restrictions to protect the proprietary aspects of our technologies. We seek to limit disclosure of our intellectual property by requiring employees, consultants and any third parties with access to our proprietary information to execute confidentiality agreements and by restricting access to that information.
As of December 31, 2010, we held approximately 48 U.S. patents and had 2 patent applications pending with the U.S. Patent and Trademark Office. The expiration dates of our patents range from 2011 to 2027, with the majority expiring after 2015.
Many of the U.S. patents described above are the result of retaining ownership of inventions made under U.S. government-funded research and development programs. As a qualifying small business, we have retained commercial ownership rights to proprietary technology developed under various U.S. government contracts and grants, including small business innovation research contracts. With respect to any invention made with government assistance, the government has a nonexclusive, nontransferable, irrevocable, paid-up license to use the technology or have the technology employed for or on behalf of the U.S. government throughout the world. Under certain conditions, the U.S. government also has "march-in rights." These rights enable the U.S. government to require us to grant a nonexclusive, partially exclusive, or exclusive license in any field of use to responsible applicants, upon terms that are reasonable under the circumstances.
10
Foreign Operations
We have foreign operations through our manufacturing facility in Burlington, Ontario, Canada and our sales and service offices in Prague, Czech Republic, Shenzhen, China and Shanghai, China.
Government Regulation
We presently are subject to various federal, state and local laws and regulations relating to, among other things, export control energy generation, safe working conditions, handling and disposal of hazardous and potentially hazardous substances and emissions of pollutants into the atmosphere. To date, we believe that we have obtained all the necessary government permits and have been in substantial compliance with all of these applicable laws and regulations.
Government Contracts
On occasion we have acted as a prime contractor or major subcontractor for different U.S. government programs that involve energy-related products. Over its lifetime, a program may be implemented by the award of many individual contracts and subcontracts, or contracts with option years, or partially funded contracts.
U.S. government contracts include provisions permitting termination, in whole or in part, without prior notice, at the U.S. government's discretion. The U.S. government generally pays compensation for work actually done and commitments made at the time of termination, and some allowance for profit on the work performed. The U.S. government may also terminate for default in performance and pay only the value delivered to the U.S. government. It can also hold the contractor responsible for re-procurement costs.
Our government contracts are also subject to specific procurement statutes and regulations and a variety of socio-economic and other factors. Failure to comply with these regulations and requirements could lead to loss of contract or suspension or disbarment from U.S. government contracting or subcontracting for a period of time. Examples of these statutes and regulations are those related to procurement integrity, export control, employment practices, the accuracy of records and the recording of costs.
Sales to the U.S. government may be affected by changes in research interests in the areas in which we engage, changing government department budgets, and changing procurement policies. With the sale of our Applied Technology business unit in January 2010 we have no significant revenues from continuing operations being derived from government contracts.
Employees
At December 31, 2010, we had a total of 340 full-time employees, 4 part-time employees and 86 contract employees. Of the total, 125 persons were employed in engineering, 167 in manufacturing, 44 in administration, 30 in field service and 64 in sales and marketing. Our future success depends in large part on the continued service of our key technical and senior management personnel, and on our ability to attract, retain and motivate qualified employees, particularly those highly skilled design, process and test engineers involved in the manufacture of existing products and the development of new products and processes. The competition for such personnel is intense, and the loss of key employees could have a material adverse effect on us. None of our employees are represented by a union. We believe that relations with our employees are good.
Reports
Our web site is www.Satcon.com. Through our web site, we make available free of charge all of our Securities and Exchange Commission, or SEC, filings, including our annual reports on Form 10-K,
11
quarterly reports on Form 10-Q, current reports on Form 8-K, and amendments to those reports, filed or furnished pursuant to Section 13(a) or 15(d) of the Securities Exchange Act of 1934, as amended, as soon as reasonably practicable after such reports are electronically filed with the SEC.
The risks described below may materially impact your investment in our company or may in the future, and, in some cases already do, materially affect us and our business, financial condition and results of operations. You should carefully consider these factors with respect to your investment in our securities. This section includes or refers to certain forward-looking statements; you should read the explanation of the qualifications and limitations on such forward-looking statements beginning on pages 4 of this report.
We have a history of operating losses, may not be able to achieve profitability and may require additional capital in order to sustain our businesses.
For each of the past ten fiscal years, we have experienced losses from operating our businesses. As of December 31, 2010, we had an accumulated deficit of approximately $243.5 million. During the year ended December 31, 2010 we had a loss from continuing operations of approximately $12.4 million. If we are unable to operate on a cash flow breakeven basis in the future, we may need to raise additional capital in order to sustain our operations. There can be no assurance that we will be able to achieve such results or to raise such funds if they are required.
We could issue additional common stock, which might dilute the book value of our common stock.
We have authorized 200,000,000 shares of our common stock, of which 117,911,278 shares were issued and outstanding as of December 31, 2010. Our board of directors has the authority, without action or vote of our stockholders in most cases, to issue all or a part of any authorized but unissued shares. Such stock issuances may be made at a price that reflects a discount from the then-current trading price of our common stock. In addition, in order to raise the capital that we may need at today's stock prices, we may need to issue securities that are convertible into or exercisable for a significant amount of our common stock. These issuances would dilute your percentage ownership interest, which would have the effect of reducing your influence on matters on which our stockholders vote, and might dilute the book value of our common stock. You may incur additional dilution of net tangible book value if holders of stock options, whether currently outstanding or subsequently granted, exercise their options or if warrant holders exercise their warrants to purchase shares of our common stock.
The sale or issuance of a large number of shares of our common stock could depress our stock price.
As of March 1, 2011, we have reserved 28,736,061shares of common stock for issuance upon exercise of stock options and warrants and 5,579,735 shares for future issuances under our stock plans. As of March 1, 2011, holders of warrants and options to purchase an aggregate of 21,576,253 shares of our common stock may exercise those securities and transfer the underlying common stock at any time subject, in some cases, to Rule 144.
The execution of our growth strategy is dependent upon the continued availability of third-party financing arrangements for our customers, and is affected by general economic conditions.
The recent recessionary condition of the general economy and limited availability of credit and liquidity could materially and adversely affect our business and results of operations. Many purchasers of our inverters and other products require financing from third-parties to finance their operations. Given the recent recession and the restricted credit markets, certain of our customers may be unable or
12
unwilling to finance the cost to purchase our products or may be forced to cancel previously submitted orders or delay taking shipment until suitable credit is again available. Collecting payment from customers facing liquidity challenges may also be difficult. These factors could materially and adversely affect our anticipated revenue and growth and, accordingly, our results of operations, cash flows and financial condition.
If we are unable to maintain our technological expertise in design and manufacturing processes, we will not be able to successfully compete.
We believe that our future success will depend upon our ability to develop and provide innovative products that meet the changing needs of our customers. This requires that we successfully anticipate and respond to technological changes in design and manufacturing processes in a cost-effective and timely manner. As a result, we continually evaluate the advantages and feasibility of new product design and manufacturing processes. We cannot, however, assure you that our process improvement efforts will be successful. The introduction of products embodying new technologies and the emergence of shifting customer demands or changing industry standards could render our existing products obsolete and unmarketable, which would have a significant impact on our ability to generate revenue. Our future success will depend upon our ability to continue to develop and introduce a variety of new products and product enhancements to address the increasingly sophisticated needs of our customers. We may experience delays in releasing new products and product enhancements in the future. Material delays in introducing new products or product enhancements may cause customers to forego purchases of our products and purchase those of our competitors.
The U.S. government has certain rights relating to our intellectual property.
Many of our patents are the result of inventions made under U.S. government-funded research and development programs. With respect to any invention made with government assistance, the government has a nonexclusive, nontransferable, irrevocable, paid-up license to use the technology or have the technology employed for or on behalf of the U.S. government throughout the world. Under certain conditions, the U.S. government also has "march-in rights," which enable the U.S. government to require us to grant a nonexclusive, partially exclusive, or exclusive license in any field of use to responsible applicants, upon terms that are reasonable under the circumstances.
Our business could be adversely affected if we are unable to protect our patents and proprietary technology.
As of March 1, 2011, we held approximately 48 U.S. patents and had 2 patent applications pending with the U.S. Patent and Trademark Office. The expiration dates of our patents range from 2011 to 2028, with the majority expiring after 2015. As a qualifying small business from our inception to date, we have retained commercial ownership rights to proprietary technology developed under various U.S. government contracts and grants.
Our patent and trade secret rights are of significant importance to us and to our future prospects. Our ability to compete effectively against other companies in our industry will depend, in part, on our ability to protect our proprietary technology and systems designs relating to our products. Although we have attempted to safeguard and maintain our proprietary rights, we do not know whether we have been or will be successful in doing so. Further, our competitors may independently develop or patent technologies that are substantially equivalent or superior to ours. No assurance can be given as to the issuance of additional patents or, if so issued, as to their scope. Patents granted may not provide meaningful protection from competitors. Even if a competitor's products were to infringe patents owned by us, it would be costly for us to pursue our rights in an enforcement action and there can be no assurance that we would be successful in enforcing our intellectual property rights. Because we intend to enforce our patents, trademarks and copyrights and protect our trade secrets, we may be
13
involved from time to time in litigation to determine the enforceability, scope and validity of these rights. This litigation could result in substantial costs to us and divert resources from operational goals. In addition, effective patent, trademark, service mark, copyright and trade secret protection may not be available in every country where we operate or sell our products. In addition, certain of our customers may request that we provide them with assurances that elements of our intellectual property be available for their use in the event that we are prevented from satisfying our service and warranty obligations to them or their customers.
We may not be able to maintain confidentiality of our proprietary knowledge.
In addition to our patent rights, we also rely on treatment of our technology as trade secrets through confidentiality agreements, which all of our employees are required to sign, assigning to us all patent rights and other intellectual property developed by our employees during their employment with us. Our employees have also agreed not to disclose any trade secrets or confidential information without our prior written consent. We also rely on non-disclosure agreement to protect our trade secrets and proprietary knowledge. These agreements may be breached, and we may not have adequate remedies for any breach. Our trade secrets may also be known without breach of these agreements or may be independently developed by competitors. Failure to maintain the proprietary nature of our technology and information could harm our results of operations and financial condition by reducing or eliminating our technological advantages in the marketplace.
Others may assert that our technology infringes their intellectual property rights.
We believe that we do not infringe the proprietary rights of others and, to date, no third parties have asserted an infringement claim against us, but we may be subject to infringement claims in the future. The defense of any claims of infringement made against us by third parties could involve significant legal costs and require our management to divert time from our business operations. If we are unsuccessful in defending any claims of infringement, we may be forced to obtain licenses or to pay royalties to continue to use our technology. We may not be able to obtain any necessary licenses on commercially reasonable terms or at all. If we fail to obtain necessary licenses or other rights, or if these licenses are costly, our operating results may suffer either from reductions in revenues through our inability to serve customers or from increases in costs to license third-party technologies.
Our success is dependent upon attracting and retaining highly qualified personnel and the loss of key personnel could significantly hurt our business.
To achieve success, we must attract and retain highly qualified technical, operational and executive employees. The loss of the services of key employees or an inability to attract, train and retain qualified and skilled employees, specifically engineering, operations and business development personnel, could result in the loss of business or could otherwise negatively impact our ability to operate and grow our business successfully.
We expect significant competition for our products and services.
Many of our competitors and potential competitors are well established and have substantially greater financial, research and development, technical, manufacturing and marketing resources than we do. Some of our competitors and potential competitors are much larger than we are. If these larger competitors decide to focus on the development of distributed power and power quality products, they have the manufacturing, marketing and sales capabilities to complete research, development and commercialization of these products more quickly and effectively than we can. There can also be no assurance that current and future competitors will not develop new or enhanced technologies perceived to be superior to those sold or developed by us. There can be no assurance that we will be successful in this competitive environment.
14
We are dependent on third-party suppliers for the supply of key components for our products.
We use third-party suppliers for components in many of our systems. From time to time, shipments can be delayed because of industry-wide or other shortages of necessary materials and components from third-party suppliers. A supplier's failure to supply components in a timely manner, or to supply components that meet our quality, quantity or cost requirements, or our inability to obtain substitute sources of these components on a timely basis or on terms acceptable to us, could impair our ability to deliver our products in accordance with contractual obligations.
We have established a contract manufacturing relationship with a Chinese supplier for certain of our inverter products.
We have entered a contract manufacturing relationship with a supplier in Asia for the manufacture of certain of our inverters as a means of reducing our costs and increasing the quality for those products, thereby enabling us to maintain a competitive advantage in the marketplace for these products. Our Asian partner, working closely with us, will in turn be developing a common Asian supply chain for the components that are incorporated into our inverters. While we believe that our Asian contract manufacturer is qualified to manufacture these inverters for us, we may need to address short-term quality and delivery scheduling issues as we develop this supply chain for these inverters. If we were to encounter significant quality or delivery schedule concerns it might materially and adversely affect our relationships with customers for these inverters and our results of operations.
If we experience a period of significant growth or expansion, it could place a substantial strain on our resources.
If our power control products continue to be successful in achieving rapid market penetration, we may be required to deliver even large volumes of technically complex products or components to our customers on a timely basis at reasonable costs to us. We have limited experience in ramping up our manufacturing capabilities to meet large-scale production requirements and delivering large volumes of our power control products. If we were to commit to deliver large volumes of our power control products, we cannot assure you that we will be able to satisfy large-scale commercial production on a timely and cost-effective basis or that such growth will not strain our operational, financial and technical resources.
Our business could be subject to product liability claims.
Our business exposes us to potential product liability claims, which are inherent in the manufacturing, marketing and sale of our products, and we may face substantial liability for damages resulting from the faulty design or manufacture of products or improper use of products by end users. We currently maintain a moderate level of product liability insurance, and there can be no assurance that this insurance will provide sufficient coverage in the event of a claim. Also, we cannot predict whether we will be able to maintain such coverage on acceptable terms, if at all, or that a product liability claim would not harm our business or financial condition. In addition, negative publicity in connection with the faulty design or manufacture of our products would adversely affect our ability to market and sell our products.
We are subject to a variety of environmental laws that expose us to potential financial liability.
Our operations are regulated under a number of federal, state and foreign environmental and safety laws and regulations that govern, among other things, the discharge or release of hazardous materials into the air and water as well as the handling, storage and disposal of these materials. These laws and regulations include the Clean Air Act, the Clean Water Act, the Resource, Conservation and Recovery Act, and the Comprehensive Environmental Response, Compensation and Liability Act, as
15
well as analogous state and foreign laws. Because we use hazardous materials in certain of our manufacturing processes, we are required to comply with these environmental laws. In addition, because we generate hazardous wastes, we, along with any other person who arranges for the disposal of our wastes, may be subject to potential financial exposure for costs associated with an investigation and remediation of sites at which we have arranged for the disposal of hazardous wastes if those sites become contaminated and even if we fully comply with applicable environmental laws. If we were found to be a responsible party, we could be held jointly and severably liable for the costs of remedial actions. To date, we have not been cited for any improper discharge or release of hazardous materials.
Businesses and consumers might not adopt alternative energy solutions as a means for obtaining their electricity and power needs.
On-site distributed power generation solutions, such as fuel cell, photovoltaic and wind turbine systems, which utilize our products, provide an alternative means for obtaining electricity and are relatively new methods of obtaining electrical power that businesses may not adopt at levels sufficient to grow this part of our business. Traditional electricity distribution is based on the regulated industry model whereby businesses and consumers obtain their electricity from a government regulated utility. For alternative methods of distributed power to succeed, businesses and consumers must adopt new purchasing practices and must be willing to rely upon less traditional means of purchasing electricity. We cannot assure you that businesses and consumers will choose to utilize on-site distributed power at levels sufficient to sustain our business in this area. The development of a mass market for our products may be impacted by many factors which are out of our control, including:
- •
- market acceptance of fuel cell, photovoltaic and wind turbine systems that incorporate our products;
- •
- the cost competitiveness of these systems;
- •
- regulatory requirements; and
- •
- the emergence of newer, more competitive technologies and products.
If a mass market fails to develop or develops more slowly than we anticipate, we may be unable to recover the losses we will have incurred to develop these products.
Reductions in government subsidies could impact revenue growth in the renewable energy markets.
Various government subsidies, including feed-in tariffs, have been a significant driver in the growth of the renewable energy industry, with countries throughout the world providing incentives to spur adoption of renewable energy. While many countries are beginning to adopt feed-in tariffs and varying subsidies, others are re-evaluating the level of incentive they wish to provide or have proposed reductions to their feed-in tariffs. Any reduction in such subsidies could result in a decline in demand and price levels for renewable energy products, which could have a material adverse effect on our business, financial condition or results of operations.
Our quarterly operating results are subject to fluctuations, and if we fail to meet the expectations of securities analysts or investors, our share price may decrease significantly.
Our annual and quarterly results may vary significantly depending on various factors, many of which are beyond our control. Because our operating expenses are based on anticipated revenue levels, our sales cycle for development work is relatively long and a high percentage of our expenses are fixed for the short term, a small variation in the timing of recognition of revenue can cause significant variations in operating results from quarter to quarter. If our earnings do not meet the expectations of securities analysts or investors, the price of our stock could decline. Also, because our sales are
16
primarily made on a purchase order basis, customers may generally cancel, reduce or postpone orders without penalty, resulting in reductions to our net sales and profitability.
We may not be able to realize our deferred tax assets.
At December 31, 2010, we had approximately $60.7 million of deferred tax assets against which we have recognized valuation allowances equal to the entire amount of such deferred tax assets. Losses for federal income tax purposes can generally be carried back two years and carried forward for a period of 20 years. In order to realize our net deferred tax assets, we must generate sufficient taxable income in such future years.
In addition, our ability to utilize net operating losses and certain other tax attributes ("NOLs") for federal and state income tax purposes would be limited if we were to experience an "ownership change," as determined under Section 382 of the Internal Revenue Code of 1986, as amended ("Section 382"). Generally, an "ownership change" relates to the cumulative change in ownership among stockholders with at least a 5% ownership interest in our common stock increase their ownership by more than 50% over a rolling three-year period. If an "ownership change" occurs, our ability to use the NOLs for income tax purposes could be limited substantially or lost altogether. This would significantly impair the value of our NOL asset and, as a result, have a negative impact on our financial position and results of operations.
In January 2011, our board of directors adopted a stockholder rights agreement designed to protect our ability to use the NOLs for income tax purposes. However, the adoption of the stockholder rights agreement cannot guarantee complete protection against an "ownership change" and it remains possible that one may occur.
Provisions in our charter documents and Delaware law and our NOL-related stockholders rights agreement may delay, deter or prevent the acquisition of Satcon, which could decrease the value of your shares.
Some provisions of our certificate of incorporation and bylaws may delay, deter or prevent a change in control of Satcon or a change in our management that you, as a stockholder, may consider favorable. These provisions include:
- •
- authorizing the issuance of "blank check" preferred stock that could be issued by our board of directors to increase the
number of outstanding shares and deter a takeover attempt;
- •
- a board of directors with staggered, three-year terms, which may lengthen the time required to gain control of
our board of directors;
- •
- prohibiting cumulative voting in the election of directors, which would otherwise allow less than a majority of
stockholders to elect director candidates; and
- •
- limitations on who may call special meetings of stockholders.
In addition, Section 203 of the Delaware General Corporation Law and provisions in some of our stock incentive plans may delay, deter or prevent a change in control of Satcon. Those provisions serve to limit the circumstances in which a premium may be paid for our common stock in proposed transactions, or where a proxy contest for control of our board may be initiated. If a change of control or change in management is delayed, deterred or prevented, the market price of our common stock could suffer.
We also have a stockholder rights plan designed to protect our ability to use our NOLs for federal and state income tax purposes. In general terms, the rights plan is intended to act as a deterrent to any person or group that acquires 4.99% or more of our common stock without approval of our board of directors by allowing other stockholders to acquire our equity securities at half of their fair value. The
17
ownership limitations in the rights plan may have the effect of inhibiting or impeding a change in control.
We are subject to stringent export laws and risks inherent in international operations.
We market and sell our products and services both inside and outside the United States. We are currently selling our products and services throughout North America and in certain countries in South America, Asia and Europe. Certain of our products are subject to the International Traffic in Arms Regulations (ITAR) 22 U.S.C 2778, which restricts the export of information and material that may be used for military or intelligence applications by a foreign person. Additionally, certain products of ours are subject to export regulations administered by the Department of Commerce, Bureau of Industry Security, which require that we obtain an export license before we can export certain products or technology. Failure to comply with these laws could result in enforcement responses by the government, including substantial monetary penalties, denial of export privileges, debarment from government contracts and possible criminal sanctions.
Revenue from sales to our international customers for the years ended December 31, 2010, 2009 and 2008 were approximately $97.2 million, $13.0 million and $7.9 million, respectively. Our success depends, in part, on our ability to expand our market for our products and services to foreign customers and our ability to manufacture products that meet foreign regulatory and commercial requirements. We have limited experience developing and manufacturing our products to comply with the commercial and legal requirements of international markets. We face numerous challenges in penetrating international markets, including unforeseen changes in regulatory requirements, export restrictions, fluctuations in currency exchange rates, longer accounts receivable cycles, difficulties in managing international operations, and the challenges of complying with a wide variety of foreign laws.
We are exposed to credit risks with respect to some of our customers.
To the extent our customers do not advance us sufficient funds to finance our costs during the execution phase of our contracts, we are exposed to the risk that they will be unable to accept delivery or that they will be unable to make payment at the time of delivery. Occasionally, we accept the risk of dealing with thinly financed entities. We attempt to mitigate this risk by seeking to negotiate more timely progress payments and utilizing other risk management procedures.
Our loan agreement with Silicon Valley Bank subjects us to various restrictions, which may limit our ability to pursue business opportunities.
Our loan agreement with Silicon Valley Bank subjects us to various restrictions on our ability to engage in certain activities without the prior written consent of the bank, including, among other things, our ability to:
- •
- dispose of or encumber assets, other than in the ordinary course of business,
- •
- incur additional indebtedness,
- •
- merge or consolidate with other entities, or acquire other businesses, and
- •
- make investments
The agreement also subjects us to various financial and other covenants with which we must comply on an ongoing or periodic basis. The financial covenant requires us to maintain certain operating results net of capital expenditures, which varies from quarter to quarter. If we violate this or any other covenant, any outstanding debt under this agreement could become immediately due and payable, the bank could proceed against any collateral securing indebtedness and our ability to borrow funds in the future may be restricted or eliminated. These restrictions may also limit our ability to
18
pursue business opportunities or strategies that we would otherwise consider to be in the best interests of the Company.
Our subordinated debt agreement subjects us to various restrictions, which may limit our ability to pursue business opportunities.
In June 2010, we entered into a subordinated loan agreement with Compass Horizon Funding Company LLC under which we incurred $12.0 million of indebtedness. The loan agreement subjects us to various restrictions on our ability to engage in certain activities without the prior written consent of the lender, including, among other things, our ability to dispose of or encumber certain assets, incur additional indebtedness, merge or consolidate with other entities, or make investments. As of December 31, 2010, $12 million remained outstanding. Beginning in March 2011 we are obligated to begin repaying the principal amount of the loan. Our ability to meet our debt obligations will depend upon future performance, which will be subject to financial, business and other factors affecting our operations, many of which are beyond our control.
The holders of our certain of our outstanding warrants have the right to put those warrants to us for cash if we issue common stock or common stock equivalents at a price per share less than $1.65.
As of March 1, 2011, we had outstanding Warrant As to purchase up to an aggregate of 556,061 shares of common stock and Warrant Cs to purchase up to an aggregate of 348,485shares of common stock. The holder of those warrants may put those warrants to us for a cash amount equal to their Black-Scholes value if we issue common stock or common stock equivalents at a price per share less than $1.65, subject to certain exceptions. These rights are exercisable for the 45-day period following any such issuance. The existence of these rights could limit our ability to raise necessary capital in the future. Furthermore, the exercise of these rights could materially impact our capital resources and materially affect our ability to fund operations.
We are responsible for maintaining the registration of the resale of shares of common stock issued upon conversion of our Series C Preferred Stock and related warrants with the SEC and will incur liquidated damages if we do not meet fulfill this obligation.
Pursuant to our agreement with the investors in the Series C Preferred Stock financing transaction, we were obligated to file a registration statement covering the resale of the common stock underlying the Series C Preferred Stock and related warrants with the SEC and cause the registration statement to be declared effective, which we completed. We are further obligated to use our best efforts to keep the registration statement effective until the earlier of (i) the date all of the securities covered by the registration statement have been publicly sold and (ii) the date all of the securities covered by the registration statement may be sold without restriction under SEC Rule 144. If we fail to comply with these or certain other provisions, then we will be required to pay liquidated damages of one twentieth of a percent (.05%) of the aggregate purchase price paid by the investors for the securities that can be registered on the registration statement for each day the failure continues. The total liquidated damages under this provision are capped at 9.9% of the aggregate purchase price paid by the investors in the private placement. Any such payments could materially affect our ability to fund operations.
As a result of the conversion of the Series C Preferred Stock, the former holders continue to have substantial voting power on matters submitted to our stockholders and to be able to exert considerable influence over the board level decision-making at our company.
As a result of the conversion of the Series C Preferred Stock on October 27, 2010, the former holders of the Series C Preferred Stock hold approximately 23% of our outstanding common stock. In addition, such holders own warrants to acquire approximately 13,414,272 shares of our common stock. Because these holders continue to own a significant percentage of our voting power, they have
19
considerable influence in determining the outcome of any corporate transaction or other matter submitted to our stockholders for approval, including the election of directors and approval of merger, consolidations and the sale of all or substantially all of our assets. In addition, these holders continue to be entitled to designate members of our board of directors and designees to serve on our board committees, enabling them to exert considerable influence over the board level decision-making at our company.
Item 1B. UNRESOLVED STAFF COMMENTS
None.
We lease office, manufacturing and research and development space in the following locations:
Location
|
Primary Use | Approximate Number of Square Feet |
Expiration of Lease |
||||||
|---|---|---|---|---|---|---|---|---|---|
Boston, MA |
Corporate headquarters and research and development | 28,000 | 2011 | ||||||
Boston, MA |
Research and development and manufacturing | 20,000 | 2016 | ||||||
Fremont, CA |
Sales and marketing | 20,000 | 2016 | ||||||
Burlington, Ontario, Canada |
Manufacturing | 60,000 | 2011 | ||||||
Prague, Czech Republic |
Sales and marketing | 5,000 | 2014 | ||||||
Shenzhen, China |
Sales and marketing | 8,000 | 2013 | ||||||
Shanghai, China |
Sales and marketing | 5,000 | 2014 | ||||||
We believe our facilities are adequate for our current needs and that adequate facilities for expansion, if required, are available. The lease on our corporate headquarters and our Canadian manufacturing facility expire in 2011; we have entered into a new lease for our corporates that expires in 2016 and we are in the process of extending the Canadian facility lease.
In the normal course of our business, we are party to various claims and suits pending for alleged damages to persons and property, alleged violations of certain laws and alleged liabilities arising out of matters occurring during the normal operation of our business.
We accrue for legal proceedings when losses become probable and reasonably estimable. As of the end of each applicable reporting period, we review each of our legal proceedings to determine whether it is probable, reasonably possible or remote that a liability has been incurred and, if it is at least reasonably possible, whether a range of loss can be reasonably estimated. In instances where we determine that a loss is probable and we can reasonably estimate a range of losses we may incur with respect to such a matter, we record an accrual for the amount within the range that constitutes our best estimate of the possible loss. If we are able to reasonably estimate a range but no amount within the range appears to be a better estimate than any other, we record an accrual in the amount that is the low end of such range. When a loss is reasonably possible but not probable we will not record an accrual but we will disclose our estimate of the possible range of loss where such estimate can be made. As of December 31, 2010, there were no accruals established related to our outstanding legal proceedings.
We offer no prediction of the outcome of any of the proceedings or negotiations described below. We are vigorously defending each of these lawsuits and claims. However, there can be no guarantee we
20
will prevail or that any judgments against us, if sustained on appeal, will not have a material adverse effect on our business, financial condition, results of operations or cash flows.
On February 17, 2011, FuelCell Energy, Inc. ("FuelCell Energy") filed a Demand for Arbitration with the American Arbitration Association seeking recovery of damages related to allegedly defective transformers that we procured for them. In its Demand for Arbitration, FuelCell Energy asserts that it is entitled to recovery of approximately $2.8 million from us. We vigorously deny the allegation that the transformers were defective, and have filed a counterclaim seeking recovery of amounts due to us from FuelCell Energy for materials and engineering services that we supplied to them totaling approximately $1.4 million. This matter is at the early stages of discovery, and we have not yet determined whether it is probable, reasonably possible or remote that we have incurred a liability.
21
Item 5. MARKET FOR REGISTRANT'S COMMON EQUITY, RELATED STOCKHOLDER MATTERS AND ISSUER PURCHASES OF EQUITY SECURITIES
Our common stock is publicly traded on the Nasdaq Capital Market under the symbol "SATC."
The following table sets forth the range of high and low sales prices of our common stock as reported on the Nasdaq Capital Market for our years ended December 31, 2009 and 2010:
| |
High | Low | |||||
|---|---|---|---|---|---|---|---|
Year ended December 31, 2009 |
|||||||
First Quarter |
$ | 1.88 | $ | 1.10 | |||
Second Quarter |
$ | 2.43 | $ | 1.64 | |||
Third Quarter |
$ | 2.27 | $ | 1.69 | |||
Fourth Quarter |
$ | 2.82 | $ | 1.86 | |||
Year ended December 31, 2010 |
|||||||
First Quarter |
$ | 2.86 | $ | 2.20 | |||
Second Quarter |
$ | 3.08 | $ | 2.25 | |||
Third Quarter |
$ | 3.84 | $ | 2.72 | |||
Fourth Quarter |
$ | 4.74 | $ | 3.40 | |||
On March 1, 2011, the last reported sale price of our common stock as reported on the Nasdaq Capital Market was $3.26 per share. As of March 1, 2011, there were 118,908,772 shares of our common stock outstanding held by approximately 225 holders of record. The number of record holders does not include beneficial owners of common stock whose shares are held in the names of banks, brokers, nominees or other fiduciaries.
Dividend Policy
We have never paid cash dividends on our common stock. We currently intend to retain earnings, if any, to fund the development and growth of our business and do not anticipate paying cash dividends for the foreseeable future. Payment of future cash dividends, if any, will be at the discretion of our board of directors after taking into account various factors, including our financial condition, operating results, current and anticipated cash needs and plans for expansion.. Finally, under our credit facility with Silicon Valley Bank, we may not pay dividends on our common stock without the consent of the Bank.
Recent Sales of Unregistered Securities
None
22
Comparative Stock Performance Graph
The comparative stock performance graph below compares the cumulative total stockholder return (assuming reinvestment of cash dividends, if any) from investing $100 on December 31, 2005, and plotted at the end of the last trading day of each fiscal year, in each of (i) the Corporation's Common Stock; (ii) the Nasdaq National Market Index of U.S. Companies (the "Nasdaq Market Index"); and (iii) a peer group index of five companies that provide similar services to those of the Corporation (Advanced Energy Industries, Inc, Power-One, Inc., Schneider Electric, SA, Siemens AG, and SMA Solar Technologies AG,) (the "Peer Group Index")).
COMPARISON OF CUMULATIVE TOTAL RETURN*
Among SatCon Technology Corporation, the NASDAQ Composite Index
and a Peer Group
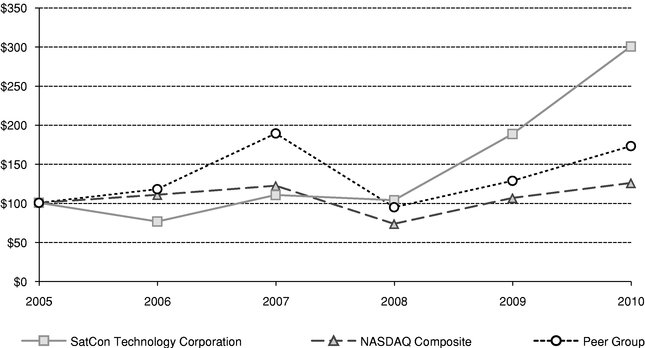
- *
- Assumes
$100 invested on 1/1/2006 in stock or index, including reinvestment of dividends.
Fiscal year ending December 31.
| |
Period Ending | ||||||||||||||||||
|---|---|---|---|---|---|---|---|---|---|---|---|---|---|---|---|---|---|---|---|
Company/Market/Peer Group
|
12/31/2005 | 12/31/2006 | 12/31/2007 | 12/31/2008 | 12/31/2009 | 12/31/2010 | |||||||||||||
SatCon Technology Corporation |
$ | 100.00 | $ | 76.00 | $ | 110.00 | $ | 103.33 | $ | 188.00 | $ | 300.00 | |||||||
NASDAQ Composite |
$ | 100.00 | $ | 110.25 | $ | 121.88 | $ | 73.10 | $ | 106.22 | $ | 125.36 | |||||||
Peer Group |
$ | 100.00 | $ | 117.43 | $ | 188.73 | $ | 94.32 | $ | 128.13 | $ | 172.54 | |||||||
23
Item 6. SELECTED CONSOLIDATED FINANCIAL DATA
You should read the data set forth below in conjunction with "Management's Discussion and Analysis of Financial Condition and Results of Operations" and our consolidated financial statements and related notes appearing elsewhere in this Annual Report on Form 10-K. The selected consolidated financial data set forth below for the years ended December 31, 2010, 2009 and 2008, and the consolidated balance sheet data as of December 31, 2010 and 2009 are derived from our audited consolidated financial statements appearing elsewhere in this Annual Report on Form 10-K. The selected consolidated statement of operations data for the year ended December 31, 2006 and 2007 and the consolidated balance sheet data as of December 31, 2007 and 2006 are derived from our audited consolidated financial statements that are not included in this Annual Report on Form 10-K. All data set forth below has been adjusted to reflect the classification of our Applied Technology business unit's assets as a discontinued operation, as the sale was finalized in the first quarter of 2010, along with the sale of our Electronics and Power Systems US business units, which were finalized in the third quarter of 2008. The results of operations for the Applied Technology, the Electronics and the Power Systems US business units are captured in the line item "Loss from discontinued operations" below. See Note D (Discontinued Operations) to the Consolidated Financial Statements included in this annual report.
| |
Year Ended December 31, | ||||||||||||||||
|---|---|---|---|---|---|---|---|---|---|---|---|---|---|---|---|---|---|
| |
2010 | 2009 | 2008 | 2007 | 2006 | ||||||||||||
Statement of Operations Data |
|||||||||||||||||
Product revenue |
$ | 173,302 | $ | 52,536 | $ | 54,293 | $ | 33,033 | $ | 14,164 | |||||||
Cost of product revenue |
129,360 | 49,334 | 45,818 | 33,456 | 13,545 | ||||||||||||
Gross margin |
43,942 | 3,202 | 8,475 | (423 | ) | 619 | |||||||||||
Operating expenses: |
|||||||||||||||||
Research and development |
15,656 | 8,411 | 5,061 | 2,256 | 611 | ||||||||||||
Selling, general and administrative |
34,564 | 18,169 | 14,575 | 7,980 | 8,129 | ||||||||||||
Restructuring charges |
784 | 261 | 1,307 | — | 1,419 | ||||||||||||
Gain on sale of assets |
— | — | — | — | (406 | ) | |||||||||||
Write-off of impaired long-lived assets |
— | — | — | — | (1,612 | ) | |||||||||||
Total operating expenses from continuing operations |
51,004 | 26,841 | 20,944 | 10,236 | 8,141 | ||||||||||||
Operating loss |
(7,062 | ) | (23,640 | ) | (12,468 | ) | (10,660 | ) | (7,522 | ) | |||||||
Change in Fair Value of Notes and Warrants |
(3,162 | ) | (5,722 | ) | 265 | (2,252 | ) | (4,192 | ) | ||||||||
Other income (expense) |
(659 | ) | (287 | ) | 707 | (546 | ) | 35 | |||||||||
Interest income |
1 | 9 | 216 | 280 | 384 | ||||||||||||
Interest expense |
(1,468 | ) | (324 | ) | (329 | ) | (3,788 | ) | (1,493 | ) | |||||||
Net loss from continuing operations |
(12,351 | ) | (29,964 | ) | (11,610 | ) | (16,965 | ) | (12,788 | ) | |||||||
Income (loss) from discontinued operations, net |
31 | 92 | (1,869 | ) | (801 | ) | (6,990 | ) | |||||||||
Gain on sale of discontinued operations, net |
500 | — | 274 | — | — | ||||||||||||
Net loss |
(11,819 | ) | (29,872 | ) | (13,205 | ) | (17,766 | ) | (19,778 | ) | |||||||
Deemed dividend and accretion on Series C preferred stock and warrants |
(7,623 | ) | (3,777 | ) | (2,849 | ) | — | — | |||||||||
Dividend on Series C Preferred Stockholders |
(1,027 | ) | (1,396 | ) | (1,376 | ) | (12,048 | ) | — | ||||||||
Net loss attributable to common stockholders |
$ | (20,469 | ) | $ | (35,045 | ) | $ | (17,429 | ) | $ | (29,814 | ) | $ | (19,778 | ) | ||
Net loss attributable to common stockholders per weighted average share, basic and diluted |
$ | (0.25 | ) | $ | (0.57 | ) | $ | (0.34 | ) | $ | (0.66 | ) | $ | (0.50 | ) | ||
Weighted average number of common shares, basic and diluted |
82,210 | 61,727 | 50,685 | 45,434 | 39,290 | ||||||||||||
| |
Year Ended December 31, | |||||||||||||||
|---|---|---|---|---|---|---|---|---|---|---|---|---|---|---|---|---|
| |
2010 | 2009 | 2008 | 2007 | 2006 | |||||||||||
| |
(in thousands) |
|||||||||||||||
Balance Sheet Data |
||||||||||||||||
Cash and cash equivalents, including restricted cash and cash equivalents |
$ | 30,094 | $ | 13,403 | $ | 10,042 | $ | 12,700 | $ | 8,275 | ||||||
Total assets |
156,063 | 48,692 | 36,897 | 46,609 | 30,577 | |||||||||||
Working capital |
69,268 | 14,530 | 12,005 | 19,616 | 6,007 | |||||||||||
Redeemable convertible Series B preferred stock |
— | 375 | 1,450 | 1,700 | 1,725 | |||||||||||
Redeemable convertible Series C preferred stock |
— | 22,257 | 17,249 | 13,276 | — | |||||||||||
Convertible subordinated debentures |
— | — | — | — | 12,740 | |||||||||||
Notes payable |
11,166 | — | — | — | — | |||||||||||
Investor warrant and placement agent warrant liability |
5,454 | 4,977 | 2,407 | 3,244 | 2,921 | |||||||||||
Other long-term liabilities, net of current portion |
11,941 | 5,812 | 2,571 | 1,679 | 108 | |||||||||||
Stockholders' equity (deficit) |
47,991 | (14,033 | ) | (9,185 | ) | 4,363 | (2,468 | ) | ||||||||
24
Item 7. MANAGEMENT'S DISCUSSION AND ANALYSIS OF FINANCIAL CONDITION AND RESULTS OF OPERATIONS
Special Note Regarding Forward-Looking Information
This Annual Report on Form 10-K, including, without limitation, this Item 7, contains or incorporates forward-looking statements within the meaning of Section 27A of the Securities Act of 1933 and Section 21E of the Securities Act of 1934. You can identify these forward-looking statements by our use of the words "believes," "anticipates," "plans," "expects," "may," "will," "intends," "estimates," and similar expressions, whether in the negative or in the affirmative. Although we believe that these forward-looking statements reasonably reflect our plans, intentions and expectations, our actual results could differ materially from the plans, intentions and expectations disclosed in the forward-looking statements we make. We have included important factors in the cautionary statements under the heading "Risk Factors" under Item 1A above that we believe could cause our actual results to differ materially from the forward-looking statements that we make. Forward-looking statements contained in this Annual Report speak only as of the date of this report. Subsequent events or circumstances occurring after such date may render these statements incomplete or out of date. We undertake no obligation and expressly disclaim any duty to update such statements.
Overview
Satcon Technology Corporation ("Satcon" or "Company") is a leading clean energy technology provider of utility-grade power conversion solutions for the renewable energy market. We design and deliver advanced power conversion solutions that enable large-scale producers of renewable energy to convert clean energy into grid-connected, efficient and reliable electrical power.
Our power conversion solutions boost total system power production through systems intelligence, advanced command and control capabilities, industrial-grade engineering and total lifecycle performance optimization. Our power conversion solutions feature the widest range of power ratings in the industry. We also offer system design services and solutions for management, monitoring, and performance measurement to maximize capital investment and improve overall quality and performance over the entire lifespan of an installation
Critical Accounting Policies and Significant Judgments and Estimates
Our discussion and analysis of our financial condition and results of our operations are based on our consolidated financial statements, which have been prepared in accordance with accounting principles generally accepted in the United States of America. The preparation of these consolidated financial statements requires management to make significant estimates and assumptions that affect the reported amounts of assets and liabilities and the disclosure of contingent assets and liabilities at the date of the financial statements and the reported revenue and expenses during the reporting periods. On an ongoing basis, management evaluates its estimates and judgments, including those related to revenue recognition, receivable reserves, inventory reserves, intangible assets, contract losses, warranty reserves and income taxes. Management bases its estimates on historical experience and on various other factors that are believed to be reasonable under the circumstances, the results of which form the basis for making judgments about the carrying value of assets and liabilities that are not readily apparent from other sources. Actual results may differ from these estimates under different assumptions or conditions. Our critical accounting estimates were discussed with our Audit Committee.
25
The significant accounting policies that management believes are most critical to aid in fully understanding and evaluating our reported financial results include the following:
Revenue Recognition
We recognize revenue from product sales when there is persuasive evidence of an arrangement, the fee is fixed or determinable, delivery of the product to the customer has occurred and we have determined that collection of the fee is probable. Title to the product passes upon shipment of the product, as the products are typically shipped FOB shipping point, except for certain foreign shipments. If the product requires installation to be performed by us, all revenue related to the product is deferred and recognized upon the completion of the installation. If the product requires specific customer acceptance, revenue is deferred until customer acceptance occurs or the acceptance provisions lapse, unless we can objectively and reliably demonstrate that the criteria specified in the acceptance provisions are satisfied. When appropriate, we provide for a warranty reserve at the time the product revenue is recognized. If a contract involves the provision of multiple elements and the elements qualify for separation, total estimated contract revenue is allocated to each element based on the relative fair value of each element provided. The amount of revenue allocated to each element is limited to the amount that is not contingent upon the delivery of another element in the future. Revenue is recognized on each element as described above.
On occasion we enter into fixed-price contracts for which; revenue is generally recognized on the percentage of completion method based upon the proportion of costs incurred to the total estimated costs for the contract. Revenue from reimbursement contracts is recognized as services are performed. In each type of contract, we receive periodic progress payments or payment upon reaching interim milestones and retain the rights to the intellectual property developed in government contracts. All payments to us for work performed on contracts with agencies of the U.S. government are subject to audit and adjustment by the Defense Contract Audit Agency. Adjustments are recognized in the period made. When the current estimates of total contract revenue and contract costs for product development contracts indicate a loss, a provision for the entire loss on the contract is recorded. For the years ended December 31, 2010 and 2009 there have been no provisions for anticipated contract losses on commercial contracts. We expect revenue from the percentage of completion type contracts or from cost reimbursement contracts in future periods to be nominal.
Cost of product revenue includes material, labor and overhead.
Deferred revenue consists of payments received from customers in advance of services performed, product shipped or installation completed. When an item is deferred for revenue recognition purposes, the deferred revenue is recorded as a liability and the deferred costs are recorded as a component of inventory in our consolidated balance sheets. Deferred revenue also consists of cash received for extended product warranties.
Unbilled contract costs and fees represent revenue recognized in excess of amounts billed due to contractual provisions or deferred costs that have not yet been recognized as revenue or billed to the customer.
Accounts Receivable
Accounts receivable are reduced by an allowance for amounts that may become uncollectible in the future. The estimated allowance for uncollectible amounts is based primarily on a specific analysis of accounts in the receivable portfolio and historical write-off experience. While management believes the allowance to be adequate, if the financial condition of our customers were to deteriorate, resulting in impairment of their ability to make payments, additional allowances may be required.
26
Inventory
We value our inventory at the lower of actual cost to purchase and/or manufacture the inventory or the current estimated market value of the inventory, and costs are determined based on the first-in, first-out method of accounting and include material, labor and manufacturing overhead costs. We periodically review inventory quantities on hand and record a provision for excess and/or obsolete inventory within cost of product revenue based primarily on our historical usage, as well as based on estimated forecast of product demand. A significant decrease in demand for our products could result in a short-term increase in the cost of inventory purchases and an increase of excess inventory quantities on hand. In addition, our industry is characterized by rapid technological change, frequent new product development, and rapid product obsolescence that could result in an increase in the amount of obsolete inventory quantities on hand. Therefore, although we make every effort to ensure the accuracy of our forecasts of future product demand, any significant unanticipated changes in demand or technological developments could have a significant impact on the value of our inventory and our reported operating results.
Warranty
We offer warranty coverage for our products for period of 5 years after shipment. We estimate the anticipated costs of repairing products under warranty based on the historical or expected cost of the repairs and expected failure rates. The assumptions used to estimate warranty accruals are re-evaluated quarterly, at a minimum, in light of actual experience and, when appropriate, the accruals or the accrual percentage is adjusted based on specific estimates of project repair costs and quantity of product returns. Our determination of the appropriate level of warranty accrual is based on estimates of the percentage of units affected and the repair costs. Estimated warranty costs are recorded at the time of sale of the related product, and are recorded within cost of sales in the consolidated statements of operations.
Warrant Liabilities
We determined the fair values of the investor warrants and placement agent warrants using valuation models we consider to be appropriate. Our stock price has the most significant influence on the fair value of the warrants. An increase in our common stock price would cause the fair values of warrants to increase, because the exercise prices of such instruments are fixed at $1.815 per share, and result in a charge to our statement of operations. A decrease in our stock price would likewise cause the fair value of the warrants to decrease and result in a credit to our statement of operations.
Income Taxes
The preparation of our consolidated financial statements requires us to estimate our income taxes in each of the jurisdictions in which we operate, including those outside the United States, which may be subject to certain risks that ordinarily would not be expected in the United States. The income tax accounting process involves estimating our actual current exposure together with assessing temporary differences resulting from differing treatment of items, such as deferred revenue, for tax and accounting purposes. These differences result in the recognition of deferred tax assets and liabilities. We must then record a valuation allowance to reduce our deferred tax assets to the amount that is more likely than not to be realized.
Significant management judgment is required in determining our provision for income taxes, our deferred tax assets and liabilities and any valuation allowance recorded against deferred tax assets. We have recorded a full valuation allowance against our deferred tax assets of approximately $59.8 million as of December 31, 2010, due to uncertainties related to our ability to utilize these assets. The valuation allowance is based on our estimates of taxable income by jurisdiction in which we operate
27
and the period over which our deferred tax assets will be recoverable. In the event that actual results differ from these estimates or we adjust these estimates in future periods we may need to adjust our valuation allowance which could materially impact our financial position and results of operations.
We account for income taxes utilizing the asset and liability method for accounting and reporting for income taxes. Under this method, deferred tax assets and deferred tax liabilities are recognized based on temporary differences between the financial reporting and income tax basis of assets and liabilities using statutory rates. In addition, we are required to establish a valuation allowance against net deferred tax assets if, based upon the available evidence, it is more likely than not that some or all of the deferred tax assets will not be realized.
The tax years 1996 through 2010 remain open to examination by major taxing jurisdictions to which we are subject, which are primarily in the United States, as carry forward attributes generated in years past may still be adjusted upon examination by the Internal Revenue Service or state tax authorities if they are or will be used in a future period. We are currently not under examination by the Internal Revenue Service or any other jurisdiction for any tax years. We did not recognize any interest and penalties associated with unrecognized tax benefits in the accompanying financial statements. We would record any such interest and penalties as a component of interest expense. We do not expect any material changes to the unrecognized benefits within 12 months of the reporting date.
Redeemable Convertible Series B Preferred Stock
We initially accounted for our Series B Preferred Stock and associated warrants by allocating the proceeds received net of transaction costs based on the relative fair value of the redeemable convertible Series B Preferred Stock and the warrants issued to the investors, and then to any beneficial conversion rights contained in the convertible redeemable preferred securities. We determined the initial value of the Series B Preferred Stock and investor warrants using valuation models we consider to be appropriate. Prior to its conversion in October 2010, the Series B Preferred Stock had been classified within the liability section of our balance sheet.
Redeemable Convertible Series C Preferred Stock
Prior to the conversion of all the outstanding shares of the Series C Preferred Stock in October 2010, we initially accounted for the issuance of our Series C Preferred Stock and associated warrants by allocating the proceeds received net of transaction costs based on the relative fair value of the redeemable convertible Series C Preferred Stock and the warrants issued to the investors, and then to any beneficial conversion rights contained in the convertible redeemable preferred securities and classifying the Series C Preferred Stock as temporary equity on the balance sheet between the captions for liabilities and permanent shareholder's equity. We determined the initial value of the Series C Preferred Stock and investor warrants using valuation models we consider to be appropriate.
The re-pricing of the exercise price of the warrants issued in the first closing of the Series C Preferred Stock financing from $1.44 to $1.25, as described in Note I to our Notes to the Consolidated Financial Statements included in this Annual Report on Form 10-K, was treated as a cancellation of the original warrants issued on November 8, 2007 and a re-issuance or new warrants on December 21, 2007. The difference in fair value of the warrant was included in the allocation of net proceeds associated with the second closing of the Series C Preferred Stock on December 21, 2007. We treated this as a deemed dividend on the Series C Preferred Stock. As of December 31, 2007 we recorded $11,947,881 as a deemed dividend to the holders of the Series C Preferred Stock, which included the beneficial conversion feature of $11,762,887 and $184,994 related to the accretion of the Series C Preferred Stock to its redemption value through the date that the holders of the Series C Preferred Stock may first exercise their redemption right. Prior to the conversion of the Series C Preferred Stock in October 2010, we were using the effective interest method to accrete the carrying value of the
28
Series C Preferred stock through November 8, 2011, at which time the value of the Series C Preferred Stock would have been $30.0 million, 120% of its face value.
Recent Accounting Pronouncements
See Note U of our Notes to Consolidated Financial Statements included in this Annual Report on Form 10-K for information regarding recently issued accounting pronouncements.
Results of Operations
All data set forth below have been adjusted to reflect the sale of our Electronics, Power Systems US, and Applied Technology business units. The results of these were captured in "Loss from discontinued operations." See Note D (Discontinued Operations) to the Consolidated Financial Statements included in this Annual Report on Form 10-K.
Year Ended December 31, 2010 ("2010") Compared to the Year Ended December 31, 2009 ("2009").
Revenue. Total Company revenue increased $120.8 million, or 230%, from $52.5 million in 2009 to $173.3 million in 2010.
| |
Year Ended December 31, |
|
|
||||||||||
|---|---|---|---|---|---|---|---|---|---|---|---|---|---|
(Amounts in Millions)
|
2010 | 2009 | Change $ | % Change | |||||||||
Product Revenue |
|||||||||||||
Renewable Energy Solutions |
$ | 173.3 | $ | 47.7 | $ | 125.6 | 263 | % | |||||
Other Legacy |
— | 4.8 | (4.8 | ) | (100 | )% | |||||||
Total Revenue |
$ | 173.3 | $ | 52.5 | $ | 120.8 | 230 | % | |||||
Renewable Energy Solutions revenue increased by $125.6 million, or 263%, from $47.7 million in 2009 to $173.3 million in 2010. This increase was due to the broad market acceptance of our products domestically and overseas. This increase was partially offset by a decrease in our legacy power products offerings of $4.8 million, or 100%, due to the recognition of revenue on previously delivered legacy products in the early part of 2009.
Gross Margin. Total Company gross margin increased from 6.1% in 2009 to 25.4% in 2010 due to increased volumes during the period, lower material costs on many of our core products, as compared to prior years and the continued expansion of our manufacturing capacity and international supply chain. In addition we continue to see continuous improvements in our labor efficiency across our manufacturing facilities. In addition, approximately $4.2 million of deferred frequency converter revenues recognized during 2009 had no gross margin as the amount recognized as revenue equaled the related costs recognized for the period.
Research and development expenses. We expended approximately $15.7 million on research and development in 2010 compared with $8.4 million spent in 2009. The increase in spending during 2010 was driven by a planned increase in costs associated with certification of our new products and continued new product development, including increases in our technical staffing. These additional resources are developing the new products, features and customer solutions which we believe will allow us to take advantage of both short-term and long-term market opportunities. This investment in research and development is critical to both our current and future success and we anticipate continued investment in this area.
Selling, general and administrative expenses. Selling, general and administrative expenses increased by approximately $16.4 million from $18.2 million in 2009 to $34.6 million in 2010. Approximately
29
$11.3 million of the increase was due to the higher sales and marketing costs related to international business development expansion into Europe and Asia, company re-branding and our increased marketing efforts in 2010 compared to 2009. Approximately $4.3 million of the increase was due to higher corporate costs. Approximately $0.8 million of the increase is directly attributable to compensation costs related to the issuance of stock options to our employees and directors.
Restructuring costs. In August 2009, we eliminated certain positions within our operations and sales organizations in accordance with a plan of reorganization approved by the Board of Directors. As a result of the 2009 restructuring we recorded approximately $0.3 million in payroll and related costs for 2009. During 2010, in accordance with the plan of reorganization approved by the Board of Directors, we recorded approximately $0.8 million in payroll and related costs for 2010. As of December 31, 2010 and 2009 approximately $49,000 and $38,000, respectively, remained to be paid to the terminated employees. None of the terminated employees were required to provide any services subsequent to their receiving notification.
Change in fair value of warrant liabilities. The change in fair value of the warrants for 2010 was a charge of approximately $3.2 million and was related solely to the change in valuation of our Warrant As, Warrant Cs and placement agent warrants. The change in fair value of the warrants for 2009 was a charge of approximately $5.7 million. In 2009, approximately $2.5 million related to the change in valuation of our Warrant As, Warrant Cs and placement agent warrants, and the remaining $3.2 million charge related to our Series C Preferred Stock warrants and their change in fair value which was due to our adoption of ASC 815-40-15 during the period. As a result of this adoption, warrants to purchase 19,799,023 shares of our common stock, originally classified as equity, were reclassified to warrant liabilities and were required to be fair valued moving forward. In July 2009 warrants to purchase 19,799,023 shares of our common stock were modified resulting in these warrants being classified as equity and therefore not requiring any fair value adjustments in the future. See Note C. Significant Accounting Policies and Basis of Presentation—Warrant Liabilities for a description of the modifications made to such warrants. The most significant factor that contributes to the change in fair value of the warrants is our stock price (See Note G—Warrant Liabilities).
Other Income (expense). Other expense was approximately $0.7 million for 2010 compared to other expense of approximately $0.3 million for 2009. Other expense for 2010 consisted primarily of approximately $0.6 million related to foreign exchange impact of operations and translation of inter-company balances and approximately $0.1 million related to the other expenses not related to ongoing operations. Other expense for 2009 consists primarily of approximately $0.5 million related to the issuance of warrants to purchase 380,000 shares of common stock to holders of our Series C Preferred Stock for modifying the anti-dilution provisions of their existing warrants along with $0.1 million in fees and other expenses not related to ongoing operations, offset by approximately $0.5 million related to foreign exchange impact of operations and translation of inter-company balances.
Interest income. Interest income was approximately $0 million in 2010 and 2009.
Interest expense. Interest expense for 2010 was approximately $1.5 million, which is comprised primarily of the following:
- •
- $0.8 million in cash interest relating to our subordinated debt agreement and $0.3 million in
non-cash accretion on our subordinated debt agreement and
- •
- $0.4 million in cash interest relating to our credit facility
In 2009 interest expense was approximately $0.3 million and was comprised of the following:
- •
- $0.2 million in cash interest relating to our credit facility and
30
- •
- $0.1 million of non-cash interest associated with dividends on the Series B Preferred Stock, which were paid in shares of common stock.
Income (loss) from discontinued operations. Income (loss) from discontinued operations represents the results of operations of our Applied Technology, Power Systems US and Electronics divisions. Our Applied Technology division was sold in January 2010 and our Electronics and Power Systems US divisions were sold during the third quarter of 2008. The income from discontinued operations for 2010 was approximately $30,000 and for 2009 was approximately $0.1 million. See Note D "Discontinued Operations" of our Consolidated Financial Statements included in this Annual Report on Form 10-K for more information related to the sale of these divisions.
Gain on sale of discontinued operations. As a result of the sale of our Applied Technology division in 2010, we recorded a gain of approximately $0.5 million. See Note D "Discontinued Operations" of our Consolidated Financial Statements included in this Annual Report on Form 10-K for more information related to the sale of the Applied Technology division and the composition of the net gain calculated.
Deferred Revenue. Total deferred revenue was $19.7 million at December 31, 2010, comprised of $8.1 million of current deferred revenue and $11.6 million of long-term deferred revenue, an increase of $13.7 million from the $6.0 million balance at December 31, 2009. We record deferred revenue (i) when a customer pays in advance or (ii) when provisions for revenue recognition on items shipped have not been achieved or the items have not yet been received by the customer due to shipping terms such as FOB destination. When an item is deferred for revenue recognition purposes, the deferred revenue is recorded as a liability and the deferred costs are recorded as a component of inventory in our consolidated balance sheets. Deferred revenue also consists of cash received for extended product warranties. Currently deferred revenue is composed of approximately $8.1 million related to pre-payments on orders currently being manufactured and $11.6 million on deferred revenue related to extended warranties sold to customers that purchased our products.
Year Ended December 31, 2009 ("2009") Compared to the Year Ended December 31, 2008 ("2008").
Revenue. Total Company revenue decreased $1.8 million, or 3%, from $54.3 million in 2008 to $52.5 million in 2009.
| |
Year Ended December 31, |
|
|
||||||||||
|---|---|---|---|---|---|---|---|---|---|---|---|---|---|
(Amounts in Millions)
|
2009 | 2008 | Change $ | % Change | |||||||||
Product Revenue |
|||||||||||||
Renewable Energy Solutions |
$ | 47.7 | $ | 52.2 | $ | (4.5 | ) | (9 | )% | ||||
Other Legacy |
4.8 | 2.1 | 2.7 | 129 | % | ||||||||
Total Revenue |
$ | 52.5 | $ | 54.3 | $ | (1.8 | ) | (3 | )% | ||||
Renewable Energy Solutions revenue decreased by $4.5 million, or 9%, from $52.2 million in 2008 to $47.7 million in 2009. This decrease was driven by the challenging macroeconomic market conditions and tough credit markets which affect our customers' ability to fund large scale renewable energy projects. This decrease was partially offset by an increase in our legacy power products offerings of $2.7 million, or 129%, due to the recognition of revenue on previously delivered legacy products in the early part of 2009. We expect legacy product revenue to decline as we continue to focus efforts on our renewable energy solutions.
Gross Margin. Total Company gross margin decreased from 15.6% in 2008 to 6.1% in 2009 due to lower volumes during the period and transition costs associated with expanding our manufacturing and supply chain internationally while maintaining existing capacity in North America. This global capacity
31
expansion and low cost supply chain are crucial to our long term competitiveness, and were partially offset by material cost reductions and labor efficiency improvements in both factories. In addition, the $4.2 million of deferred frequency converter revenues recognized during 2009 had no gross margin as the amount recognized as revenue equaled the related costs recognized for the period.
Research and development expenses. We expended approximately $8.4 million on research and development in 2009 compared with $5.1 million spent in 2008. The increase in spending during 2009 was driven by a planned increase in costs associated with certification of our new products and continued new product development, including increases in our technical staffing. These additional resources are developing the new products, features and customer solutions which we believe will allow us to take advantage of both short-term and long-term market opportunities. This investment in research and development is critical to both our current and future success and we anticipate this level of investment to continue.
Selling, general and administrative expenses. Selling, general and administrative expenses increased by approximately $3.6 million from $14.6 million in 2008 to $18.2 million in 2009. Approximately $0.9 million of the increase is directly attributable to compensation costs related to the issuance of stock options to our employees and directors charged to operations. Approximately $3.3 million of the increase was due to the higher sales and marketing costs related to international business development expansion into Europe and Asia, company re-branding and our increased outbound marketing efforts in 2009 compared to 2008. This was partially offset by a $0.6 million decrease in general corporate costs.
Restructuring costs. In August 2009, we eliminated certain positions within our operations and sales organizations in accordance with a plan of reorganization approved by the Board of Directors. As a result of the 2009 restructuring we recorded approximately $0.3 million in payroll and related costs for 2009. As of December 31, 2009 approximately $38,000 remained to be paid to the terminated employees. None of the terminated employees were required to provide any services subsequent to their receiving notification.
In 2008, we initiated and completed the sale of the Electronics and Power Systems US operating divisions and formalized the release of personnel. As a result of these changes and the sale of the divisions in 2008, we accrued approximately $0.5 million in salary-related costs, costs associated with the modification of existing options held by certain of the severed employees and relocation costs. Other costs associated with the restructuring that are related to the Electronics and Power Systems US divisions were recorded in their respective divisions and are included in the loss from discontinued operations for the periods presented, as discussed below, in loss from discontinued operations.
Change in fair value of warrant liabilities. The change in fair value of the warrants for 2009 was a charge of approximately $5.7 million. Approximately $2.5 million related to the change in valuation of our Warrant As, Warrant Cs and placement agent warrants. The remaining $3.2 million charge related to our Series C Preferred Stock warrants and their change in fair value which was due to our adoption of ASC 815-40-15 during the period. As a result of this adoption, warrants to purchase 19,799,023 shares of our common stock, originally classified as equity, were reclassified to warrant liabilities and were required to be fair valued moving forward. The change in fair value of the warrants for 2008 was a credit of approximately $0.3 million related solely to the Warrant As and Warrant Cs. In July 2009 warrants to purchase 19,799,023 shares of our common stock were modified resulting in these warrants being classified as equity and therefore not requiring any fair value adjustments in the future. See Note C. Significant Accounting Policies and Basis of Presentation—Warrant Liabilities for a description of the modifications made to such warrants. The most significant factor that contributes to the change in fair value of the warrants is our stock price (See Note G—Warrant Liabilities).
Other Income (expense). Other expense was approximately $0.3 million for 2009 compared to other income of approximately $0.7 million for 2008. Other expense for 2009 consists primarily of
32
approximately $0.5 million related to the issuance of warrants to purchase 380,000 shares of common stock to holders of our Series C Preferred Stock for modifying the anti-dilution provisions of their existing warrants along with $0.1 million in fees paid related to consulting services for the valuation of our warrant instruments as well as other expenses not related to ongoing operations, offset by approximately $0.5 million related to foreign exchange impact of operations and translation of inter-company balances. Other income, net for 2008 consists primarily of approximately $0.7 million related to foreign exchange impact of operations and translation of inter-company balances.
Interest income. Interest income decreased from approximately $0.2 million in 2008 to approximately $0 in 2009. The decrease is directly attributable to our cash on hand and interest rates.
Interest expense. Interest expense for 2009 was approximately $0.3 million, which is comprised primarily of the following:
- •
- $0.2 million in cash interest relating to our credit facility and
- •
- $0.1 million of non-cash interest associated with dividends on the Series B Preferred Stock, which were paid in shares of common stock.
In 2008 interest expense was approximately $0.3 million and was comprised of the following:
- •
- $0.2 million in cash interest relating to our credit facility and
- •
- $0.1 million of non-cash interest associated with dividends on the Series B Preferred Stock, which were paid in shares of common stock.
Income (loss) from discontinued operations. Loss from discontinued operations represents the results of operations of our Applied Technology, Power Systems US and Electronics divisions. Our Applied Technology division was sold in January 2010 and our Electronics and Power Systems US divisions were sold during the third quarter of 2008. The income from discontinued operations for 2009 was approximately $0.1 million as compared to a loss from discontinued operations of approximately $1.9 million in 2008. See Note D "Discontinued Operations" of our Consolidated Financial Statements included in this Annual Report on Form 10-K for more information related to the sale of these divisions.
Gain on sale of discontinued operations. As a result of the sale of the Power Systems US and Electronics divisions in 2008, we recorded income of approximately $0.3 million. See Note D "Discontinued Operations" for more information related to the sale of these divisions and the composition of the net gain calculated for each division. The gain on the sale of our Applied Technology division will be recorded during our first quarter ended March 31, 2010.
Deferred Revenue. Total deferred revenue was $6.0 million at December 31, 2009, comprised of $0.5 million of current deferred revenue and $5.5 million of long-term deferred revenue, a decrease of $0.7 million from the $6.7 million balance at December 31, 2008. We record deferred revenue (i) when a customer pays in advance or (ii) when provisions for revenue recognition on items shipped have not been achieved or the items have not yet been received by the customer due to shipping terms such as FOB destination. When an item is deferred for revenue recognition purposes, the deferred revenue is recorded as a liability and the deferred costs are recorded as a component of inventory in our consolidated balance sheets. Deferred revenue also consists of cash received for extended product warranties. Currently deferred revenue is composed of approximately $6.0 million, $0.4 million related to pre-payments on orders currently being manufactured and $5.6 million on deferred revenue related to extended warranties sold to customers that purchased our products.
33
Quarterly Results of Operations (Unaudited)
The following table presents unaudited quarterly statement of operations data for the eight quarters ended December 31, 2010. This data has been prepared on a basis consistent with our audited consolidated financial statements included elsewhere in this Annual Report on Form 10-K. This data includes all adjustments, consisting solely of normal recurring adjustments, which we believe necessary for a fair presentation of this information. The operating results for any quarter are not necessarily indicative of results to be expected for any future period. In addition, all data set forth below has been adjusted to reflect the sale of our Applied Technology business unit in January 2010. The results of operations for the Applied Technology are captured in the line item "Loss from discontinued operations" below. See Note D (Discontinued Operations) to the Consolidated Financial Statements included in this Annual Report on Form 10-K.
| |
CONSOLIDATED Three Months Ended |
|||||||||||||||||||||||||
|---|---|---|---|---|---|---|---|---|---|---|---|---|---|---|---|---|---|---|---|---|---|---|---|---|---|---|
| |
Dec. 31, 2010 |
Sept. 30, 2010 |
June 30, 2010 |
Mar. 31, 2010 |
Dec. 31, 2009 |
Oct. 3, 2009 |
July 4, 2009 |
April 4, 2009 |
||||||||||||||||||
| |
(in thousands, except per share data) |
|||||||||||||||||||||||||
Statement of Operations Data |
||||||||||||||||||||||||||
Product revenue |
$ | 72,560 | $ | 58,382 | $ | 27,627 | $ | 14,732 | $ | 21,487 | $ | 10,041 | $ | 7,628 | $ | 13,380 | ||||||||||
Cost of product revenue |
52,093 | 42,678 | 21,890 | 12,699 | 18,648 | 10,466 | 7,935 | 12,285 | ||||||||||||||||||
Gross margin (loss) |
20,467 | 15,704 | 5,737 | 2,033 | 2,840 | (425 | ) | (308 | ) | $ | 1,095 | |||||||||||||||
Operating expenses: |
||||||||||||||||||||||||||
Research and development |
5,893 | 4,320 | 2,711 | 2,732 | 2,108 | 2,188 | 2,244 | 1,871 | ||||||||||||||||||
Selling, general and administrative |
11,024 | 9,677 | 8,282 | 5,580 | 4,791 | 4,612 | 4,418 | 4,348 | ||||||||||||||||||
Restructuring charges |
— | — | — | 784 | 49 | 211 | — | — | ||||||||||||||||||
Total operating expenses from continuing operations |
16,917 | 13,998 | 10,994 | 9,095 | 6,949 | 7,010 | 6,662 | $ | 6,220 | |||||||||||||||||
Operating income (loss) |
3,550 | 1,706 | (5,256 | ) | (7,062 | ) | (4,109 | ) | (7,436 | ) | (6,970 | ) | $ | (5,125 | ) | |||||||||||
Change in fair value of notes and warrants |
(2,124 | ) | (1,269 | ) | (858 | ) | 1,089 | (1,822 | ) | (305 | ) | 1,776 | (5,370 | ) | ||||||||||||
Other income (expense) |
(680 | ) | 340 | (251 | ) | (68 | ) | (45 | ) | 384 | (487 | ) | (139 | ) | ||||||||||||
Interest income |
1 | — | — | — | — | 3 | 2 | 4 | ||||||||||||||||||
Interest expense |
(550 | ) | (628 | ) | (226 | ) | (63 | ) | (65 | ) | (39 | ) | (138 | ) | (82 | ) | ||||||||||
Net income (loss) from continuing operations |
196 | 149 | (6,591 | ) | (6,104 | ) | (6,042 | ) | (7,393 | ) | (5,816 | ) | $ | (10,713 | ) | |||||||||||
Income (loss) from discontinued operations, net |
— | — | — | 31 | 15 | 135 | (17 | ) | (42 | ) | ||||||||||||||||
Gain on sale of discontinued operations, net |
— | — | — | 500 | — | — | — | — | ||||||||||||||||||
Net income (loss) |
196 | 149 | (6,591 | ) | (5,573 | ) | (6,027 | ) | (7,257 | ) | (5,833 | ) | $ | (10,754 | ) | |||||||||||
Deemed dividend and accretion on Series C preferred stock to redemption value |
(3,282 | ) | (1,429 | ) | (1,596 | ) | (1,317 | ) | (1,235 | ) | (978 | ) | (888 | ) | (821 | ) | ||||||||||
Dividend on Series C preferred stock |
(92 | ) | (315 | ) | (312 | ) | (308 | ) | (222 | ) | (320 | ) | (387 | ) | (321 | ) | ||||||||||
Net loss attributable to common stockholders |
$ | (3,178 | ) | $ | (1,595 | ) | $ | (8,499 | ) | $ | (7,198 | ) | $ | (7,484 | ) | $ | (8,556 | ) | $ | (7,108 | ) | $ | (11,897 | ) | ||
Net loss attributable to common stockholders per weighted average share, basic and diluted |
$ | (0.03 | ) | $ | (0.02 | ) | $ | (0.12 | ) | $ | (0.10 | ) | $ | (0.11 | ) | $ | (0.12 | ) | $ | (0.13 | ) | $ | (0.23 | ) | ||
Weighted average number of common shares, basic and diluted |
110,940 | 75,468 | 71,512 | 70,921 | 70,412 | 70,240 | 54,718 | 51,538 | ||||||||||||||||||
34
Liquidity and Capital Resources
As of December 31, 2010, we had $30.1 million of cash, all of which was unrestricted. As of December 31, 2010, $15.0 million was outstanding under our line of credit.
Based upon our current working capital position, current operating plans and expected business conditions, we believe that our current cash, and our asset based financing options, will be adequate to fund our operations through December 31, 2011. Beyond 2011, we expect to fund our working capital needs and other commitments primarily through our operating cash flow, which we expect to improve as our product costs continue to decrease and as our unit volumes continue to grow. We also expect to use our credit facility to fund a portion of our capital needs and other commitments. Subsequent to year end we repaid all amounts outstanding on the line of credit. We have availability under our line of credit of $15.0 million as of March 1, 2011.
Our funding plans for our working capital needs and other commitments may be adversely impacted if we fail to realize our underlying assumed levels of revenues and expenses, or if we fail to remain in compliance with the covenants of our bank line and subordinated debt. If either of those events occur, we may need to raise additional funds in order to sustain operations by selling equity or taking other actions to conserve our cash position, which could include selling of certain assets, delaying capital expenditures and incurring additional indebtedness, subject to the restrictions in the credit facility with Silicon Valley Bank. Such actions would likely require the consent of Silicon Valley Bank and/or the lender of our subordinated debt, and there can be no assurance that such consents would be given. Furthermore, there can be no assurance that we will be able to raise such funds if they are required.
If additional funds are raised in the future through the issuance of equity or convertible debt securities, the percentage ownership of our stockholders will be reduced and our stockholders will experience additional dilution. The terms of additional funding may also limit our operating and financial flexibility. There can be no assurance that additional financing of any kind will be available to us on terms acceptable to us, or at all. Failure to obtain future funding when needed or on acceptable terms would materially, adversely affect our results of operations.
We have incurred significant costs to develop our technologies and products. These costs have exceeded total revenue. As a result, we have incurred losses in each of the past five years. As of December 31, 2010, we had an accumulated deficit of approximately $243.5 million. Since inception, we have financed our operations and met our capital expenditure requirements primarily through the sale of private equity securities and convertible debt, public security offerings, borrowings under our lines of credit and capital equipment leases.
As of December 31, 2010, our cash and cash equivalents were $30.1 million; this represents an increase in our cash and cash equivalents of approximately $16.7 million from the $13.4 million on hand at December 31, 2009. Cash used in operating activities from continuing operations for the year ended December 31, 2010 was $46.9 million as compared to $14.7 million for the year ended December 31, 2009. Cash used in operating activities from continuing operations during the year ended December 31, 2010 was primarily attributable to the net loss from continuing operations of approximately $11.8 million offset by non-cash items such as the change in the fair value of our warrants, depreciation and amortization, deferred revenue, increases in allowances for uncollectible accounts and excess and obsolete inventory, non-cash compensation and consulting expense, non-cash interest expense and decreases in working capital.
Cash used in investing activities from continuing operations during the year ended December 31, 2010 was $4.1 million as compared to cash used in investing activities from continuing operations of $3.8 million for the year ended December 31, 2009. Cash used in investing activities from continuing operations during the fiscal year ended December 31, 2010 and 2009 was a result of capital expenditures.
35
Cash provided by financing activities from continuing operations for the year ended December 31, 2010 was $67.1 million as compared to $21.8 million for the year ended December 31, 2009. Net cash provided by financing activities from continuing operations during 2010 includes approximately $37.5 million related to the sale of common stock, $4.7 million related to the exercise of warrants to purchase common stock, $2.0 million related to the exercise of employee stock options, $12.0 million in borrowings under our line of credit, $11.8 million in proceeds from our subordinated debt agreement, offset by a $1.3 million payment to our Series C Preferred shareholders. Net cash provided by financing activities from continuing operations during 2009 includes approximately $21.5 million related to the sale of common stock and approximately $0.2 million received from the exercise of stock options and warrants.
Cash provided by discontinued operations was $0.7 million for the year ended December 31, 2010 as compared to cash provided by discontinued operations of $0.6 million for the year ended December 31, 2009. Net cash used in operating activities from discontinued operations was $0.1 million in 2010 compared to cash provided by operating activities of $0.6 million in 2009. Net cash provided by investing activities from discontinued operations was $0.7 million in 2010 compared to cash used in investing activities of $0.1 million in 2009. Net cash used in financing activities from discontinued operations was $0 in 2010 and 2009.
Payments Due Under Contractual Obligations
The following table summarizes the payments due under our contractual obligations at December 31, 2010, and the effect such obligations are expected to have on liquidity and cash flow in future periods:
Calendar Years Ending December 31,
|
Capital Leases |
Principal Payments on Subordinated Debt |
Interest Payments on Subordinated Debt |
Operating Leases |
|||||||||
|---|---|---|---|---|---|---|---|---|---|---|---|---|---|
2011 |
$ | — | $ | 2,541,720 | $ | 1,417,799 | $ | 1,414,392 | |||||
2012 |
— | 4,233,192 | 951,287 | 901,115 | |||||||||
2013 |
— | 4,797,531 | 386,947 | 716,768 | |||||||||
2014 |
— | 427,557 | 4,482 | 449,554 | |||||||||
2015 |
— | — | — | 413,610 | |||||||||
Thereafter |
— | — | — | 151,527 | |||||||||
Total |
$ | — | $ | 12,000,000 | $ | 2,760,515 | $ | 4,046,966 | |||||
We lease equipment and office space under non-cancelable capital and operating leases. In addition, in June 2010 we entered into a $12 million subordinated debt agreement. The future minimum principal and interest payments under the subordinated debt agreement and the future minimum rental payments as of December 31, 2010 are included in the table above.
Off-Balance Sheet Arrangements
We have not created, and are not party to, any special-purpose or off-balance sheet entities for the purpose of raising capital, incurring debt or operating parts of our business that are not consolidated into our financial statements. We do not have any arrangements or relationships with entities that are not consolidated into our financial statements that are reasonably likely to materially affect our liquidity or the availability of capital resources.
Effects of Inflation
We believe that inflation and changing prices over the past three years have not had a significant impact on our net revenue or on our income from continuing operations.
36
Item 7A. QUANTITATIVE AND QUALITATIVE DISCLOSURES ABOUT MARKET RISK
The following discussion about our market risk disclosures involves forward-looking statements. Actual results could differ materially from those discussed in the forward-looking statements. We are exposed to market risk related to changes in interest rates and foreign currency exchange rates. We do not use derivative financial instruments for speculative or trading purposes.
Interest Rate Risk
We are exposed to market risk from changes in interest rates primarily through our investing and financing activities. In addition, our ability to fund working capital requirements may be impacted if we are not able to obtain appropriate financing at acceptable rates.
To manage interest rage exposure our strategy is to invest in short-term, highly liquid investments. Our investment policy also requires investment in approved instruments with an initial maximum allowable maturity of twelve months. Currently, our short-term investments are in money market funds with original maturities of 90 days or less. At December 31, 2010, our short-term investments approximated market value.
At December 31, 2010 we had a revolving line-of-credit available to us of up to $15.0 million, of which $15.0 million was outstanding. Our revolving line-of-credit bears an interest rate of the Bank's prime rate plus 0.5% per annum, which resulted in a rate of 4.5% at December 31, 2010.
The effect of interest rate fluctuations on outstanding borrowings as of December 31, 2010 over the next twelve months is quantified and summarized as follows:
| |
Interest Expense Increase |
|||
|---|---|---|---|---|
Interest rates increase by 100 basis points |
$ | 150,000 | ||
Interest rates increase by 200 basis points |
$ | 300,000 | ||
Foreign Currency Risk
We face exposure to movements in foreign currency exchange rates whenever we, or any of our subsidiaries, enter into transactions with third parties that are denominated in currencies other than ours, or its, functional currency. Intercompany transactions between entities that use different functional currencies also expose us to foreign currency risk. During the year ended December 31, 2010, the net impact of foreign currency changes on transactions was a loss of $0.6 million. We have not historically used derivative financial instruments or other financial instruments to hedge such economic exposures.
In addition, because a substantial portion of our earnings is generated by sales to foreign customers, which in many instances are denominated in the customers local currency, our earnings could be materially impacted by movements in foreign currency exchange rates, particularly that of the European Union and to a lesser extent the Canadian Dollar, upon the translation of the earnings into the U.S. Dollar. If the U.S. Dollar had been uniformly stronger by 1%, 5% or 10%, compared to the actual average exchange rates used to translate the financial results of our foreign sales, our net product sales revenue would not have been materially impacted, as depicted by the table below:
| |
Approximate decrease in net Revenue |
|||
|---|---|---|---|---|
| |
(in millions) |
|||
If, during the year ended December 31, 2010, the U.S. dollar was stronger by: |
||||
1% |
$ | 0.8 | ||
5% |
$ | 3.8 | ||
10% |
$ | 7.7 | ||
- *
- During 2010 the reporting currency of our Canadian division was determined to be the U.S. Dollar.
37
Item 8. CONSOLIDATED FINANCIAL STATEMENTS AND SUPPLEMENTARY DATA
38
REPORT OF INDEPENDENT REGISTERED PUBLIC ACCOUNTING FIRM
To
the Board of Directors and Stockholders of
Satcon Technology Corporation
We have audited the accompanying consolidated balance sheet of Satcon Technology Corporation and its subsidiaries (the Company) as of December 31, 2010, and the related consolidated statements of operations, changes in stockholders' equity (deficit) and comprehensive loss and cash flows for the year ended December 31, 2010. Our audit also includes the financial statement schedule for the year ended December 31, 2010 listed in item 15(2). We also have audited Satcon Technology Corporation's internal control over financial reporting as of December 31, 2010, based on criteria established in Internal Control—Integrated Framework issued by the Committee of Sponsoring Organizations of the Treadway Commission. The Company's management is responsible for these financial statements and the financial statement schedule, for maintaining effective internal control over financial reporting, and for its assessment of the effectiveness of internal control over financial reporting included in the accompanying Management's Report on Internal Control Over Financial Reporting. Our responsibility is to express an opinion on these financial statements and an opinion on the company's internal control over financial reporting based on our audit.
We conducted our audit in accordance with the standards of the Public Company Accounting Oversight Board (United States). Those standards require that we plan and perform the audit to obtain reasonable assurance about whether the financial statements are free of material misstatement and whether effective internal control over financial reporting was maintained in all material respects. Our audit of the financial statements included examining, on a test basis, evidence supporting the amounts and disclosures in the financial statements, assessing the accounting principles used and significant estimates made by management, and evaluating the overall financial statement presentation. Our audit of internal control over financial reporting included obtaining an understanding of internal control over financial reporting, assessing the risk that a material weakness exists, and testing and evaluating the design and operating effectiveness of internal control based on the assessed risk. Our audit also included performing such other procedures as we considered necessary in the circumstances. We believe that our audit provides a reasonable basis for our opinion.
A company's internal control over financial reporting is a process designed to provide reasonable assurance regarding the reliability of financial reporting and the preparation of financial statements for external purposes in accordance with generally accepted accounting principles. A company's internal control over financial reporting includes those policies and procedures that (a) pertain to the maintenance of records that, in reasonable detail, accurately and fairly reflect the transactions and dispositions of the assets of the company; (b) provide reasonable assurance that transactions are recorded as necessary to permit preparation of financial statements in accordance with generally accepted accounting principles, and that receipts and expenditures of the company are being made only in accordance with authorizations of management and directors of the company; and (c) provide reasonable assurance regarding prevention or timely detection of unauthorized acquisition, use, or disposition of the company's assets that could have a material effect on the financial statements.
Because of its inherent limitations, internal control over financial reporting may not prevent or detect misstatements. Also, projections of any evaluation of effectiveness to future periods are subject to the risk that controls may become inadequate because of changes in conditions, or that the degree of compliance with the policies or procedures may deteriorate.
In our opinion, the consolidated financial statements referred to above present fairly, in all material respects, the consolidated financial position of Satcon Technology Corporation and its subsidiaries as of December 31, 2010 and the consolidated results of its operations, changes in stockholder's equity (deficit) and its cash flows for the year ended December 31, 2010 in conformity with accounting principles generally accepted in the United States of America. In addition, in our
39
opinion, the related financial statement schedule listed in Item 15(2) of this Form 10-K when considered in relation to the basic consolidated financial statements taken as whole, presents fairly in all material respects the information set forth therein. Also in our opinion, Satcon Technology Corporation and its subsidiaries maintained, in all material respects, effective internal control over financial reporting as of December 31, 2010, based on criteria established in Internal Control—Integrated Framework issued by the Committee of Sponsoring Organizations of the Treadway Commission.
/s/ McGladrey & Pullen, LLP
Boston,
Massachusetts
March 15, 2011
40
REPORT OF INDEPENDENT REGISTERED PUBLIC ACCOUNTING FIRM
To
the Board of Directors and Stockholders of
Satcon Technology Corporation:
We have audited the accompanying consolidated balance sheet of Satcon Technology Corporation and its subsidiaries (the Company) (a Delaware corporation) as of December 31, 2009 and the related consolidated statements of operations, changes in stockholders' equity (deficit) and comprehensive loss and cash flows for each of the years ended December 31, 2009 and 2008. We have also audited the financial statement schedule for the years ended December 31, 2009 and 2008 listed in item 15(2).The Company's management is responsible for these financial statements and the financial statement schedule. Our responsibility is to express an opinion on these financial statements and schedule based on our audits.
We conducted our audits in accordance with the standards of the Public Company Accounting Oversight Board (United States). Those standards require that we plan and perform the audits to obtain reasonable assurance about whether the financial statements are free of material misstatement and whether effective internal control over financial reporting was maintained in all material respects. Our audits of the financial statements included examining, on a test basis, evidence supporting the amounts and disclosures in the financial statements, assessing the accounting principles used and significant estimates made by management, and evaluating the overall financial statement presentation. We believe that our audits provide a reasonable basis for our opinion.
In our opinion, the financial statements referred to above present fairly, in all material respects, the consolidated financial position of Satcon Technology Corporation and its subsidiaries as of December 31, 2009, and the consolidated results of its operations, changes in stockholders' equity (deficit) and its cash flows for each of the years in the two-year period ended December 31, 2009 in conformity with accounting principles generally accepted in the United States of America. In addition, in our opinion, the financial statement schedule listed in item 15(2) presents fairly, in all material respects, the information set forth therein when read in conjunction with the related consolidated financial statements.
/s/ CATURANO AND COMPANY, P.C.
Boston,
Massachusetts
March 11, 2010
41
SATCON TECHNOLOGY CORPORATION
CONSOLIDATED BALANCE SHEETS
| |
December 31, 2010 |
December 31, 2009 |
||||||
|---|---|---|---|---|---|---|---|---|
ASSETS |
||||||||
Current assets: |
||||||||
Cash and cash equivalents |
$ | 30,094,162 | $ | 13,369,208 | ||||
Restricted cash and cash equivalents |
— | 34,000 | ||||||
Accounts receivable, net of allowance of $974,887 and $196,909 at December 31, 2010 and 2009, respectively |
73,713,308 | 17,577,640 | ||||||
Unbilled contract costs and fees |
174,342 | 202,228 | ||||||
Inventory |
40,542,893 | 11,898,571 | ||||||
Prepaid expenses and other current assets |
4,254,246 | 717,535 | ||||||
Current assets of discontinued operations |
— | 35,004 | ||||||
Total current assets |
148,778,951 | 43,834,186 | ||||||
Property and equipment, net |
7,284,285 | 4,633,926 | ||||||
Non-current assets of discontinued operations |
— | 224,227 | ||||||
Total assets |
$ | 156,063,236 | $ | 48,692,339 | ||||
LIABILITIES AND STOCKHOLDERS' EQUITY (DEFICIT) |
||||||||
Current liabilities: |
||||||||
Line of credit |
$ | 15,000,000 | $ | 3,000,000 | ||||
Note payable, current portion, net of discount of $434,247 |
2,107,473 | — | ||||||
Accounts payable |
45,060,537 | 20,751,975 | ||||||
Accrued payroll and payroll related expenses |
4,476,685 | 2,235,349 | ||||||
Other accrued expenses |
6,824,388 | 2,710,568 | ||||||
Accrued restructuring costs |
49,203 | 38,034 | ||||||
Deferred revenue |
8,099,852 | 451,008 | ||||||
Current liabilities of discontinued operations |
— | 117,702 | ||||||
Total current liabilities |
81,618,138 | 29,304,636 | ||||||
Warrant liabilities |
5,454,109 |
4,976,774 |
||||||
Note payable, net of current portion and discount of $399,589 |
9,058,691 | — | ||||||
Deferred revenue, net of current portion |
11,622,918 | 5,531,413 | ||||||
Redeemable convertible Series B preferred stock (0 and 75 shares issued and outstanding at December 31, 2010 and 2009, respectively; face value $5,000 per share; liquidation preference $375,000 at December 31, 2009) |
— | 375,000 | ||||||
Other long-term liabilities |
318,151 | 280,472 | ||||||
Total liabilities |
108,072,007 | 40,468,295 | ||||||
Commitments and contingencies (Note K) |
||||||||
Redeemable convertible Series C preferred stock (0 and 25,000 shares issued and outstanding at December 31, 2010 and 2009, face value $1,000 per share, liquidation preference $27,600,000 at December 31, 2009) |
— |
22,257,423 |
||||||
Stockholders' equity (deficit): |
||||||||
Common stock; $0.01 par value, 200,000,000 shares authorized; 117,911,278 and 70,567,781 shares issued and outstanding at December 31, 2010 and 2009, respectively |
1,179,113 | 705,678 | ||||||
Additional paid-in capital |
291,717,323 | 218,599,384 | ||||||
Accumulated deficit |
(243,475,639 | ) | (231,656,734 | ) | ||||
Accumulated other comprehensive loss |
(1,429,568 | ) | (1,681,707 | ) | ||||
Total stockholders' equity (deficit) |
47,991,229 | (14,033,379 | ) | |||||
Total liabilities and stockholders' equity (deficit) |
$ | 156,063,236 | $ | 48,692,339 | ||||
The accompanying notes are an integral part of these consolidated financial statements.
42
SATCON TECHNOLOGY CORPORATION
CONSOLIDATED STATEMENTS OF OPERATIONS
| |
Years Ended December 31, | ||||||||||
|---|---|---|---|---|---|---|---|---|---|---|---|
| |
2010 | 2009 | 2008 | ||||||||
Revenue: |
|||||||||||
Product revenue |
$ | 173,301,973 | $ | 52,535,633 | $ | 54,293,334 | |||||
Cost of revenue: |
|||||||||||
Cost of product revenue |
129,360,472 | 49,334,132 | 45,818,090 | ||||||||
Gross margin |
43,941,501 | 3,201,501 | 8,475,244 | ||||||||
Operating expenses: |
|||||||||||
Research and development |
15,656,330 | 8,411,469 | 5,061,472 | ||||||||
Selling, general and administrative |
34,563,929 | 18,169,124 | 14,574,713 | ||||||||
Restructuring charges |
783,701 | 260,685 | 1,307,452 | ||||||||
Total operating expenses from continuing operations |
51,003,960 | 26,841,278 | 20,943,637 | ||||||||
Operating loss from continuing operations |
(7,062,459 | ) | (23,639,777 | ) | (12,468,393 | ) | |||||
Change in fair value of notes and warrants |
(3,162,323 | ) | (5,721,580 | ) | 264,628 | ||||||
Other (expense) income, net |
(658,755 | ) | (286,678 | ) | 707,450 | ||||||
Interest income |
784 | 8,972 | 216,238 | ||||||||
Interest expense |
(1,467,759 | ) | (323,995 | ) | (329,459 | ) | |||||
Net loss from continuing operations |
(12,350,512 | ) | (29,963,058 | ) | (11,609,536 | ) | |||||
Income (loss) from discontinued operations, net |
31,390 | 91,677 | (1,869,327 | ) | |||||||
Gain on sale of discontinued operations, net |
500,217 | — | 274,043 | ||||||||
Net loss |
(11,818,905 | ) | (29,871,381 | ) | (13,204,820 | ) | |||||
Deemed dividend and accretion on Series C preferred stock |
(7,622,576 | ) | (3,922,830 | ) | (2,974,502 | ) | |||||
Dividend on Series C preferred stock |
(1,027,397 | ) | (1,250,000 | ) | (1,250,000 | ) | |||||
Net loss attributable to common stockholders |
$ | (20,468,878 | ) | $ | (35,044,211 | ) | $ | (17,429,322 | ) | ||
Net loss per weighted average share, basic and diluted: |
|||||||||||
From loss on continuing operations attributable to common stockholders |
$ | (0.26 | ) | $ | (0.57 | ) | $ | (0.31 | ) | ||
From income (loss) from discontinued operations |
— | — | $ | (0.04 | ) | ||||||
From gain on sale of discontinued operations |
0.01 | — | $ | 0.01 | |||||||
Net loss attributable to common stockholders per weighted average share, basic and diluted |
$ | (0.25 | ) | $ | (0.57 | ) | $ | (0.34 | ) | ||
Weighted average number of common shares, basic and diluted |
82,210,459 | 61,727,000 | 50,684,564 | ||||||||
The accompanying notes are an integral part of these consolidated financial statements.
43
CONSOLIDATED STATEMENTS OF CHANGES IN STOCKHOLDERS' EQUITY (DEFICIT) AND COMPREHENSIVE LOSS
For the Year Ended December 31, 2010
| |
Common Shares |
Common Stock |
Additional Paid-in Capital |
Accumulated Deficit |
Accumulated Other Comprehensive Loss |
Total Stockholders' Deficit |
Comprehensive Loss |
|||||||||||||||
|---|---|---|---|---|---|---|---|---|---|---|---|---|---|---|---|---|---|---|---|---|---|---|
Balance, December 31, 2009 |
70,567,781 | $ | 705,678 | $ | 218,599,384 | $ | (231,656,734 | ) | $ | (1,681,707 | ) | $ | (14,033,379 | ) | ||||||||
Net loss |
— | — | — | (11,818,905 | ) | — | (11,818,905 | ) | (11,818,905 | ) | ||||||||||||
Issuance of warrants to Series C preferred stockholders |
— | — | 515,000 | — | — | 515,000 | — | |||||||||||||||
Beneficial conversion feature on Series C preferred stock |
— | — | 515,000 | — | — | 515,000 | — | |||||||||||||||
Series C preferred stock deemed dividend |
— | — | (515,000 | ) | — | — | (515,000 | ) | — | |||||||||||||
Accretion of Series C preferred stock to its redemption value |
— | — | (5,857,577 | ) | — | — | (5,857,577 | ) | — | |||||||||||||
Dividend on Series C preferred stock |
— | — | (1,027,397 | ) | — | — | (1,027,397 | ) | — | |||||||||||||
Payment to Series C Preferred Shareholders in Conjunction with Conversion |
— | — | (1,250,000 | ) | — | — | (1,250,000 | ) | — | |||||||||||||
Issuance of common stock in connection with underwritten public offering, net of issuance costs of $2,881,147 |
10,350,000 | 103,500 | 37,380,353 | — | — | 37,483,853 | — | |||||||||||||||
Issuance of common stock in connection with the conversion of Series C Preferred stock to common stock |
27,526,344 | 275,263 | 28,352,134 | — | — | 28,627,397 | — | |||||||||||||||
Issuance of common stock in connection with the conversion of Series B Preferred stock to common stock |
251,677 | 2,517 | 372,483 | — | — | 375,000 | — | |||||||||||||||
Issuance of common stock in connection with the exercise of stock options |
1,210,887 | 12,109 | 2,028,247 | — | — | 2,040,356 | — | |||||||||||||||
Issuance of common stock in connection with the exercise of warrants to purchase common stock |
7,883,595 | 78,836 | 7,324,042 | — | — | 7,402,878 | — | |||||||||||||||
Issuance of common stock to a consultant |
31,032 | 310 | 88,490 | — | — | 88,800 | — | |||||||||||||||
Issuance of warrants in connection with subordinated debt financing |
— | — | 910,612 | — | — | 910,612 | — | |||||||||||||||
Issuance of common stock in lieu of six-months cash dividend on redeemable convertible Series B preferred stock |
10,067 | 101 | 14,899 | — | — | 15,000 | — | |||||||||||||||
Employee stock-based compensation |
— | — | 4,048,100 | — | — | 4,048,100 | — | |||||||||||||||
Issuance of common stock in connection with the Employee Stock Purchase Plan |
79,895 | 799 | 218,553 | — | — | 219,352 | — | |||||||||||||||
Foreign currency translation adjustment |
— | — | — | — | 252,139 | 252,139 | 252,139 | |||||||||||||||
Comprehensive loss |
— | — | — | — | — | — | $ | (11,566,766 | ) | |||||||||||||
Balance, December 31, 2010 |
117,911,278 | $ | 1,179,113 | $ | 291,717,323 | $ | (243,475,639 | ) | $ | (1,429,568 | ) | $ | 47,991,229 | |||||||||
The accompanying notes are an integral part of these consolidated financial statements.
44
SATCON TECHNOLOGY CORPORATION
CONSOLIDATED STATEMENTS OF CHANGES IN STOCKHOLDERS' EQUITY (DEFICIT) AND COMPREHENSIVE LOSS
For the Year Ended December 31, 2009
| |
Common Shares |
Common Stock |
Additional Paid-in Capital |
Accumulated Deficit |
Accumulated Other Comprehensive Loss |
Total Stockholders' Equity (Deficit) |
Comprehensive Loss |
|||||||||||||||
|---|---|---|---|---|---|---|---|---|---|---|---|---|---|---|---|---|---|---|---|---|---|---|
Balance, December 31, 2008 |
51,479,822 | $ | 514,798 | $ | 182,222,762 | $ | (189,962,435 | ) | $ | (1,959,852 | ) | $ | (9,184,727 | ) | — | |||||||
Cumulative effect of a change in accounting principle—January 1, 2009 reclassification of warrants to warrant liabilities (Note C) |
— | — | (10,218,623 | ) | (11,822,918 | ) | — | (22,041,541 | ) | — | ||||||||||||
Net loss |
— | — | — | (29,871,381 | ) | — | (29,871,381 | ) | $ | (29,871,381 | ) | |||||||||||
Issuance of common stock in connection with underwritten public offering, net of issuance costs of $1,745,525 |
17,891,346 | 178,913 | 21,334,312 | — | — | 21,513,225 | — | |||||||||||||||
Reclassification of Series C preferred stock warrant liability to additional paid in capital due to warrant modification |
— | — | 25,193,785 | — | — | 25,193,785 | — | |||||||||||||||
Issuance of warrants to Series C preferred stockholders |
— | — | 82,000 | — | — | 82,000 | — | |||||||||||||||
Beneficial conversion feature on Series C preferred stock |
— | — | 82,000 | — | — | 82,000 | — | |||||||||||||||
Series C preferred stock deemed dividend |
— | — | (82,000 | ) | — | — | (82,000 | ) | — | |||||||||||||
Issuance of warrants to Series C preferred stockholders for modification of anti-dilution feature |
— | — | 515,000 | — | — | 515,000 | — | |||||||||||||||
Adjustment to conversion price of Series B preferred stock due to anti-dilution provisions |
— | — | 55,369 | — | — | 55,369 | — | |||||||||||||||
Issuance of common stock to 401(k) Plan |
69,650 | 697 | 107,262 | — | — | 107,959 | — | |||||||||||||||
Issuance of common stock in connection with the exercise of stock options, issuance of restricted stock to consultants |
218,384 | 2,184 | 362,784 | — | — | 364,968 | — | |||||||||||||||
Issuance of common stock in connection with the non-cash exercise of warrants to purchase common stock |
132,589 | 1,326 | (1,326 | ) | — | — | — | — | ||||||||||||||
Issuance of common stock in connection with the conversion of Series B preferred stock |
719,528 | 7,195 | 1,067,805 | — | — | 1,075,000 | — | |||||||||||||||
Issuance of common stock in lieu of six-month cash dividend on redeemable convertible Series B preferred stock |
56,462 | 565 | 85,805 | — | — | 86,370 | — | |||||||||||||||
Accretion of Series C preferred stock to its redemption value |
— | — | (3,840,830 | ) | — | — | (3,840,830 | ) | — | |||||||||||||
Dividend on Series C preferred stock |
— | — | (1,250,000 | ) | — | — | (1,250,000 | ) | — | |||||||||||||
Employee stock-based compensation |
— | — | 2,883,279 | — | — | 2,883,279 | — | |||||||||||||||
Foreign currency translation adjustment |
— | — | — | — | 278,145 | 278,145 | 278,145 | |||||||||||||||
Comprehensive loss |
— | — | — | — | — | — | $ | (29,593,236 | ) | |||||||||||||
Balance, December 31, 2009 |
70,567,781 | $ | 705,678 | $ | 218,599,384 | $ | (231,656,734 | ) | $ | (1,681,707 | ) | $ | (14,033,379 | ) | ||||||||
The accompanying notes are an integral part of these consolidated financial statements.
45
SATCON TECHNOLOGY CORPORATION
CONSOLIDATED STATEMENTS OF CHANGES IN STOCKHOLDERS' EQUITY (DEFICIT) AND COMPREHENSIVE LOSS
For the Year Ended December 31, 2008
| |
Common Shares |
Common Stock |
Additional Paid-in Capital |
Accumulated Deficit |
Accumulated Other Comprehensive Income (Loss) |
Total Stockholders' Equity (Deficit) |
Comprehensive Loss |
|||||||||||||||
|---|---|---|---|---|---|---|---|---|---|---|---|---|---|---|---|---|---|---|---|---|---|---|
Balance, December 31, 2007 |
49,803,979 | $ | 498,040 | $ | 180,933,100 | $ | (176,757,615 | ) | $ | (310,232 | ) | $ | 4,363,293 | $ | — | |||||||
Net loss |
— | — | — | (13,204,820 | ) | — | (13,204,820 | ) | $ | (13,204,820 | ) | |||||||||||
Issuance of warrants to Series C preferred stockholders |
— | — | 126,000 | — | — | 126,000 | ||||||||||||||||
Beneficial conversion feature on Series C preferred stock |
— | — | 126,000 | — | — | 126,000 | ||||||||||||||||
Series C preferred stock deemed dividend |
— | — | (126,000 | ) | — | — | (126,000 | ) | ||||||||||||||
Accretion of Series C preferred stock to its redemption value |
— | — | (2,848,502 | ) | — | — | (2,848,502 | ) | ||||||||||||||
Dividend on Series C preferred stock |
— | — | (1,250,000 | ) | — | — | (1,250,000 | ) | ||||||||||||||
Issuance of common stock to 401(k) Plan |
279,831 | 2,798 | 575,434 | — | — | 578,232 | ||||||||||||||||
Issuance of common stock in connection with the exercise of stock options to purchase common stock |
891,168 | 8,912 | 1,435,607 | — | — | 1,444,519 | ||||||||||||||||
Issuance of common stock in lieu of six-month cash dividend on redeemable convertible Series B preferred stock. |
86,241 | 862 | 132,804 | — | — | 133,666 | ||||||||||||||||
Issuance of common stock in connection with the exercise of warrants to purchase common stock |
174,967 | 1,750 | 239,560 | — | — | 241,310 | ||||||||||||||||
Issuance of restricted stock to employees |
82,346 | 823 | 144,930 | — | — | 145,753 | ||||||||||||||||
Issuance of common stock in connection with the conversion of Series B preferred stock |
161,290 | 1,613 | 248,387 | — | — | 250,000 | ||||||||||||||||
Issuance of warrants to purchase common stock to contractor |
— | — | 121,000 | — | — | 121,000 | ||||||||||||||||
Employee stock-based compensation |
— | — | 2,364,442 | — | — | 2,364,442 | ||||||||||||||||
Foreign currency translation adjustment |
— | — | — | — | (1,649,620 | ) | (1,649,620 | ) | (1,649,620 | ) | ||||||||||||
Comprehensive loss |
$ | (14,854,440 | ) | |||||||||||||||||||
Balance, December 31, 2008 |
51,479,822 | $ | 514,798 | $ | 182,222,762 | $ | (189,962,435 | ) | $ | (1,959,852 | ) | $ | (9,184,727 | ) | ||||||||
The accompanying notes are an integral part of these consolidated financial statements.
46
SATCON TECHNOLOGY CORPORATION
CONSOLIDATED STATEMENTS OF CASH FLOWS
| |
Years Ended December 31, | |||||||||||
|---|---|---|---|---|---|---|---|---|---|---|---|---|
| |
2010 | 2009 | 2008 | |||||||||
Cash flows from operating activities: |
||||||||||||
Net loss |
$ | (11,818,905 | ) | $ | (29,871,381 | ) | $ | (13,204,820 | ) | |||
Net (income) loss from discontinued operations |
(31,390 | ) | (91,677 | ) | 1,869,327 | |||||||
Net gain on sale of discontinued operations |
(500,217 | ) | — | (274,043 | ) | |||||||
Adjustments to reconcile net loss from continuing operations to net cash used in operating activities: |
||||||||||||
Depreciation and amortization |
1,545,769 | 1,263,886 | 769,998 | |||||||||
Provision for uncollectible accounts |
798,551 | 28,690 | 80,142 | |||||||||
Provision for excess and obsolete inventory |
1,043,197 | 185,577 | 360,035 | |||||||||
Non-cash compensation expense related to issuance of stock options and warrants to employees and non-employees and issuance of common stock to 401(k) Plan, including stock based compensation costs from continuing operations of $4,066,457, $2,797,138 and $2,196,166 for the years ended December 31, 2010, 2009 and 2008, respectively. |
4,155,257 | 3,476,639 | 2,584,295 | |||||||||
Change in fair value of Senior Secured Convertible Notes and investor and placement agent warrant liability |
3,162,323 | 5,721,580 | (264,628 | ) | ||||||||
Non-cash interest expense |
260,276 | 122,406 | 130,334 | |||||||||
Non-cash restructuring charges |
— | — | 274,552 | |||||||||
Changes in operating assets and liabilities: |
||||||||||||
Accounts receivable |
(56,417,568 | ) | (4,019,988 | ) | (5,205,154 | ) | ||||||
Unbilled contract costs and fees |
27,886 | 196,479 | 137,860 | |||||||||
Prepaid expenses and other assets |
(3,529,066 | ) | 366,796 | (56,174 | ) | |||||||
Inventory |
(29,209,687 | ) | 1,105,815 | (1,965,474 | ) | |||||||
Other long-term assets |
— | — | 32,931 | |||||||||
Accounts payable |
23,821,194 | 10,408,195 | 2,392,434 | |||||||||
Accrued expenses and payroll |
6,224,408 | (324,674 | ) | 790,114 | ||||||||
Accrued restructuring |
(2,299 | ) | (564,748 | ) | 602,782 | |||||||
Accrued contract losses |
— | (1,213,995 | ) | 94,700 | ||||||||
Deferred revenue, current and long portion |
13,488,691 | (1,668,073 | ) | 2,510,183 | ||||||||
Other current liabilities |
37,679 | 222,190 | (11,793 | ) | ||||||||
Total adjustments |
(34,593,389 | ) | $ | 15,306,775 | $ | 3,257,137 | ||||||
Net cash used in operating activities in continuing operations |
(46,943,901 | ) | (14,656,283 | ) | (8,352,399 | ) | ||||||
Net cash provided by (used in) operating activities of discontinued operations |
(61,921 | ) | 644,944 | (1,741,226 | ) | |||||||
Net cash used in operating activities |
(47,005,822 | ) | (14,011,339 | ) | (10,093,625 | ) | ||||||
Cash flows from investing activities: |
||||||||||||
Purchases of property and equipment |
(4,126,607 | ) | (3,752,449 | ) | (1,451,678 | ) | ||||||
Net cash used in investing activities in continuing operations |
(4,126,607 | ) | (3,752,449 | ) | (1,451,678 | ) | ||||||
Net cash provided by (used in) investing activities of discontinued operations |
716,700 | (75,715 | ) | 4,925,584 | ||||||||
Net cash provided by (used in) investing activities |
(3,409,907 | ) | (3,828,164 | ) | 3,473,906 | |||||||
Cash flows from financing activities: |
||||||||||||
Net borrowings under line of credit |
12,000,000 | — | 3,000,000 | |||||||||
Proceeds from note payable |
11,826,500 | — | — | |||||||||
Proceeds from short-term loan |
— | 1,297,200 | — | |||||||||
Repayment of short-term loan |
— | (1,297,200 | ) | — | ||||||||
Proceeds from Employee Stock Purchase Plan |
219,352 | — | — | |||||||||
Net proceeds from public sale of common stock |
37,483,853 | 21,513,225 | — | |||||||||
Payment to Series C Preferred Shareholders |
(1,250,000 | ) | — | — | ||||||||
Payments related to warrant holder redemption rights |
— | — | (572,250 | ) | ||||||||
Decrease in restricted cash |
34,000 | 50,000 | — | |||||||||
Net proceeds from exercise of warrants to purchase common stock |
4,717,890 | — | 241,310 | |||||||||
Net proceeds from exercise of options to purchase common stock |
2,040,356 | 200,468 | 1,444,519 | |||||||||
Net cash provided by financing activities in continuing operations |
$ | 67,071,951 | $ | 21,763,693 | $ | 4,113,579 | ||||||
Net increase (decrease) in cash and cash equivalents |
$ | 16,656,222 | $ | 3,924,190 | $ | (2,506,140 | ) | |||||
Effects of foreign currency exchange rates on cash and cash equivalents |
$ | 68,732 | $ | (512,698 | ) | $ | (151,710 | ) | ||||
Net increase (decrease) in cash and cash equivalents |
$ | 16,724,954 | $ | 3,411,492 | $ | (2,657,850 | ) | |||||
Cash and cash equivalents at beginning of year |
$ | 13,369,208 | $ | 9,957,716 | $ | 12,615,566 | ||||||
Cash and cash equivalents at end of year |
$ | 30,094,162 | $ | 13,369,208 | $ | 9,957,716 | ||||||
See Note Q for non-cash disclosures
The accompanying notes are an integral part of these consolidated financial statements.
47
SATCON TECHNOLOGY CORPORATION
NOTES TO CONSOLIDATED FINANCIAL STATEMENTS
DECEMBER 31, 2010, 2009 AND 2008
A. THE COMPANY
Satcon Technology Corporation ("Satcon" or "Company") is a leading clean energy technology provider of utility-grade power conversion solutions for the renewable energy market, primarily the large-scale commercial and utility-scale solar photovoltaic, or PV, markets. Satcon designs and delivers advanced power conversion solutions that enable large-scale producers of renewable energy to convert clean energy into grid-connected, efficient and reliable electrical power.
Satcon's power conversion solutions boost total system power production through system intelligence, advanced command and control capabilities, industrial-grade engineering and total lifecycle performance optimization. Satcon's power conversion solutions feature the widest range of power ratings in the solar industry. Satcon also offer system design services and solutions for management, monitoring, and performance measurement to maximize capital investment and improve overall quality and performance over the entire lifespan of an installation.
The accompanying consolidated financial statements have been prepared in conformity with accounting principles generally accepted in the United States of America.
B. REALIZATION OF ASSETS AND LIQUIDITY
The Company has developed a business plan that envisions a continued increase in assets and revenue from the results experienced in the recent past. The Company believes that its existing plan will generate sufficient cash which, along with its existing cash on hand, will enable it to fund operations through at least December 31, 2011. Additionally, the Company has a line of credit in place with a bank and believes that it has the ability to refinance and/or expand the availability of such asset-based financing. Such actions would likely require the consent of its existing lenders, and there can be no assurance that such consents would be given. Furthermore, there can be no assurance that the Company would be able to obtain similar or additional asset-based financing if and when sought.
C. SIGNIFICANT ACCOUNTING POLICIES AND BASIS OF PRESENTATION
Basis of Consolidation
The consolidated financial statements include the accounts of Satcon and its wholly owned subsidiary (Satcon Power Systems Canada, Ltd.) and its discontinued operating subsidiaries (Satcon Applied Technology, Inc., Satcon Electronics, Inc. and Satcon Power Systems, Inc.). All intercompany accounts and transactions have been eliminated in consolidation.
Revenue Recognition
The Company recognizes revenue from product sales when there is persuasive evidence of an arrangement, the fee is fixed or determinable, delivery of the product to the customer has occurred and the Company has determined that collection of the fee is probable. Title to the product passes upon shipment of the product, as the products are typically shipped FOB shipping point, unless otherwise agreed upon in advance with the customer. If the product requires installation to be performed by the Company, all revenue related to the product is deferred and recognized upon the completion of the installation. If the product requires specific customer acceptance, revenue is deferred until customer acceptance occurs or the acceptance provisions lapse, unless the Company can objectively and reliably demonstrate that the criteria specified in the acceptance provisions are satisfied. When appropriate the
48
SATCON TECHNOLOGY CORPORATION
NOTES TO CONSOLIDATED FINANCIAL STATEMENTS (Continued)
DECEMBER 31, 2010, 2009 AND 2008
C. SIGNIFICANT ACCOUNTING POLICIES AND BASIS OF PRESENTATION (Continued)
Company provides for a warranty reserve at the time the product revenue is recognized. If a contract involves the provision of multiple elements and the elements qualify for separation, total estimated contract revenue is allocated to each element based on the relative fair value of each element provided. The amount of revenue allocated to each element is limited to the amount that is not contingent upon the delivery of another element in the future. Revenue is recognized on each element as described above.
Cost of product revenue includes materials, labor, overhead, warranty and freight.
Deferred revenue primarily consists of cash received for extended product warranties, preventative maintenance plans and up-time guarantee programs. Deferred revenue also consists of payments received from customers in advance of services performed, product shipped or installation completed. When an item is deferred for revenue recognition purposes, the deferred revenue is recorded as a liability and the deferred costs are recorded as a component of inventory in the consolidated balance sheets.
Unbilled Contract Costs and Fees and Funded Research and Development Costs in Excess of Billings
Unbilled contract costs and fees represent revenue recognized in excess of amounts billed due to contractual provisions or deferred costs that have not been recognized as revenue or billed to the customer.
Cash and Cash Equivalents
Cash and cash equivalents include demand deposits and highly-liquid investments with maturities of three months or less when acquired. Cash equivalents are stated at cost, which approximates market value. At December 31, 2010 and December 31, 2009, the Company has restricted cash of $0 and $34,000, respectively.
Accounts Receivable
Accounts receivable are reduced by an allowance for amounts that may become uncollectible in the future. The estimated allowance for uncollectible amounts is based primarily on a specific analysis of accounts in the receivable portfolio and historical write-off experience. While management believes the allowance to be adequate, if the financial condition of our customers were to deteriorate, resulting in impairment of their ability to make payments, additional allowances may be required.
Inventory
Inventory is valued at the lower of actual cost to purchase and/or manufacture the inventory or the current estimated market value of the inventory, and costs are determined based on the first-in, first-out method of accounting and include material, labor and manufacturing overhead costs. A significant decrease in demand for the Company's products could result in a short-term increase in the cost of inventory purchases and an increase of excess inventory quantities on hand. In addition, the industry is characterized by rapid technological change, frequent new product development, and rapid product obsolescence that could result in an increase in the amount of obsolete inventory quantities on hand. Therefore, although the Company makes every effort to ensure the accuracy of its forecasts of
49
SATCON TECHNOLOGY CORPORATION
NOTES TO CONSOLIDATED FINANCIAL STATEMENTS (Continued)
DECEMBER 31, 2010, 2009 AND 2008
C. SIGNIFICANT ACCOUNTING POLICIES AND BASIS OF PRESENTATION (Continued)
future product demand, any significant unanticipated changes in demand or technological developments could have a significant impact on the value of the inventory and reported operating results. The Company records, as a charge to cost of product revenue, any amounts required to reduce the carrying value to net realizable value.
Property and Equipment
Property and equipment are stated at cost. Depreciation and amortization is computed using the straight-line method over the asset's estimated useful life. The estimated useful lives of property and equipment are as follows:
| |
Estimated Lives | |
|---|---|---|
Machinery and equipment |
2-10 years | |
Furniture and fixtures |
7-10 years | |
Computer hardware/software |
3 years | |
Leasehold improvements |
Lesser of the remaining life of the lease or the useful life of the improvement |
When assets are retired or otherwise disposed of, the cost and related depreciation and amortization are eliminated from the accounts and any resulting gain or loss is reflected in operating expenses.
Foreign Currency
As of April 1, 2010, the Company determined that the functional currency of its foreign subsidiary in Canada was the US dollar. As the functional currency changed from the foreign currency to the reporting currency, the translation adjustments as of April 1, 2010 remain as a component of accumulated other comprehensive income (loss). Prior to this determination, the functional currency was the local currency, assets and liabilities were translated at the rates in effect at the balance sheet dates, while stockholders' equity (deficit) including the long-term portion of intercompany advances was translated at historical rates. Statements of operations and cash flow amounts were translated at the average rate for the period. Translation adjustments were included as a component of accumulated other comprehensive income (loss). Foreign currency gains and losses were a loss of $0.6 million, a gain of $0.3 million and a gain of $0.7 million for the years ended December 31, 2010, 2009 and 2008, respectively. All foreign currency transaction gains and losses were recorded as a component of other income (expense), net.
During January 2011 the Company entered into a foreign currency hedge with a bank with a notional amount of approximately $4.7 million and a term of 90 days.
Use of Estimates
The preparation of financial statements, in conformity with accounting principles generally accepted in the United States of America, requires management to make estimates and assumptions that affect the reported amounts of assets and liabilities and disclosure of contingent assets and liabilities at the date of the financial statements and the reported amounts of revenue and expenses
50
SATCON TECHNOLOGY CORPORATION
NOTES TO CONSOLIDATED FINANCIAL STATEMENTS (Continued)
DECEMBER 31, 2010, 2009 AND 2008
C. SIGNIFICANT ACCOUNTING POLICIES AND BASIS OF PRESENTATION (Continued)
during the period reported. Management believes the most significant estimates include the net realizable value of accounts receivable and inventory, warranty provisions, the recoverability of long-lived assets, the recoverability of deferred tax assets and the fair value of equity and financial instruments. Actual results could differ from these estimates.
Reclassifications
Certain prior-year balances have been reclassified to conform to current-year presentations.
Income Taxes
The Company accounts for income taxes utilizing the asset and liability method for accounting and reporting for income taxes. Under this method, deferred tax assets and deferred tax liabilities are recognized based on temporary differences between the financial reporting and income tax basis of assets and liabilities using statutory rates. In addition, the Company is required to establish a valuation allowance against net deferred tax assets if, based upon the available evidence, it is more likely than not that some or all of the deferred tax assets will not be realized.
The Company is allowed to recognize the tax benefits of uncertain tax positions only where the position is "more likely than not" to be sustained assuming examination by tax authorities. The amount recognized is the amount that represents the largest amount of tax benefit that is greater than 50% likely of being ultimately realized. A liability is recognized for any benefit claimed, or expected to be claimed, in a tax return in excess of the benefit recorded in the financial statements, along with any interest and penalties (if applicable) on that excess. In addition, the Company is required to provide a tabular reconciliation of the change in the aggregate unrecognized tax benefits claimed, or expected to be claimed, in tax returns and disclosure relating to the accrued interest and penalties for unrecognized tax benefits. Discussion is also required for those uncertain tax positions where it is reasonably possible that the estimate of the tax benefit will change significantly in the next twelve months.
As of December 31, 2010, the Company had federal and state net operating loss ("NOL") carry forwards and federal and state R&D credit carry forwards, which may be available to offset future federal and state income tax liabilities which expire at various dates through 2031. Utilization of the NOL and R&D credit carry forwards may be subject to a substantial annual limitation due to ownership change limitations that have occurred previously or that could occur in the future provided by Sections 382 or 383 of the Internal Revenue Code of 1986, as well as similar state and foreign provisions. These ownership changes may limit the amount of NOL and R&D credit carry forwards that can be utilized annually to offset future taxable income and tax, respectively. In general, an ownership change, as defined by Section 382, results from transactions increasing the ownership of certain shareholders or public groups in the stock of a corporation by more than 50 percentage points over a rolling three-year period. Since the Company's formation, the Company has raised capital through the issuance of capital stock on several occasions (both pre and post initial public offering) which, combined with the purchasing shareholders' subsequent disposition of those shares, may have resulted in a change of control, as defined by Section 382, or could result in a change of control in the future upon subsequent disposition.
51
SATCON TECHNOLOGY CORPORATION
NOTES TO CONSOLIDATED FINANCIAL STATEMENTS (Continued)
DECEMBER 31, 2010, 2009 AND 2008
C. SIGNIFICANT ACCOUNTING POLICIES AND BASIS OF PRESENTATION (Continued)
The Company commissioned a study to determine whether Sections 382 or 383 could limit the use of our carryforwards in this manner. After completing this study, the company has concluded that the limitation will not have a material impact on its ability to utilize its net operating loss or credit carryforwards.
The tax years 1996 through 2010 remain open to examination by major taxing jurisdictions to which the Company is subject, which are primarily in the United States, as carryforward attributes generated in years past may still be adjusted upon examination by the Internal Revenue Service or state tax authorities if they are or will be used in a future period. The Company is currently not under examination by the Internal Revenue Service or any other jurisdiction for any tax years. The Company did not recognize any interest and penalties associated with unrecognized tax benefits in the accompanying financial statements. The Company would record any such interest and penalties as a component of interest expense. The Company does not expect any material changes to the unrecognized benefits within 12 months of the reporting date.
Accounting for Stock-based Compensation
The Company has several stock-based employee compensation plans, as well as stock options issued outside of such plans as an inducement to engage new executives. Stock-based compensation cost is measured at the grant date based on the value of the award and is recognized as expense over the service period.
The Company uses the Black-Scholes valuation model for valuing options. This model incorporates several assumptions, including volatility, expected life and discount rate. The Company uses historical volatility as it believes it is more reflective of market conditions and a better indicator of volatility. The Company uses historical information in the calculation of expected life for its "plain-vanilla" option grants. If the Company determines that another method used to estimate expected volatility is more reasonable than the Company's current methods, or if another method for calculating these input assumptions is prescribed by authoritative guidance, the fair value calculated for share-based awards could change significantly. Higher volatility and longer expected lives would result in an increase to share-based compensation determined at the date of grant.
The Company recognized the full impact of its share-based payment plans in the consolidated financial statements for the year ended December 31, 2010, 2009 and 2008 and did not capitalize any such costs on the consolidated balance sheets, as such costs that qualified for capitalization were not
52
SATCON TECHNOLOGY CORPORATION
NOTES TO CONSOLIDATED FINANCIAL STATEMENTS (Continued)
DECEMBER 31, 2010, 2009 AND 2008
C. SIGNIFICANT ACCOUNTING POLICIES AND BASIS OF PRESENTATION (Continued)
material. The following table presents share-based compensation expense included in the Company's consolidated statement of operations:
| |
Year Ended December 31, | |||||||||
|---|---|---|---|---|---|---|---|---|---|---|
| |
2010 | 2009 | 2008 | |||||||
Cost of product revenue |
$ | 285,047 | $ | 171,067 | $ | 96,249 | ||||
Research and development |
638,476 | 332,970 | 154,641 | |||||||
Selling, general and administrative expenses |
3,142,934 | 2,293,102 | 1,945,276 | |||||||
Share based compensation expense from continuing operations, before tax |
4,066,457 | 2,797,139 | 2,196,166 | |||||||
Share based compensation expense from discontinued operations |
(18,357 | ) | 86,140 | 168,276 | ||||||
Total share based compensation expense, before tax |
4,048,100 | 2,883,279 | 2,364,442 | |||||||
Income tax benefit |
— | — | — | |||||||
Net share-based compensation expense |
$ | 4,048,100 | $ | 2,883,279 | $ | 2,364,442 | ||||
Compensation expense associated with the granting of stock options to employees is being recognized on a straight line basis over the service period of the option. In instances where the actual compensation expense would be greater than that calculated using the straight line method, the actual compensation expense is recorded in that period.
Included in the 2010 stock-based compensation expense above are amounts related to employees participation in the Employee Stock Purchase Plan ("ESPP") of approximately $221,000. See Note L, Employee Benefit Plan.
At December 31, 2010, approximately $11.0 million in unrecognized compensation expense remains to be recognized in future periods. The table below summaries the recognition of the deferred compensation expense associated with employee stock options over the next four years as follows:
Calendar Years Ending December 31,
|
Non Cash Stock-Based Compensation Expense |
|||
|---|---|---|---|---|
2011 |
$ | 4,555,273 | ||
2012 |
3,195,849 | |||
2013 |
2,200,116 | |||
2014 |
1,000,038 | |||
Total |
$ | 10,951,276 | ||
During the year ended December 31, 2008, the Company accelerated unvested options for two of its senior executives in connection with their departures. In addition, the Company extended the time to exercise these options, normally ninety days, to two years from the date of their respective last days of employment. As a result, the Company recorded a non-cash restructuring charge in 2008 of
53
SATCON TECHNOLOGY CORPORATION
NOTES TO CONSOLIDATED FINANCIAL STATEMENTS (Continued)
DECEMBER 31, 2010, 2009 AND 2008
C. SIGNIFICANT ACCOUNTING POLICIES AND BASIS OF PRESENTATION (Continued)
approximately $0.3 million, of which approximately $0.1 million related to the acceleration of unvested options and $0.2 million related to the extension of time to exercise these options. The Company valued these changes using the Black-Scholes option pricing model.
The weighted-average grant-date fair value of options granted during the year ended December 31, 2010, 2009 and 2008 were $1.92, $1.50 and $2.03, respectively, per option. The fair value of each stock option is estimated on the date of the grant using the Black-Scholes option-pricing model with the following range of assumptions:
| |
Year Ended December 31, | |||||
|---|---|---|---|---|---|---|
| |
2010 | 2009 | 2008 | |||
Assumptions: |
||||||
Expected life(1) |
5.0 years to 6.25 years | 5.0 years to 6.25 years | 5.0 years to 6.25 years | |||
Expected volatility ranging from(2) |
72.38% - 76.45% | 72.9% - 82.96% | 80.0% - 89.5% | |||
Dividends |
none | none | none | |||
Risk-free interest rate(3) |
1.11% - 2.50% | 1.50% - 2.50% | 2.70% - 3.38% | |||
Forfeiture Rate(4) |
0% - 6.25% | 0% - 6.25% | 0% - 6.25% | |||
- (1)
- The
option life was determined using actual option experience. Prior to March 31, 2010, the option life was determined using the simplified method
for estimating expected option life, which qualify as "plain-vanilla" options.
- (2)
- The
stock volatility for each grant is measured using the weighted average of historical daily price changes of the Company's common stock over the most
recent period equal to the expected option life of the grant, the historical short term trend of the option and other factors, such as expected changes in volatility arising from planned changes in
the Company's business operations.
- (3)
- The
risk-free interest rate for each grant is equal to the U.S. Treasury yield curve in effect at the time of grant for instruments with a
similar expected life.
- (4)
- The estimated forfeiture rate for each option grant is between 0% and 6.25%. The Company periodically reviews the estimated forfeiture rate, in light of actual experience.
Net Loss per Basic and Diluted Common Share
The Company reports net loss per basic and diluted common share in accordance with standards established for computing and presenting earnings per share. Basic earnings per share excludes dilution and is computed by dividing income attributable to common stockholders by the weighted average number of common shares outstanding for the period. Diluted earnings per share reflects the potential dilution that could occur if securities or other contracts to issue common stock were exercised or converted into common stock or resulted in the issuance of common stock that then shared in the earnings of the Company, except when the effect would be anti-dilutive. See Note R, Loss Per Share, for more information related to options, warrants and convertible Preferred Stock which would be considered anti-dilutive.
54
SATCON TECHNOLOGY CORPORATION
NOTES TO CONSOLIDATED FINANCIAL STATEMENTS (Continued)
DECEMBER 31, 2010, 2009 AND 2008
C. SIGNIFICANT ACCOUNTING POLICIES AND BASIS OF PRESENTATION (Continued)
Concentration of Credit Risk
Financial instruments that subject the Company to concentrations of credit risk principally consist of cash equivalents, trade accounts receivable, unbilled contract costs and deposits in bank accounts. The Company deposits its cash and invests in short-term investments primarily through a national commercial bank. Deposits in excess of amounts insured by the Federal Deposit Insurance Corporation (FDIC) are exposed to loss in the event of nonperformance by the institution.
The Company's trade accounts receivable and unbilled contract costs and fees are primarily from sales to commercial customers. The Company does not require collateral and has not historically experienced significant credit losses related to receivables, letters of credit or unbilled contract costs and fees from individual customers or groups of customers in any particular industry or geographic area.
Significant customers are defined as those customers that account for 10% or more of total net revenue in a fiscal year or 10% or more of accounts receivable and unbilled contract costs and fees at the end of a fiscal period. The table below details out customers that were considered significant, greater than 10%, as it pertains to both annual revenues for the years ended December 31, 2010, 2009 and 2008 and accounts receivable and unbilled contract costs as of December 31, 2010 and 2009.
Year
|
Revenue | Accounts Receivable and Unbilled Contract Costs | ||
|---|---|---|---|---|
| 2010 | None | GCL Solar Limited (approximately 11%)** | ||
| Enel Green Power (approximately 11%)** | ||||
| CE Solar (approximately 12%) | ||||
2009 |
SunPower Corporation (approximately 14%) |
* |
||
| * | Enfinity, NV (approximately 10%) | |||
2008 |
Fuel Cell Energy, Inc.(approximately 17%) |
Fuel Cell Energy, Inc.(approximately 14%) |
||
| SunPower Corporation (approximately 12%) | SunPower Corporation (approximately 14%) |
- *
- Represents
less than 10% of either the fiscal year revenue or the total accounts receivable balance at December 31, 2009 or 2008.
- **
- The accounts receivable associated with these customers were backed by irrevocable letters of credit at December 31, 2010.
Research and Development Costs
The Company expenses research and development costs as incurred. Cost of research and development and other revenue includes costs incurred in connection with both funded research and development and other revenue arrangements and unfunded research and development activities.
Comprehensive Income (Loss)
Comprehensive income (loss) includes net loss and foreign currency translation adjustments prior to the changing of the functional currency in Canada to the US dollar.
55
SATCON TECHNOLOGY CORPORATION
NOTES TO CONSOLIDATED FINANCIAL STATEMENTS (Continued)
DECEMBER 31, 2010, 2009 AND 2008
C. SIGNIFICANT ACCOUNTING POLICIES AND BASIS OF PRESENTATION (Continued)
Fair Value of Financial Instruments
The Company's financial instruments consist of cash equivalents, accounts receivable, unbilled contract costs and fees, warrants to purchase shares of common stock, accounts payable, subordinated note payable and the line of credit. The estimated fair values of these financial instruments approximate their carrying values at December 31, 2010 and December 31, 2009. The estimated fair values have been determined through information obtained from market sources and management estimates. The Company's warrant liability is recorded at fair value. See "Fair Value Measurements" below. The carrying value of the subordinated notes payable, as of December 31, 2010, is not materially different from the fair value of the notes.
Fair Value Measurements
The Company's financial assets and liabilities are measured using inputs from the three levels of fair value hierarchy which are as follows:
| Level 1 | — | Quoted prices in active markets for identical assets or liabilities. | ||
| Level 2 | — | Inputs other than Level 1 that are observable, either directly or indirectly, such as quoted prices for similar assets or liabilities; quoted prices in markets that are not active; or other inputs that are observable or can be corroborated by observable market data for substantially the full term of the assets or liabilities. | ||
| Level 3 | — | Unobservable inputs that are supported by little or no market activity and that are significant to the fair value of the assets or liabilities. |
Assets and Liabilities Measured at Fair Value on a Recurring Basis as of December 31, 2010 are as follows:
| |
Fair Value Measurements at Reporting Date Using | |||||||||||||
|---|---|---|---|---|---|---|---|---|---|---|---|---|---|---|
Description
|
Balance as of December 31, 2010 |
Quoted Prices in Active Markets for Identical Assets (Level 1) |
Significant Other Observable Inputs (Level 2) |
Significant Unobservable Inputs (Level 3) |
||||||||||
Assets |
||||||||||||||
Money market funds(2) |
$ | — | $ | — | $ | — | $ | — | ||||||
Total Assets |
$ | — | $ | — | $ | — | $ | — | ||||||
Liabilities |
||||||||||||||
Long-term warrant liability(1) |
$ | 5,454,109 | $ | — | $ | 5,454,109 | $ | — | ||||||
Total Liabilities |
$ | 5,454,109 | $ | — | $ | 5,454,109 | $ | — | ||||||
56
SATCON TECHNOLOGY CORPORATION
NOTES TO CONSOLIDATED FINANCIAL STATEMENTS (Continued)
DECEMBER 31, 2010, 2009 AND 2008
C. SIGNIFICANT ACCOUNTING POLICIES AND BASIS OF PRESENTATION (Continued)
Assets and Liabilities Measured at Fair Value on a Recurring Basis as of December 31, 2009 are as follows:
| |
Fair Value Measurements at Reporting Date Using | |||||||||||||
|---|---|---|---|---|---|---|---|---|---|---|---|---|---|---|
| |
Balance as of December 31, 2009 |
Quoted Prices in Active Markets for Identical Assets (Level 1) |
Significant Other Observable Inputs (Level 2) |
Significant Unobservable Inputs (Level 3) |
||||||||||
Assets |
||||||||||||||
Money market funds(2) |
$ | 10,003,805 | $ | 10,003,805 | $ | — | $ | — | ||||||
Total Assets |
$ | 10,003,805 | $ | 10,003,805 | $ | — | $ | — | ||||||
Liabilities |
||||||||||||||
Long-term warrant liability(1) |
$ | 4,976,774 | $ | — | $ | 4,976,774 | $ | — | ||||||
Total Liabilities |
$ | 4,976,774 | $ | — | $ | 4,976,774 | $ | — | ||||||
- (1)
- The
Company's Level 2 financial liabilities consist of long term investor warrant liabilities comprised of the Warrant As, Warrant Cs,
the warrants issued to the investors in connection with the 2007 preferred stock financing (the "2007 Financing Warrants") and the placement agent warrants. The fair value of the Warrant As and
Warrant Cs is being estimated using a binomial lattice model for the portion not included in the outstanding call option at December 31, 2010 and for approximately 50% of the outstanding
Warrant As and Warrant Cs subject to the call the valued using their intrinsic value and the fair value of the placement agent warrants and the 2007 Financing Warrants is being estimated
using the Black-Scholes option pricing model. (see Note G. Warrant Liabilities; Note I—Redeemable Convertible Series B and Series C Preferred Stock; and
"Warrant Liabilities" below).
- (2)
- Included as a component of cash and cash equivalents on accompanying consolidated balance sheets.
Warrant Liabilities
On January 1, 2009, the Company adopted ASC 815-40-15 to evaluate whether an instrument is considered indexed to an entity's own stock. The Company's evaluation of the 2007 Financing Warrants determined that the 2007 Financing Warrants covering 19,799,023 shares of common stock did not qualify for a scope exception under ASC 815-40-15 as they were determined not to be indexed to the Company's stock as prescribed by ASC 815-40-15. As a result, on the date of adoption, January 1, 2009, the Company reclassified these warrants from additional paid in capital to warrant liabilities through a cumulative effect of a change in accounting principle. The initial value of the warrant liability at adoption was $22,041,541.
For the period through July 3, 2009, the Company recorded a charge to change in fair value of warrants of approximately $3.2 million for the increase in the fair value related to these warrants during the period. The warrants did not qualify for hedge accounting, and as such, all subsequent changes in the fair value of these warrants were recognized currently in earnings until such time as the
57
SATCON TECHNOLOGY CORPORATION
NOTES TO CONSOLIDATED FINANCIAL STATEMENTS (Continued)
DECEMBER 31, 2010, 2009 AND 2008
C. SIGNIFICANT ACCOUNTING POLICIES AND BASIS OF PRESENTATION (Continued)
warrants were modified in the manner described below, or exercised or expired. These common stock purchase warrants do not trade in an active securities market, and as such, the Company estimated the fair value of these warrants using the Black-Scholes option pricing model using the following assumptions:
| |
January 1, 2009 | April 4, 2009 | July 3, 2009 | |||
|---|---|---|---|---|---|---|
Assumptions: |
||||||
Expected life |
5.9 - 6.7 years | 5.6 - 6.5 years | 5.4 - 6.2 years | |||
Expected volatility |
80% - 85% | 75% - 85% | 75% - 80% | |||
Dividends |
none | none | none | |||
Risk-free interest rate |
1.69% - 1.83% | 2.06% - 2.35% | 2.56% - 2.87% |
On July 3, 2009, the Company modified certain provisions contained within the 2007 Financing Warrants. Under the terms of the original 2007 Financing Warrants (prior to their modification), in addition to standard anti-dilution protection for stock splits or dividends, stock combinations, mergers, liquidation or similar events, the exercise price and number of shares issuable upon exercise of these warrants were subject to adjustment in the event of certain dilutive issuances (the "Dilutive Issuance Provision"). Upon each adjustment of the exercise price pursuant to the Dilutive Issuance Provision, the number of shares subject to the warrant were also to be adjusted by multiplying the current exercise price prior to the adjustment by the number of shares subject to the warrant and dividing the product by the exercise price resulting from the adjustment. The Dilutive Issuance Provision was modified to (i) limit the instances in which a dilutive issuance will cause an adjustment to the exercise price of the warrants and (ii) eliminate the provision that correspondingly increased the number of shares underlying the warrants in the event of a dilutive issuance that causes an adjustment to the exercise price. As a result of this modification these warrants were determined to be equity instruments by the Company, as they now qualify for the scope exception under ASC 815-40-15. Previously the warrants, due to the adoption of the provisions of ASC 815-40, were accounted for as a derivative liability. The Company is no longer required to mark these warrants to fair value each quarter. See Note G. Warrant Liabilities.
In addition, the Company determined the fair value of the investor warrants (the Warrant As and Warrant Cs) and placement agent warrants using valuation models it considers to be appropriate. The Company's stock price has the most significant influence on the fair value of its warrants. An increase in the Company's common stock price would cause the fair values of the warrants to increase, because the exercise price of the warrants is fixed at $1.815 per share, and result in a charge to our statement of operations. A decrease in the Company's stock price would likewise cause the fair value of the warrants to decrease and result in a credit to our statement of operations. See Note G. for valuation discussion.
Redeemable Convertible Series B Preferred Stock
The Company initially accounted for its issuance of Series B Preferred Stock and associated warrants by allocating the proceeds received net of transaction costs based on the relative fair value of the Series B Preferred Stock and the warrants issued to the investors, and then to any beneficial conversion rights contained in the convertible redeemable preferred securities. The Company
58
SATCON TECHNOLOGY CORPORATION
NOTES TO CONSOLIDATED FINANCIAL STATEMENTS (Continued)
DECEMBER 31, 2010, 2009 AND 2008
C. SIGNIFICANT ACCOUNTING POLICIES AND BASIS OF PRESENTATION (Continued)
determined the initial value of the Series B Preferred Stock and investor warrants using valuation models it considers to be appropriate. The Series B Preferred Stock was classified within the liability section of the Company's balance sheet.
In October 2010, the holders of the remaining 75 shares of Series B Preferred Stock converted their shares into common stock, resulting in the issuance of 251,677 shares of common stock.
Redeemable Convertible Series C Preferred Stock
The Company initially accounted for its issuance of Series C Preferred Stock and associated warrants by allocating the proceeds received net of transaction costs based on the relative fair value of the Series C Preferred Stock and the warrants issued to the investors, and then to any beneficial conversion rights contained in the convertible redeemable preferred securities. The Series C Preferred Stock is classified as temporary equity on the balance sheet. The Company determined the initial value of the Series C Preferred Stock and investor warrants using valuation models it considers to be appropriate. The Company used the effective interest method to accrete the carrying value of the Series C Preferred Stock through the earliest possible redemption date (November 8, 2011), at which time the value of the Series C Preferred Stock would have been $30.0 million or 120% of its face value and dividends.
On October 27, 2010, the holders of all of the outstanding shares of Series C Preferred Stock converted their shares and accumulated dividends into common stock, resulting in the issuance of 27,526,344 shares of common stock. To induce the Series C Preferred Stock holders to convert their shares, the Company paid these holders an aggregate $1.25 million in cash upon conversion. The entitlement to a redemption of the Series C Preferred Shares was eliminated upon the holders' conversion of the Series C Preferred Stock into common shares in October 2010.
D. DISCONTINUED OPERATIONS
In January 2010, the Company sold its Applied Technology business unit for approximately $1.0 million in cash and $0.5 million in working capital retained at the date of the sale. Prior to the sale the Applied Technology business unit was reported by the Company as its own operating segment. Operations associated with the Applied Technology business unit have been reclassified as income (loss) from discontinued operations in the accompanying consolidated statements of operations, and cash flows associated with this segment are included in cash flows from discontinued operations in the consolidated statements of cash flows. The Company evaluated the assets of the Applied Technology business unit and as of December 31, 2009 had classified them as held for sale. The Company recorded a gain on the sale of the Applied Technology business unit of approximately $0.5 million in its results of operations for the first quarter of 2010.
On September 26, 2008, the Company sold its Electronics and Power Systems US business segments to two unrelated companies, for approximately $5.6 million in cash and $0.5 million of retained accounts receivable. The Company recorded a gain on the sale of the Electronics and Power Systems US business segments of approximately $0.3 million in 2008. Prior to the sale, each of these divisions were reported by the Company as its own operating segment. Operations associated with these discontinued segments have been classified as loss from discontinued operations in the accompanying
59
SATCON TECHNOLOGY CORPORATION
NOTES TO CONSOLIDATED FINANCIAL STATEMENTS (Continued)
DECEMBER 31, 2010, 2009 AND 2008
D. DISCONTINUED OPERATIONS (Continued)
consolidated statements of operations, and cash flows associated with these segments are included in cash flows from discontinued operations in the consolidated statements of cash flows. Net sales and net income (loss) from discontinued operations by division was as follows:
| |
Year Ended December 31, | ||||||||||
|---|---|---|---|---|---|---|---|---|---|---|---|
Division
|
2010 | 2009 | 2008 | ||||||||
Electronics |
|||||||||||
Net Sales |
— | — | $ | 8,250,768 | |||||||
Net Loss |
— | — | $ | (1,094,326 | ) | ||||||
Power Systems, US |
|||||||||||
Net Sales |
— | — | $ | 5,021,022 | |||||||
Net Loss |
— | — | $ | (40,406 | ) | ||||||
Applied Technology |
|||||||||||
Net Sales |
— | $ | 6,232,687 | $ | 8,228,769 | ||||||
Net Income (Loss) |
$ | 31,390 | $ | 91,677 | $ | (734,594 | ) | ||||
Discontinued Operations |
|||||||||||
Total Net Sales |
— | $ | 6,232,687 | $ | 21,500,559 | ||||||
Total Net Income (Loss) |
$ | 31,390 | $ | 91,677 | $ | (1,869,326 | ) | ||||
The Company has not allocated interest to discontinued operations. The Company has also eliminated all intercompany activity associated with discontinued operations.
The net assets of the Electronics and Power Systems US divisions at December 31, 2010 and 2009 were $0. The net assets of the Applied Technology division as of December 31, 2010 were $0 and at December 31, 2009 consisted of the following, which have been reclassified in the accompanying consolidated balance sheets:
| |
December 31, 2009 |
|||
|---|---|---|---|---|
Prepaid expenses |
$ | 35,004 | ||
Current assets of discontinued operations |
$ | 35,004 | ||
Property and equipment, net |
56,076 | |||
Goodwill other long-term assets |
168,151 | |||
Non-current assets of discontinued operations |
$ | 224,227 | ||
Accrued payroll and related expenses |
$ | 117,702 | ||
Current liabilities of discontinued operations |
$ | 117,702 | ||
Long-term liabilities of discontinued operations |
$ | — | ||
60
SATCON TECHNOLOGY CORPORATION
NOTES TO CONSOLIDATED FINANCIAL STATEMENTS (Continued)
DECEMBER 31, 2010, 2009 AND 2008
E. INVENTORY
Inventory includes material, labor and overhead and consisted of the following:
| |
December 31, | ||||||
|---|---|---|---|---|---|---|---|
| |
2010 | 2009 | |||||
Raw material |
$ | 16,930,407 | $ | 7,268,446 | |||
Work-in-process |
2,881,150 | 2,588,205 | |||||
Finished goods |
20,731,336 | 2,041,920 | |||||
|
$ | 40,542,893 | $ | 11,898,571 | |||
The provision for excess and obsolete inventory, from continuing operations, net of usage, for the years ended December 31, 2010, 2009 and 2008 was $1,089,950, $185,577 and $360,035, respectively.
F. PROPERTY AND EQUIPMENT
Property and equipment consisted of the following:
| |
December 31, | ||||||
|---|---|---|---|---|---|---|---|
| |
2010 | 2009 | |||||
Machinery and equipment |
$ | 5,121,820 | $ | 4,153,178 | |||
Assets under construction |
785,152 | 1,616,022 | |||||
Furniture and fixtures |
991,493 | 324,689 | |||||
Computer hardware / software |
1,099,000 | 707,667 | |||||
Leasehold improvements |
4,226,452 | 1,098,882 | |||||
|
$ | 12,223,917 | $ | 7,900,438 | |||
Less: accumulated depreciation and amortization |
(4,939,632 | ) | (3,266,512 | ) | |||
|
$ | 7,284,285 | $ | 4,633,926 | |||
Depreciation and amortization expense from continuing operations relating to property and equipment for the years ended December 31, 2010, 2009 and 2008 was $1.5 million, $1.3 million and $0.8 million, respectively.
G. WARRANT LIABILITIES
Warrants Issued in Connection with the July 2006 Financing
In connection with the July 19, 2006 private placement of $12.0 million aggregate principal amount of senior secured convertible notes (which notes were subsequently retired by cash redemption in November 2007), the Company issued:
Warrant As
The Warrant As originally entitled the holders thereof to purchase up to an aggregate of 3,636,368 shares of the Company's common stock at a price of $1.815 per share for a period beginning six months from the date of such warrants and ending on the seventh anniversary of the date of such warrants. The period prior to six months from the date of the warrants is hereinafter referred to as the
61
SATCON TECHNOLOGY CORPORATION
NOTES TO CONSOLIDATED FINANCIAL STATEMENTS (Continued)
DECEMBER 31, 2010, 2009 AND 2008
G. WARRANT LIABILITIES (Continued)
"non-exercise period." The exercise price and the number of shares underlying these warrants are subject to adjustment for stock splits, stock dividends, combinations, distributions of assets or evidence of indebtedness, mergers, consolidations, sales of all or substantially all assets, tender offers, exchange offers, reclassifications or compulsory share exchanges.
If a change of control of the Company occurs, as defined, the holders may elect to require the Company to purchase the Warrant As for a purchase price equal to the Black-Scholes value of the remaining unexercised portion of each Warrant A.
For so long as any Warrant As remain outstanding, the Company may not issue any common stock or common stock equivalents at a price per share less than $1.65. In the event of a breach of this provision, the holders may elect to require the Company to purchase the Warrant As for a purchase price equal to the Black-Scholes value of the remaining unexercised portion of each Warrant A. As a result of the November 8, 2007 and December 20, 2007 preferred stock financing, as described in Note I below, the holders were entitled for a limited period of time (45 days after each issuance) to exercise this right. During fiscal 2007, the Company paid approximately $1.4 million to redeem Warrant As representing 1,242,426 shares of common stock. During 2008, the Company paid approximately $0.4 million to redeem Warrant As representing 303,031 shares of common stock. (See table below for assumptions used in valuing the warrants redeemed). During 2010 warrants to purchase 954,547 shares of common stock were exercised. As of December 31, 2010, Warrant As to purchase 1,136,364 shares of common stock were outstanding.
If the closing bid price per share of our common stock for any 20 consecutive trading days exceeds 200% of the exercise price, then, if certain conditions are satisfied, including certain equity conditions, the Company may require the holders of the Warrant As to exercise up to 50% of the unexercised portions of such warrants. If the closing bid price per share of our common stock for any 20 consecutive trading days exceeds 300% of the exercise price, then, if certain equity conditions are satisfied, the Company may require the holders of the Warrant As to exercise all or any part of the unexercised portions of such warrants.
Warrant Bs
The Warrant Bs entitled the holders thereof to purchase up to an aggregate of 3,636,368 shares of the Company's common stock at a price of $1.68 per share for a period of 90 trading days beginning the later of six months from the date of such warrants and the date the SEC declares effective the Registration Statement. As a result of an amendment, the expiration date of the Warrant Bs was extended to August 31, 2007.
On July 17, 2007, the holders of the Warrant Bs exercised such warrants in full, acquiring 3,636,638 shares of common stock at $1.31 per share. The Company received proceeds of approximately $4.8 million. To entice the holders of the Warrant Bs to exercise such warrants the Company reduced the exercise price from $1.68 to $1.31 per share. As a result of reducing the exercise price the Company recorded a charge to operations in 2007 related to the warrant modification of approximately $0.9 million to change in fair value of the Convertible Notes and warrants on the accompanying statement of operations. Pursuant to the original terms of the Warrant Bs, upon exercise of the Warrant Bs, the warrant holders were entitled to receive additional warrants ("Warrant Cs") to
62
SATCON TECHNOLOGY CORPORATION
NOTES TO CONSOLIDATED FINANCIAL STATEMENTS (Continued)
DECEMBER 31, 2010, 2009 AND 2008
G. WARRANT LIABILITIES (Continued)
purchase a number of shares of common stock equal to 50% of the number of shares of common stock purchased upon exercise of the Warrant Bs. As a result of the full exercise of the Warrant Bs, the holders received Warrant Cs to purchase 1,818,187 shares of common stock at an exercise price of $1.815 per share for a period beginning six months from the date of such warrants and ending on the seventh anniversary of the date of such warrants.
Warrant Cs
As discussed above, upon the exercise of the Warrant Bs, the holders were entitled to receive additional warrants (the "Warrant Cs"). The Warrant Cs originally entitled the holders thereof to purchase up to an aggregate of 1,818,187 shares of our common stock at a price of $1.815 per share for a period beginning six months from the date of such warrants and ending on the seventh anniversary of the date of such warrants. The period prior to six months from the date of the warrants is hereinafter referred to as the "non-exercise period." The exercise price and the number of shares underlying these warrants are subject to adjustment for stock splits, stock dividends, combinations, distributions of assets or evidence of indebtedness, mergers, consolidations, sales of all or substantially all assets, tender offers, exchange offers, reclassifications or compulsory share exchanges.
If a change of control of the Company occurs, as defined, the holders may elect to require the Company to purchase the Warrant Cs for a purchase price equal to the Black-Scholes value of the remaining unexercised portion of each Warrant C.
For so long as any Warrant Cs remain outstanding, the Company may not issue any common stock or common stock equivalents at a price per share less $1.65. In the event of a breach of this provision, the holders may elect to require the Company to purchase the Warrant Cs for a purchase price equal to the Black-Scholes value of the remaining unexercised portion of each Warrant C. As a result of the November 8, 2007 and December 20, 2007 preferred stock financing, as described in Note I below, the holders were entitled for a limited period of time (45 days after each issuance) to exercise this right. During 2007, the Company paid approximately $0.7 million to redeem Warrant Cs representing 621,215 shares of common stock. During 2008, the Company paid approximately $0.2 million to redeem Warrant Cs representing 151,516 shares of common stock. (See table below for assumptions used in valuing the warrants redeemed). During 2010 warrants to purchase 431,819 shares of common stock were exercised. As of December 31, 2010, Warrant Cs to purchase 613,637 shares of common stock were outstanding.
If following the later of (i) the effective date of the Registration Statement and (ii) the six month anniversary of the issuance date, the volume weighted average price per share of the Company's common stock for any 20 consecutive trading days exceeds 200% of the exercise price, then, if certain conditions are satisfied, the Company may require the holders of the Warrant Cs to exercise up to 50% of the unexercised portions of such warrants. If following the 24 month anniversary of the issuance date, the volume weighted average price per share of the Company's common stock for any 20 consecutive trading days exceeds 300% of the exercise price, then, if certain equity conditions are satisfied, the Company may require the holders of the Warrant Cs to exercise all or any part of the unexercised portions of such warrants. During 2010 the Company notified the holders of the outstanding Warrant As and Warrant Cs that the holders were required to exercise 50% of their un-exercised warrants. As a result of this notification by the Company holders of Warrant As exercised
63
SATCON TECHNOLOGY CORPORATION
NOTES TO CONSOLIDATED FINANCIAL STATEMENTS (Continued)
DECEMBER 31, 2010, 2009 AND 2008
G. WARRANT LIABILITIES (Continued)
warrants to purchase 469,699 shares of common stock and holders of Warrant Cs exercised warrants to purchase 234,849 shares of common stock. Subsequent to December 31, 2010 an additional 580,303 Warrant As and 265,152 Warrant Cs were exercised as a result of notification sent out to the remaining holders of the Warrant As and Warrant Cs.
The table below summarizes Black-Scholes option pricing model range of assumptions that were used in valuing the warrants redeemed for both the Warrant As and Warrant Cs.
| |
Warrant As | Warrant Cs | ||
|---|---|---|---|---|
Assumptions: |
||||
Expected life |
5.68 years to 5.69 years | 6.67 years to 6.68 years | ||
Expected volatility ranging from |
83.0% | 85.0% | ||
Dividends |
none | none | ||
Risk-free interest rate |
3.75% - 3.84% | 3.85% - 3.93% |
Placement Agent Warrants
First Albany Capital ("FAC") acted as placement agent in connection with the July 19, 2006 private placement. In addition to a cash transaction fee, FAC or its designees were entitled to receive five-year warrants to purchase 218,182 shares of the Company's common stock at an exercise price of $1.87 per share. As of December 31, 2010 and 2009, Placement Agent warrants to purchase 218,182 shares of common stock were outstanding, respectively.
Accounting for the Warrants
Upon issuance, the Warrant As, Warrant Bs and Warrant Cs, along with the Placement Agent Warrants (together the "Warrants"), did not meet the requirements for equity classification, because such warrants (a) must be settled in registered shares, (b) are subject to substantial liquidated damages if the Company is unable to maintain the effectiveness of the resale registration of the shares and (c) there is a cash-out election using a Black-Scholes valuation under various circumstances. Therefore these Warrants are required to be accounted for as freestanding derivative instruments. Changes in fair value are recognized as either a gain or loss in the statement of operations under the caption "Change in fair value of notes and warrants."
Upon issuance, the Company allocated $2.7 million of the initial proceeds to the Warrants and immediately marked them to fair value resulting in a derivative liability of $4.9 million and a charge to other expense of $2.2 million. As of December 31, 2010 and 2009, the remaining outstanding Warrants have been marked to fair value resulting in a derivative liability of $5.5 million and $5.0 million, respectively.
The credit / (charge) to Change in fair value of notes and warrants, for the year ended December 31, 2010, 2009 and 2008 was ($3.2) million, ($2.6) million and $0.3 million, respectively, related to Warrant As, Bs and Cs and placement agent warrants. The Company also recorded a charge to Change in Fair Value of notes and warrants related to its Series C Preferred Stock warrants of ($3.2) million for the year ended December 31, 2009.
64
SATCON TECHNOLOGY CORPORATION
NOTES TO CONSOLIDATED FINANCIAL STATEMENTS (Continued)
DECEMBER 31, 2010, 2009 AND 2008
G. WARRANT LIABILITIES (Continued)
A summary of the changes in the fair value of the warrant liabilities:
Balance at December 31, 2007 |
$ | 3,244,316 | |||
Fair value adjustment(2) |
(836,878 | ) | |||
Change in fair value of redeemed Warrant As and Cs at redemption(1)(2) |
572,250 | ||||
Warrant Redemptions: |
|||||
—Cash Paid for Warrant A redemption(1) |
(387,591 | ) | |||
—Cash paid for Warrant C redemption(1) |
(184,659 | ) | |||
Balance at December 31, 2008 |
$ | 2,407,438 | |||
Change in accounting principle(3) |
22,041,541 | ||||
Fair value adjustment(2) |
2,569,336 | ||||
Series C Preferred Stock Warrant fair value adjustment(2) |
3,152,244 | ||||
Reclassification of Series C Preferred Stock Warrants to equity(4) |
(25,193,785 | ) | |||
Balance at December 31, 2009 |
$ | 4,976,774 | |||
Warrants exercised |
(2,684,988 | ) | |||
Fair value adjustment(2) |
3,162,323 | ||||
Balance at December 31, 2010 |
$ | 5,454,109 | |||
- (1)
- As
a result of the 2007 Series C preferred stock financing, certain holders of both Warrant As (1,242,426) and Warrant Cs (621,215),
through December 31, 2007, exercised their right of redemption, resulting in the Company paying to each redeeming warrant holder the Black-Scholes value of these warrants on the date of
notification of redemption. During the year ended December 31, 2008, holders of both Warrant As (303,031) and Warrant Cs (151,516) exercised their right of redemption, resulting
in the Company paying to each redeeming warrant holder the Black-Scholes value of these warrants on the date of notification of redemption.
- (2)
- Amounts
included in change in fair value of warrants on consolidated statement of operations.
- (3)
- 19,799,022
of the Company's issued and outstanding common stock purchase warrants previously treated as equity pursuant to the derivative treatment
exemption were no longer afforded equity treatment. As such, effective January 1, 2009 the Company reclassified the fair value of these common stock purchase warrants, which have exercised
price reset features, from equity to liability status as if these warrants were treated as derivative liability since their date of issuance.
- (4)
- On July 3, 2009, the Company modified certain provisions contained within the common stock purchase warrants issued in connection with the Series C Preferred Stock financing. See Note C. Significant Accounting Policies and Basis of Consolidation—Warrant Liabilities for a description of the modifications. As a result of these modifications 19,799,023 of the Company's issued and outstanding common stock purchase warrants, previously treated as a derivative liability on January 1, 2009 will now be treated as equity pursuant to the derivative treatment exemptions afforded the Company. In addition, as a result of this modification, the Company will no longer be required to mark these warrants to their fair value each quarter.
65
SATCON TECHNOLOGY CORPORATION
NOTES TO CONSOLIDATED FINANCIAL STATEMENTS (Continued)
DECEMBER 31, 2010, 2009 AND 2008
G. WARRANT LIABILITIES (Continued)
Valuation—Methodology and Significant Assumptions
The valuation of derivative instruments utilizes certain estimates and judgments that affect the fair value of the instruments. Fair values for the Company's derivatives are estimated by utilizing valuation models that consider current and expected stock prices, volatility, dividends, forward yield curves and discount rates. Such amounts and the recognition of such amounts are subject to significant estimates which may change in the future.
In estimating the fair value of the Warrants the following methods and significant input assumptions were applied:
- •
- An Intrinsic value was utilized to estimate the fair value of Warrant As and Warrant Cs upon their
respective exercise dates during the year ended December 31, 2010. According to options theory, the value of an option equals the sum of its intrinsic value and time value and as it approaches
exercise/expiration date, time value approaches zero. On the date of the exercise/expiration, time value of a warrant becomes zero and the value of the option equals its intrinsic value. Intrinsic
value, for in-the-money options, represents the difference between the strike price and the price of the underlying asset as of expiration/exercise date. Gain/(loss) as of
exercise date is determined based on the difference between the option's intrinsic value and its fair value as of last measurement/reporting date, with any decrease (increase) in value representing a
gain (loss).
- •
- A binomial lattice model was utilized to estimate the fair value of Warrant As and Warrant Cs on the dates in the corresponding table below, as well as the fair value of the Placement Agent Warrants on the dates in the corresponding table below. The binomial model considers the key features of the Warrants, and is subject to the significant assumptions discussed below. First, a discrete simulation of the Company's stock price was conducted at each node and throughout the expected life of the instrument. Second, an analysis of the higher of a holding position (i.e., fair value of a future node value discounted using an applicable discount rate) or exercise position was conducted relative to each node, which considers the non-exercise period, until a
Methods
66
SATCON TECHNOLOGY CORPORATION
NOTES TO CONSOLIDATED FINANCIAL STATEMENTS (Continued)
DECEMBER 31, 2010, 2009 AND 2008
G. WARRANT LIABILITIES (Continued)
final fair value of the instrument is concluded at the node representing the valuation date. This model requires the following key inputs with respect to the Company and/or instrument:
| |
Warrant As | |||||||||||||||||||||||||||
|---|---|---|---|---|---|---|---|---|---|---|---|---|---|---|---|---|---|---|---|---|---|---|---|---|---|---|---|---|
Input
|
Dec. 31, 2007 |
Dec. 31, 2008 |
Dec. 31, 2009 |
Jan. 7, 2010 |
Jan. 14, 2010 |
April 26, 2010 |
May 12, 2010 |
July 27, 2010 |
Dec. 31, 2010 |
|||||||||||||||||||
Quoted Stock Price |
$ | 1.650 | $ | 1.55 | $ | 2.82 | $ | 2.78 | $ | 2.77 | $ | 2.88 | $ | 2.74 | $ | 3.41 | $ | 4.50 | ||||||||||
Exercise Price |
$ | 1.815 | $ | 1.815 | $ | 1.815 | 1.815 | $ | 1.815 | $ | 1.815 | $ | 1.815 | $ | 1.815 | $ | 1.815 | |||||||||||
Time to Maturity (in years) |
5.60 | 4.60 | 3.60 | 3.6 | 3.6 | 3.2 | 3.2 | 3.0 | 2.6 | |||||||||||||||||||
Stock Volatility |
83 | % | 73 | % | 75 | % | 75 | % | 75 | % | 75 | % | 75 | % | 75 | % | 70 | % | ||||||||||
Risk-Free Rate |
3.53 | % | 1.44 | % | 2.00 | % | 1.74 | % | 1.74 | % | 1.0 | % | 1.0 | % | 0.6 | % | .84 | % | ||||||||||
Dividend Rate |
0 | % | 0 | % | 0 | % | 0 | % | 0 | % | 0 | % | 0 | % | 0 | % | 0 | % | ||||||||||
Non-Exercise Period |
N/A | N/A | N/A | N/A | N/A | N/A | N/A | N/A | N/A | |||||||||||||||||||
| |
Warrant Cs | |
|
|
|
|||||||||||||||||||||||
Input |
Dec. 31, 2007 |
Dec. 31, 2008 |
Dec. 31, 2009 |
Jan. 14, 2010 |
Dec. 31, 2010 |
|||||||||||||||||||||||
Quoted Stock Price |
$ | 1.650 | $ | 1.55 | $ | 2.82 | $ | 2.77 | $ | 4.50 | ||||||||||||||||||
Exercise Price |
$ | 1.815 | $ | 1.815 | $ | 1.815 | $ | 1.815 | $ | 1.815 | ||||||||||||||||||
Time to Maturity (in years) |
6.5 | 5.50 | 4.50 | 4.5 | 3.6 | |||||||||||||||||||||||
Stock Volatility |
85 | % | 80 | % | 75 | % | 75 | % | 70 | % | ||||||||||||||||||
Risk-Free Rate |
3.64 | % | 1.63 | % | 2.44 | % | 2.22 | % | 1.29 | % | ||||||||||||||||||
Dividend Rate |
0 | % | 0 | % | 0 | % | 0 | % | 0 | % | ||||||||||||||||||
Non-Exercise Period |
Until 1/17/08 | N/A | N/A | N/A | N/A | |||||||||||||||||||||||
- (1)
- Warrant Cs were issued on July 17, 2007 upon the exercise of the Warrant Bs.
- (1)
- A Black-Scholes option pricing model was utilized to estimate the fair value of Placement Agent Warrants on the dates in the corresponding table shown below. A change in method from the binomial to Black-Scholes was warranted because the warrants' non-exercise period ended prior to the valuation date and all required inputs were fixed. This model requires the following key inputs with respect to the Company and/or instrument:
Input
|
Dec. 31, 2008 |
Dec. 31, 2009 |
Dec. 31, 2010 |
|||||||
|---|---|---|---|---|---|---|---|---|---|---|
Quoted Stock Price |
$ | 1.55 | $ | 2.82 | $ | 4.50 | ||||
Exercise Price |
$ | 1.87 | $ | 1.87 | $ | 1.87 | ||||
Time to Maturity (in years) |
2.55 | 1.55 | 0.55 | |||||||
Stock Volatility |
80 | % | 75 | % | 60 | % | ||||
Risk-Free Rate |
0.89 | % | 0.84 | % | .20 | % | ||||
Dividend Rate |
0 | % | 0 | % | 0 | % | ||||
Non-Exercise Period |
N/A | N/A | N/A | |||||||
- •
- Stock volatility was estimated by annualizing the daily volatility of the Company's stock price during the historical period preceding the respective valuation dates and measured over a period
Significant Assumptions:
67
SATCON TECHNOLOGY CORPORATION
NOTES TO CONSOLIDATED FINANCIAL STATEMENTS (Continued)
DECEMBER 31, 2010, 2009 AND 2008
G. WARRANT LIABILITIES (Continued)
- •
- The volume weighted average price for the 20 trading days preceding a payment date was reasonably approximated by the
average of the simulated stock price at each respective node of the binomial model;
- •
- Based on the Company's historical operations and management expectations for the near future, the Company's stock was
assumed to be a non-dividend-paying stock;
- •
- The quoted market price of the Company's stock was utilized in the valuations because the derivative guidance requires the use of quoted market prices without considerations of blockage discounts. The quoted market price of the Company's stock as of measurement dates and expected future stock prices were assumed to reflect the effect of dilution upon conversion of the instruments to shares of common stock.
corresponding to the remaining life of the instruments. Historic stock prices were used to estimate volatility as the Company did not have traded options as of the valuation dates;
H. DEBT INSTRUMENTS
On February 26, 2008, the Company entered into a Loan and Security Agreement (the "Loan Agreement") with Silicon Valley Bank (the "Bank"). Under the terms of the Loan Agreement, the Bank agreed to provide the Company with a credit line up to $10.0 million. The Company's obligations under the Loan Agreement are secured by substantially all of the assets of the Company and advances under the Loan Agreement are limited to 80% of eligible receivables and the lesser of 25% of the value of the Company's eligible inventory, as defined, or $1.0 million. Interest on outstanding borrowings accrued at a rate per annum equal to the Prime Rate plus one percent (1.0%) per annum, as defined, or the LIBOR Rate plus three and three quarter percent (3.75%) per annum. The Loan Agreement contained certain financial covenants relating to tangible net worth, as defined, which the Company must satisfy in order to borrow under the agreement. In addition, the Company agreed to pay to the Bank a collateral monitoring fee of $750 per month and agreed to the following additional terms: (i) $50,000 commitment fee, $25,000 to be paid at signing of the Loan Agreement and $25,000 to be paid on the one year anniversary of the Loan Agreement; (ii) an unused line fee in the amount of 0.5% per annum of the average unused portion of the revolving line; and (iii) an early termination fee of 0.5% of the total credit line if the Company terminated the Loan Agreement prior to 12 months from the Loan Agreement's effective date.
During 2010, the Company entered into several amendments to Loan Agreement. At December 31, 2010 the terms of the Loan Agreement are as follows:
- (i)
- The
Loan Agreement expires on October 18, 2011,
- (ii)
- The
credit line was increased to $15,000,000,
- (iii)
- Interest
on outstanding formula-based borrowings accrues at a rate per annum equal to the Prime Rate plus one half percent (.50%) per annum,
- (iv)
- the
Company's tangible net worth covenant, as defined, was eliminated
- (v)
- the Company's liquidity covenant, as defined, was set at approximately $5.0 million until March 31, 2011 and thereafter at approximately $6.5 million and
68
SATCON TECHNOLOGY CORPORATION
NOTES TO CONSOLIDATED FINANCIAL STATEMENTS (Continued)
DECEMBER 31, 2010, 2009 AND 2008
H. DEBT INSTRUMENTS (Continued)
- (vi)
- a
covenant relating to adjusted earnings before interest, taxes, depreciation and amortization ("Adjusted EBITDA"), was added.
- (vii)
- The Company's obligation under the Loan Agreement continues to be secured by substantially all of the assets of the Company.
At December 31, 2010 and December 31, 2009, the Company had $15.0 million and $3.0 million outstanding under the Loan Agreement and the Bank's prime rate was 4%. The rate used was the Bank's prime rate of 4.0% plus 0.50% (or 4.5% at December 31, 2010) and 4.0% plus 1% (or 5% at December 31, 2009). Subsequent to December 31, 2010 the Company repaid $15.0 million outstanding on the line of credit. At December 31, 2010, the Company was in compliance with the liquidity and Adjusted EBITDA covenant requirements. As of December 31, 2010, the Company had $0 available under the line of credit.
Notes Payable
On June 16, 2010, the Company entered into a Venture Loan and Security Agreement with Compass Horizon Funding Company LLC (the "Lender") pursuant to which the Lender has loaned the Company $12,000,000 (the "Subordinated Loan"). After the Lender's closing fees and expenses, the net proceeds to the Company were $11,826,500. Interest on the Subordinated Loan will accrue at a rate per annum equal to 12.58%. The Subordinated Loan is subordinated to up to $15,000,000 of senior indebtedness, provided that from and after August 31, 2010, the senior indebtedness cannot exceed an amount equal to 80% of the Company's accounts receivable plus 40% of its inventory. The Subordinated Loan is to be repaid over 42 months following the closing. From June 15, 2010 through April 30, 2011, the Company is only required to pay interest on the Subordinated Loan and thereafter the Subordinated Loan will be repaid in 33 substantially equal monthly installments of interest and principal. The Subordinated Loan may be prepaid by the Company by paying all accrued interest through the date of payment, the then outstanding principal balance and a prepayment premium equal to a declining percentage of the principal amount outstanding at the time of prepayment (initially 4% during the first twelve months of the subordinated Loan, decreasing to 3% for the succeeding twelve months and 2% thereafter). In connection with the Subordinated Loan, the Company has issued to the Lender five year warrants to acquire up to an aggregate of 591,716 shares of the Company's common stock at an exercise price of $2.43 per share (which was the 20-day trailing volume weighted average price of the Company's common stock). The relative fair value of the warrants was $0.9 million and will be recorded as interest expense over the term of the loan. The Company estimated the fair value of the warrants using the Black-Scholes option pricing model using the following assumptions:
| |
June 16, 2010 | |||
|---|---|---|---|---|
Assumptions: |
||||
Expected life |
5 years | |||
Expected volatility |
74.9 | % | ||
Dividends |
none | |||
Risk-free interest rate |
2.0 | % | ||
69
SATCON TECHNOLOGY CORPORATION
NOTES TO CONSOLIDATED FINANCIAL STATEMENTS (Continued)
DECEMBER 31, 2010, 2009 AND 2008
H. DEBT INSTRUMENTS (Continued)
The Subordinated Loan is to be repaid over 42 months as follows:
Fiscal Year
|
Principal Repayment |
|||
|---|---|---|---|---|
2011 |
$ | 2,541,720 | ||
2012 |
4,233,191 | |||
2013 |
4,797,531 | |||
2014 |
427,558 | |||
Total |
$ | 12,000,000 | ||
I. REDEEMABLE CONVERTIBLE SERIES B AND SERIES C PREFERRED STOCK
Series B Convertible Preferred Stock
On October 31, 2003, the Company completed a $7.7 million equity transaction involving the issuance of 1,535 shares of its Series B Convertible Preferred Stock, $0.01 par value per share (the "Series B Preferred Stock"), and warrants to purchase up to 1,228,000 shares of the Company's common stock, to accredited investors (the "October 2003 Financing Transaction"). In connection with the October 2003 Financing Transaction, the Company issued shares of Series B Preferred Stock for $5,000 per share. The Series B Preferred Stock was convertible into a number of shares of common stock equal to $5,000 divided by the conversion price of the Series B Preferred Stock, which was initially $2.50. As of December 31, 2009, and 2008 the conversion price for the Series B Preferred Stock was $1.49 (as a result of adjustments to the conversion price following issuance in accordance with the terms of the Series B Preferred Stock) and$1.55, respectively. During 2009, 215 shares of Series B Preferred Stock were converted by their holders resulting in the Company issuing 719,528 shares of common stock. During 2010, the remaining 75 shares of Series B Preferred Stock were converted by their holders resulting in the company issuing 251,677 shares of common stock. As of December 31, 2010 and 2009, 0 and 75 shares of Series B Preferred Stock were outstanding, respectively. As of December 31, 2009, the liquidation preference of the remaining 75 shares of Series B Preferred Stock was $375,000, and these were convertible into 251,677 shares of common stock.
As a result of the issuance of shares of approximately 17.9 million shares of common stock during the year ended December 31, 2009, the Company adjusted the conversion price on the Series B Preferred Stock to $1.49 from $1.55 at December 31, 2008 and recorded a charge of $55,369.
Dividends on Series B Preferred Stock
The shares of Series B Preferred Stock initially bore a cumulative dividend at a rate of 6% per annum; pursuant to its terms, this was increased to a rate of rate of 8% per annum on October 1, 2005. Dividends on the Series B Preferred Stock were payable semi-annually and, except in certain limited circumstances, were entitled to be paid by the Company, at its option, either through the issuance of shares of common stock or in cash. The Company elected to pay the dividend in shares of common stock, and issued a number of shares of common stock equal to the quotient of the dividend payment divided by the greater of 80% of the average closing bid and ask price of the common stock on the
70
SATCON TECHNOLOGY CORPORATION
NOTES TO CONSOLIDATED FINANCIAL STATEMENTS (Continued)
DECEMBER 31, 2010, 2009 AND 2008
I. REDEEMABLE CONVERTIBLE SERIES B AND SERIES C PREFERRED STOCK (Continued)
Nasdaq Stock Market for the 15 trading days ending on the 11th trading day prior to the date the dividend is required to be paid, and the conversion price, which was initially $2.50, but which had subsequently been adjusted in accordance with the terms of the Series B Preferred Stock to $1.49 and $1.55 (as of December 31, 2009 and 2008, respectively). The Company paid all dividends in shares of common stock, in lieu of cash dividends. The table below details out the number of shares and the amount charged to interest expense during the respective periods:
Period
|
Shares Issued | $ Value of Dividend | |||||
|---|---|---|---|---|---|---|---|
Year ended December 31, 2008 |
86,241 | $ | 133,666 | ||||
Year ended December 31, 2009 |
56,462 | $ | 86,370 | ||||
Year ended December 31, 2010 |
10,067 | $ | 15,000 | ||||
As part of the October 2003 Financing Transaction, the Company also issued warrants to purchase up to 1,228,000 shares of its common stock. These warrants were exercisable for a five-year term and had an initial exercise price of $3.32 per share. These warrants expired unexercised in 2008.
Liquidation Preference on Series B Preferred Stock
In the event of a liquidation of the Company, the holders of shares of the Series B Preferred Stock would have been entitled to receive a liquidation payment prior to the payment of any amount with respect to the shares of the common stock. The amount of this preferential liquidation payment would have been $5,000 per share of Series B Preferred Stock, plus the amount of any accrued but unpaid dividends on those shares. This entitlement to a liquidation preference was eliminated upon the holders' conversion of the Series B Preferred Stock into common shares in October 2010.
Mandatory Conversion of Series B Preferred Stock
If certain conditions described below are met, each share of Series B Preferred Stock will be automatically converted into a number of shares of common stock equal to $5,000 divided by the conversion price of the Series B Preferred Stock, which was initially $2.50, but which has since been adjusted in accordance with the terms of the Series B Preferred Stock to $1.49 and $1.55 (as of December 31, 2009 and 2008, respectively). Mandatory conversion may only occur if the average of the closing bid and ask price of the common stock on the Nasdaq Stock Market exceeds $5.00 (as adjusted for stock splits, stock dividends, combinations and similar transactions) for 20 consecutive trading days and either the registration statement governing the underlying shares of common stock is effective or the shares of common stock issuable upon conversion of the Series B Preferred Stock can be sold without restriction pursuant to Rule 144 of the Securities Act of 1933. The mandatory conversion date will be extended for so long as the following events have occurred and are continuing:
- •
- the effectiveness of the registration statement covering the resale of the shares of common stock issuable upon the conversion of the Series B Preferred Stock lapses for 20 consecutive trading days (other than as a result of factors solely in control of the holders of the Series B Preferred Stock) and the shares of common stock into which the shares of Series B Preferred Stock are convertible cannot be sold without restriction pursuant to Rule 144;
71
SATCON TECHNOLOGY CORPORATION
NOTES TO CONSOLIDATED FINANCIAL STATEMENTS (Continued)
DECEMBER 31, 2010, 2009 AND 2008
I. REDEEMABLE CONVERTIBLE SERIES B AND SERIES C PREFERRED STOCK (Continued)
- •
- the common stock is suspended from listing without subsequent listing on any one of, or is not listed on at least one of,
the Nasdaq Global Market, the Nasdaq Capital Market, the OTC Bulletin Board, the New York Stock Exchange, Inc. or the American Stock Exchange, Inc. for five consecutive trading days;
- •
- the Company provides notice to the holders of Series B Preferred Stock that it will not or cannot comply with a
proper conversion notice; or
- •
- the Company fails to comply with a proper conversion notice within 10 business days of receipt of that notice.
If, however, on the mandatory conversion date, a holder is prohibited from converting all of its shares of Series B Preferred Stock as a result of the restrictions described below under "Conversion Restrictions," such shares of Series B Preferred Stock will not be converted, will remain outstanding and will not accrue any dividends.
Conversion Restrictions
Unless the Company seeks and obtains stockholder approval, the number of shares of common stock the Company may issue upon the conversion of the shares of Series B Preferred Stock (when aggregated with the number of shares of common stock issued as dividends on the Series B Preferred Stock and upon exercise of the warrants issued to the placement agent and its affiliates for the Series B Preferred Stock financing) is limited to 4,947,352 shares (representing 19.999% of the Company's total outstanding common stock as of October 31, 2003 immediately prior to the issuance of the Series B Preferred Stock). In addition, no holder may convert shares of Series B Preferred Stock if conversion of those shares would result in the holder owning more than 4.99% of the common stock then outstanding or would result in the holder beneficially owning more than 9.999% of the common stock then outstanding, unless the holder waives this limitation at least 61 days prior to the proposed conversion.
Failure to Convert
If for any reason upon an optional or mandatory conversion the Company cannot issue shares of common stock which have been registered for resale pursuant to an effective registration statement, then the Company will be obligated to issue as many shares of common stock as its is able to issue. If the Company does not have enough shares of common stock to cover the conversion of all outstanding shares of Series B Preferred Stock, then with respect to the unconverted shares of Series B Preferred Stock (other than unconverted Series B Preferred Stock resulting from the restrictions described above under "Conversion Restrictions"), the holder will have the right to (i) void its conversion notice, (ii) require the Company to redeem the unconverted shares of Series B Preferred Stock at a price per share equal to $6,250 plus liquidated damages and any accrued but unpaid dividends or (iii) require the Company to issue shares of common stock that have not been registered pursuant to the Securities Act. If the holder elects redemption, the Company may pay the redemption price either in cash or in shares of common stock based on the quotient of the redemption price divided by the greater of 80% of the average of the closing bid and ask price of the common stock on the Nasdaq Stock Market for the 15 trading days ending on the 11th trading day prior to the redemption date and the conversion price,
72
SATCON TECHNOLOGY CORPORATION
NOTES TO CONSOLIDATED FINANCIAL STATEMENTS (Continued)
DECEMBER 31, 2010, 2009 AND 2008
I. REDEEMABLE CONVERTIBLE SERIES B AND SERIES C PREFERRED STOCK (Continued)
which was initially $2.50, but which has since been adjusted in accordance with the terms of the Series B Preferred Stock to $1.49, $1.55 and $1.55 (as of December 31, 2009, 2008, and 2007 respectively).
Accounting for the Series B Preferred Stock and Adjustments to the Conversion Price
The Company accounted for the transaction by allocating the proceeds received net of transaction costs based on the relative fair value of the redeemable convertible Series B Preferred Stock and the warrants issued to the investors, and then to any beneficial conversion rights contained in the convertible redeemable preferred securities as follows:
Security
|
Face Value | Fair Value | Allocation of Proceeds, Net of Transaction Costs |
Beneficial Conversion Feature |
Discount | |||||||||||
|---|---|---|---|---|---|---|---|---|---|---|---|---|---|---|---|---|
Redeemable convertible Series B Preferred Stock |
$ | 7,675,000 | $ | 12,398,195 | $ | 5,247,393 | $ | 3,655,607 | $ | 6,083,214 | ||||||
Warrants |
— | $ | 2,935,558 | $ | 1,242,441 | — | — | |||||||||
Series C Convertible Preferred Stock
On November 8, 2007, the Company entered into a Stock and Warrant Purchase agreement with Rockport Capital Partners II, L.P. and NGP Energy Technology Partners, L.P. (the "Investors"). Under this purchase agreement, the Investors agreed to purchase in a private placement 25,000 shares of the Company's Series C convertible preferred stock (the "Series C Preferred Stock") and warrants to purchase up to 19,711,539 shares of common stock, for an aggregate gross purchase price of $25.0 million. Each share of Series C Preferred Stock, with a face value of $1,000 per share, plus accumulated dividends, was initially convertible into common stock at a price equal to $1.04 per share.
On October 27, 2010, the holders of all of the outstanding shares of Series C Preferred Stock converted their shares, including accumulated dividends, into common stock, resulting in the issuance of 27,526,244 shares of common stock. To induce the Series C Preferred Stockholders to convert their shares, the Company paid them an aggregate $1.25 million in cash upon conversion. On October 27, 2010, the date the Series C Preferred Stock was converted to common shares, the company accelerated the accretion of $1,587,755 to account for the difference between the carrying value of the Series C Preferred Shares on that date and their conversion value.
The private placement occurred in two closings. The first closing occurred on November 8, 2007. At the first closing, the Company issued 10,000 shares of Series C Preferred Stock at $1,000 per share for an aggregate gross purchase price of $10.0 million. The Company also issued warrants to purchase an aggregate of 15,262,072 shares of common stock (the "Tranche I Warrants"). These warrants are exercisable for a seven-year term and had an initial exercise price of $1.44 per share and were not exercisable until May 8, 2008. As a result of stockholder approval of the second closing and related matters on December 20, 2007, as described below, the exercise price of these warrants was reduced to $1.25 per share. The Company considered this a cancellation and reissuance of new warrants and accounted for the change in the fair value of the warrants in the allocation of net proceeds associated with the second closing and treated it as a deemed dividend to the Series C Preferred Stock holders.
73
SATCON TECHNOLOGY CORPORATION
NOTES TO CONSOLIDATED FINANCIAL STATEMENTS (Continued)
DECEMBER 31, 2010, 2009 AND 2008
I. REDEEMABLE CONVERTIBLE SERIES B AND SERIES C PREFERRED STOCK (Continued)
See "Accounting for the Series C Preferred Stock" below. During the year ended December 31, 2010, Tranche I Warrants to purchase 7,631,036 shares of common stock were exercised via a cashless exercise, resulting in the issuance of 5,038,970 shares of common stock. As of December 31, 2010 and December 31, 2009, Tranche I Warrants to purchase 7,631,036 and 15,262,072 shares of common stock were outstanding, respectively.
At the second closing, which occurred on December 20, 2007, following stockholder approval, the Company issued 15,000 shares of Series C Preferred Stock for an aggregate gross purchase price of $15.0 million, of which $10.0 million was paid through the cancellation of the promissory notes previously issued to the Investors on November 7, 2007. At this closing, the Company also issued warrants (the "Tranche II Warrants") to purchase an aggregate of 4,449,467 shares of common stock at an exercise price of $1.25 per share. These warrants are exercisable for a seven-year term and are exercisable immediately. During the year ended December 31, 2010, Tranche II Warrants to purchase 253,580 shares of common stock were exercised via a cashless exercise, resulting in the issuance of 167,445 shares of common stock. As of December 31, 2010 and December 31, 2009, Tranche II Warrants to purchase 4,195,887 and 4,449,467 shares of common stock were outstanding, respectively.
In the purchase agreement, the Company also agreed to issue the Investors additional warrants in the event that the holders of certain existing warrants (none of whom are affiliated with the Investors) exercise those warrants in the future. Upon such exercises, the Company will issue to the Investors additional warrants to purchase common stock equal to one-half of the number of shares of common stock issued upon exercise of these existing warrants. The exercise price of these warrants will be $1.66 per share.
During the year ended December 31, 2010, existing warrants to purchase 2,543,830 shares of common stock were exercised resulting in the Company issuing 2,534,166 shares of common stock, as a result of these exercises the Company issued to the Investors warrants to purchase 1,267,083 shares of common stock at an exercise price of $1.66 per share. On the dates of issuance, the Company valued these warrants using a Black-Scholes option pricing model with the assumptions detailed below. After valuing these warrants the Company allocated the calculated value to the relative fair value of each tranche of preferred stock. As a result, the Company recorded the allocated value of the warrant and the beneficial conversion feature of $1,030,000 in the aggregate to the second closing of the Series C Preferred Stock. The Company recorded a deemed dividend on the Series C Preferred Stock of $515,000 related to the beneficial conversion feature. See Accounting for the Series C Preferred Stock below.
During the year ended December 31, 2009, existing warrants to purchase 956,060 shares of common stock were exercised resulting in the Company issuing 132,589 shares of common stock (all warrants exercised in 2009 were exercised on a "cashless" basis resulting in fewer shares being issued). As a result of these exercises the Company issued to the Investors warrants to purchase 66,295 shares of common stock at an exercise price of $1.66 per share. On the dates of issuance, the Company valued these warrants using a Black-Scholes option pricing model with the assumptions detailed below. After valuing these warrants the Company allocated the calculated value to the relative fair value of each tranche of preferred stock. As a result, the Company recorded the allocated value of the warrant and the beneficial conversion feature of $164,000 in the aggregate to the second closing of the Series C
74
SATCON TECHNOLOGY CORPORATION
NOTES TO CONSOLIDATED FINANCIAL STATEMENTS (Continued)
DECEMBER 31, 2010, 2009 AND 2008
I. REDEEMABLE CONVERTIBLE SERIES B AND SERIES C PREFERRED STOCK (Continued)
Preferred Stock. The Company recorded a deemed dividend on the Series C Preferred Stock of $82,000 related to the beneficial conversion feature. See Accounting for the Series C Preferred Stock below.
During the year ended December 31, 2008, existing warrants to purchase 271,151 shares of common stock were exercised resulting in the Company issuing 174,857 shares of common stock (some warrants were exercised on a "cashless" basis resulting in fewer shares being issued). As a result of these exercises the Company issued to the Investors warrants to purchase 87,484 shares of common stock at an exercise price of $1.66 per share. On the dates of issuance, the Company valued these warrants using a Black-Scholes option pricing model with the assumptions detailed below. After valuing these warrants the Company allocated the calculated value to the relative fair value of each tranche of preferred stock. As a result, the Company recorded the allocated value of the warrant and the beneficial conversion feature of $252,000 in the aggregate to the second closing of the Series C Preferred Stock. The Company recorded a deemed dividend on the Series C Preferred Stock of $126,000 related to the beneficial conversion feature. See Accounting for the Series C Preferred Stock below.
The table below details the warrants issued related to the exercise of existing warrants:
Date
|
Exercise Price |
Term | Expiration | Warrants to Purchase # of Shares |
|||||||
|---|---|---|---|---|---|---|---|---|---|---|---|
June 28, 2008 |
$ | 1.66 | 7 years | June 28, 2015 | 77,379 | ||||||
September 27, 2008 |
$ | 1.66 | 7 years | September 27, 2015 | 10,105 | ||||||
October 3, 2009 |
$ | 1.66 | 7 years | October 3, 2016 | 17,911 | ||||||
December 31, 2009 |
$ | 1.66 | 7 years | December 31, 2016 | 48,384 | ||||||
March 31, 2010 |
$ | 1.66 | 7 years | March 31, 2017 | 157,426 | ||||||
June 30, 2010 |
$ | 1.66 | 7 years | June 30, 2017 | 246,134 | ||||||
September 30, 2010 |
$ | 1.66 | 7 years | September 30, 2017 | 413,303 | ||||||
December 31, 2010 |
$ | 1.66 | 7 years | December 29, 2017 | 450,220 | ||||||
Input
|
June 28, 2008 |
September 27, 2008 |
October 3, 2009 |
December 31, 2009 |
|||||||||
|---|---|---|---|---|---|---|---|---|---|---|---|---|---|
Quoted Stock Price |
$ | 3.01 | $ | 2.10 | $ | 2.01 | $ | 2.82 | |||||
Exercise Price |
$ | 1.66 | $ | 1.66 | $ | 1.66 | $ | 1.66 | |||||
Time to Maturity (in years) |
7.00 | 7.00 | 7.00 | 7.00 | |||||||||
Stock Volatility |
84.65 | % | 85.44 | % | 82.66 | % | 81.55 | % | |||||
Risk-Free Rate |
3.5 | % | 3.18 | % | 2.50 | % | 2.00 | % | |||||
Dividend Rate |
0 | % | 0 | % | 0 | % | 0 | % | |||||
75
SATCON TECHNOLOGY CORPORATION
NOTES TO CONSOLIDATED FINANCIAL STATEMENTS (Continued)
DECEMBER 31, 2010, 2009 AND 2008
I. REDEEMABLE CONVERTIBLE SERIES B AND SERIES C PREFERRED STOCK (Continued)
Input
|
March 31, 2010 |
June 30, 2010 |
Sept. 30, 2010 |
December 31, 2010 |
|||||||||
|---|---|---|---|---|---|---|---|---|---|---|---|---|---|
Quoted Stock Price |
$ | 2.42 | $ | 2.86 | $ | 3.76 | $ | 4.50 | |||||
Exercise Price |
$ | 1.66 | $ | 1.66 | $ | 1.66 | $ | 1.66 | |||||
Time to Maturity (in years) |
7.00 | 7.00 | 7.00 | 7.00 | |||||||||
Stock Volatility |
80.8 | % | 79.13 | % | 73.44 | % | 75 | % | |||||
Risk-Free Rate |
2.4 | % | 2.5 | % | 1.75 | % | 1.75 | % | |||||
Dividend Rate |
0 | % | 0 | % | 0 | % | 0 | % | |||||
As of December 31, 2010, if all of the remaining existing warrants are exercised, the Company would need to issue warrants to purchase an additional 984,091 shares of common stock to the Investors.
Dividends on Series C Preferred Stock
Until their conversion in October 2010, the shares of Series C Preferred Stock accrued a dividend at a rate of 5% per annum of the face value. Dividends on the Series C Preferred Stock were accrued, whether or not declared, and were payable quarterly in cash or, at the Company's option, added to the Stated Liquidation Preference Amount.
Liquidation Preference
In the event of the liquidation, dissolution or winding up of the affairs of the Company, whether voluntary or involuntary (a "Liquidation"), the holders of shares of the Series C Preferred Stock then outstanding would have been entitled to receive, out of the assets of the Company available for distribution to its stockholders before any payment was made to the holders of junior stock by reason of their ownership thereof, an amount per share equal to the greater of:
(i) the Series C Original Issue Price ($1,000 per share) plus any dividends accrued but unpaid thereon (the "Stated Liquidation Preference Amount"); or
(ii) such amount per share as would have been payable had all shares of Series C Preferred Stock been converted into common stock immediately prior to such Liquidation. The entitlement to dividends and a liquidation preference were eliminated upon the holders' conversion of the Series C Preferred Stock into common stock on October 27, 2010.
Conversion
The holder of Series C Preferred Stock had the following conversion rights:
Holder's Right to Convert.
At any time the holder of any such shares of Series C Preferred Stock may, at such holder's option, elect to convert all or any portion of the shares of Series C Preferred Stock held by such person into a number of fully paid and nonassessable shares of common stock equal to the quotient of (i) the Stated Liquidation Preference Amount of the shares of Series C Preferred Stock being converted divided by (ii) the conversion price then in effect as of the date of the delivery by such holder of its
76
SATCON TECHNOLOGY CORPORATION
NOTES TO CONSOLIDATED FINANCIAL STATEMENTS (Continued)
DECEMBER 31, 2010, 2009 AND 2008
I. REDEEMABLE CONVERTIBLE SERIES B AND SERIES C PREFERRED STOCK (Continued)
notice of election to convert. The initial conversion price of the Series C Preferred Stock is $1.04 per share. The Series C Preferred Stock will receive weighted average anti-dilution protection in the event of a dilutive issuance in accordance with a formula set forth in the Certificate of Designation, subject to certain exceptions.
Company's Right to Convert.
At any time on or after November 8, 2009, if the average closing price of the Company's common stock for any immediately preceding 180-day period exceeds $7.00 (subject to appropriate adjustment in the event of any stock dividend, stock split, combination or other similar recapitalization with respect to the common stock), the Company will have the right, but not the obligation, to convert each outstanding share of Series C Preferred Stock into a number of fully paid and nonassessable shares of common stock equal to the quotient of (i) the Stated Liquidation Preference Amount divided by (ii) the conversion price in effect as of the Company conversion date.
Redemption
At any time and from time to time on or after November 8, 2011 the holders of at least 66.7% of the then outstanding shares of Series C Preferred Stock could have elected to have all or any portion of the outstanding shares of Series C Preferred Stock redeemed. The Company could have effected the redemption on a redemption date by paying cash or, at the Company's election, shares of common stock (valued in the manner described below).
If such redemption was for cash, the Company would have effected the redemption by paying in cash in exchange for each share of Series C Preferred Stock to be redeemed a sum equal to the product of (i) 1.2 multiplied by (ii) the Stated Liquidation Preference Amount.
If such redemption was for shares of common stock, the Company would have effected the redemption by issuing, in exchange for each share of Series C Preferred Stock to be redeemed, that number of shares of common stock equal to (A) the product of (i) 1.4 multiplied by (ii) the Stated Liquidation Preference Amount divided by (B) the fair market value of the common stock, based on a 10 day volume weighted average, as of the redemption date.
Accounting for the Series C Preferred Stock
Initially, based on the accounting guidance in effect at the time of the closing of the Series C Preferred Stock transaction (see "Note G. Warrant Liabilities"), the Company accounted for the transaction by allocating the proceeds received net of transaction costs based on the relative fair value of the redeemable convertible Series C Preferred Stock and the warrants issued to the Investors, and
77
SATCON TECHNOLOGY CORPORATION
NOTES TO CONSOLIDATED FINANCIAL STATEMENTS (Continued)
DECEMBER 31, 2010, 2009 AND 2008
I. REDEEMABLE CONVERTIBLE SERIES B AND SERIES C PREFERRED STOCK (Continued)
then to any beneficial conversion rights contained in the convertible redeemable preferred securities as follows:
Security
|
Face Value |
Fair Value |
Allocation of Proceeds, Net of Transaction Costs |
Beneficial Conversion Feature |
Initial Carrying Value |
|||||||||||
|---|---|---|---|---|---|---|---|---|---|---|---|---|---|---|---|---|
Redeemable convertible Series C Preferred Stock |
$ | 25,000,000 | $ | 18,193,950 | $ | 12,991,097 | $ | 11,762,887 | $ | 1,228,210 | ||||||
Warrants |
— | $ | 18,352,179 | $ | 10,092,623 | — | — | |||||||||
The Series C Preferred Stock was classified as temporary equity on the balance sheet.
The re-pricing of the exercise price of the Tranche I warrants from $1.44 to $1.25, as described above, was treated as a cancellation of the original warrants issued on November 8, 2007 and a re-issuance of new warrants on December 20, 2007. The difference in fair value of the warrant was included in the allocation of net proceeds associated with the second closing of the Series C Preferred Stock on December 20, 2007. The Company treated this as a deemed dividend on the Series C Preferred Stock. The Company recorded a discount, including the re-pricing and beneficial conversion feature of $11,762,887 and recorded a deemed dividend of $11,947,881 to the holders of the Series C Preferred Stock, which included the initial allocation of the discount of $11,762,887 and $184,994 related to the accretion of the Series C Preferred Stock to its redemption value through the date that holders of the Series C Preferred Stock may first exercise their redemption right. Prior to the conversion of the Series C Preferred Stock in October 2010, the Company used the effective interest method to accrete the carrying value of the Series C Preferred Stock through the earliest possible redemption date (November 8, 2011), at which time the value of the Series C Preferred Stock would have been $30.0 million or 120% of its face value and dividends.
78
SATCON TECHNOLOGY CORPORATION
NOTES TO CONSOLIDATED FINANCIAL STATEMENTS (Continued)
DECEMBER 31, 2010, 2009 AND 2008
I. REDEEMABLE CONVERTIBLE SERIES B AND SERIES C PREFERRED STOCK (Continued)
The components of the carrying value of the Series C Preferred Stock from inception on November 8, 2007, through the years ended December 31, 2007, December 31, 2008, December 31, 2009 and December 31, 2010, are as follows:
| |
Total | |||
|---|---|---|---|---|
Balance at December 31, 2007 |
$ | 13,276,091 | ||
Accretion of original carry value to redemption value |
2,848,502 | |||
Dividend(1) |
1,250,000 | |||
Additional discount from issuance of warrants and beneficial conversion feature |
(126,000 | ) | ||
Balance at December 31, 2008 |
$ | 17,248,593 | ||
Accretion of original carry value to redemption value for the year ended December 31, 2009 |
3,840,830 | |||
Dividend(1) |
1,250,000 | |||
Additional discount from issuance of warrants and beneficial conversion feature |
(82,000 | ) | ||
Balance at December 31, 2009 |
$ | 22,257,423 | ||
Accretion of original carry value to redemption value for the year ended December 31, 2010 |
5,857,577 | |||
Dividend(1) |
1,027,397 | |||
Additional discount from issuance of warrants and beneficial conversion feature |
(515,000 | ) | ||
Conversion of Series C Preferred Stock to Common Stock |
(28,627,397 | ) | ||
Balance at December 31, 2010 |
$ | 0 | ||
- (1)
- The Company elected to add the dividend to the liquidation preference of the Series C Preferred Stock and it was recorded as a dividend to the holders of the Series C Preferred Stock.
In valuing the warrants associated with the Series C Preferred Stock the Company used the Black-Scholes option pricing model with the following range of assumptions:
| |
November 8, 2007 | December 20, 2007 | ||
|---|---|---|---|---|
Assumptions: |
||||
Expected life |
4.0 years | 5.2 years | ||
Expected volatility |
70% | 70% | ||
Dividends |
none | none | ||
Risk-free interest rate |
3.64% | 3.48% |
The Company currently designates these warrants as equity instruments. As stated above, the holders of the Series C Preferred Stock converted their shares of Series C Preferred Stock into common stock on October 27, 2010.
79
SATCON TECHNOLOGY CORPORATION
NOTES TO CONSOLIDATED FINANCIAL STATEMENTS (Continued)
DECEMBER 31, 2010, 2009 AND 2008
J. PRODUCT WARRANTIES
The Company provides a warranty to its customers for most of its products sold. In general the Company's warranties are for one year after the sale of the product and five years for photovoltaic inverter product sales. The Company reviews its warranty liability quarterly. The Company's estimate for product warranties is based on an analysis of actual expenses by specific product line and estimated future costs related to warranty. Factors taken into consideration when evaluating the Company's warranty reserve are (i) historical claims for each product, (ii) the development stage of the product, (iii) volume increases, (iv) life of warranty and (v) other factors. To the extent actual experience differs from the Company's estimate, the provision for product warranties will be adjusted in future periods. Such differences may be significant.
The following is a summary of the Company's accrued warranty activity for the following periods:
| |
Year Ended December 31, | ||||||||||
|---|---|---|---|---|---|---|---|---|---|---|---|
| |
2010 | 2009 | 2008 | ||||||||
Balance at beginning of year |
$ | 1,869,579 | $ | 1,982,087 | $ | 1,901,757 | |||||
Provision |
3,050,012 | 1,204,690 | 2,340,594 | ||||||||
Usage |
(919,510 | ) | (1,317,198 | ) | (2,260,264 | ) | |||||
Balance at end of year |
$ | 4,000,081 | $ | 1,869,579 | $ | 1,982,087 | |||||
The warranty reserve is included in other accrued expenses on the accompanying consolidated balance sheets.
K. COMMITMENTS AND CONTINGENCIES
Operating Leases
The Company leases its facilities under various operating leases that expire through October 2016.
Future minimum annual rentals under lease agreements at December 31, 2010 are as follows:
Fiscal Year
|
|
|||
|---|---|---|---|---|
2011 |
$ | 1,971,511 | ||
2012 |
1,889,761 | |||
2013 |
1,712,053 | |||
2014 |
1,497,395 | |||
2015 |
1,538,277 | |||
thereafter |
2,192,009 | |||
Total |
$ | 10,801,006 | ||
Total rental expense including operating expenses and real estate taxes for operating leases from continuing operations amounted to $1.8 million, $1.1 million and $1.1 million for the years ended December 31, 2010, 2009 and 2008, respectively.
80
SATCON TECHNOLOGY CORPORATION
NOTES TO CONSOLIDATED FINANCIAL STATEMENTS (Continued)
DECEMBER 31, 2010, 2009 AND 2008
K. COMMITMENTS AND CONTINGENCIES (Continued)
Certain of the facility leases contain escalation clauses, and rental expense has been recognized on a straight-line basis over the remaining lease term. At December 31, 2010 and 2009 deferred rent expense amounted to approximately $0.1 million and $0.1 million, respectively.
Letters of Credit
The Company utilizes a standby letter of credit to satisfy a security deposit requirement. Outstanding standby letters of credit as of December 31, 2010 and 2009 were $0 and $34,000, respectively. The Company is required to pledge cash as collateral on these outstanding letters of credit. As of December 31, 2009, the cash pledged as collateral for these letters of credit was $34,000, and is included in restricted cash and cash equivalents on the balance sheet.
Employment Agreements
As of December 31, 2008 the Company had either terminated or given notice to certain employees that had employment agreements with the Company that provided for severance payments and accelerated vesting of options upon termination of employment. As a result, the Company charged approximately $0.5 million to restructuring during the year ended December 31, 2008. Approximately $0.3 million related to the employment contract of the former chief executive officer, which was paid subsequent to December 31, 2008.
The Company's employment arrangement with its current Chief Executive Officer and Chief Financial Officer each provides that if his employment is terminated by the Company without cause or is constructively terminated within one year following a change of control transaction, their salary and medical benefits will be continued for one year thereafter subject to his execution of a release agreement with the Company.
Litigation
From time to time, the Company is a party to routine litigation and proceedings in the ordinary course of business. The Company is not aware of any current or pending litigation in which the Company is or may be a party that it believes could materially adversely affect the results of operations or financial condition.
In the normal course of our business, the Company is party to various claims and suits pending for alleged damages to persons and property, alleged violations of certain laws and alleged liabilities arising out of matters occurring during the normal operation of our business.
In accordance with ASC 450-20, the Company accrues for legal proceedings when losses become probable and reasonably estimable. As of the end of each applicable reporting period, the Company reviews each of its legal proceedings to determine whether it is probable, reasonably possible or remote that a liability has been incurred and, if it is at least reasonably possible, whether a range of loss can be reasonably estimated under the provisions of ASC 450-20-25-2. In instances where the Company determines that a loss is probable and the Company can reasonably estimate a range of losses the Company may incur with respect to such a matter, the Company records an accrual for the amount within the range that constitutes its best estimate of the possible loss. If the Company is able to reasonably estimate a range but no amount within the range appears to be a better estimate than any
81
SATCON TECHNOLOGY CORPORATION
NOTES TO CONSOLIDATED FINANCIAL STATEMENTS (Continued)
DECEMBER 31, 2010, 2009 AND 2008
K. COMMITMENTS AND CONTINGENCIES (Continued)
other, the Company records an accrual in the amount that is the low end of such range. When a loss is reasonably possible but not probable the Company will not record an accrual but it will disclose its estimate of the possible range of loss where such estimate can be made in accordance with ASC 450-20-25-3. As of December 31, 2010, there were no accruals established related to the Company's outstanding legal proceedings.
The Company offers no prediction of the outcome of any of the proceedings or negotiations described below. The Company is vigorously defending each of these lawsuits and claims. However, there can be no guarantee the Company will prevail or that any judgments against it, if sustained on appeal, will not have a material adverse effect on our business, financial condition, results of operations or cash flows.
On February 17, 2011, FuelCell Energy, Inc. ("FuelCell Energy") filed a Demand for Arbitration with the American Arbitration Association seeking recovery of damages related to allegedly defective transformers that the Company procured for them. In its Demand for Arbitration, FuelCell Energy asserts that it is entitled to recovery of approximately $2.8 million from us. The Company vigorously denies the allegation that the transformers were defective, and has filed a counterclaim seeking recovery of amounts due to the Company from FuelCell Energy for materials and engineering services that the Company supplied to them totaling approximately $1.4 million. This matter is at the early stages of discovery, and the Company does not believe a loss is probable.
L. EMPLOYEE BENEFIT PLANS
During 2010, the Company implemented its employee stock purchase plan ("ESPP"). Under the ESPP, qualified employees may purchase shares of Common Stock by payroll deduction at a 15% discount from the market price. 2,000,000 shares of Common Stock have been reserved for this purpose. During the year ended December 31, 2010, 79,895 shares of Common Stock were issued under the ESPP. As of December 30, 2010, 1,920,105 shares of Common Stock were available for distribution under the ESPP. The Company recorded non-cash stock-based compensation expense of approximately $221,000 for the year ended December 31, 2010.
In addition, the Company offers a 401(k) Employee Benefit Plan (the "Plan"). Under the Plan, any regular employee of the Company or its wholly owned US subsidiaries, as defined by the Plan, who has attained the age of 21 years is eligible to participate. The Plan allows an employee to defer up to 100% of his or her compensation, as limited under IRC Section 402(g), through contributions to the Plan. Prior to January 1, 2009, the Company matched 100% in the Company's common stock up to the first 6% of an employee's pay that he or she contributed to the Plan. Participants were vested immediately in the matches of the Company common stock. The match contribution was determined and accrued in dollars and converted to shares of the Company's common stock using the share price of the last business day of each fiscal quarter. The stock was issued as soon as practical in the following period. The table below details out the Company's matching contributions made under the Plan, the number of shares of the Company's common stock issued under the Plan and the value of the common
82
SATCON TECHNOLOGY CORPORATION
NOTES TO CONSOLIDATED FINANCIAL STATEMENTS (Continued)
DECEMBER 31, 2010, 2009 AND 2008
L. EMPLOYEE BENEFIT PLANS (Continued)
stock issued by the Company as matching contributions to the Plan for the year ended December 31, 2008, as follows:
| |
Matching Contribution $'s |
Shares of Common Stock Issued |
Value of Common Stock Issued $'s |
|||||||
|---|---|---|---|---|---|---|---|---|---|---|
Year ended December 31, 2008 |
$ | 541,680 | 279,831 | $ | 578,232 | |||||
The value of the common stock issued as matching contributions was based on the closing price of the Company's common stock on the Nasdaq Capital Market for the last day of the fiscal quarter in which the contributions were earned. Shares of common stock were transferred the first practical day following the end of the quarter in which the shares were earned. As of January 1, 2009, the Company has elected to cease the matching in shares of its common stock. During January 2009, the Company issued 69,650 shares of common stock related to the final distribution to its employees. Since January 2009, the Company has provided a 3% match to be paid in cash to all eligible participants on a quarterly basis. For the years ended December 31, 2010, 2009 and 2008, the Company incurred $408,722, $304,867 and $541,680, respectively, in 401(k) matching contribution expense.
M. INCOME TAXES
The provision for income taxes consists of the following:
| |
Year Ended December 31, | ||||||||||
|---|---|---|---|---|---|---|---|---|---|---|---|
| |
2010 | 2009 | 2008 | ||||||||
Loss before income taxes: |
|||||||||||
Continuing Operations: |
|||||||||||
United States |
(5,316,810 | ) | $ | (28,098,354 | ) | $ | (9,379,900 | ) | |||
Foreign |
(7,033,702 | ) | (1,864,704 | ) | (2,229,636 | ) | |||||
|
$ | (12,350,512 | ) | $ | (29,963,058 | ) | $ | (11,609,536 | ) | ||
Discontinued Operations: |
|||||||||||
United States |
531,607 | $ | 91,677 | $ | (1,595,284 | ) | |||||
Foreign |
— | — | — | ||||||||
|
$ | 531,607 | $ | 91,677 | $ | (1, 595,284 | ) | ||||
Deferred income tax benefit / (provision) |
|||||||||||
Federal |
$ | (2,574,672 | ) | $ | 8,199,910 | $ | (1,557,838 | ) | |||
Foreign |
3,461,044 | (273,604 | ) | (486,986 | ) | ||||||
State |
1,477,442 | 589,512 | (954,656 | ) | |||||||
|
$ | 2,363,814 | $ | 8,515,818 | $ | (2,999,480 | ) | ||||
Change in valuation allowance for deferred tax assets |
$ | (2,363,814 | ) | $ | (8,515,818 | ) | $ | 2,999,480 | |||
Income tax expense, net, reported in the accompanying statement of operations |
$ | — | $ | — | $ | — | |||||
83
SATCON TECHNOLOGY CORPORATION
NOTES TO CONSOLIDATED FINANCIAL STATEMENTS (Continued)
DECEMBER 31, 2010, 2009 AND 2008
M. INCOME TAXES (Continued)
Deferred income taxes reflect the net tax effects of temporary differences between the carrying amounts of assets and liabilities for financial reporting purposes and the amounts used for income tax purposes. As of December 31, 2010 and 2009, the components of the net deferred tax assets/ (liabilities) are as follows:
| |
Year Ended December 31, | ||||||
|---|---|---|---|---|---|---|---|
| |
2010 | 2009 | |||||
Federal net operating loss carryforwards |
$ | 40,470,482 | $ | 45,996,750 | |||
Foreign net operating loss carryforwards |
8,236,714 | 4,775,671 | |||||
State net operating loss carryforwards, net of federal benefit |
5,173,209 | 4,138,788 | |||||
Tax credits |
759,051 | 957,551 | |||||
Depreciation and amortization |
465,648 | 440,348 | |||||
Stock options |
1,259,740 | — | |||||
Accrued expenses |
2,852,944 | — | |||||
Other |
584,588 | 1,129,454 | |||||
Total |
$ | 59,802,376 | $ | 57,438,562 | |||
Valuation allowance |
(59,802,376 | ) | (57,438,562 | ) | |||
Net deferred income taxes |
$ | — | $ | — | |||
As of December 31, 2010, the Company had U.S. federal and state net operating loss carry forwards of approximately $119.0 million and $55.0 million, respectively, which may be available to offset future federal and state income tax liabilities. The federal net operating loss carryforwards expire at various dates beginning in 2010 through 2030 and the state net operating loss carryforwards expire beginning in 2011 through 2030. The Company has foreign net operating loss carryforwards of approximately $27.0 million, which expire beginning in 2011 through 2020. The Company has federal and state tax credits of approximately $0.5 million and $0.2 million, respectively. The federal research and development credits begin to expire in 2011, and the state credits begin to expire in 2018.
Management has evaluated the positive and negative evidence bearing upon the realizability of the Company's deferred tax assets. Management has determined that it is more likely than not that the Company will not realize the benefits of federal deferred tax assets, and as a result, a full valuation allowance has been established.
At December 31, 2010, $275,000 of federal and state net operating loss carryforwards relate to deductions for stock option compensation for which the associated tax benefit will be credited to additional paid-in capital when realized. This amount is tracked separately and not included in the Company's deferred tax assets.
The tax years 1996 through 2010 remain open to examination by major taxing jurisdictions to which the Company is subject, which are primarily in the United States, as carry forward attributes generated in years past may still be adjusted upon examination by the Internal Revenue Service or state tax authorities if they are or will be used in a future period. The Company is currently not under examination by the Internal Revenue Service or any other jurisdiction for any tax years. The Company
84
SATCON TECHNOLOGY CORPORATION
NOTES TO CONSOLIDATED FINANCIAL STATEMENTS (Continued)
DECEMBER 31, 2010, 2009 AND 2008
M. INCOME TAXES (Continued)
did not recognize any interest and penalties associated with unrecognized tax benefits in the accompanying financial statements. The Company would record any such interest and penalties as a component of interest expense. The Company does not expect any material changes to the unrecognized benefits within 12 months of the reporting date. The Company had not recorded any adjustments upon adoption of Uncertainty in Income Taxes (as Amended) and no amount has been reflected in the Company's financial statements related to uncertainty in income taxes.
Under the Internal Revenue Code, certain substantial changes in the Company's ownership may result in an annual limitation on the amount of net operating loss and tax credit carryforwards, which may be utilized in future periods. The Company commissioned a study to determine whether Sections 382 or 383 could limit the use of our carryforwards in this manner. After completing this study, the Company has concluded that the limitation will not have a material impact on its ability to utilize its net operating loss or credit carryforwards.
The provision for income taxes differs from the federal statutory rate due to the following:
| |
Year Ended December 31, | |||||||||
|---|---|---|---|---|---|---|---|---|---|---|
| |
2010 | 2009 | 2008 | |||||||
Federal and foreign tax at statutory rate |
34.0 | % | 34.0 | % | 34.0 | % | ||||
State taxes, net of federal benefit |
12.5 | % | 1.3 | % | 6.5 | % | ||||
Expired net operating loss carryforwards |
(9.6 | )% | — | % | (54.2 | )% | ||||
Permanent items |
(12.6 | )% | (7.6 | )% | (7.6 | )% | ||||
Other |
(4.3 | )% | 1.1 | % | (1.4 | )% | ||||
Change in valuation allowance |
(20.0 | )% | (28.8 | )% | 22.7 | % | ||||
Effective tax rate |
— | % | — | % | — | % | ||||
N. STOCKHOLDERS' EQUITY
As of December 31, 2010, the Company has reserved 29,401,139 shares of common stock for issuance upon exercise of stock options and warrants, 5,814,110 shares for future issuances under its stock plans and 1,920,105 shares for future issuances under its Employee Stock Purchase Plan. As of December 31, 2010, holders of warrants may exercise their rights to purchase an aggregate of 15,974,171 shares of the Company's common stock. As of December 31, 2010 there were options to purchase 13,426,968 shares of common stock outstanding.
Stock Option Plans
Under the Company's 2000, 2002 and 2005 Stock Option Plans (collectively, the "Plans"), both qualified and non-qualified stock options may be granted to certain officers, employees, directors and consultants to purchase shares of the Company's common stock.
The Plans are subject to the following provisions:
- •
- The aggregate fair market value (determined as of the date the option is granted) of the Company's common stock that any employee may purchase in any calendar year pursuant to the exercise of qualified options may not exceed $100,000. No person who owns, directly or
85
SATCON TECHNOLOGY CORPORATION
NOTES TO CONSOLIDATED FINANCIAL STATEMENTS (Continued)
DECEMBER 31, 2010, 2009 AND 2008
N. STOCKHOLDERS' EQUITY (Continued)
- •
- Qualified options are issued only to employees of the Company, while non-qualified options may be issued to
non-employee directors, consultants and others, as well as to employees of the Company. Options granted under the Plans cannot exceed 500,000 shares in any year and may not be granted with
an exercise price less than 100% of fair value of the Company's common stock, as determined by the Board of Directors on the grant date.
- •
- Options under the Plans must be granted within 10 years from the effective date of the Plan. Qualified options
granted under the Plans cannot be exercised more than 10 years from the date of grant, except that qualified options issued to 10% or greater stockholders are limited to five-year
terms.
- •
- Generally, the options vest and become exercisable ratably over a four-year period.
- •
- The Plans contain antidilutive provisions authorizing appropriate adjustments in certain circumstances. Shares of the Company's common stock subject to options that expire without being exercised or that are canceled as a result of the cessation of employment are available for future grants.
indirectly, at the time of the granting of a qualified option to him or her, more than 10% of the total combined voting power of all classes of stock of the Company shall be eligible to receive any qualified options under the Plans unless the option price is at least 110% of the fair market value of the Company's common stock subject to the option, determined on the date of grant. Non-qualified options are not subject to this limitation.
The following table summarizes activity of the Company's stock plans since December 31, 2008:
| |
Options Outstanding | |
||||||||||||
|---|---|---|---|---|---|---|---|---|---|---|---|---|---|---|
| |
Number of Shares |
Weighted Average Exercise Price |
Weighted Average Remaining Contractual Term (years) |
Aggregate Intrinsic Value |
||||||||||
Outstanding at December 31, 2008 |
10,147,996 | $ | 2.39 | 8.09 | $ | 382,951 | ||||||||
Grants |
1,657,000 | 1.49 | ||||||||||||
Exercises |
(126,250 | ) | 1.59 | |||||||||||
Cancellations |
(729,126 | ) | 4.27 | |||||||||||
Outstanding at December 31, 2009 |
10,949,620 | $ | 2.14 | 7.66 | $ | 10,096,729 | ||||||||
Grants |
4,618,000 | 2.96 | ||||||||||||
Exercises |
(1,210,887 | ) | 1.69 | |||||||||||
Cancellations |
(929,765 | ) | 4.05 | |||||||||||
Outstanding at December 31, 2010 |
13,426,968 | $ | 2.33 | 7.74 | $ | 29,712,186 | ||||||||
Vested or expected to vest at December 31, 2010 |
12,915,233 | $ | 2.30 | 7.69 | $ | 28,905,458 | ||||||||
Exercisable at December 31, 2010 |
6,000,134 | $ | 2.06 | 6.59 | $ | 15,147,062 | ||||||||
Exercisable at December 31, 2009 |
5,322,244 | $ | 2.44 | 6.67 | $ | 4,631,057 | ||||||||
86
SATCON TECHNOLOGY CORPORATION
NOTES TO CONSOLIDATED FINANCIAL STATEMENTS (Continued)
DECEMBER 31, 2010, 2009 AND 2008
N. STOCKHOLDERS' EQUITY (Continued)
Information related to stock options outstanding as of December 31, 2010 is as follows:
| |
Options Outstanding | |
|
|||||||||||||
|---|---|---|---|---|---|---|---|---|---|---|---|---|---|---|---|---|
| |
Options Exercisable | |||||||||||||||
| |
|
Weighted Average Remaining Contractual Life (years) |
|
|||||||||||||
Range of Exercise Prices
|
Number of Shares |
Weighted Average Exercise Price |
Exercisable Number of Shares |
Exercisable Weighted Average Exercise Price |
||||||||||||
$0.62 to $1.82 |
1,974,073 | 6.38 | $ | 1.34 | 1,370,612 | $ | 1.34 | |||||||||
$1.83 to $1.89 |
32,500 | 8.57 | $ | 1.88 | 9,376 | $ | 1.88 | |||||||||
$1.90 to $1.90 |
4,810,020 | 7.33 | $ | 1.90 | 3,002,201 | $ | 1.90 | |||||||||
$1.91 to $2.35 |
3,171,500 | 8.68 | $ | 2.29 | 560,688 | $ | 2.11 | |||||||||
$2.40 to $3.73 |
1,919,375 | 7.83 | $ | 2.66 | 877,257 | $ | 2.62 | |||||||||
$3.76 to $5.26 |
1,419,500 | 9.33 | $ | 4.31 | 80,000 | $ | 5.26 | |||||||||
$9.25 to $9.25 |
100,000 | 0.26 | $ | 9.25 | 100,000 | $ | 9.25 | |||||||||
$0.62 to $9.25 |
13,426,968 | 7.74 | $ | 2.33 | 6,000,134 | $ | 2.06 | |||||||||
As of December 31, 2010 and 2009, there was approximately $11.0 million and $6.7 million, respectively, of total unrecognized costs related to non-vested share-based compensation arrangements granted under the Plans. That cost is expected to be recognized over a weighted average period of approximately 2.0 years. The table below summarizes the recognition of the deferred compensation expense associated with employee stock options over the next four years as follows:
Calendar Years Ending December 31,
|
Non Cash Stock-Based Compensation Expense |
|||
|---|---|---|---|---|
2011 |
$ | 4,555,273 | ||
2012 |
3,195,849 | |||
2013 |
2,200,116 | |||
2014 |
1,000,038 | |||
Total |
$ | 10,951,276 | ||
As of December 31, 2009, the Company had 92,135 shares of restricted stock outstanding of which all were vested. Restricted stock is comprised of restricted stock awards to non-employee consultants of the Company for services rendered in fiscal 2009. The Company valued the restricted stock grants at $165,000, the price of the Company's stock on the day of the grant ($1.78 per share). In connection with these restricted stock grants the Company recognized a general and administrative expense of $75,000 for the year ended December 31, 2009, and $89,000 in cost of product revenue for the year ended December 31, 2009.
Options to purchase 1,210,887, 126,250 and 891,168 shares were exercised during the years ended December 31, 2010, 2009 and 2008, respectively, and these options had an intrinsic value of approximately $1.8 million, $0.3 million and $0.5 million on the date of exercise, respectively.
87
SATCON TECHNOLOGY CORPORATION
NOTES TO CONSOLIDATED FINANCIAL STATEMENTS (Continued)
DECEMBER 31, 2010, 2009 AND 2008
N. STOCKHOLDERS' EQUITY (Continued)
During 2008, as an inducement to his joining the Company, the Company granted its new Chief Executive Officer an option to acquire 4,796,020 shares of common stock at a price per share equal to $1.90, the closing price of the common stock on May 1, 2008, the date his employment commenced. The option vests over four years, with the first 25% vesting on May 1, 2009 and the balance vesting in equal quarterly installments over the following three years. The option was issued outside of the Company's 2005 Incentive Compensation Plan. As of December 31, 2010, 2009 and 2008, this option was outstanding and is included in the table above.
During 2010, as an inducement to his joining the Company, the Company granted its new Chief Financial Officer options to acquire 1,000,000 shares of common stock at a price per share equal to $2.33, the closing price of the common stock on March 15, 2010, the date his employment commenced. The option vests over four years, with the first 25% vesting on March 15, 2011 and the balance vesting in equal quarterly installments over the following three years. Of these options, one option to purchase 500,000 shares was issued under the Company's 2005 Plan and one option to purchase 500,000 shares was issued outside of the 2005 Plan. As of December 31, 2010, these options were outstanding and are included in the table above.
During 2000, the Company granted 216,000 non-qualified stock options to employees at an exercise price of $17.56 per share outside of the Board approved Plans. As of December 31, 2010 and 2009, there were 0, and 21,000 options outstanding, respectively, which are included in the above table.
Warrants
A summary of the status of the Company's warrants as of the year ended December 31, 2010, 2009 and 2008 and the changes for these periods are presented below. The actual number of common stock issued on warrants exercised in 2010, 2009 and 2008 is less than the table presented below due to cashless exercises of warrants in 2010, 2009 and 2008. The actual number of common stock issued under warrant exercises for 2010, 2009 and 2008 was 7,883,595, 132,589 and 174,967, respectively, and the Company received proceeds of $4,773,412 related to the 2010 exercises and $241,310 related to the 2008 exercises.
| |
Year Ended December 31, 2010 |
Year Ended December 31, 2009 |
Year Ended December 31, 2008 |
|||||||||||||||||
|---|---|---|---|---|---|---|---|---|---|---|---|---|---|---|---|---|---|---|---|---|
| |
Number of Shares |
Weighted Average Price |
Number of Shares |
Weighted Average Price |
Number of Shares |
Weighted Average Price |
||||||||||||||
Outstanding at beginning of year |
24,857,329 | $ | 1.48 | 25,367,096 | $ | 1.49 | 27,111,262 | $ | 1.56 | |||||||||||
Granted(1) |
1,858,799 | (2) | 1.91 | 446,294 | (5) | 1.78 | 187,483 | 1.76 | ||||||||||||
Exercised(3) |
(10,741,957 | ) | 1.42 | (956,061 | )(3) | 1.90 | (271,261 | )(4) | 2.00 | |||||||||||
Canceled / Expired |
— | — | — | — | (1,660,388 | )(6) | 2.55 | |||||||||||||
Outstanding at end of year |
15,974,171 | $ | 1.57 | 24,857,329 | $ | 1.48 | 25,367,096 | $ | 1.49 | |||||||||||
- (1)
- As described above in Note l, the Company issued warrants to purchase 1,267,083 shares of common stock during 2010 at $1.66 per share to the Investors as a result of warrant exercises during the year ended December 31, 2010. During the year ended December 31, 2009 the
88
SATCON TECHNOLOGY CORPORATION
NOTES TO CONSOLIDATED FINANCIAL STATEMENTS (Continued)
DECEMBER 31, 2010, 2009 AND 2008
N. STOCKHOLDERS' EQUITY (Continued)
Company issued warrants to purchase 66,295 shares of common stock at $1.66 per share. During the year ended December 31, 2008 the Company issued warrants to purchase 87,483 shares of common stock at $1.66 per share. These warrants are immediately exercisable upon their issuance and have a 7 year life.
- (2)
- In
connection with the Company' s subordinated debt financing, see Note I—Commitments and Contingencies Notes
Payable for more information, warrants to purchase 591,716 shares of common stock were issued to the lender in 2010. These warrants were immediately exercisable and expire on
June 18, 2015.
- (3)
- During
the year ended December 31, 2010, warrants to purchase 8,214,291 shares of common stock were exercised via a cashless exercise resulting in
the issuance of 5,355,929 shares of common stock. During the year ended December 31, 2009, warrants to purchase 151,515 shares of common stock were exercised via a cashless exercise resulting
in the issuance of 35,821 shares of common stock. During the year ended December 31, 2008, warrants to purchase 150,000 shares of common stock were exercised via a cashless exercise resulting
in the issuance of 53,706 shares of common stock.
- (4)
- Includes
303,031 Warrant As and 151,516 Warrant Cs which were redeemed for cash; see Note G. Convertible Debt Instruments and
Warrant Liabilities for more information.
- (5)
- On July 3, 2009, the Company issued warrants to purchase 380,000 shares of common stock at a price of $1.80 per share, the closing price on the date of issuance, in connection with the modification of the anti-dilution provisions of the Investors' existing, and future, warrants to purchase common stock of the Company. The warrants were immediately exercisable and had no vesting provisions. The Company recorded a charge to other income of approximately $0.5 million related to the issuance of these warrants to the Investors. The Company used a Black-Scholes Option pricing model to value this warrant with key inputs as follows:
Input
|
July 3, 2009 | |||
|---|---|---|---|---|
Quoted Stock Price |
$ | 1.80 | ||
Exercise Price |
$ | 1.80 | ||
Time to Maturity (in years) |
7.0 | |||
Stock Volatility |
84 | % | ||
Risk-Free Rate |
2.0 | % | ||
Dividend Rate |
0 | % | ||
- (6)
- On April 7, 2008, the Company issued a warrant to purchase 100,000 shares of common stock at a price of $1.84 per share, the closing price on the date of issuance, in connection with a sales and marketing agreement. The Company recorded a charge to operations of approximately $121,000 related to the issuance of these warrants to the contractor. These warrants are immediately exercisable and had no vesting provisions. These warrants were exercised during 2010 via a cashless
89
SATCON TECHNOLOGY CORPORATION
NOTES TO CONSOLIDATED FINANCIAL STATEMENTS (Continued)
DECEMBER 31, 2010, 2009 AND 2008
N. STOCKHOLDERS' EQUITY (Continued)
exercise resulting in the issuance of 31,599 shares of common stock. The Company used a Black-Scholes Option pricing model to value these warrants with key inputs as follows:
Input
|
April 7, 2008 | |||
|---|---|---|---|---|
Quoted Stock Price |
$ | 1.84 | ||
Exercise Price |
$ | 1.84 | ||
Time to Maturity (in years) |
5.0 | |||
Stock Volatility |
80.6 | % | ||
Risk-Free Rate |
2.80 | % | ||
Dividend Rate |
0 | % | ||
O. PREFERRED STOCK
The Company is authorized to issue up to 1,000,000 shares of Preferred Stock, $0.01 par value per share. The Preferred Stock may be issued in one or more series, the terms of which may be determined at the time of issuance by the Board of Directors, without further action by stockholders, and may include voting rights (including the right to vote as a series on particular matters), preferences as to dividends and liquidation, conversion and redemption rights and sinking fund provisions. See Note I for a discussion of Series B Preferred Stock issued in October 2003 and Series C Preferred Stock issued in November and December 2007. As of December 31, 2010 there were no shares of Preferred Stock outstanding.
On January 6, 2011, the Company entered into a stockholder rights agreement (the "Rights Agreement"). The Rights Agreement provides for a dividend distribution of one preferred stock purchase right for each outstanding share of the Company's common stock. Each right entitles the registered holder to purchase from the Company one-thousandth of a share of the Company's Series A Junior Participating Preferred Stock. The Company's board of directors adopted the Rights Agreement to protect the Company's ability to use its net operating losses and certain other tax attributes ("NOLs") for federal and state income tax purposes. Under the Internal Revenue Code of 1986, as amended (the "Code"), the Company may utilize the NOLs in certain circumstances to offset current and future earnings and thus reduce its federal income tax liability, subject to certain requirements and restrictions. If the Company experiences an "ownership change," as defined in Section 382 of the Code, its ability to use the NOLs could be substantially limited or lost altogether. In general terms, the Rights Agreement is intended to act as a deterrent to any person or group that acquires 4.99% or more of the Company's common stock without approval of the Company's board of directors by allowing other stockholders to acquire equity securities of the Company at half of their fair value. The Rights Plan will continue in effect until January 6, 2014, unless it is terminated or redeemed earlier by the Company's board of directors.
P. SHORT-TERM NOTES
On October 1, 2009, the Company entered into a short-term loan agreement with a bank for $1.3 million backed by a letter of credit from a customer. The short term loan was repaid by the Company during the fourth quarter of 2009.
90
SATCON TECHNOLOGY CORPORATION
NOTES TO CONSOLIDATED FINANCIAL STATEMENTS (Continued)
DECEMBER 31, 2010, 2009 AND 2008
Q. SUPPLEMENTAL DISCLOSURE OF CASH FLOW INFORMATION
Non-Cash Investing and Financing Activities
| |
Year Ended December 31, | |||||||||
|---|---|---|---|---|---|---|---|---|---|---|
| |
2010 | 2009 | 2008 | |||||||
Stock-based compensation(1) |
$ | 4,136,900 | $ | 3,562,779 | $ | 2,752,570 | ||||
Common Stock issued in lieu of interest on redeemable convertible Series B Preferred Stock |
15,000 | 86,370 | 133,666 | |||||||
Common stock issued related to 401(K) contributions |
— | 107,959 | 578,232 | |||||||
Issuance of warrants |
910,000 | — | — | |||||||
Conversion of Series B Preferred Stock for common stock |
375,000 | 1,075,000 | 250,000 | |||||||
Conversion of Series C Preferred Stock for common stock |
28,627,397 | — | — | |||||||
Adjustment to conversion price of Series B Preferred Stock |
— | 55,369 | — | |||||||
Accretion of redeemable convertible preferred stock discount and dividends |
6,884,973 | 5,090,830 | 4,224,502 | |||||||
Issuance of warrants and beneficial conversion feature |
515,000 | 164,000 | 252,000 | |||||||
- (1)
- Includes $(18,357), $86,140, and $168,275, related to discontinued operations for the year ended December 31, 2010, 2009 and 2008, respectively.
Interest and Income Taxes Paid
Cash paid for interest and income taxes was as follows:
| |
Year Ended December 31, | |||||||||
|---|---|---|---|---|---|---|---|---|---|---|
| |
2010 | 2009 | 2008 | |||||||
Interest |
$ | 1,081,681 | $ | 196,589 | $ | 199,126 | ||||
Income taxes |
— | — | — | |||||||
91
SATCON TECHNOLOGY CORPORATION
NOTES TO CONSOLIDATED FINANCIAL STATEMENTS (Continued)
DECEMBER 31, 2010, 2009 AND 2008