Attached files
| file | filename |
|---|---|
| EX-99.1 - EX-99.1 - ONLINE RESOURCES CORP | w82052exv99w1.htm |
| 8-K - 8-K - ONLINE RESOURCES CORP | w82052e8vk.htm |
Exhibit 99.2
| Strategic Growth Plan 4Q & FY 2011 Earnings Conference Call Presentation March 15, 2011 |
| Forward Looking Statements The following information provided by Online Resources Corporation (as well as other written and oral statements made by Online Resources from time to time) contains forward-looking statements which are based on our management's current expectations and beliefs, and on a number of assumptions concerning future events made with information that is currently available. The words "will," "would," "may," "should," "estimate," "project," "forecast," "intend," "expect," "believe," "target," "designed," "plan," and similar expressions are intended to identify forward-looking statements. These forward-looking statements include (but are not limited to): Forecasts of the growth in and penetration of Online Resources' customer base; Forecasts of the growth in the volume of transactions being processed by Online Resources' financial institution customers and by the industry in general; Forecasts of the growth in the number of consumers using online banking and bill payment services; Statements regarding Online Resources' plans for achieving greater profitability and its business outlook for 2011 and beyond; Statements regarding Online Resources' long-term profit targets, including (but not limited to) user adoption rates, and gross margin and net margin targets; and Statements regarding Online Resources' cash position and its ability to cover operating losses. Readers are cautioned not to put undue reliance on such forward-looking statements, which are not a guarantee of any results or performance and are subject to a number of known and unknown risks, uncertainties and other factors (including those which are outside of Online Resources' control) which could cause actual performance or results to differ materially and adversely from any results or performance expressed or implied by such forward-looking statements. Certain factors that might cause such a difference include, but are not limited to: our history of losses and anticipation of future losses; potential fluctuations in our operating results; our dependence on the marketing efforts of third parties; the potential loss of one or more material clients; our potential need for additional capital; our potential inability to prevent systems failures and security breaches; our potential inability to expand our services and related products in the event of a substantial increase in demand for such services and products; competition in our markets; our ability to attract and retain skilled personnel; our reliance on patents and other intellectual property; potential change in the rate of user adoption of the products and services we offer; our exposure to consolidation in the financial services industry; and government regulation affecting our business and client base. For a more detailed description of the factors that could cause such a difference, please refer to Online Resources' filings with the Securities and Exchange Commission, including the information under the heading "Risk Factors" in our Annual Report on Form 10-K filed with the SEC on March 15, 2011. Online Resources assumes no obligation to update or supplement any forward-looking statements. |
| Discussion Agenda Strategic Evaluation Process Objectives Challenges & Strengths Market Opportunities Our Strategy & Plan Financial Implications |
| Strategic Evaluation Process The Company received unsolicited expressions of interest in potential business combinations from multiple third parties. The Board of Directors had a duty to consider these expressions of interest and determine whether a potential business combination could deliver greater shareholder value than the long-term strategic growth plan that the Board had approved in December 2010. As part of its analysis, the Board of Directors actively solicited expressions of interest from additional third parties and thoroughly evaluated all expressions of interest that the Company received. After careful consideration, the Board of Directors determined that the completion of a transaction on acceptable terms was unlikely at this time and that the best course of action to achieve the highest shareholder value is to aggressively pursue our long-term strategic growth plan. Accordingly, the Board has terminated its evaluation of potential business combinations and is not actively pursuing alternatives to the Company's long- term strategic growth plan. |
| Top line growth of mid-teens by 2013 Adjusted Ebitda margin in the mid-twenty range by 2013 High value provider of payment services Innovative leader of new technology and services Objectives |
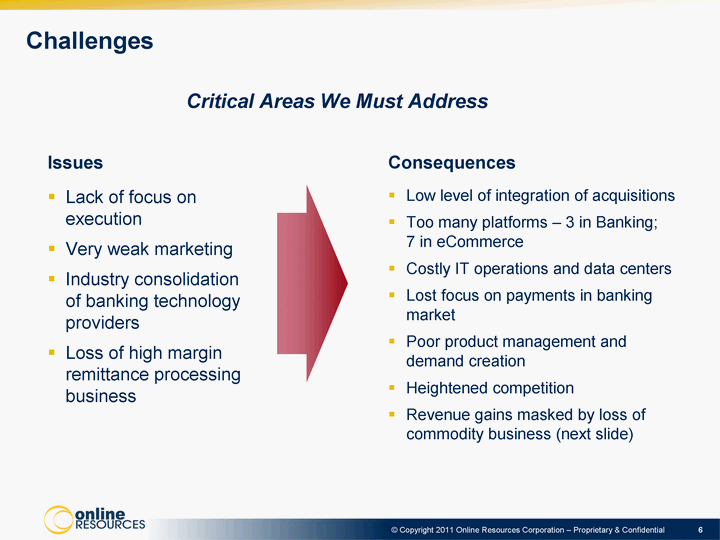
| Challenges Issues Lack of focus on execution Very weak marketing Industry consolidation of banking technology providers Loss of high margin remittance processing business Consequences Low level of integration of acquisitions Too many platforms - 3 in Banking; 7 in eCommerce Costly IT operations and data centers Lost focus on payments in banking market Poor product management and demand creation Heightened competition Revenue gains masked by loss of commodity business (next slide) Critical Areas We Must Address |
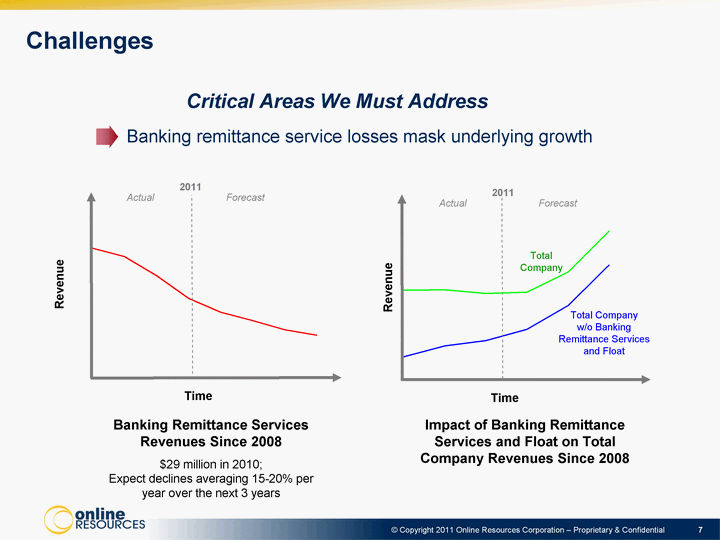
| Challenges Banking remittance service losses mask underlying growth Critical Areas We Must Address Banking Remittance Services Revenues Since 2008 $29 million in 2010; Expect declines averaging 15-20% per year over the next 3 years Impact of Banking Remittance Services and Float on Total Company Revenues Since 2008 2011 36.5 34.3 29 22.9 19.2 16.9 14.4 12.9 Revenue Time Actual Forecast 2011 2008 2009 2010 2011 2012 2013 151.6 151.9 149.5 150.5 162.9 188.5 110.1 116.8 120.2 127.3 142.1 167.3 Total Company w/o Banking Remittance Services and Float Revenue Time Total Company Actual Forecast 2011 |
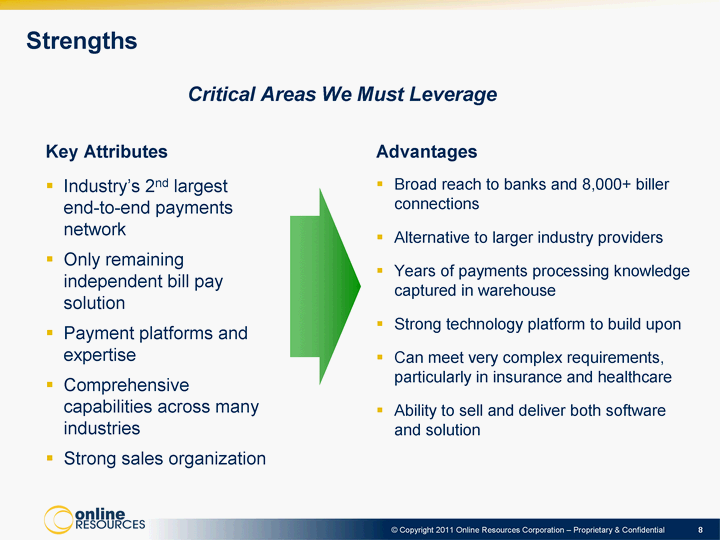
| Strengths Key Attributes Industry's 2nd largest end-to-end payments network Only remaining independent bill pay solution Payment platforms and expertise Comprehensive capabilities across many industries Strong sales organization Advantages Broad reach to banks and 8,000+ biller connections Alternative to larger industry providers Years of payments processing knowledge captured in warehouse Strong technology platform to build upon Can meet very complex requirements, particularly in insurance and healthcare Ability to sell and deliver both software and solution Critical Areas We Must Leverage |
| Only independent company in payments space creates partnership opportunities with significant revenue potential Very competitive solution in the credit union market; according to the NCUA, credit unions have increased average assets since economic downturn eCommerce payments continues to be a growth market; according to Aite Group, the majority of biller-direct solutions are still in-house, and outsourcing is highly fragmented Dissatisfaction with services from other major payments providers creates opportunities with financial institutions looking to switch Consumer preferences, regulations and improved technology demand continual change in payment market Additional software opportunities with large banks Market Opportunities |
| Become Innovative, Best-of-Breed Solution Provider in the Payments Market Leverage technology and improve operational efficiencies Empower our clients and their consumers Become high value provider Provide more innovative solutions Banking - Focus on payments Build strong partnerships Use highly competitive internet banking solution in credit union market as channel for payments Biller - Become highest value provider Exploit patented network to innovate and enhance payments and presentment offerings Be the most partner-friendly provider (reseller services) Specialize by vertical Build international operation Offshore development and solution center in India Sell our payment solution in Asia Explore expanding software opportunities Our Strategy |
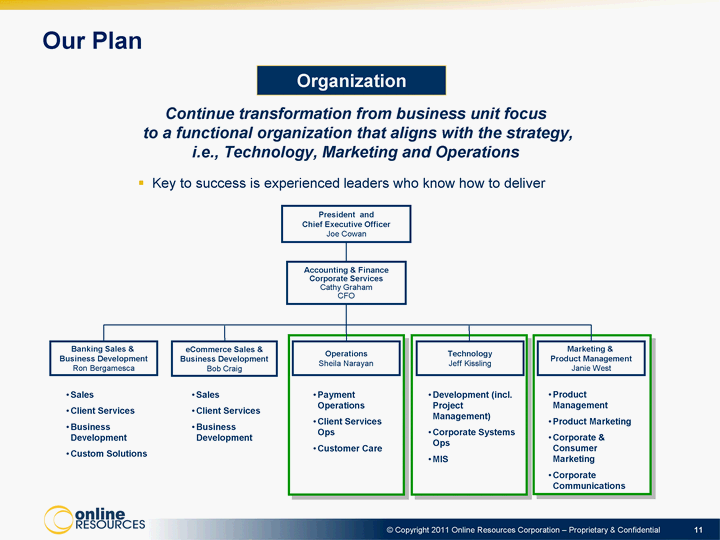
| Our Plan Key to success is experienced leaders who know how to deliver eCommerce Sales & Business Development Bob Craig Operations Sheila Narayan Banking Sales & Business Development Ron Bergamesca President and Chief Executive Officer Joe Cowan Technology Jeff Kissling Marketing & Product Management Janie West Product Management Product Marketing Corporate & Consumer Marketing Corporate Communications Development (incl. Project Management) Corporate Systems Ops MIS Payment Operations Client Services Ops Customer Care Sales Client Services Business Development Sales Client Services Business Development Custom Solutions Organization Continue transformation from business unit focus to a functional organization that aligns with the strategy, i.e., Technology, Marketing and Operations Accounting & Finance Corporate Services Cathy Graham CFO |

| Our Plan Technology Implement Agile development process - completed in 1Q 2011 Transform technology organization through off-shoring Leverage Indian technology center to bring in new talent with different skill sets Reduce technology cost by more than $11 million annually by 2013 Create longer-term software sales opportunity in Asia Execute multi-phase platform convergence plan within 24 months Reduce online banking platforms from 3 to 2 Reduce payment platforms from 6 to 2 Reduce IT and data center costs by 66% in 2-3 years; Reduce IT headcount costs by 35% by year-end 2013; Leverage enabling technologies to deliver new products Forecasted Decrease in IT Headcount Costs Over Time Q411 Q412 Q413 $M Q411 Q412 Q413 |
| Our Plan Operations Transform operational service delivery to drive down costs Move from a "high touch" service environment to an "empowered self- service" environment Provide self-servicing capabilities to clients and end-users Simplify existing internal practices with enhanced administrative tools Streamline and automate client enhancement request processes Map processes and procedures to major changes in IT Through new self-service tools, reduce client enhancement requests by 50% by 2013; Reduce new client implementation durations by 50% in 2012 |
| Our Plan Product, Marketing & Sales Invest in product management Streamline product suites; address gaps Be first movers with innovative products and leverage flexible technology to address complex needs in targeted vertical markets Formalize and invest in product marketing function and lead creation Create better brand and product awareness through more and consistent campaigns Take advantage of independent status to position services - flexible and Core neutral Enhance reseller marketing programs Strengthen and increase efficiency of sales organization Aggressively pursue payment partnerships Develop new sales and marketing materials to empower sales operations Increase ORCC brand awareness to: Increase participation in RFPs by 50% Increase revenue per sales person by 40% |

| Our Plan New Wins Drive Growth as Losses Subside RS losses diminishing impact over time Growth from new wins: 10% in 2011 15+% in 2013 Not dependent on increased same-store sales growth or material float increase Revenue Growth Total Growth RS and Other Unusual Losses |
| Financial Implications Business Model Still Works 90+% recurring revenue driven by per transaction and monthly user fees 90+% of annual revenue from clients already implemented on January 1 3+ year average contract lengths; strong early termination penalties in banking; minimums in eCommerce Relatively fixed cost base - 70+% fixed or semi-fixed Market Growth Exists Same-store transaction growth rate assumptions consistent with industry averages Banking - 6% (historically in the low teens) eCommerce - 8% (sign of recovery - low teens last two quarters) Interest rates at all-time lows Flat interest rate assumption in 2011 Gradual increase assumed starting in 2012, capping out at 350 bps in mid 2014 |
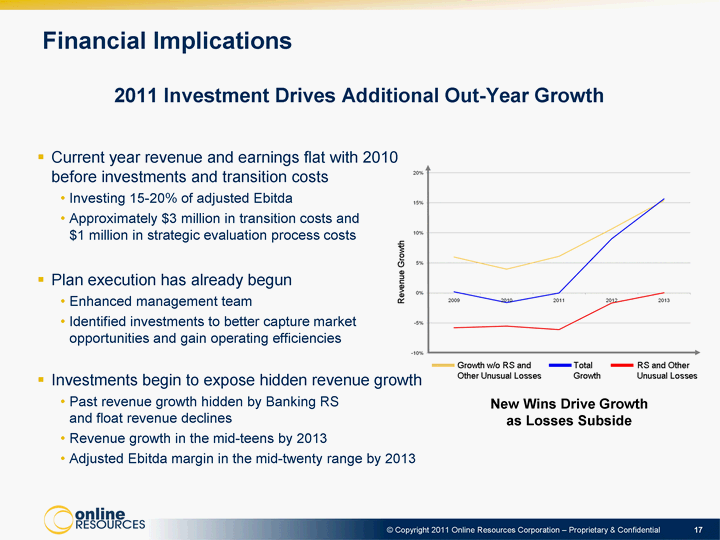
| Financial Implications 2011 Investment Drives Additional Out-Year Growth New Wins Drive Growth as Losses Subside Current year revenue and earnings flat with 2010 before investments and transition costs Investing 15-20% of adjusted Ebitda Approximately $3 million in transition costs and $1 million in strategic evaluation process costs Plan execution has already begun Enhanced management team Identified investments to better capture market opportunities and gain operating efficiencies Investments begin to expose hidden revenue growth Past revenue growth hidden by Banking RS and float revenue declines Revenue growth in the mid-teens by 2013 Adjusted Ebitda margin in the mid-twenty range by 2013 |

| Financial Implications Potential Impact of the Durbin Amendment eCommerce Service Fee/ITM business has debit interchange as a part of transaction costs Bill pay processors have higher than average debit card usage and payment amounts so rate change could create noticeable adjustment to earnings and revenue 2011-2013 earnings expectations incorporate only modest benefits from lower debit interchange under Durbin as market price adjustments will likely move to offset savings Less than $2 million in 2011 and 2012 Less than $1 million in 2013 Revenue impact has not yet been quantified or included in expectations Uncertainty remains about whether Durbin will be implemented under the current schedule and/or terms |
| ORCC Has a Strong Foundation and High Potential We have a clear vision and strategy We remain financially stable with healthy cash generation and cash flow, and we have access to available capital We have considerable market opportunities and competitive advantages ready to be leveraged We have a new, strong team in place with a prove track record of execution ORCC can achieve its full potential with a renewed focus and the new team that knows how to get results Conclusion |
| Thank You For More Information Beth Halloran Sr. Dir., Corporate Communications bhalloran@orcc.com 703.653.2248 |
