Attached files
| file | filename |
|---|---|
| EX-23 - A.T. CROSS COMPANY FORM 10-K EXHIBIT 23 - COSTA INC | exhibit23.htm |
| EX-21 - A.T. CROSS COMPANY FORM 10-K EXHIBIT 21 - COSTA INC | exhibit21.htm |
| EX-32 - A.T. CROSS COMPANY FORM 10-K EXHIBIT 32 - COSTA INC | exhibit32.htm |
| EX-31.2 - A.T. CROSS COMPANY FORM 10-K EXHIBIT 31.2 - COSTA INC | exhibit31_2.htm |
| EX-31.1 - A.T. CROSS COMPANY FORM 10-K EXHIBIT 31.1 - COSTA INC | exhibit31_1.htm |
UNITED STATES
SECURITIES AND EXCHANGE COMMISSION
Washington, DC 20549
FORM 10-K
ANNUAL REPORT
PURSUANT TO SECTION 13 OR 15(d) OF THE SECURITIES EXCHANGE ACT OF 1934
For the fiscal year ended January 1, 2011
Commission File Number 1-6720
A. T. CROSS COMPANY
(Exact name of registrant as specified in its charter)
|
Rhode Island
(State or other jurisdiction of incorporation or organization)
|
05-0126220
(IRS Employer Identification No.)
|
|
One Albion Road, Lincoln, Rhode Island
(Address of principal executive offices)
|
02865
(Zip Code)
|
|
Registrant's telephone number, including area code: (401) 333-1200
|
|
|
Securities registered pursuant to Section 12(b) of the Act:
|
|
|
Title of each class
|
Name of each exchange on which registered:
|
|
Class A Common Stock ($1 Par Value)
|
NASDAQ
|
|
Securities registered pursuant to Section 12(g) of the Act: None
|
|
|
Indicate by check mark if the registrant is a well-known seasoned issuer, as defined in Rule 405 of the Securities Act.
|
|||||||||||
|
Yes
|
X
|
No
|
|||||||||
|
Indicate by check mark if the registrant is not required to file reports pursuant to Section 13 or Section 15(d) of the Act.
|
||||||||||
|
Yes
|
X
|
No
|
||||||||
|
Indicate by check mark whether the registrant (1) has filed all reports required to be filed by Section 13 or 15(d) of the Securities Exchange Act of 1934 during the preceding 12 months (or for such shorter period that the registrant was required to file such reports), and (2) has been subject to such filing requirements for the past 90 days.
|
|||||||||||||
|
X
|
Yes
|
No
|
|||||||||||
|
Indicate by check mark whether the registrant has submitted electronically and posted on its corporate Website, if any, every Interactive Data File required to be submitted and posted pursuant to Rule 405 of Regulation S-T (S 232.405 of this chapter) during the preceding 12 months (or shorter period that the registrant was required to submit and post such files).
|
|||||||||||||
|
Yes
|
No
|
||||||||||||
|
Indicate by check mark if disclosure of delinquent filers pursuant to Item 405 of Regulation S-K (S 229.405 of this chapter) is not contained herein, and will not be contained, to the best of registrant's knowledge, in definitive proxy or information statements incorporated by reference in Part III of this Form 10-K or any amendment to this Form 10-K. [X]
|
|||||||||||||
|
Indicate by check mark whether the registrant is a large accelerated filer, an accelerated filer, a non-accelerated filer or a smaller reporting company in Rule 12b-2 of the Exchange Act.
|
||||||||||||||||||
|
Large accelerated filer
|
Accelerated filer
|
|||||||||||||||||
|
Non-accelerated filer
|
Smaller reporting company
|
X
|
||||||||||||||||
|
Indicate by check mark whether the registrant is a shell company (as defined in Rule 12b-2 of the Act).
|
||||||||||||||||||
|
Yes
|
X
|
No
|
||||||||||||||||
|
The aggregate market value of the registrant's voting and non-voting common equity held by non-affiliates as of July 3, 2010, the last business day of the registrant's most recently completed second fiscal quarter was $33.0 million.
|
||||||||||||||||||
|
The number of shares outstanding of each of the registrant's classes of common stock as of February 28, 2011 was:
|
||||
|
Class A common stock -
|
10,975,342
|
Shares
|
||
|
Class B common stock -
|
1,804,800
|
Shares
|
||
|
DOCUMENTS INCORPORATED BY REFERENCE
|
|
Portions of the definitive proxy statement for the 2011 annual meeting of shareholders are incorporated by reference into Part III of this report.
|
INDEX
|
Part I
|
Page
|
||
|
Item 1
|
Business ----------------------------------------------------------------------------------------------------------------------------
|
1 - 4
|
|
|
Item 1A
|
Risk Factors ------------------------------------------------------------------------------------------------------------------------
|
4 - 5
|
|
|
Item 1B
|
Unresolved Staff Comments ---------------------------------------------------------------------------------------------------
|
6
|
|
|
Item 2
|
Properties --------------------------------------------------------------------------------------------------------------------------
|
6
|
|
|
Item 3
|
Legal Proceedings ---------------------------------------------------------------------------------------------------------------
|
6
|
|
|
Part II
|
|||
|
Item 5
|
Market For Registrant's Common Equity, Related Stockholder Matters
|
||
|
and Issuer Purchases of Equity Securities --------------------------------------------------------------------------------
|
7 - 8
|
||
|
Item 6
|
Selected Financial Data --------------------------------------------------------------------------------------------------------
|
8
|
|
|
Item 7
|
Management's Discussion and Analysis of Financial Condition and
|
||
|
Results of Operations ----------------------------------------------------------------------------------------------------------
|
9 - 16
|
||
|
Item 7A
|
Quantitative and Qualitative Disclosures about Market Risk --------------------------------------------------------
|
16
|
|
|
Item 8
|
Financial Statements and Supplementary Data --------------------------------------------------------------------------
|
17 - 40
|
|
|
Item 9
|
Changes in and Disagreements with Accountants on Accounting and
|
||
|
Financial Disclosure -----------------------------------------------------------------------------------------------------------
|
41
|
||
|
Item 9A
|
Controls and Procedures -----------------------------------------------------------------------------------------------------
|
41
|
|
|
Item 9B
|
Other Information ---------------------------------------------------------------------------------------------------------------
|
41
|
|
|
Part III
|
|||
|
Item 10
|
Directors, Executive Officers and Corporate Governance -----------------------------------------------------------
|
42
|
|
|
Item 11
|
Executive Compensation -----------------------------------------------------------------------------------------------------
|
42
|
|
|
Item 12
|
Security Ownership of Certain Beneficial Owners and Management
|
||
|
and Related Stockholder Matters ------------------------------------------------------------------------------------------
|
42
|
||
|
Item 13
|
Certain Relationships and Related Transactions, and Director Independence ---------------------------------
|
42
|
|
|
Item 14
|
Principal Accounting Fees and Services ---------------------------------------------------------------------------------
|
42
|
|
|
Part IV
|
|||
|
Item 15
|
Exhibits, Financial Statement Schedules ---------------------------------------------------------------------------------
|
43 - 44
|
|
|
Signatures -----------------------------------------------------------------------------------------------------------------------
|
45
|
||
|
Exhibits
|
|||
|
Exhibit 21
|
A. T. Cross Company Subsidiaries, Branches and Divisions ------------------------------------------------------
|
46
|
|
|
Exhibit 23
|
Consent of Independent Registered Public Accounting Firm -----------------------------------------------------
|
47
|
|
|
Exhibit 31.1
|
Form of 302 Certifications ---------------------------------------------------------------------------------------------------
|
48
|
|
|
Exhibit 31.2
|
Form of 302 Certifications ---------------------------------------------------------------------------------------------------
|
49
|
|
|
Exhibit 32
|
Form of 906 Certifications ---------------------------------------------------------------------------------------------------
|
50
|
|
PART I
|
Item 1
|
BUSINESS
|
The A.T. Cross Company (the “Company”) has two reportable segments: Cross Accessory Division (“CAD”), and Cross Optical Group (“COG”). For certain financial information with respect to these segments, see Note K to the Company's consolidated financial statements included in Item 8 of this Annual Report on Form 10-K.
Cross Accessory Division
We manufacture and market fine quality writing instruments under the Cross® brand consisting of ball-point pens, fountain pens, selectip® rolling ball pens and mechanical pencils. We also manufacture and market a variety of refills for most of our product types. In addition to Cross-branded writing instruments, CAD manufactures and markets a FranklinCovey line of entry level price point refillable writing instruments. The Company is an original equipment manufacturer (“OEM”) of writing instruments. In addition to writing instruments, we also design and market a variety of personal and business accessories including leather goods, reading glasses, watches, desk sets, cufflinks, and stationery. The Company launches new pen products and other personal accessories on a bi-annual basis.
Our writing instruments are offered in a variety of styles and materials at various price points. They are packaged and sold as individual units or in matching sets. The majority of writing instrument sales occurs at suggested retail price points between approximately $20 and $50. We believe we are a market leader in the United States at these price points. Products in this price range include: Classic® Century®, Calais, Cross Advantage, Aventura®, Stratford, Cross Contour, Century III, Cross Edge, Tech3, Stylist and selected Century II and ATX® writing instruments. The Cross Townsend®, Torero, Sauvage, Cross Sentiment, C-Series, Apogee®, Cross Affinity, Masquerade, and Century II lines as well as selected Classic Century and ATX writing instruments provide the Company a presence in the $55 to $300 price range. Certain Classic Century and Cross Townsend writing instruments are priced over $300. The Sable, Helios, Nile, Revere, Sage and Parasol writing instrument product lines are sold to the Company's self-serve channels of distribution including the office superstore customers. The FranklinCovey brand provides the Company a presence in the under $10 suggested retail price range for a ball-point pen.
Cross leather goods range in price from $40 to $185, reading glasses are priced at $30 and $35, watches range between $95 and $330, desk sets are priced at $225, cufflinks from $50 to $80 and stationery from $20 to $25.
The Company emphasizes styling, innovation, craftsmanship and quality in the design and production of all of its products. All Cross-branded writing instruments carry a full warranty of unlimited duration against mechanical failure. Our watches are sold with a limited two-year warranty, and leather goods are sold with a limited one-year warranty.
CAD products are sold throughout the United States by our direct sales force and manufacturers' agents or representatives to approximately 2,400 retail and wholesale accounts, and directly to consumers via the Company's website: www.cross.com, and the Cross retail stores. Retail accounts include: gift stores, department stores, jewelers, stationery, office supply and pen specialty stores, and United States military post exchanges. Our wholesale accounts distribute Cross Accessory Division products to retail outlets that purchase in smaller quantities. Advertising specialty representatives market to business accounts CAD products that typically are engraved or display a name or emblem and are used for gifts, sales promotions, incentives or advertising.
Sales of Cross Accessory Division products outside the United States during 2010 were made to foreign distributors and retailers worldwide by the Company and its wholly-owned subsidiaries.
Cross Optical Group
The Company's COG segment consists of its wholly-owned subsidiary, Cross Optical Group, Inc., which is the legal entity of our two sunglass brands: Costa® and Native®. Costa was acquired in 2003, and Native was purchased in March of 2008. Cross Optical Group, Inc. was formed on January 2, 2010. This business designs, manufactures and markets premium, high-quality, polarized sunglasses and goggles under the brand names Costa and Native. Combined, our brands offer more than 75 styles and 25 lens options at suggested retail price points between approximately $89 and $290. Our sunglasses are sold by employee representatives and manufacturers' agents to approximately 5,000 retail accounts throughout the United States. Retail accounts include optical and sunglass specialty shops, department stores and sporting goods retailers. Costa and Native sunglasses are sold with a lifetime warranty against defects in materials and workmanship.
1
Raw Materials
The Company's CAD segment obtains raw materials for use in writing instruments from both domestic and foreign suppliers. Metal, plastic, and leather pen parts are obtained from the United States (“U.S.”), China, Germany, Japan, India, Malaysia, and Switzerland. Coated parts are procured from the U.S. and China. Ink is procured from the U.S., Germany, China and Japan.
The majority of component materials for the COG segment are imported from highly specialized manufacturers located in Europe and Asia.
To maintain the highest level of product quality, we rely on a limited number of domestic and foreign suppliers for certain raw materials and manufacturing technologies. The Company may be adversely affected in the event that these suppliers cease operations or if pricing terms become less favorable. The Company believes, but cannot be assured; that the raw materials currently supplied by these vendors could be obtained from other sources and that the manufacturing technologies could either be developed internally or that suitably similar technologies could be located.
Patents, Licenses and Trademarks
The Company, directly or through its subsidiaries, has certain writing instrument, timepiece, accessory and optical trademark registrations and/or pending trademark applications in the United States and many foreign countries, including but not limited to its principal trademark “CROSS,” and the frustoconical top of its writing instruments, and the trademarks “COSTA DEL MAR” and “NATIVE.” The principal trademark “CROSS” is of fundamental importance to the CAD segment and the trademarks “COSTA DEL MAR”, “COSTA” and “NATIVE” are of fundamental importance to the COG segment. The Company, directly or through its subsidiaries, holds certain United States and foreign writing instrument patents and/or has filed United States and foreign patent applications covering products including, but not limited to, Cross Townsend, Ion and Verve as well as the Company's ball-point pen mechanism. While we pursue a practice of seeking patent protection for novel inventions or designs, our business is not dependent upon obtaining and maintaining patents.
Seasonal Business
The CAD segment has historically generated its highest sales in the second half of the year, approximately one-third in the fourth quarter. The COG segment has historically generated its highest sales in the first half of the year, approximately one-third in the second quarter.
Working Capital Requirements
Writing instrument and sunglass inventory balances tend to be highest in anticipation of new product launches and before peak selling seasons. The Company offers, and may offer in the future, extended payment terms, primarily to domestic retail writing instrument customers, at certain points during the year, usually September through November.
Customers
The Company is not dependent upon any single customer for more than 5% of its consolidated revenues.
Backlog of Orders
The backlog of orders is not a significant factor in the Company's business.
Competition
The global non-disposable writing instrument market is estimated to be approximately $2.4 billion at retail. It is competitive, in particular with respect to product quality, brand recognition and price. There are numerous manufacturers of ball-point, rolling ball and fountain pens, and mechanical pencils in the U.S. and abroad. Many of these manufacturers produce lower-priced writing instruments than those produced by the Company. Although the Company is a major producer of ball-point, rolling ball and fountain pens, and mechanical pencils in the $20 to $50 price range, other writing instrument companies have significantly higher sales volumes from a broader product line across a wider range of prices or have greater resources as divisions of larger corporations. The Company
2
emphasizes styling, innovation, craftsmanship and quality in the design and production of all of its products. All of the Company's Cross-branded writing instruments carry a full warranty of unlimited duration against mechanical failure.
The plano sunglass market in the U.S. is estimated to be $3.2 billion at retail. The Company's COG segment under the brand names Costa and Native compete in the premium-priced ($50+ retail) sunglass market segment, which is estimated to be $2.2 billion at retail. Many other sunglass companies also compete in the premium segment. Costa and Native sunglasses are sold with a lifetime warranty against defects in materials and workmanship.
See also the “Risk Factors” in Item 1A of this Annual Report on Form 10-K.
Research and Development
The Company had expenditures for research and development of new products and improvement of existing products of approximately $2.8 million, $2.8 million and $2.4 million in 2010, 2009 and 2008, respectively. For additional discussion, see “Management's Discussion and Analysis of Financial Condition and Results of Operations” in Item 7 of this Annual Report on Form 10-K.
Environment
The Company believes it is in compliance with all Federal, state and local environmental laws and regulations. The Company believes that future capital expenditures for environmental control facilities will not be material. See Item 3 “Legal Proceedings” and Note L to the Company's consolidated financial statements in Item 8 of this Annual Report on Form 10-K.
Employees
The Company had approximately 950 employees worldwide at January 1, 2011, none of which were subject to collective bargaining agreements.
International Operations and Export Sales
Approximately 43% of the Company's sales in 2010 were in foreign markets. The primary foreign markets are in Europe and Asia. Sales of the Company's products to foreign distributors are subject to import duties in many countries. The operations of the Company's foreign subsidiaries and branches are subject to the effects of currency fluctuations, the availability of U.S. dollar exchange, exchange control and other restrictive regulations. Undistributed earnings of our foreign subsidiaries generally are not subject to current U.S. Federal and state income taxes, as such earnings are considered permanently reinvested in the growth of business outside the U.S. The Company manufactures almost all of its core writing instruments in China. See Note J and Note K to the Company's consolidated financial statements in Item 8 of this Annual Report on Form 10-K. For the effect of foreign sales on the Company's results of operations, see “Management's Discussion and Analysis of Financial Condition and Results of Operations” in Item 7 of this Annual Report on Form 10-K.
Availability of Securities and Exchange Commission Filings
The Company's website address is www.cross.com. The Company makes available free of charge, through the Investor Relations section of its website, its Annual Reports on Form 10-K, Quarterly Reports on Form 10-Q, Current Reports on Form 8-K and all amendments to those reports as soon as reasonably practicable after such materials have been electronically filed with or furnished to the Securities and Exchange Commission (“SEC”). Information on the Company's website is not incorporated into this Annual Report.
3
Executive Officers of the Company
The following are the executive officers of the Company (each of whom serves until his or her successor is elected and has qualified), their respective ages as of January 1, 2011 and their principal positions:
|
NAME
|
AGE
|
TITLE
|
YEAR IN WHICH
FIRST HELD OFFICE
|
|
|
David G. Whalen
|
(1)
|
53
|
President and Chief Executive Officer
|
1999
|
|
Kevin F. Mahoney
|
(2)
|
51
|
Senior Vice President, Finance and
Chief Financial Officer
|
2009
|
|
Gary S. Simpson
|
(3)
|
59
|
Corporate Controller, Chief Accounting Officer
|
1997
|
|
Charles S. Mellen
|
(4)
|
47
|
President, Cross Accessory Division
|
2007
|
|
Tina C. Benik
|
(5)
|
51
|
Vice President, Legal and Human Resources
Corporate Secretary
|
2000
|
|
Joseph V. Bassi
|
(6)
|
58
|
Finance Director
|
1997
|
|
Charles R. MacDonald
|
(7)
|
57
|
President, Cross Optical Group, Inc.
|
2010
|
|
(1)
|
Prior to becoming President and Chief Executive Officer in 1999, David G. Whalen was President, North America of Ray-Ban Sun Optics, a division of the Luxottica Group S.p.A., from 1997 to 1999.
|
|
(2)
|
Prior to becoming Senior Vice President, Finance and Chief Financial Officer in 2009, Kevin F. Mahoney was Vice President, Finance and Chief Financial Officer from 2005 to 2009. From 2004 to 2005, Mr. Mahoney was Director, Corporate Development at the Raytheon Company, and from 1984 to 2004, Mr. Mahoney was with Deloitte & Touche LLP, most recently serving as Partner.
|
|
(3)
|
Prior to becoming Corporate Controller in 1997, Gary S. Simpson was the Controller, Lincoln Operations from 1992 to 1997.
|
|
(4)
|
Prior to becoming President, Cross Accessory Division in 2007, Charles S. Mellen was Senior Vice President, Global Marketing and Sales from 2006 to 2007 and Vice President, Global Marketing from 2005 to 2006. From 1996 to 2004, Mr. Mellen was Vice President of Marketing at Tumi, Inc.
|
|
(5)
|
Prior to becoming Vice President, Legal and Human Resources; Corporate Secretary in 2000, Tina C. Benik was Vice President, Legal, General Counsel and Corporate Secretary from 1993 to 2000.
|
|
(6)
|
Prior to becoming Finance Director in 1997, Joseph V. Bassi was Manager, Financial Planning from 1996 to 1997 and Manager, Budgeting and Financial Planning from 1987 to 1996.
|
|
(7)
|
Prior to becoming President, Cross Optical Group, Inc. in 2010, Charles R. MacDonald was President, Cross Optical Group and Costa Del Mar Sunglasses, Inc. from 2007 to 2010. From 2003 to 2007, he was Vice President, A.T. Cross Optical Division and President, Costa Del Mar Sunglasses, Inc. From 1996 to 2002, Mr. MacDonald was President of Outlook Eyewear Company, a division of the Luxottica Group S.p.A.
|
|
Item 1A
|
RISK FACTORS
|
The following section describes certain of the more prominent risks and uncertainties inherent in our operations. The risks and uncertainties below are those that we currently consider material; however, this section does not intend to discuss all possible risks and uncertainties that a company like Cross with broad international operations could experience. We are susceptible to macroeconomic downturns in the United States or abroad that may affect the general economic climate and the performance of our customers. Similarly, the price of our securities is subject to volatility due to fluctuations in general market conditions, differences in our results of operations from estimates and projections generated by the investment community, and other factors beyond our control. Further, there could be other risks and uncertainties that are not presently known to us or that may become more significant to us. You should read these Risk Factors in conjunction with the factors discussed elsewhere in this and other of our filings with the SEC and in materials incorporated by reference in these filings. We undertake no obligation to correct or update any forward-looking statements or statements of risk related thereto for any reason.
4
We depend on the success of new products. Our ability to sustain profitability and growth in sales depends largely on consumer acceptance of numerous new products recently introduced and planned for introduction. Further, consumer preferences are continuously changing. The markets in which we sell are highly competitive, and there is no assurance that consumer acceptance will be realized to the degree necessary to generate continued growth in our sales and earnings.
Our global manufacturing, sales and distribution operations make us susceptible to the risks of overseas operations. We have sales offices and certain operations in nine countries and distributors worldwide. In 2010, approximately 43% of our revenue came from sales to locations outside the United States. Most of our products are manufactured overseas. Operating internationally exposes us to changes in export controls and other laws or regulations, as well as the general political and economic conditions, security risks, health conditions and possible disruptions in transportation networks, of the various countries in which we operate, which could result in an adverse effect on our business and results of operations in such countries.
Incorrect forecasts of consumer demand could adversely affect our results of operations. The Company manufactures product based on forecasts of consumer demand. These forecasts are based on multiple assumptions. If we inaccurately forecast consumer demand we may hold inadequate, excess or obsolete inventory that would reduce our profit margins and adversely affect our results of operations and financial condition. Goodwill and other indefinite-lived intangible assets impairment analyses rely on forecasted cash flows resulting from our expectations of consumer demand. Failure to meet these forecasts could result in an impairment of goodwill or other indefinite-lived intangible assets, which would impact results of operations.
Our success depends on our ability to retain and recruit a sufficient number of qualified employees in a competitive environment. Our success depends in part on our retention and recruitment of skilled personnel, including technical, distribution, sourcing, marketing, sales, management and staff personnel. There can be no assurance that we will be able to successfully retain and recruit the key personnel that we need.
Our dependence on certain suppliers may leave us temporarily without adequate access to raw materials or products. To maintain the highest level of product quality, we rely on a limited number of domestic and foreign suppliers for certain raw materials, manufacturing technologies and certain finished products. We may be adversely affected in the event that these suppliers cease operations or if pricing terms become less favorable. We believe, but cannot guarantee, that we could obtain the raw materials currently supplied by these vendors from other sources and that we could either develop the manufacturing technologies internally or locate suitably similar technologies. If we are unable to replace a key supplier we may face delays in delivering finished products according to our customers' demands, which could have an adverse effect on our financial performance.
Overseas manufacturing makes us dependent upon the performance of our overseas partners. As a result of our manufacturing initiative, we manufacture most of our finished products in China. Our manufacturing operations in China are supported by a local partner from whom Cross leases the building housing Cross' physical plant.
Unfavorable resolution of pending or future litigation matters could prove costly to us. In 2002, the Company received a so-called notice letter under the Comprehensive Environmental Response, Compensation and Liability Act ("CERCLA") from the Federal Environmental Protection Agency (“EPA”) alleging that the Company is a Potentially Responsible Party (“PRP”) in one Superfund case. It is the Company’s understanding that the EPA has sent similar notice letters to numerous other companies and that the EPA is continuing it investigation to identify potential additional RPRs. In certain instances, a PRP has joint and several liability under existing U.S. environmental laws. Where we have been designated a PRP by the EPA or a state environmental agency, we are potentially liable to the government or third parties for the full cost of remediating contamination at our facilities or former facilities or at third-party sites. If we were required to fully fund the remediation of a site, the statutory framework would allow us to pursue rights to contribution from other PRPs.
We are involved from time to time in litigation matters. An unfavorable resolution of pending litigation could have a material adverse effect on our financial condition. Litigation may result in substantial costs and expenses and significantly divert the attention of our management regardless of the outcome. There can be no assurance that we will be able to achieve a favorable settlement of pending litigation or obtain a favorable resolution of litigation if it is not settled. In addition, current and future litigation, governmental proceedings or environmental matters could lead to increased costs or interruptions of our normal business operations.
5
|
Item 1B
|
UNRESOLVED STAFF COMMENTS
|
Not applicable.
|
Item 2
|
PROPERTIES
|
The Company leases its Lincoln, Rhode Island corporate headquarters, housing both corporate offices and CAD segment administrative facilities. Our leased facility in Dong Guan City, China houses the CAD segment's manufacturing operations and the segment also leases administrative and/or warehouse facilities for its operations in the United Kingdom, France, Japan, Hong Kong, Taiwan, Singapore and China. In addition, the CAD segment leases retail facilities in Massachusetts and the United Kingdom.
The Company's COG segment leases administrative and/or warehouse facilities in Florida and Colorado.
|
Item 3
|
LEGAL PROCEEDINGS
|
The Company was named as one of approximately ninety defendants in a contribution suit brought by CCL/Unilever relating to the J.M. Mills Landfill Site (the “Site”), which is part of the Peterson/Puritan Superfund Site in Cumberland, Rhode Island. These complaints alleged that the Company was liable under CERCLA for contribution for Site investigation costs. The Company has reached settlement of the case and paid a settlement amount of approximately $0.2 million in 2010.
The Company expects that the EPA will select a remedy for the Site in 2011. At that time, the EPA will initiate an administrative process (the "Special Notice Process") pursuant to CERCLA whereby the EPA will request that those entities that the EPA contends arranged for the disposal of hazardous materials at the Site (the PRPs), undertake the selected remedy at the Site. The EPA contends that the Company is a PRP at the Site. During the Special Notice Process, the Company and the other PRPs will engage in negotiations with the EPA regarding the remedy, and among themselves regarding the contribution of each PRP to overall remediation costs. Neither the cost of the remedy nor the identity of all PRPs is known at this time. Therefore it is not possible to assess the outcome of the Special Notice Process as it may relate to the Company's contribution to remediation costs.
The Company is involved in various other litigation and legal matters that have arisen in the ordinary course of business. To its knowledge, management believes that the ultimate resolution of any of those existing matters will not have a material adverse effect on the Company's consolidated financial position or results of operations.
|
Item 4
|
(REMOVED AND RESERVED)
|
6
PART II
|
Item 5
|
MARKET FOR REGISTRANT'S COMMON EQUITY, RELATED STOCKHOLDER MATTERS AND ISSUER PURCHASES OF EQUITY SECURITIES
|
Market Information
The Company's Class A common stock is traded on NASDAQ (symbol: ATX). There is no established trading market for the Company's Class B common stock. At January 1, 2011, there were approximately 1,100 shareholders of record of the Company's Class A common stock and two shareholders of record of the Company's Class B common stock. The weighted average numbers of total shares outstanding was 12,686,183 and 14,771,975 during 2010 and 2009, respectively.
Market Price of and Dividends on the Registrant's Common Equity and Related Shareholder Matters
High and low sales prices of Class A common stock for the last two years were:
|
2010
|
2009
|
||||||
|
QUARTER
|
HIGH
|
LOW
|
QUARTER
|
HIGH
|
LOW
|
||
|
First
|
$5.32
|
$3.54
|
First
|
$3.06
|
$1.62
|
||
|
Second
|
$5.02
|
$4.05
|
Second
|
$4.95
|
$2.35
|
||
|
Third
|
$7.17
|
$4.11
|
Third
|
$4.97
|
$3.05
|
||
|
Fourth
|
$10.17
|
$5.82
|
Fourth
|
$6.93
|
$3.50
|
||
The Company intends to retain earnings to finance the growth of the Company.
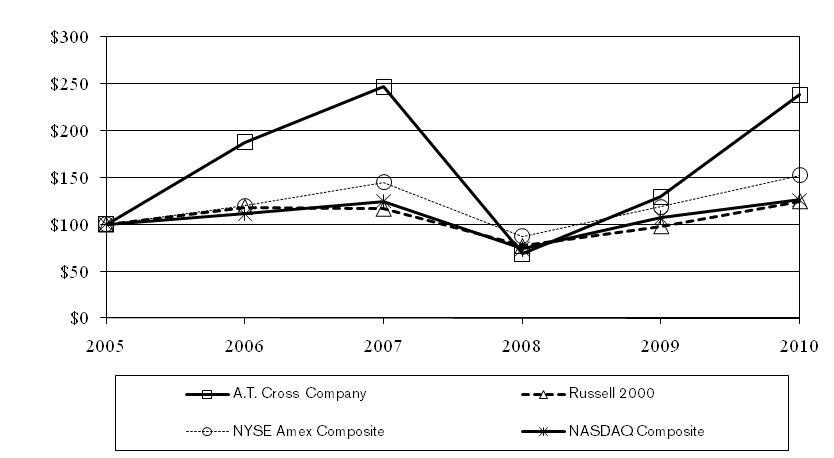
Performance Graph
The following graph compares the performance of the Company's Class A common stock to the Russell 2000 Index (as the Company's peer group index), the NYSE Amex Composite and the NASDAQ Composite over the Company's last five years. The graph assumes that the value of the investment in the Company's Class A common stock and each index was $100 at December 31, 2005 and that all dividends were reinvested.
COMPARISON OF 5-YEAR CUMULATIVE TOTAL RETURN
among the A.T. Cross Company, the Russell 2000 Index
the NYSE Amex Composite and the NASDAQ Composite
7
|
Company/Index/Composite
|
2005
|
2006
|
2007
|
2008
|
2009
|
2010
|
|
A.T. Cross Company
|
100.00
|
187.65
|
246.42
|
68.64
|
129.14
|
238.27
|
|
Russell 2000
|
100.00
|
118.37
|
116.51
|
77.15
|
98.11
|
124.46
|
|
NYSE Amex Composite
|
100.00
|
119.54
|
144.62
|
87.02
|
118.50
|
152.13
|
|
NASDAQ Composite
|
100.00
|
111.16
|
124.64
|
73.80
|
107.07
|
125.99
|
The Company has chosen the Russell Group 2000 as a meaningful peer group against which to compare its performance. The Russell Group 2000 represents a broad based group of small capitalization stocks and is generally believed to be indicative of market performance for small capitalization companies.
Issuer Purchases of Equity Securities
|
TOTAL
NUMBER
OF SHARES
PURCHASED
|
AVERAGE
PRICE PAID
PER SHARE
|
TOTAL NUMBER
OF SHARES
PURCHASED AS
PART OF PUBLICLY
ANNOUNCED PLANS
OR PROGRAMS
|
MAXIMUM NUMBER
OF SHARES THAT
MAY YET BE
PURCHASED
UNDER THE PLANS
OR PROGRAMS
|
||||
|
October 3, 2010 - October 30, 2010
|
-
|
-
|
-
|
460,434
|
|||
|
October 31, 2010 - November 27, 2010
|
21,302
|
$6.12
|
21,302
|
439,132
|
|||
|
November 28, 2010 - January 1, 2011
|
8,398
|
$7.04
|
8,398
|
430,734
|
|||
|
Total
|
29,700
|
$6.38
|
29,700
|
||||
In 2008, the Company's Board of Directors authorized a plan to purchase up to 1.0 million shares of Cross Class A common stock, depending on market conditions. Cumulatively, through the fourth quarter of 2010, the Company purchased approximately 0.6 million shares of stock under this plan for approximately $1.9 million at an average price per share of $3.41. In 2010, the Company purchased a total of approximately 0.2 million shares under this plan for approximately $0.8 million at an average price per share of $5.13. Included in these amounts were approximately 0.1 million shares purchased for approximately $0.6 million, or $4.75 per share, from Galal Doss, a Director of the Company at that time. Also in 2010, the Company's Board of Directors approved and the Company executed a transaction to purchase 1.25 million shares of the Company's Class A common stock for approximately $5.0 million, or $4.03 per share, from Galal Doss. In 2010, the Company purchased a total of approximately 1.4 million shares under both plans for approximately $5.9 million at an average price of $4.16.
|
Item 6
|
SELECTED FINANCIAL DATA
|
Five-Year Summary
|
2010
|
2009
|
2008*
|
2007
|
2006
|
|||||||
|
OPERATIONS: (THOUSANDS OF DOLLARS)
|
|||||||||||
|
Net Sales
|
$158,312
|
$141,764
|
$160,146
|
$151,885
|
$139,336
|
||||||
|
Operating Income
|
9,324
|
1,300
|
3,551
|
4,799
|
4,799
|
||||||
|
Net Income
|
6,373
|
1,855
|
494
|
3,287
|
3,287
|
||||||
|
PER SHARE DATA: (DOLLARS)
|
|||||||||||
|
Net Income Per Share
|
Basic
|
0.50
|
0.13
|
0.03
|
0.45
|
0.22
|
|||||
|
Diluted
|
0.49
|
0.13
|
0.03
|
0.43
|
0.22
|
||||||
|
FINANCIAL POSITION: (THOUSANDS OF DOLLARS)
|
|||||||||||
|
Total Assets
|
144,626
|
138,419
|
143,959
|
129,037
|
119,446
|
||||||
|
Long-Term Retirement Plan Obligations
|
16,274
|
14,726
|
14,681
|
5,067
|
7,779
|
||||||
|
Long-Term Debt, Less Current Maturities
|
19,221
|
19,721
|
21,721
|
-
|
7,100
|
||||||
|
Other Long-Term Liabilities
|
2,111
|
2,672
|
4,447
|
4,106
|
1,308
|
||||||
|
Shareholders' Equity
|
72,465
|
71,450
|
73,661
|
83,215
|
72,963
|
||||||
* Included in 2008 is a $3.9 million charge to operating income and net income for an impairment of goodwill.
8
|
Item 7
|
MANAGEMENT'S DISCUSSION AND ANALYSIS OF FINANCIAL CONDITION AND RESULTS OF OPERATIONS
|
Results of Operations
Overview
A.T. Cross Company is a designer and marketer of branded personal accessories including writing instruments, reading glasses, personal and business accessories and sunglasses.
The Company has been operating in a difficult economic environment in mature as well as competitive categories. The Company has challenged itself to build upon its unique attributes in order to develop a vibrant, diversified and forward-looking company poised for sustainable growth and long-term profit. Such attributes include: strong brand names, an over 160 year heritage, a reputation for quality and craftsmanship, a global distribution network, and a strong balance sheet. The Company established several strategic initiatives to build upon these attributes and overcome its challenges, including: becoming an innovative leader in the fine writing category, extending the Cross brand into new categories, developing avenues for diversification, streamlining its CAD operating structure and seeking additional brand assets to add scale. COG has provided the business with an avenue of diversification and added two new brands to the Company’s portfolio: Costa and Native. These brands uphold the Company’s reputation as an innovative leader with award-winning high-quality products. Details on how the Company's two business segments are achieving these initiatives are presented below. The Company continues to look for appropriate acquisitions that will add to top and bottom line growth.
Cross Accessory Division (“CAD”)
The Company has been a manufacturer and marketer of fine quality writing instruments since 1846. Sold primarily under the Cross brand, ball-point, fountain and selectip rolling ball pens and mechanical pencils are offered in a variety of styles and finishes. Cross also manufactures and markets a line of FranklinCovey entry level price point refillable writing instruments. Also under the Cross brand, CAD offers a variety of personal and business accessories including leather goods, reading glasses, watches, desk sets, cufflinks and stationery.
CAD is competing vigorously to build its position in terms of product innovation, marketing and merchandising. To this end, a number of initiatives, many of which are described below, have been implemented. In 2010, approximately 14% of CAD revenue was derived from new products launched into the marketplace. In 2010, CAD launched three new writing instrument product lines: Torero, Cross Advantage and Cross Edge as well as Cross Switch-it, the new pen to pencil converter. Several new finishes were also added to Sauvage and Parasol collections. The Company also launched Cross Beverly, Cross Tremont, Cross Sydney, Cross Windsor, and Cross Detroit lines for its office superstore customers for the 2010 holiday season.
In 2010, all leather goods, reading glasses, watches, desk sets, cufflinks and stationery represented approximately 7% of CAD sales. We expanded our line of leather accessories by introducing new collection, Legacy and fashionable colors in select Autocross styles. The Company's stationery collection expanded in 2010 with the addition of several new styles and colors.
In addition to bringing new products to market in 2010, Cross rolled out a new global self-serve program. The Company rolled out over 500 new fixtures featuring a range of reading glasses, stationery and pens.
The Cross brand has strong consumer awareness and, more importantly, consumers associate the Cross name with innovation, quality and style. The strong awareness of our name and the positive attributes associated with our brand support the extension of the Cross brand into related personal accessory categories. CAD has moved into categories that allow us to further utilize our existing sourcing infrastructure and global distribution network. A priority for all of our brand extensions is to incorporate the quality, design and craftsmanship that consumers enjoy from Cross' fine writing instruments. We have developed a foothold in these categories and look forward to further strengthening our presence in select categories in 2011.
Cross Optical Group (“COG”)
The Company's COG segment consists of its wholly-owned subsidiary Cross Optical Group, Inc. This business designs, manufactures and markets high-quality, high-performance polarized sunglasses under the brand names Costa and Native.
Founded in Florida in 1983, the Costa brand has developed a superior reputation for its advanced polarized lens technology and functional frame design. Costa upholds the Company's commitment to delivering exceptional product, innovation and quality to consumers. Costa's lenses are renowned for their clarity; their patented 580 lens technology is considered by many to be the best performing sunglass lens in the marketplace. Costa has expanded its marketing efforts in order to reach consumers beyond its core market, the saltwater fishing enthusiast in the southeastern United
9
States. The brand is developing consumer awareness in other fishing categories and geographies. Costa's collection features a broad range of styles that appeal to a broad consumer demographic and is expanding geographically in both domestic and international markets. Costa has a long-term commitment to conservation initiatives that protect and sustain vital fisheries.
Native, which was founded in 1994, also specializes in polarized sunglasses. Native sunglasses are feature-rich, packed with technology and are priced from $89 to $139. The collection consists primarily of high-performance sport wraps that are designed for mountain and trail enthusiasts who are active in the “human powered sports” such as biking, running and climbing. Native frames are very light weight and known for their exceptional fit, features sought after by professional athletes and active sport enthusiasts alike.
The creation of the Cross Optical Group has proven to be very successful. As a result, the Company is benefiting from revenue diversification and a substantial contribution to the bottom line. In 2010, the COG segment grew its business 19.0% through new product introductions and expanded distribution.
Comparison of Fiscal 2010 with Fiscal 2009
The following chart details net sales performance by segment and operating unit:
|
(THOUSANDS OF DOLLARS)
|
FISCAL 2010
|
FISCAL 2009
|
PERCENTAGE CHANGE
|
|||
|
CAD
|
$ 97,776
|
$ 90,892
|
7.6%
|
|||
|
COG
|
60,536
|
50,872
|
19.0%
|
|||
|
Consolidated Net Sales
|
$158,312
|
$141,764
|
11.7%
|
|||
Consolidated net sales were $158.3 million in 2010 compared to $141.8 million in 2009. The effect of foreign exchange was unfavorable to consolidated 2010 sales results by approximately $0.1 million, or 0.1 percentage points.
CAD sales benefitted from worldwide economic recovery as every region reported higher sales performance from a year ago. The effect of foreign exchange was unfavorable to CAD 2010 sales results by approximately $0.1 million, or 0.1 percentage point.
COG sales in 2010 were primarily driven by growth of the Costa brand. The increase in Costa sales was due to new product launches aimed to appeal to women and college students, expanded distribution and an increase in revenue from apparel and accessories. Native brand sales also increased from the prior year but at a lower rate.
The following chart details gross profit margins for both segments as well as the consolidated gross profit margins:
|
Gross Profit Margins:
|
FISCAL 2010
|
FISCAL 2009
|
PERCENTAGE POINT CHANGE
|
|||
|
CAD
|
53.9%
|
52.5%
|
1.4
|
|||
|
COG
|
59.1%
|
57.0%
|
2.1
|
|||
|
Consolidated Gross Profit Margin
|
55.9%
|
54.1%
|
1.8
|
|||
Consolidated gross margins improved1.8 percentage points in 2010 compared to 2009. The improvement in CAD gross margin was due to the increased sales volume, the impact of cost reduction programs put in place during 2009 and 2010 and a shift in channel mix. CAD segment gross margin was favorably impacted in 2010 by approximately $0.3 million for the deflation impact on ending inventories accounted for on a LIFO basis. In 2009, there was an approximate $1.2 million favorable impact due to the liquidation of LIFO layers and gross margins were decreased by approximately $0.7 million for the inflation impact on ending inventories accounted for on a LIFO basis. COG segment gross margin was favorably impacted by the implementation of cost reduction projects and shifts to higher priced products.
Consolidated selling, general and administrative (“SG&A”) expenses were approximately $68.8 million, or 7.6% higher than 2009. SG&A expenses were 43.5% of sales in 2010 compared to 45.1% of sales in 2009. SG&A expenses for the CAD segment of approximately $45.7 million were 46.7% of sales compared to $44.9 million, or 49.4% of sales, in 2009. CAD segment administrative expenses were 1.0% lower in 2010 compared to 2009, while selling and marketing expenses increased 3.8%. Foreign currency exchange losses that are included in CAD segment SG&A expenses approximated $1.2 million and $1.8 million in fiscal 2010 and 2009, respectively. COG segment SG&A expenses of $23.1 million, were 21.0% higher than 2009 due to higher selling and marketing expenses related to the sales volume increase.
Research and development (“R&D”) expenses were approximately $2.8 million in 2010 and 2009. R&D expenses were 2.0% of sales in 2010 and 2009.
There were no restructuring charges recorded in the Company's CAD segment in fiscal 2010 compared to $1.9 million of restructuring charges in fiscal 2009. For an analysis of this restructuring program, see Note C to the Company's consolidated financial statements in Item 8 of this Annual Report on Form 10-K.
10
Interest expense was $1.0 million and $1.2 million in 2010 and 2009, respectively. Lower interest expense in 2010 was due to lower interest rates on lower average borrowings.
Other (expense) income was expense of $0.3 million and income of $0.2 million in 2010 and 2009, respectively.
In 2010, the Company's effective tax rate was 21.4% compared to the Federal tax rate of 35.0%. This decrease was due to the effect of income sourced from lower taxed foreign jurisdictions. For fiscal years 2008 through 2010, the Company’s earnings in China were subject to a tax rate of 12.5%, which is half the statutory tax rate. Future earnings in China will be subject to the full statutory rate of 25%. The income tax expense was also favorably impacted by the recognition of $0.2 million of tax benefits, the realization of which was previously considered uncertain. For an analysis of income taxes, see Note J to the Company's consolidated financial statements in Item 8 of this Annual Report on Form 10-K.
As a result of the foregoing, consolidated net income in fiscal 2010 was $6.4 million ($0.50 basic and $0.49 diluted net income per share) compared to fiscal 2009 net income of $1.9 million ($0.13 basic and diluted net income per share).
Comparison of Fiscal 2009 with Fiscal 2008
The following chart details net sales performance by segment and operating unit:
|
(THOUSANDS OF DOLLARS)
|
FISCAL 2009
|
FISCAL 2008
|
PERCENTAGE CHANGE
|
|||
|
CAD
|
$ 90,892
|
$111,455
|
(18.4)%
|
|||
|
COG
|
50,872
|
48,691
|
4.5%
|
|||
|
Consolidated Net Sales
|
$141,764
|
$160,146
|
(11.5)%
|
|||
Consolidated net sales were $141.8 million in 2009 compared to $160.1 million in 2008. The effect of foreign exchange was unfavorable to consolidated 2009 sales results by approximately $1.2 million, or 0.7 percentage points.
CAD sales were affected by worldwide economic problems as every region reported lower sales performance from a year ago. The effect of foreign exchange was unfavorable to CAD 2009 sales results by approximately $1.2 million, or 1.0 percentage point.
COG sales in 2009 were driven by growth of the Costa brand and the inclusion of Native Eyewear. The Costa increase was due to new product launches, aimed to appeal to women and college students, expanded distribution and an increase in repair revenue.
The following chart details gross profit margins for both segments as well as the consolidated gross profit margins:
|
Gross Profit Margins:
|
FISCAL 2009
|
FISCAL 2008
|
PERCENTAGE POINT CHANGE
|
|||
|
CAD
|
52.5%
|
54.3%
|
(1.8)
|
|||
|
COG
|
57.0%
|
59.2%
|
(2.2)
|
|||
|
Consolidated Gross Profit Margin
|
54.1%
|
55.8%
|
(1.7)
|
|||
Consolidated gross margins declined 1.7 percentage points in 2009 compared to 2008. The decline in CAD gross margin was due largely to; the unfavorable effect of foreign exchange, particularly the Euro and British Pound, on revenue for the year, changes in channel and geographic mix compared to 2008 and increased promotional activity. CAD segment gross margins were favorably impacted in 2009 by approximately $1.2 million due to the effect of a liquidation of LIFO layers and were decreased by approximately $0.7 million for the inflation impact on ending inventories accounted for on a LIFO basis. In 2008, there was an approximate $3.7 million favorable impact due to the liquidation of LIFO layers and gross margins were decreased by approximately $1.4 million for the inflation impact on ending inventories accounted for on a LIFO basis. COG segment gross margin were adversely affected by the weaker U.S. Dollar to Japanese Yen exchange rates in 2009 compared to the prior year and sales incentive promotional activities.
Consolidated selling, general and administrative (“SG&A”) expenses were approximately $64.0 million, or 8.3% less than 2008. SG&A expenses were 45.1% of sales in 2009 compared to 43.6% of sales in 2008. SG&A expenses for the CAD segment of approximately $44.9 million were 49.4% of sales compared to $51.9 million, or 46.6% of sales, in 2008. CAD segment administrative expenses remained flat in 2009 compared to 2008, while selling and marketing expenses decreased 22.0%. Foreign currency exchange losses (gains) that are included in CAD segment SG&A expenses approximated $1.8 million and $(1.1) million in fiscal 2009 and 2008, respectively. COG segment SG&A expenses of $19.1 million, were 7.1% higher than 2008 due to higher selling and marketing expenses.
Research and development (“R&D”) expenses were approximately $2.8 million in 2009. R&D expenses were 2.0% and 1.5% of sales in 2009 and 2008, respectively. The higher R&D expenses were related to new product development activities in the COG segment.
11
There were no impairment charges in 2009 compared to a $3.9 million goodwill impairment charge in 2008. In the fourth quarter of its fiscal year, the Company performs its annual goodwill and other indefinite-lived intangible assets impairment test. For an analysis of goodwill and the assumptions used for impairment, see Notes A and E to the Company's consolidated financial statements in Item 8 of this Annual Report on Form 10-K.
Restructuring charges of $1.9 million were recorded in the Company's CAD segment in fiscal 2009 compared to $2.5 million in fiscal 2008. For an analysis of this restructuring program, see Note C to the Company's consolidated financial statements in Item 8 of this Annual Report on Form 10-K.
Interest expense was $1.2 million in 2009 compared to $0.9 million in 2008. The increase was due to the higher average level of borrowings and slightly higher average interest rates.
In 2009, the Company's effective tax benefit was 401.1% compared to the Federal tax rate of 35.0%. This increase was due to the effect of income sourced from lower taxed foreign jurisdictions. The income tax benefit was also favorably impacted by the recognition of $1.4 million of tax benefits, the realization of which was previously considered uncertain. For an analysis of income taxes, see Note J to the Company's consolidated financial statements in Item 8 of this Annual Report on Form 10-K.
As a result of the foregoing, consolidated net income in fiscal 2009 was $1.9 million ($0.13 basic and diluted net income per share) compared to fiscal 2008 net income of $0.5 million ($0.03 basic and diluted net income per share).
Liquidity and Capital Resources
Historically, the Company's sources of liquidity and capital resources have been its cash and cash equivalents (“cash”), short term investments, cash generated from operations and amounts available under the Company's line of credit. These sources have been sufficient in the past to support the Company's routine operating requirements, capital projects, restructuring programs, contributions to the retirement plans, stock repurchase programs and debt service. The Company expects its future cash needs in 2011 will be met by these historical sources of liquidity and capital.
Cash provided by operating activities was $12.8 million for fiscal 2010 reflecting continued positive cash generation from operations. These results reflect management's restructuring and cash management efforts designed to offset the impact of the recession. As a result, the Company was able to fund financing and investing activities described below and end 2010 with a cash and short term investments balance of $19.2 million at January 1, 2011, up $1.5 million from January 2, 2010.
Total inventory was $31.3 million at January 1, 2011, an increase of $6.0 million since January 2, 2010. CAD inventory increased $4.3 million and COG inventory increased $1.7 million. The primary reason for the increase in CAD inventory was strategic build up of stock worldwide in an effort to reduce backorders and airfreight charges in the first quarter of 2011. COG’s increase was due to the number of new products introduced in 2010 and the higher projected first quarter 2011 sales.
Also impacting cash from operating activities in fiscal 2010 was the final payment of $0.8 million for those restructuring programs initiated in 2008 and substantially completed at the end of 2009. The Company paid a total of $3.1 million in restructuring charges related to these programs. As a result of the initial restructuring, approximately 50 manufacturing positions and 27 sales and administrative positions in the United States, and four sales and administrative positions in the United Kingdom were affected. The Company expanded its restructuring efforts in 2009 to further reduce headcount at its Lincoln and European facilities.
The Company made cash contributions in 2010 of approximately $1.3 million to its defined benefit pension plans, $0.7 million to its defined contribution retirement plans and $0.1 million to its excess benefit plan. The Company expects to contribute $6.1 million to its defined benefit pension plans in 2011, $2.1 million to meet minimum required contributions and $4.0 million as an additional voluntary contribution. With this additional voluntary contribution, the Company expects its defined benefit pension plans will be approximately 80% funded by the end of fiscal 2012. The Company expects to contribute $0.8 million to its defined contribution retirement plans and $0.2 million to its excess benefit plan in 2011. Additionally, the Company expects to meet or exceed its minimum funding requirements for its defined benefit plans in future years. The Company anticipates these future funding requirements to be between $1.6 million and $3.3 million per year.
Cash used in investing activities of $0.1 million principally reflects additions to property, plant and equipment of approximately $4.5 million and cash provided by short term investments. In fiscal 2011, the Company expects capital expenditures to be approximately $5.5 million.
Cash used in financing activities for the fiscal 2010 principally reflects the repayment of $0.5 million on the Company's credit facility and the repurchase of treasury shares under the Company's stock buyback program and a specific buyback from a director as described below. In 2008, the Company's Board of Directors authorized a plan to purchase up to 1.0 million shares of Cross Class A common stock, depending on market conditions. Cumulatively,
12
As part of the acquisition of Native Eyewear, the Company assumed the liability of future payments associated with a "settlement in lieu of future royalties." The payments will be $0.2 million each January through 2012.
The Company expects fiscal 2011 research and development expenses to be approximately $2.9 million.
The Company has a $40 million secured line of credit with a bank. Under this agreement, the Company has the option to borrow at various interest rates depending upon the type of borrowings made and the Company's consolidated leverage ratio. At January 1, 2011, the Company had $19.2 million outstanding on this line of credit, bearing interest at a rate of 2.0% and the unused and available portion was $20.8 million. The Company was in compliance with its various debt covenants as of January 1, 2011. The agreement requires the Company to maintain a minimum consolidated tangible net worth, computed at each year end, a maximum level of capital expenditures and a minimum ratio of adjusted EBITDA to required debt service payments over any four-quarter period, each of which is calculated in accordance with the agreement:
|
COVENANT
DESCRIPTION
|
COVENANT
REQUIREMENT
|
CALCULATED COMPANY
VALUE JANUARY 1, 2011
|
||
|
Consolidated Tangible Net Worth
|
Cannot be less than $37.5 million plus 50%
of Net Income for fiscal years after 2010 |
$48 million
|
||
|
Capital Expenditures
|
Cannot exceed the greater of $10 million
in a year or $10 million plus prior year expenditures less the $10 million cap |
$5 million
|
||
|
Consolidated Leverage Ratio
|
Cannot exceed 2.75 to 1
|
1.0:1
|
The Company believes that existing cash and cash provided by operations, supplemented as appropriate by the Company's borrowing arrangements, will be adequate to finance its foreseeable operating and capital requirements, the stock repurchase plans and contributions to the retirement plans. Should operating cash flows in 2011 not materialize as projected, the Company has a number of planned alternatives to ensure that it will have sufficient cash to meet its operating needs. These alternatives include implementation of strict cost controls on discretionary spending and delaying non-critical research and development, capital projects and completion of the stock repurchase plan.
At the end of fiscal 2010, cash available for domestic operations was approximately $13.3 million and cash available for international operations was approximately $5.9 million.
Contractual Obligations and Commercial Commitments
Interest rate swap agreements effectively fix the interest rate on a portion of the Company's line of credit at 3.64%.
The Company leases manufacturing, office and warehouse space and certain equipment under non-cancelable operating leases. All leases expire prior to the end of 2017. Future minimum lease payments under all non-cancelable leases, including renewal options the Company believes it will exercise, and other contractual obligations at January 1, 2011 were approximately:
|
(THOUSANDS OF DOLLARS)
|
TOTAL
|
LESS THAN 1 YEAR
|
1 TO 3 YEARS
|
3 TO 5 YEARS
|
MORE THAN 5 YEARS
|
||||||
|
Line of Credit, Including Interest *
|
$20,234
|
$ -
|
$20,234
|
$ -
|
$ -
|
||||||
|
Operating Leases
|
17,262
|
3,114
|
8,008
|
4,822
|
1,318
|
||||||
|
Uncertain Tax Liabilities
|
487
|
113
|
162
|
152
|
60
|
||||||
|
Pension Plan Obligations **
|
21,941
|
6,100
|
9,411
|
3,671
|
2,759
|
||||||
|
Legal Obligations ***
|
400
|
200
|
200
|
-
|
-
|
||||||
|
Purchase Obligations
|
3,828
|
2,585
|
1,243
|
-
|
-
|
||||||
|
Total
|
$64,152
|
$12,112
|
$39,258
|
$8,645
|
$4,137
|
||||||
|
*
|
Interest on the line of credit was calculated using the interest rate as of January 1, 2011 over the remaining life of the note.
|
||||||||||
13
|
**
|
The Company expects to meet or exceed its minimum funding requirements for its defined benefit retirement plans in future years. Though there is uncertainty as to the exact amount and timing of these payments, the Company anticipates the future funding requirements to be between $1.6 million and $3.3 million per year.
|
|
***
|
As part of the acquisition of Native Eyewear, the Company assumed the liability of future payments associated with a "settlement in lieu of future royalties."
|
Off Balance Sheet Arrangements
The Company has no material off balance sheet arrangements.
Impact of Inflation and Changing Prices
The Company's two operating segments are subject to the effects of general inflation as well as fluctuations in foreign currencies. Policies and programs are in place to manage the potential risks in these areas. The Company has generally been successful in controlling cost increases due to general inflation. The Company continues to review its suppliers in order to obtain lower costs and higher quality on many of its raw materials and purchased components.
The Company typically enters into foreign currency exchange contracts to economically hedge that portion of its net financial position exposed to foreign currency fluctuations.
Critical Accounting Policies and Estimates
Management's discussion and analysis of financial condition, results of operations and cash flows are based upon our consolidated financial statements, which have been prepared in accordance with generally accepted accounting principles in the United States. The preparation of these financial statements requires us to make estimates and judgments that affect the reported amounts of assets, liabilities, revenues and expenses, as well as related disclosures of contingent liabilities. We evaluate our policies and estimates on an ongoing basis, including those related to tax contingencies, inventory adjustments, warranty reserves, retirement obligations, impairment of assets and revenue recognition. Management bases its estimates on historical experience and various other assumptions that are believed to be reasonable under the circumstances, the results of which form the basis for making judgments about the carrying values of assets and liabilities that are not readily apparent from other sources. Actual results may differ from these estimates under different assumptions or conditions.
We have identified the following policies as critical to an understanding of our results of operations and financial condition. This is not a comprehensive list of our accounting policies. In many cases, the accounting treatment of a particular transaction is specifically dictated by generally accepted accounting principles, with no need for management's judgment in its application. There are also areas in which management's judgment in selecting any available alternative would not produce a materially different result. For further discussion of our accounting policies, see Note A “Significant Accounting Policies” to the Company's consolidated financial statements in Item 8 of this Annual Report on Form 10-K.
Inventory Methods and Realizable Value. Our global inventories are carried at the lower of cost or market, which requires us to estimate adjustments for both obsolescence and the market value we can expect to receive for our on hand inventory. Domestic CAD segment inventories accounted for on a LIFO basis represent approximately 11% of total inventories. As a result, domestic CAD finished goods inventories are carried significantly below their current cost and they can typically be realized at selling prices above their carrying value. Because we are required to produce our product with sufficient lead time to satisfy global distribution and expected demand during seasonal peak periods, we are subject to the risks of consumer acceptance of the products we have produced. We assess our need for obsolescence adjustments based on a variety of factors including historical demand, future marketing plans and alternative uses for raw material and work-in-process.
Warranty Reserves. CAD's Cross-branded writing instruments are sold with a full warranty of unlimited duration against mechanical failure. Costa and Native sunglasses are sold with a lifetime warranty against defects in materials and workmanship. In establishing the accrual for warranty costs, management analyzes trends of several factors, measured over a period of several years that impact the Company's cost to service the warranties. The most significant factors include: the operating costs of the service department, unit sales, the number of units that are returned for warranty repair and the cost of product repairs. The estimates affecting the warranty reserve are updated annually.
14
Retirement Obligations. Two critical assumptions, the discount rate and the expected return on plan assets, are important elements of pension expense and liability measurement. We evaluate these critical assumptions annually. Other assumptions involve demographic factors such as retirement, mortality, turnover and rate of compensation increases. The discount rate enables us to state expected future cash flow as a present value on the measurement date. The guideline for setting this rate is a high-quality long-term corporate bond rate. A lower discount rate increases the present value of benefit obligations and increases pension expense. We decreased our discount rates to 5.36% in 2010 from 5.88% in 2009 on domestic plans and to 5.15% in 2010 from 5.9% in 2009 on foreign plans, to reflect market interest rate conditions. To determine the expected long-term rate of return on the plan assets, we consider the current and expected asset allocation, as well as historical and expected returns on each plan asset class. A lower expected rate of return on pension plan assets will increase pension expense. Our long-term expected return on plan assets was 7.8% in 2010 and 2009 for domestic plans, and 3.5% in 2010 and 4.0% in 2009 for foreign plans. A 25 basis point change in our rate of return would increase or decrease the net periodic benefit or cost by approximately $0.1 million, which would ultimately have a corresponding effect on the projected funding requirements.
Impairment Analysis. Goodwill and other indefinite-lived intangible assets are not amortized but subject to annual impairment tests; more frequently if events or circumstances occur that would indicate a potential decline in their fair value. The Company performs the assessment annually during the fourth quarter and on an interim basis if potential impairment indicators arise. The Company has identified two reporting units, consisting of the CAD and COG segments. The Company determined the fair value of the reporting unit's goodwill using established income and market valuation approaches and the fair value of its trade names using a forward-looking relief from royalty model. All goodwill and indefinite-lived intangibles relate to the COG segment and were estimated to be recoverable as of January 1, 2011.
The Company determined the fair values of its reporting unit's goodwill by preparing a discounted cash flow analysis using updated forward-looking projections of the unit's future operating results and by comparing the value of the reporting unit to the implied market value of selected peers of the reporting unit. The significant assumptions used in the discounted cash flow analysis include: net income, the discount rate used to present value future cash flows, working capital requirements, and terminal growth rates. Net income assumptions include sales growth, gross margin, and SG&A growth assumptions. The discount rate used is a cost of equity method, which is essentially equal to the “market participant” weighted-average cost of capital (“WACC”). The Company determined the fair values of its trade names using a forward-looking relief from royalty model. The significant assumptions used in the forward-looking relief from royalty method include: revenue growth, royalty rates and the discount rate. The COG reporting unit's fair value substantially exceeded its carrying value by over 150% on both the income and market approaches, and the trade names fair values substantially exceeded their carrying values by at least 60%. The Company performed a sensitivity analysis on our significant assumptions and has determined that a reasonable, negative change in its assumptions, as follows, would not impact our conclusion: reduce net income by 10%, reduce projected revenue growth by 10%, reduce projected royalty rate by 10%, increase the WACC by 100 basis points, or reduce terminal sales growth rate by 20%.
Revenue Recognition. Revenue recognition requires estimates of product returns, term discounts and rebates at the time revenue is recognized. These estimates are based on customer communication and historical experience. Should these estimates change, there could be a material effect on revenue recognized.
For additional information regarding management's estimates, see “Risk Factors” in Item 1A of this Annual Report on Form 10-K and “Forward-Looking Statements” below.
Forward-Looking Statements
This Annual Report on Form 10-K includes forward-looking statements within the meaning of Section 27A of the Securities Act of 1933 and Section 21E of the Securities Exchange Act of 1934. The words “anticipate,” “believe,” “could,” “should,” “propose,” “continue,” “estimate,” “expect,” “intend,” “may,” “plan,” “predict,” “project,” “will” and similar terms and phrases are used in this Annual Report on Form 10-K to identify forward-looking statements, including but not limited to statements related to the introduction of new products; CAD's direct to consumer initiative; the performance of Cross branded writing instrument products; the Company's plans to identify acquisition targets; the availability of necessary raw materials and manufacturing technologies; the planned geographic and demographic expansion of Costa and Native; anticipated compliance with laws and regulations (including but not limited to environmental laws); and anticipated sufficiency of available working capital. These statements relate to analyses and
15
These forward-looking statements are made based on management's expectations and beliefs concerning future events affecting the Company and are subject to uncertainties and factors relating to the Company's operations and business environment, all of which are difficult to predict and many of which are beyond our control. These uncertainties and factors could cause our actual results to differ materially from those matters expressed in or implied by these forward-looking statements. For a discussion of risks and uncertainties associated with these forward-looking statements, see “Risk Factors” in Item 1A of this Annual Report on Form 10-K.
Forward-looking statements speak only as of the date the statements are made. You should not put undue reliance on any forward-looking statements. The Company assumes no obligation to update forward-looking statements to reflect actual results, changes in assumptions or changes in other factors affecting forward-looking information, except to the extent required by applicable securities laws. If the Company does update one or more forward-looking statements, no inference should be drawn that we will make additional updates with respect to those or other forward-looking statements. Additional information concerning these and other risks and uncertainties is contained in our other periodic filings with the SEC.
|
Item 7A
|
QUANTITATIVE AND QUALITATIVE DISCLOSURES ABOUT MARKET RISK
|
Current economic conditions and market disruptions may adversely affect the Company's business and results of operations. Financial markets throughout the world have been experiencing extreme disruption in recent months, including, among other things, volatility in security prices, diminished liquidity and credit availability, rating downgrades and declining valuations of certain investments, failure and potential failures of major financial institutions and unprecedented government support of financial institutions. These developments and the related general economic downturn may adversely impact the Company's business and financial condition in a number of ways, including impacts beyond those typically associated with other recent downturns in the U.S. and foreign economies. The current tightening of credit in financial markets and the general economic downturn may adversely affect the ability of Cross' customers, suppliers, and channel partners (e.g., distributors) to obtain financing for purchases and operations. The tightening could result in a decrease in demand for the Company's products, negatively impact Cross' ability to collect its accounts receivable on a timely basis, result in additional reserves for uncollectible accounts receivable being required, and in the event of a contraction in Cross' sales, could require additional reserves for inventory obsolescence.
Foreign currency exchange rates and fluctuations in those rates may affect the Company's ability to realize projected growth rates in its sales and earnings. The Company derives approximately 43% of its revenues from outside the United States. The Company's ability to realize projected growth rates in sales and earnings could be adversely affected if the U.S. dollar strengthens significantly against foreign currencies. The Company's foreign exchange exposure is generated primarily from its international operating subsidiaries. The Company seeks to minimize the impact of foreign currency fluctuations by hedging certain foreign currency denominated balance sheet positions with foreign currency forward exchange contracts. Most of these contracts are short-term, generally expire in one to three months and a 5% change in exchange rates would not subject the Company to material market risk. Although the Company has programs in place to manage foreign currency exchange risk on certain foreign currency denominated balance sheet positions, and on a portion of certain foreign currency denominated cash flows, significant volatility and fluctuations in the rates of exchange for the U.S. dollar against currencies such as the Euro, the British Pound and the Japanese Yen could adversely affect the Company's financial position and results of operations.
The Company maintains a $40 million secured line of credit with a bank. Under this agreement, the Company has the option to borrow at various interest rates depending upon the type of borrowings made and the Company's consolidated leverage ratio. The Company believes that changes in interest rates would not be material to its operations, due to its anticipated level of borrowings. There was $19.2 million and $19.7 million outstanding under the Company's line of credit at January 1, 2011 and January 2, 2010, respectively.
The Company entered into interest rate swap agreements that effectively fix the interest rate on a portion of its line of credit at 3.64% per annum. At January 1, 2011, the notional value of the interest rate swap was $15.0 million.
16
|
Item 8
|
FINANCIAL STATEMENTS AND SUPPLEMENTARY DATA
|
INDEX
|
PAGE
|
|||
|
Report of Independent Registered Public Accounting Firm ------------------------------------------------------------------
|
18
|
||
|
Consolidated Financial Statements of the A.T. Cross Company:
|
|||
|
Consolidated Balance Sheets as of January 1, 2011 and January 2, 2010 --------------------------------------------
|
19
|
||
|
Consolidated Statements of Income for the Years Ended
|
|||
|
January 1, 2011, January 2, 2010 and January 3, 2009 ---------------------------------------------------------------
|
20
|
||
|
Consolidated Statements of Comprehensive Income (Loss) for the Years Ended
|
|||
|
January 1, 2011, January 2, 2010 and January 3, 2009 ---------------------------------------------------------------
|
20
|
||
|
Consolidated Statements of Changes in Shareholders' Equity for the Years Ended
|
|||
|
January 1, 2011, January 2, 2010 and January 3, 2009 --------------------------------------------------------------
|
21
|
||
|
Consolidated Statements of Cash Flows for the Years Ended
|
|||
|
January 1, 2011, January 2, 2010 and January 3, 2009 ---------------------------------------------------------------
|
22
|
||
|
Notes to Consolidated Financial Statements --------------------------------------------------------------------------------
|
23 - 40
|
||
17
REPORT OF INDEPENDENT REGISTERED PUBLIC ACCOUNTING FIRM
To the Board of Directors and Shareholders of
A.T. Cross Company
Lincoln, Rhode Island
We have audited the accompanying consolidated balance sheets of A.T. Cross Company and subsidiaries (the “Company”) as of January 1, 2011 and January 2, 2010, and the related consolidated statements of income, comprehensive income (loss), shareholders' equity, and cash flows for each of the three years in the period ended January 1, 2011. These financial statements are the responsibility of the Company's management. Our responsibility is to express an opinion on these financial statements based on our audits.
We conducted our audits in accordance with the standards of the Public Company Accounting Oversight Board (United States). Those standards require that we plan and perform the audit to obtain reasonable assurance about whether the financial statements are free of material misstatement. The Company is not required to have, nor were we engaged to perform, an audit of its internal control over financial reporting. Our audits included consideration of internal control over financial reporting as a basis for designing audit procedures that are appropriate in the circumstances, but not for the purpose of expressing an opinion on the effectiveness of the Company's internal control over financial reporting. Accordingly, we express no such opinion. An audit also includes examining, on a test basis, evidence supporting the amounts and disclosures in the financial statements, assessing the accounting principles used and significant estimates made by management, as well as evaluating the overall financial statement presentation. We believe that our audits provide a reasonable basis for our opinion.
In our opinion, such consolidated financial statements present fairly, in all material respects, the financial position of the Company as of January 1, 2011 and January 2, 2010, and the results of its operations and its cash flows for each of the three years in the period ended January 1, 2011, in conformity with accounting principles generally accepted in the United States of America.

DELOITTE & TOUCHE LLP
Boston, Massachusetts
March 15, 2011
18
CONSOLIDATED BALANCE SHEETS
A.T. CROSS COMPANY & SUBSIDIARIES
|
(THOUSANDS OF DOLLARS AND SHARES)
|
JANUARY 1, 2011
|
JANUARY 2, 2010
|
|
|
ASSETS
|
|||
|
Current Assets
|
|||
|
Cash and cash equivalents
|
$16,650
|
$10,443
|
|
|
Short-term investments
|
2,514
|
7,217
|
|
|
Accounts receivable, net
|
29,562
|
29,546
|
|
|
Inventories
|
31,320
|
25,329
|
|
|
Deferred income taxes
|
5,590
|
5,092
|
|
|
Other current assets
|
4,883
|
5,895
|
|
|
Total Current Assets
|
90,519
|
83,522
|
|
|
Property, Plant and Equipment, Net
|
15,082
|
15,953
|
|
|
Goodwill
|
15,279
|
15,279
|
|
|
Intangibles, Net
|
9,458
|
10,383
|
|
|
Deferred Income Taxes
|
11,318
|
11,778
|
|
|
Other Assets
|
2,970
|
1,504
|
|
|
Total Assets
|
$144,626
|
$138,419
|
|
|
LIABILITIES AND SHAREHOLDERS' EQUITY
|
|||
|
Current Liabilities
|
|||
|
Accounts payable
|
$7,693
|
$6,382
|
|
|
Accrued compensation and related taxes
|
7,811
|
5,504
|
|
|
Accrued expenses and other liabilities
|
11,871
|
10,979
|
|
|
Retirement plan obligations
|
2,437
|
2,378
|
|
|
Restructuring liabilities
|
-
|
771
|
|
|
Income taxes payable
|
2,006
|
577
|
|
|
Total Current Liabilities
|
31,818
|
26,591
|
|
|
Long-Term Debt
|
19,221
|
19,721
|
|
|
Retirement Plan Obligations
|
16,274
|
14,726
|
|
|
Deferred Gain on Sale of Real Estate
|
2,737
|
3,259
|
|
|
Other Long-Term Liabilities
|
687
|
1,231
|
|
|
Accrued Warranty Costs
|
1,424
|
1,441
|
|
|
Commitments and Contingencies (Note L)
|
-
|
-
|
|
|
Total Liabilities
|
72,161
|
66,969
|
|
|
Shareholders' Equity
|
|||
|
Common stock, par value $1 per share:
|
|||
|
Class A - authorized 40,000 shares, 18,439 shares issued and
|
|||
|
11,115 shares outstanding at January 1, 2011, and 17,660
|
|||
|
shares issued and 11,854 shares outstanding at January 2, 2010
|
18,439
|
17,660
|
|
|
Class B - authorized 4,000 shares, 1,805 shares issued and
|
|||
|
outstanding at January 1, 2011 and January 2, 2010
|
1,805
|
1,805
|
|
|
Additional paid-in capital
|
26,014
|
23,574
|
|
|
Retained earnings
|
81,114
|
74,741
|
|
|
Accumulated other comprehensive loss
|
(12,659)
|
(10,998)
|
|
|
Treasury stock, at cost, 7,324 shares in 2010 and 5,806 shares in 2009
|
(42,248)
|
(35,332)
|
|
|
Total Shareholders' Equity
|
72,465
|
71,450
|
|
|
Total Liabilities and Shareholders' Equity
|
$144,626
|
$138,419
|
See notes to consolidated financial statements.
19
CONSOLIDATED STATEMENTS OF INCOME
A.T. CROSS COMPANY & SUBSIDIARIES
|
(THOUSANDS OF DOLLARS AND SHARES,
|
YEARS ENDED
|
||||
|
EXCEPT PER SHARE AMOUNTS)
|
JANUARY 1, 2011
|
JANUARY 2, 2010
|
JANUARY 3, 2009
|
||
|
Net sales
|
$158,312
|
$141,764
|
$160,146
|
||
|
Cost of goods sold
|
69,836
|
65,046
|
70,834
|
||
|
Gross Profit
|
88,476
|
76,718
|
89,312
|
||
|
Selling, general and administrative expenses
|
68,817
|
63,978
|
69,793
|
||
|
Service and distribution costs
|
7,524
|
6,763
|
7,054
|
||
|
Research and development expenses
|
2,811
|
2,817
|
2,444
|
||
|
Goodwill impairment charge
|
-
|
-
|
3,944
|
||
|
Restructuring charges
|
-
|
1,860
|
2,526
|
||
|
Operating Income
|
9,324
|
1,300
|
3,551
|
||
|
Interest income
|
25
|
41
|
96
|
||
|
Interest expense
|
(975)
|
(1,166)
|
(941)
|
||
|
Other (expense) income
|
(270)
|
195
|
63
|
||
|
Interest and Other (Expense) Income
|
(1,220)
|
(930)
|
(782)
|
||
|
Income Before Income Taxes
|
8,104
|
370
|
2,769
|
||
|
Income tax provision (benefit)
|
1,731
|
(1,485)
|
2,275
|
||
|
Net Income
|
$6,373
|
$1,855
|
$494
|
||
|
Net Income Per Share:
|
|||||
|
Basic
|
$0.50
|
$0.13
|
$0.03
|
||
|
Diluted
|
$0.49
|
$0.13
|
$0.03
|
||
|
Weighted Average Shares Outstanding:
|
|||||
|
Denominator for Basic Net Income Per Share
|
12,686
|
14,772
|
14,987
|
||
|
Effect of dilutive securities
|
379
|
10
|
341
|
||
|
Denominator for Diluted Net Income Per Share
|
13,065
|
14,782
|
15,328
|
A.T. CROSS COMPANY & SUBSIDIARIES
|
(THOUSANDS OF DOLLARS)
|
YEARS ENDED
|
||||
|
JANUARY 1, 2011
|
JANUARY 2, 2010
|
JANUARY 3, 2009
|
|||
|
Net Income
|
$6,373
|
$1,855
|
$494
|
||
|
Other Comprehensive Income (Loss):
|
|||||
|
Foreign currency translation adjustments
|
(302)
|
716
|
(2,234)
|
||
|
Unrealized gain (loss) on interest rate swap, net of tax
|
|||||
|
(provision) benefit of $(125), ($87) and $275
|
232
|
161
|
(512)
|
||
|
Pension liability adjustment, net of tax benefit
|
|||||
|
(provision) of $877, ($152) and $3,879
|
(1,591)
|
81
|
(7,205)
|
||
|
Comprehensive Income (Loss)
|
$4,712
|
$2,813
|
$(9,457)
|
||
See notes to consolidated financial statements.
20
CONSOLIDATED STATEMENTS OF CHANGES IN SHAREHOLDERS' EQUITY
A.T. CROSS COMPANY & SUBSIDIARIES
|
COMMON STOCK
|
TOTAL
|
|||||||
|
SHARES & DOLLAR AMOUNT
|
ADDITIONAL
|
OTHER
|
SHARE-
|
|||||
|
AT $1 PAR VALUE
|
PAID-IN
|
RETAINED
|
COMPREHEN-
|
TREASURY STOCK
|
HOLDERS'
|
|||
|
CLASS A
|
CLASS B
|
CAPITAL
|
EARNINGS
|
SIVE LOSS
|
SHARES
|
AMOUNT
|
EQUITY
|
|
|
Balances at December 29, 2007
|
$17,135
|
$1,805
|
$20,202
|
$72,392
|
$(2,005)
|
3,400
|
$(26,314)
|
$83,215
|
|
Purchase of treasury stock
|
361
|
(1,529)
|
(1,529)
|
|||||
|
Grant of restricted stock for future services
|
446
|
(446)
|
-
|
|||||
|
Cancellation of restricted stock
|
271
|
54
|
(271)
|
-
|
||||
|
Tax benefit from stock-based awards
|
1
|
1
|
||||||
|
Stock purchase plan
|
3
|
19
|
22
|
|||||
|
Non-cash stock-based directors' fees
|
25
|
141
|
166
|
|||||
|
Amortization of stock-based compensation
|
1,224
|
1,224
|
||||||
|
Stock option expense
|
19
|
19
|
||||||
|
Foreign currency translation adjustments
|
(2,234)
|
(2,234)
|
||||||
|
Pension liability adjustment
|
(7,205)
|
(7,205)
|
||||||
|
Unrealized loss on interest rate swap
|
(512)
|
(512)
|
||||||
|
Net Income
|
494
|
494
|
||||||
|
Balances at January 3, 2009
|
$17,609
|
$1,805
|
$21,431
|
$72,886
|
$(11,956)
|
3,815
|
$(28,114)
|
$73,661
|
|
Purchase of treasury stock
|
273
|
(678)
|
(678)
|
|||||
|
Purchase of treasury stock from related party
|
1,500
|
(5,182)
|
(5,182)
|
|||||
|
Cancellation of restricted stock
|
1,358
|
218
|
(1,358)
|
-
|
||||
|
Tax provision on stock-based awards
|
(139)
|
(139)
|
||||||
|
Stock purchase plan
|
5
|
11
|
16
|
|||||
|
Non-cash stock-based directors' fees
|
46
|
102
|
148
|
|||||
|
Amortization of stock-based compensation
|
548
|
548
|
||||||
|
Stock option expense
|
263
|
263
|
||||||
|
Foreign currency translation adjustments
|
716
|
716
|
||||||
|
Pension liability adjustment
|
81
|
81
|
||||||
|
Unrealized gain on interest rate swap
|
161
|
161
|
||||||
|
Net Income
|
1,855
|
1,855
|
||||||
|
Balances at January 2, 2010
|
$17,660
|
$1,805
|
$23,574
|
$74,741
|
$(10,998)
|
5,806
|
$(35,332)
|
$71,450
|
|
Purchase of treasury stock
|
43
|
(267)
|
(267)
|
|||||
|
Purchase of treasury stock from related party
|
1,371
|
(5,612)
|
(5,612)
|
|||||
|
Grant of restricted stock for future services
|
725
|
(725)
|
-
|
|||||
|
Cancellation of restricted stock
|
1,037
|
104
|
(1,037)
|
-
|
||||
|
Stock option activity, net of settlements
|
18
|
(94)
|
(76)
|
|||||
|
Tax provision on stock-based awards
|
70
|
70
|
||||||
|
Stock purchase plan
|
4
|
15
|
19
|
|||||
|
Non-cash stock-based directors' fees
|
32
|
121
|
153
|
|||||
|
Amortization of stock-based compensation
|
1,077
|
1,077
|
||||||
|
Stock option expense
|
939
|
939
|
||||||
|
Foreign currency translation adjustments
|
-
|
(302)
|
(302)
|
|||||
|
Pension liability adjustment
|
(1,591)
|
(1,591)
|
||||||
|
Unrealized gain on interest rate swap
|
232
|
232
|
||||||
|
Net Income
|
6,373
|
6,373
|
||||||
|
Balances at January 1, 2011
|
$18,439
|
$1,805
|
$26,014
|
$81,114
|
$(12,659)
|
7,324
|
$(42,248)
|
$72,465
|
See notes to consolidated financial statements.
21
CONSOLIDATED STATEMENTS OF CASH FLOWS
A.T. CROSS COMPANY & SUBSIDIARIES
|
(THOUSANDS OF DOLLARS)
|
YEARS ENDED
|
||||
|
CASH PROVIDED BY (USED IN):
|
JANUARY 1, 2011
|
JANUARY 2, 2010
|
JANUARY 3, 2009
|
||
|
Operating Activities:
|
|||||
|
Net Income
|
$6,373
|
$1,855
|
$494
|
||
|
Adjustments to reconcile net income to net cash
|
|||||
|
provided by operating activities:
|
|||||
|
Depreciation
|
5,404
|
4,841
|
4,851
|
||
|
Amortization
|
1,211
|
1,032
|
930
|
||
|
Goodwill impairment charge
|
-
|
-
|
3,944
|
||
|
Restructuring charges
|
-
|
1,860
|
2,526
|
||
|
Restructuring charges paid
|
(771)
|
(1,926)
|
(446)
|
||
|
Amortization of deferred gain
|
(522)
|
(521)
|
(521)
|
||
|
Provision for bad debts
|
139
|
691
|
226
|
||
|
Deferred income taxes
|
590
|
(1,458)
|
1,770
|
||
|
Provision for accrued warranty costs
|
797
|
705
|
820
|
||
|
Warranty costs paid
|
(735)
|
(592)
|
(754)
|
||
|
Stock-based compensation and directors' fees
|
2,170
|
820
|
1,390
|
||
|
Excess tax provision (benefit) from stock-based awards
|
70
|
139
|
(1)
|
||
|
Unrealized (gain) loss on short-term investments
|
(29)
|
268
|
(111)
|
||
|
Unrealized loss (gain) on foreign exchange contracts
|
154
|
(503)
|
(306)
|
||
|
(Decrease) increase in non-income based tax reserves
|
(193)
|
(338)
|
83
|
||
|
Unrealized foreign currency transaction loss (gain)
|
84
|
(73)
|
209
|
||
|
Changes in operating assets and liabilities:
|
|||||
|
Accounts receivable
|
1
|
151
|
(252)
|
||
|
Inventories
|
(6,034)
|
1,659
|
6,213
|
||
|
Other assets
|
(438)
|
3,633
|
(1,468)
|
||
|
Accounts payable
|
1,317
|
1,380
|
(3,361)
|
||
|
Other liabilities
|
3,208
|
(2,101)
|
(1,983)
|
||
|
Net Cash Provided by Operating Activities
|
12,796
|
11,522
|
14,253
|
||
|
Investing Activities:
|
|||||
|
Acquisition of Native Eyewear, Inc., net of cash acquired
|
-
|
(481)
|
(18,535)
|
||
|
Purchases of short-term investments
|
(17,040)
|
(40,192)
|
(2,332)
|
||
|
Sales of short-term investments
|
21,772
|
33,900
|
1,250
|
||
|
Additions to property, plant and equipment
|
(4,533)
|
(5,149)
|
(4,543)
|
||
|
Additions to trademarks and patents
|
(286)
|
(288)
|
(298)
|
||
|
Net Cash Used in Investing Activities
|
(87)
|
(12,210)
|
(24,458)
|
||
|
Financing Activities:
|
|||||
|
Excess tax (provision) benefit from stock-based awards
|
(70)
|
(139)
|
1
|
||
|
Borrowing on long-term debt agreement
|
5,860
|
-
|
22,471
|
||
|
Repayment of long-term debt
|
(6,360)
|
(2,000)
|
(1,735)
|
||
|
Repayment of line of credit
|
-
|
(2,925)
|
|||
|
Proceeds from sale of Class A common stock, net
|
(58)
|
16
|
22
|
||
|
Purchase of treasury stock
|
(267)
|
(678)
|
(1,529)
|
||
|
Purchase of treasury stock from related party
|
(5,612)
|
(5,182)
|
-
|
||
|
Net Cash (Used in) Provided by Financing Activities
|
(6,507)
|
(7,983)
|
16,305
|
||
|
Effect of exchange rate changes on cash and cash equivalents
|
5
|
485
|
(1,043)
|
||
|
Increase (Decrease) in Cash and Cash Equivalents
|
6,207
|
(8,186)
|
5,057
|
||
|
Cash and cash equivalents at beginning of period
|
10,443
|
18,629
|
13,572
|
||
|
Cash and Cash Equivalents at End of Period
|
$16,650
|
$10,443
|
$18,629
|
||
|
SUPPLEMENTAL INFORMATION
|
|||||
|
Income taxes (refunded) paid, net
|
$(609)
|
$(3,152)
|
$1,988
|
||
|
Interest paid
|
$974
|
$1,249
|
$941
|
See notes to consolidated financial statements.
22
NOTES TO CONSOLIDATED FINANCIAL STATEMENTS
A.T. CROSS COMPANY & SUBSIDIARIES
JANUARY 1, 2011
NOTE A - SIGNIFICANT ACCOUNTING POLICIES
Basis of Presentation and Nature of Operations: The consolidated financial statements include the accounts of A.T. Cross Company and its subsidiaries (the “Company”). Upon consolidation, intercompany accounts and transactions are eliminated.
The Company has two reportable segments: Cross Accessory Division (“CAD”), and Cross Optical Group(“COG”). The Company's CAD segment designs, manufactures and markets writing instruments, business accessories and watches throughout the world and is an OEM of writing instruments. Writing instrument products are sold under the Cross brand as well as the Penatia and Omni by Cross brands. They include ball-point pens, fountain pens, selectip rolling ball pens, mechanical pencils and writing instrument accessories such as refills and desk sets. In addition to writing instrument accessories, the Company offers personal accessory products including watches, precision reading glasses and leather goods. The Company's COG segment designs, manufactures and markets sunglasses throughout the United States under the Costa and Native brand names. The Company evaluates segment performance based upon operating profit or loss. The Company's reportable segments are strategic business units that offer different product lines. They are managed separately, as each unit requires different technologies and marketing strategies.
The Company operates on a 52/53 week fiscal year, ending on the last Saturday closest to December 31. A fiscal year usually consists of four 13 week fiscal quarters. Fiscal 2008, however, was a 53 week year with 14 weeks in the fourth quarter. As such, 2010 was the 52-week fiscal year ended January 1, 2011, 2009 was the 52-week fiscal year ended January 2, 2010 and 2008 was the 53-week fiscal year ended January 3, 2009. The Company has historically recorded its highest sales in the fourth quarter.
The Company considers events or transactions that occur after the balance sheet date but before the financial statements are issued to provide additional evidence relative to certain estimates or to identify matters that require additional disclosure. Subsequent events have been evaluated to the date of issuance of these financial statements.
The accounting policies of the Company are described in this summary of significant accounting policies.
Accounting for Estimates: The preparation of financial statements, in accordance with accounting principles generally accepted in the United States of America (“GAAP”), requires the Company to make assumptions that affect the estimates reported in these consolidated financial statements. Actual results may differ from these estimates. The significant estimates in the Company's consolidated financial statements include sales returns and allowances, allowance for doubtful accounts receivable, realizable value of inventory, impairment of long-lived assets and goodwill, warranty, retirement obligations and income taxes.
Cash Equivalents and Short-Term Investments: The Company considers all highly liquid investments with a maturity of three months or less when purchased to be cash equivalents. Short-term investments are stated at fair value. Gains or losses on short-term investments, both realized and unrealized, are included in other (expense) income. At January 1, 2011 and January 2, 2010, approximately 42% and 22%, respectively, of the Company's cash and cash equivalents were on deposit with one financial institution.
Allowance for Doubtful Accounts: The Company determines its allowance for doubtful accounts based on historical percentages of aged accounts receivable and specific customer accounts when, in management’s opinion, they are deemed uncollectable. Following is a summary of the allowance for doubtful accounts for the three years ended January 1, 2011:
|
YEARS ENDED
|
|||||
|
(THOUSANDS OF DOLLARS)
|
JANUARY 1, 2011
|
JANUARY 2, 2010
|
JANUARY 3, 2009
|
||
|
Allowance for Doubtful Accounts - Beginning of Year
|
$1,129
|
$1,068
|
$879
|
||
|
Charged to bad debt expense
|
139
|
691
|
226
|
||
|
Deductions
|
(199)
|
(630)
|
(37)
|
||
|
Allowance for Doubtful Accounts - End of Year
|
$1,069
|
$1,129
|
$1,068
|
23
Inventories: Domestic writing instrument inventories are priced at the lower of last-in, first-out (“LIFO”) cost under the link-chain method or market. The remaining inventories are priced at the lower of first-in, first-out (“FIFO”) cost or market.
Property, Plant and Equipment, and Related Depreciation: Property, plant and equipment are stated at historical cost. Depreciation expense was $5.4 million, $4.8 million and $4.9 million in fiscal 2010, 2009 and 2008, respectively. Provisions for depreciation are computed using a combination of accelerated and straight-line methods, which are intended to depreciate the cost of such assets over their estimated useful lives, which are as follows:
|
Furniture & Fixtures
|
2 to 10
|
Years
|
|
Machinery & Equipment
|
2 to 10
|
Years
|
|
Leasehold Improvements
|
3 to 15
|
Years
|
|
Vehicles, Tooling and Desktop PCs
|
2 to 5
|
Years
|
The components of Property, Plant and Equipment are as follows:
|
YEARS ENDED
|
|||
|
(THOUSANDS OF DOLLARS)
|
JANUARY 1, 2011
|
JANUARY 2, 2010
|
|
|
Leasehold improvements
|
$1,826
|
$1,675
|
|
|
Machinery and equipment
|
103,123
|
101,141
|
|
|
104,949
|
102,816
|
||
|
Less accumulated depreciation
|
89,867
|
86,863
|
|
|
Property, Plant and Equipment, Net
|
$15,082
|
$15,953
|
|
Long-Lived Assets: The Company reviews long-lived assets for impairment whenever events or changes in circumstances indicate that the carrying amount of an asset may not be recoverable. Recoverability of assets to be held and used is measured by a comparison of the carrying amount of an asset to the undiscounted cash flows expected to be generated by the asset. If such assets are considered to be impaired, the impairment recognized is measured by the amount by which the carrying amount of the assets exceeds the fair value of the assets. Assets to be disposed of are reported at the lower of the carrying amount or fair value, less the cost to sell.
Goodwill and Other Intangible Assets: Goodwill and certain intangible assets with indefinite lives are not amortized but are subject to annual impairment tests, more frequently if events or circumstances occur that would indicate a potential decline in their fair value. The Company has identified two reporting units, consisting of the CAD and COG segments. The Company performs the assessment annually during the fourth quarter and on an interim basis if potential impairment indicators arise. The Company determines the fair value of the reporting units using established income and market valuation approaches and the values of certain intangible assets with indefinite lives, consisting of two COG segment trade names, using a forward-looking relief from royalty model.
Warranty Costs: CAD's Cross-branded writing instruments are sold with a full warranty of unlimited duration against mechanical failure. CAD's accessories are sold with a one-year warranty against mechanical failure and defects in workmanship and timepieces are warranted for a period of two years. Costa and Native sunglasses are sold with a lifetime warranty against defects in materials and workmanship. Estimated warranty costs are accrued at the time of sale. The most significant factors in the estimation of warranty cost liabilities include the operating efficiency and related cost of the service department, unit sales and the number of units that are eventually returned for warranty repair. The current portions of accrued warranty costs were $0.6 million at January 1, 2011 and $0.5 million at January 2, 2010, and were recorded in accrued expenses and other liabilities. The following chart reflects the activity in aggregate accrued warranty costs:
24
|
YEARS ENDED
|
|||||
|
(THOUSANDS OF DOLLARS)
|
JANUARY 1, 2011
|
JANUARY 2, 2010
|
JANUARY 3, 2009
|
||
|
Accrued Warranty Costs - Beginning of Year
|
$1,936
|
$1,823
|
$1,730
|
||
|
Warranty costs paid
|
(735)
|
(592)
|
(754)
|
||
|
Warranty costs accrued
|
423
|
375
|
568
|
||
|
Impact of changes in estimates and assumptions
|
374
|
330
|
252
|
||
|
Warranty liabilities assumed
|
-
|
-
|
27
|
||
|
Accrued Warranty Costs - End of Year
|
$1,998
|
$1,936
|
$1,823
|
Revenue Recognition: Revenue from sales is recognized when the following criteria are met: persuasive evidence of an arrangement exists, title to the goods has passed to the customer, the sales price is fixed or determinable, and collection of the sales price is reasonably assured. Provisions are made at the time the related revenue is recognized for estimated product returns, term discounts and rebates.
Marketing Support Costs: The costs of marketing support, including advertising, are charged to expense as incurred and amounted to approximately $12.3 million, $9.9 million and $11.5 million for fiscal 2010, 2009 and 2008, respectively. Accrued marketing support expenses were approximately $2.0 million at January 1, 2011 and $1.6 million at January 2, 2010 and are included in accrued expenses and other liabilities.
Derivatives: The Company has a program in place to manage foreign currency risk. As part of that program, the Company can enter into foreign currency exchange contracts to hedge anticipated foreign currency transactions or commitments, primarily purchases of materials and products from foreign suppliers, and certain foreign currency denominated balance sheet positions. The terms of the contracts are generally less than three months. Gains and losses on other contracts that do not qualify for hedge accounting are included in SG&A expenses.
The Company also uses interest rate swaps to manage its exposure to changing interest rates that result from variable rate debt. These swaps effectively fix the interest rate on a portion of the Company's line of credit at 3.64%.
Realized and unrealized gains and losses on contracts intended to hedge specific forecasted transactions or commitments, if any, that are designated and qualify for hedge accounting are deferred and recorded as a component of accumulated other comprehensive income (loss) and accounted for as part of the transaction. Contracts are recorded at fair value on the balance sheet as a component of other current assets or accrued expenses and other liabilities.
Stock-Based Compensation: The Company recognizes stock-based employment compensation arrangements based on the estimated fair value of stock-based awards exchanged for employee services received and recognizes compensation cost based on the fair value of the award on the date of grant, recognized ratably over the requisite service period for awards expected to vest. The service period is the period over which the employee performs the related services, which is normally the same as the vesting period.
Income Taxes: Provisions for Federal, state and non-U.S. income taxes are calculated on reported income before income taxes based on current tax law and also include, in the current period, the cumulative effect of any changes in tax rates from those used previously in determining deferred tax assets and liabilities. Such provisions differ from the amounts currently receivable or payable because certain items of income and expense are recognized in different time periods for financial reporting purposes than for income tax purposes. Significant judgment is required in determining income tax provisions and evaluating tax positions.
The Company records a liability associated with an uncertain income tax benefit, for a position taken or intended to be taken, if we determine that it is not more likely than not that such benefit will be sustained upon review of the taxing authority. The Company also records a tax position as the largest amount of benefit that is greater than fifty percent likely of being realized upon ultimate settlement.
Basic and Diluted Net Income Per Share: Basic net income per share is computed by dividing net income by the weighted average number of total shares of Class A and Class B common stock outstanding during the year. Diluted net income per share is computed by dividing net income by diluted weighted average shares outstanding. Diluted weighted average shares reflect the dilutive effect, if any, of potential common shares. To the extent that their effect is dilutive, potential common shares include common stock options and non-vested equity shares based on the treasury stock method. There is no anti-dilutive effect of securities for the three years ended January 1, 2011.
25
Environmental Contingencies: The Company is subject to contingencies pursuant to environmental laws and regulations under various state, Federal and foreign laws, including CERCLA. The Company typically estimates potential costs based on information obtained from the U.S. Environmental Protection Agency, or counterpart state agency and/or studies prepared by independent consultants, including the total estimated costs for the site and the expected cost-sharing, if any, with other “potentially responsible parties,” and the Company accrues liabilities when they are probable and estimable.
NOTE B - INVENTORIES
Domestic writing instrument inventories, approximating $3.3 million and $1.1 million at January 1, 2011 and January 2, 2010, respectively, are priced at the lower of LIFO cost or market. The remaining inventories are priced at the lower of FIFO cost or market. If the FIFO method of inventory valuation had been used for those inventories priced using the LIFO method, inventories would have been approximately $3.2 million and $3.5 million higher than reported at January 1, 2011 and January 2, 2010, respectively. The components of inventory are as follows:
|
YEARS ENDED
|
|||
|
(THOUSANDS OF DOLLARS)
|
JANUARY 1, 2011
|
JANUARY 2, 2010
|
|
|
Finished goods
|
$18,379
|
$13,972
|
|
|
Work in process
|
3,229
|
3,154
|
|
|
Raw materials
|
9,712
|
8,203
|
|
|
$31,320
|
$25,329
|
||
NOTE C - RESTRUCTURING CHARGES
In 2008, the Company restructured Cross Accessory Division ("CAD") Lincoln based manufacturing operations in order to increase its competitiveness in the global marketplace by further leveraging the investment in China manufacturing operations. The Company also closed several underperforming retail stores and reduced headcount at its Lincoln facility. These restructuring programs moved Lincoln manufacturing operations to the Company's China facility and reduced the total retail store count by four. Approximately 50 manufacturing positions and 27 sales and administrative positions in the United States, and four sales and administrative positions in the United Kingdom were affected by these programs. In 2009, the Company expanded its restructuring efforts to further reduce headcount at its Lincoln and European facilities. The Company incurred pre-tax restructuring charges of approximately $4.4 million since the inception of these programs. Of this $4.4 million, approximately $2.4 million was for severance and related expenses and approximately $2.0 million was for transition and other costs.
The following is a tabular presentation of the restructuring liabilities related to this plan:
|
(THOUSANDS OF DOLLARS)
|
SEVERANCE & RELATED
EXPENSES |
PROFESSIONAL
FEES & OTHER |
IMPAIRMENT
OF ASSETS |
TOTAL
|
|||
|
Balances at December 29, 2007
|
$-
|
$-
|
$-
|
$-
|
|||
|
Restructuring charges incurred
|
807
|
475
|
1,244
|
2,526
|
|||
|
Non-cash charges
|
-
|
-
|
(1,233)
|
(1,233)
|
|||
|
Cash payments
|
(33)
|
(413)
|
-
|
(446)
|
|||
|
Foreign exchange effects
|
(2)
|
(1)
|
(11)
|
(14)
|
|||
|
Balances at January 3, 2009
|
$772
|
$61
|
$-
|
$833
|
|||
|
Restructuring charges incurred
|
1,517
|
343
|
-
|
1,860
|
|||
|
Cash payments
|
(1,618)
|
(308)
|
-
|
(1,926)
|
|||
|
Foreign exchange effects
|
5
|
(1)
|
-
|
4
|
|||
|
Balances at January 2, 2010
|
$676
|
$95
|
$-
|
$771
|
|||
|
Cash payments
|
(676)
|
(95)
|
-
|
(771)
|
|||
|
Balances at January 1, 2011
|
$-
|
$-
|
$-
|
$-
|
26
NOTE D - GOODWILL AND OTHER INTANGIBLE ASSETS
Goodwill and indefinite-lived intangible assets are not amortized but are subject to annual impairment tests, more frequently if events or circumstances occur that would indicate a potential decline in their fair value. The Company has identified two reporting units, consisting of the CAD and COG segments. The Company performs the assessment annually during the fourth quarter or on an interim basis if potential impairment indicators arise. The fair value of the reporting unit's goodwill is determined using established income and market valuation approaches and the fair value of other indefinite-lived intangible assets, consisting of two COG segment trade names, is determined using a forward relief from royalty method.
In 2010 and in 2009, the Company's annual impairment tests indicated that all remaining goodwill and indefinite-lived intangibles were not impaired. In 2008, the Company's annual impairment testing indicated that the there was a full impairment of the CAD reporting unit's goodwill and the Company recorded a non-cash impairment charge of $3.9 million. This represents the accumulated goodwill impairment loss as of January 1, 2011 and January 2, 2010. The CAD reporting unit's goodwill was the result of the acquisition of assets in 1999 associated with the Company's OEM effort.
At January 1, 2011 and January 2, 2010, the carrying value of goodwill was approximately $15.3 million. Goodwill resulting from the 2008 acquisition of Native was $11.9 million. The entire $15.3 million goodwill balance, $11.9 million of which is expected to be tax deductible, related to the COG segment. Other intangibles consisted of the following:
|
(THOUSANDS OF DOLLARS)
|
JANUARY 1, 2011
|
JANUARY 2, 2010
|
|||||
|
GROSS CARRYING AMOUNT
|
ACCUMULATED AMORTIZATION
|
OTHER INTANGIBLES, NET
|
GROSS CARRYING AMOUNT
|
ACCUMULATED AMORTIZATION
|
OTHER INTANGIBLES, NET
|
||
|
Amortized:
|
|||||||
|
Trademarks
|
$9,201
|
$8,805
|
$396
|
$9,108
|
$8,581
|
$527
|
|
|
Patents
|
3,361
|
3,124
|
237
|
3,168
|
3,040
|
128
|
|
|
Customer relationships
|
3,170
|
1,245
|
1,925
|
3,170
|
792
|
2,378
|
|
|
Non-compete agreements
|
-
|
-
|
-
|
800
|
350
|
450
|
|
|
$15,732
|
$13,174
|
2,558
|
$16,246
|
$12,763
|
3,483
|
||
|
Not Amortized:
|
|||||||
|
Trade names
|
6,900
|
6,900
|
|||||
|
Intangibles, Net
|
$9,458
|
$10,383
|
|||||
The Company amortizes patents and trademarks over an average five-year life and customer relationships over a seven-year life. The Company’s non-compete agreement, originally intended to remain in effect for four years was not renewed and was fully amortized in 2010. Amortization expense was approximately $1.2 million, $1.0 million and $0.9 million for fiscal years 2010, 2009 and 2008, respectively. The estimated future amortization expense for other intangibles remaining as of January 1, 2011 is as follows:
|
(THOUSANDS OF DOLLARS)
|
2011
|
2012
|
2013
|
2014
|
2015
|
THEREAFTER
|
|||||
|
$697
|
$634
|
$578
|
$522
|
$127
|
$-
|
NOTE E - LINE OF CREDIT
In the third quarter of 2010, the Company amended and restated its secured revolving line of credit with Bank of America, N.A. (the “Bank”), increasing it from $35 million to $40 million. Under the amended and restated line of credit agreement, the Bank agreed to make loans to the Company in an aggregate amount not to exceed $40.0 million, including up to $10.0 million equivalent in Eurocurrency loans denominated in pounds sterling or Euro (“Eurocurrency Loans”) and up to $30.0 million of other committed loans to the Company (“Committed Loans”) at any time. As part of the aggregate availability, the Bank may also issue up to $7.5 million in letters of credit. Subject to the limits on availability and the other terms and conditions of this credit agreement, amounts may be borrowed, repaid and reborrowed without penalty. This amended credit facility matures and amounts outstanding must be paid by July 28, 2013.
The interest rate for the Committed Loans will be, at the Company's option, either (i) the London Interbank Offered Rate (“LIBOR”) plus an applicable margin or (ii) the higher of the federal funds rate plus 50 basis points or the Bank's prime rate plus an applicable margin. The interest rate for any Eurocurrency Loans will be an interest settlement rate for deposits in pounds sterling or Euro plus an applicable margin. The applicable margin for LIBOR
27
and Eurocurrency loans will be an amount between 1.75% and 2.25%, and the applicable margin for federal funds or the Bank's prime rate will be an amount between 0.25% and 0.75%, which will vary from time to time based upon the Company's consolidated leverage ratio.
Under the line of credit agreement, the Company has agreed to comply with certain affirmative and negative covenants. The most restrictive covenant requires the Company to maintain a maximum ratio of consolidated funded indebtedness to consolidated adjusted EBITDA over any four-quarter period. The agreement requires the Company to maintain a minimum consolidated tangible net worth, computed at each year end, a maximum level of capital expenditures, each of which is calculated in accordance with the agreement. Amounts due under the credit agreement are guaranteed by certain domestic and foreign subsidiaries of the Company. Amounts due are also secured by a pledge of the assets of the Company and those of certain of its domestic subsidiaries.
At January 1, 2011, the outstanding balance of the Company's amended line of credit was $19.2 million, bearing an interest rate of approximately 2.0%, and the unused and available portion, according to the terms of the amended agreement, was $20.8 million. At January 2, 2010, the outstanding balance of the Company's line of credit was $19.7 million, bearing an interest rate of approximately 3.2%, and the unused and available portion, according to the then existing terms of the agreement, was $15.3 million.
NOTE F - ACCUMULATED OTHER COMPREHENSIVE (LOSS) INCOME ITEMS
|
(THOUSANDS OF DOLLARS)
|
CUMULATIVE TRANSLATION ADJUSTMENTS
|
PENSION
LIABILITY ADJUSTMENT |
INTEREST RATE SWAP
AGREEMENTS |
ACCUMULATED
OTHER COMPREHENSIVE LOSS |
|||
|
Balances at January 2, 2010
|
$(1,601)
|
$(9,046)
|
$(351)
|
$(10,998)
|
|||
|
Current period change
|
(302)
|
(1,591)
|
232
|
(1,661)
|
|||
|
Balances at January 1, 2011
|
$(1,903)
|
$(10,637)
|
$(119)
|
$(12,659)
|
The reclassification adjustment of the pension liability prior service costs arising in the period presented was not material.
NOTE G - FINANCIAL INSTRUMENTS
The following table details the United States dollar equivalent of foreign exchange contracts outstanding at January 1, 2011 and January 2, 2010, along with maturity dates and any unrealized (loss) gain. The net unrealized (loss) gain is recorded in SG&A in the consolidated statements of income, since the Company did not apply hedge accounting to these contracts.
|
(THOUSANDS OF DOLLARS)
|
CONTRACT AMOUNT U.S. $ EQUIVALENT
|
MATURITY DATE
|
UNREALIZED GROSS (LOSS) GAIN
|
||
|
JANUARY 1, 2011
|
|||||
|
Euro
|
$11,931
|
2011
|
$(75)
|
||
|
Sterling
|
5,267
|
2011
|
(37)
|
||
|
Japanese Yen
|
4,529
|
2011
|
(27)
|
||
|
Hong Kong Dollar
|
5,140
|
2011
|
(8)
|
||
|
Taiwan Dollar
|
1,604
|
2011
|
(7)
|
||
|
Total
|
$28,471
|
$(154)
|
|||
|
JANUARY 2, 2010
|
|||||
|
Euro
|
$5,551
|
2010
|
$108
|
||
|
Sterling
|
67
|
2010
|
40
|
||
|
Japanese Yen
|
4,636
|
2010
|
338
|
||
|
Hong Kong Dollar
|
3,877
|
2010
|
7
|
||
|
Taiwan Dollar
|
1,423
|
2010
|
10
|
||
|
Total
|
$15,554
|
$503
|
28
Foreign currency exchange (losses) gains that are included in SG&A expenses approximated $(1.2) million, $(1.8) million and $1.1 million in fiscal 2010, 2009 and 2008, respectively.
In 2008, the Company entered into three interest rate swap agreements with a total initial notional amount of $15.0 million and a term of three years. These swaps effectively fix the interest rate on a portion of the Company's three-year line of credit at approximately 3.64%. Amounts paid or received under these swap agreements are recorded as adjustments to interest expense. The Company measures hedge ineffectiveness using the “hypothetical” derivative method. These swaps have been designated cash flow hedges and the effect of the mark-to-market valuations are recorded as an adjustment, net of tax, to accumulated other comprehensive loss. From inception to January 1, 2011, the effect of the mark-to-market valuations, net of tax, was an unrealized loss of approximately $0.1 million and is included as a component of accumulated other comprehensive loss. At January 1, 2011, the combined notional value of these three interest rate swaps was $15.0 million.
In the third quarter of 2010, the Company entered into a forward interest rate swap agreement with an initial notional amount of $15.0 million and a term of three years. This swap effectively fixes the interest rate on a portion of the Company’s line of credit at approximately 1.2%. The item being hedged is the first interest payment to be made on $15.0 million of principal expected to occur each month beginning March 31, 2011. The Company measures hedge ineffectiveness using the “hypothetical” derivative method. This swap has been designated a cash flow hedge and the effect of the mark-to-market valuation is recorded as an adjustment, net of tax, to accumulated other comprehensive loss. From inception to January 1, 2011, the effect of the mark-to-market valuation, net of tax, was not material and included as a component of accumulated other comprehensive loss.
The fair value of forward foreign exchange contracts, based on quoted spot exchange rates, are reported in other current assets or accrued expenses and other liabilities. The fair value of cash and cash equivalents approximates the recorded amounts, due to the short period of time to maturity. The carrying amount of long-term debt approximates fair value as a result of the variable interest rate. The fair value of the interest rate swap agreements, based upon market observable data, was ($0.1) million and ($0.5) million at January 1, 2011 and January 2, 2010, respectively, and was reported in accrued expenses and other liabilities.
NOTE H - EMPLOYEE BENEFIT PLANS
The Company has non-contributory defined benefit pension plans and a defined contribution retirement plan (consisting of savings plans and a non-contributory profit sharing plan), which cover substantially all domestic employees.
On March 30, 2006, the Company's Board of Directors voted to freeze the Company's domestic non-contributory defined benefit pension plan effective May 20, 2006.
The Company's matching contributions to its savings plans are made in cash. In fiscal 2010, 2009 and 2008 expenses related to this plan were approximately $0.7 million, $0.9 million and $1.1 million, respectively. There were no profit sharing plan contributions during this three-year period. The Company also maintains a deferred compensation plan that is offered to certain key executives and non-employee directors. Employees of foreign subsidiaries generally receive retirement benefits from Company sponsored defined benefit or defined contribution plans or from statutory plans administered by governmental agencies in their countries. The Company does not provide its employees with any postretirement benefits other than those described above.
The Company's measurement date for these benefits is the Company's fiscal year end.
Benefits under the defined benefit plans are based on the employee's years of service and compensation, as defined. While there is no requirement under any of these plans to invest in the Company's stock, the defined contribution retirement plan offers the Company's stock as an investment option. The Company's funding policy is consistent with applicable local laws and regulations.
The following chart sets forth the defined benefit plans' combined funded status and amounts recognized in the Company's consolidated balance sheet at the end of each fiscal year:
29
|
(THOUSANDS OF DOLLARS)
|
2010
|
2009
|
||
|
Change in Projected Benefit Obligation
|
||||
|
Benefit obligation at end of prior year
|
$46,827
|
$47,265
|
||
|
Service cost
|
45
|
100
|
||
|
Interest cost
|
2,679
|
3,001
|
||
|
Curtailments/Settlements
|
-
|
(3,381)
|
||
|
Actuarial loss
|
3,524
|
2,131
|
||
|
Benefits paid
|
(2,134)
|
(2,166)
|
||
|
Administrative expenses paid
|
(72)
|
(123)
|
||
|
Benefit Obligation at End of Year
|
$50,869
|
$46,827
|
||
|
Change in Plan Assets
|
||||
|
Fair value of plan assets at end of prior year
|
$30,369
|
$30,832
|
||
|
Actual return on plan assets
|
3,091
|
4,058
|
||
|
Employer contributions
|
1,674
|
146
|
||
|
Plan settlements
|
-
|
(2,378)
|
||
|
Benefits paid
|
(2,134)
|
(2,166)
|
||
|
Administrative expenses paid
|
(72)
|
(123)
|
||
|
Fair Value of Plan Assets at End of Year
|
$32,928
|
$30,369
|
||
|
Funded Status
|
||||
|
Deficiency of plan assets over projected benefit obligation
|
$(17,941)
|
$(16,458)
|
||
|
Unrecognized prior service cost
|
82
|
94
|
||
|
Unrecognized net actuarial loss
|
15,992
|
13,513
|
||
|
Accrued Pension Cost (Included in Retirement Plan Obligations)
|
$(1,867)
|
$(2,851)
|
||
|
Amounts Recognized in the Consolidated Balance Sheets Consist of
|
||||
|
Accrued benefit cost - current
|
$(1,997)
|
$(1,732)
|
||
|
Accrued benefit cost - long-term
|
(15,944)
|
(14,726)
|
||
|
Accumulated other comprehensive loss
|
16,074
|
13,607
|
||
|
Net Recognized Amount
|
$(1,867)
|
$(2,851)
|
||
|
Accumulated Benefit Obligation
|
$50,869
|
$46,827
|
|
(THOUSANDS OF DOLLARS)
|
2010
|
2009
|
2008
|
|||
|
Components of Net Periodic Benefit Cost
|
||||||
|
Service cost
|
$45
|
$100
|
$80
|
|||
|
Interest cost
|
2,679
|
3,001
|
2,919
|
|||
|
Expected return on plan assets
|
(2,465)
|
(2,504)
|
(2,975)
|
|||
|
Amortization of transition obligation
|
-
|
7
|
7
|
|||
|
Amortization of prior service cost
|
11
|
31
|
65
|
|||
|
Recognized net actuarial (gain) loss
|
379
|
386
|
(1)
|
|||
|
Settlement gain
|
-
|
(185)
|
-
|
|||
|
Net Periodic Benefit Cost
|
$649
|
$836
|
$95
|
30
|
2010
|
2009
|
2008
|
||||||
|
Assumptions:
|
DOMESTIC PLANS
|
FOREIGN PLANS
|
DOMESTIC PLANS
|
FOREIGN PLANS
|
DOMESTIC PLANS
|
FOREIGN PLANS
|
||
|
Weighted Average Assumptions Used
|
||||||||
|
to Determine Benefit Obligation
|
||||||||
|
Discount rate
|
5.36%
|
5.15%
|
5.88%
|
5.90%
|
6.17%
|
5.70%
|
||
|
Rate of compensation increase
|
N/A
|
N/A
|
N/A
|
N/A
|
N/A
|
N/A
|
||
|
Weighted Average Assumptions Used
|
||||||||
|
to Determine Net Periodic Benefit Cost
|
||||||||
|
Discount rate
|
5.88%
|
5.90%
|
6.17%
|
5.70%
|
6.40%
|
5.50%
|
||
|
Expected return on plan assets
|
7.80%
|
3.50%
|
7.80%
|
4.00%
|
8.13%
|
4.30%
|
||
|
Rate of compensation increase
|
N/A
|
N/A
|
N/A
|
N/A
|
N/A
|
N/A
|
||
The Company decreased the discount rate on domestic plans to 5.36% in 2010 from 5.88% in 2009 to reflect market interest rate conditions. In establishing the long-term rate of return on assets assumption of 7.8%, the Company indexed its targeted allocation percentage by asset category against the long-term expected returns on the frozen domestic plan for those asset categories. That weighted-average return approximates 7.8%. The Company monitors investment results against benchmarks such as the Russell 1000 Growth Index and the Russell 2000 Value Index for the equity portion of the portfolio and the Barclays Capital US Long Credit A+ Index for fixed income investments. Meeting or exceeding those benchmarks over time would provide a reasonable expectation of achieving the 7.8% assumption.
|
Plan Asset Information: Asset Category
|
TARGET
ALLOCATION FYE 2011 |
ALLOCATION PERCENTAGE
FYE 2010 |
ALLOCATION PERCENTAGE
FYE 2009 |
||
|
Domestic Equities
|
35%
|
35.0%
|
17.9%
|
||
|
International Equities
|
10%
|
11.2%
|
9.4%
|
||
|
Fixed Income Securities
|
40%
|
39.9%
|
56.9%
|
||
|
All Asset Fund
|
15%
|
13.9%
|
14.7%
|
||
|
Cash/Other
|
0%
|
0.0%
|
1.1%
|
||
|
100%
|
100%
|
100%
|
The investment objective of the Plan is to exceed the actuarial long-term rate of return on assets assumption of 7.8%. To that end, it is the Plan's practice to invest the assets in accordance with the targeted allocation established for each asset category. These targeted asset allocation ranges have been established in accordance with the overall risk and return objectives of the portfolio. The Plan employs other risk management practices that stress diversification and liquidity. For equity investments, no more than 10% of the equity portfolio can be invested in one issuer and typically no more than 20% of equity assets can be invested in one industry. Shares must be listed on major stock exchanges to assure liquidity. Debt securities are similarly governed by risk management rules. No more than 5% of the total portfolio may be invested in one issuer (except the United States government), and no one issuer can exceed 5% of the outstanding shares of that issuer. There are also quality ratings associated with debt securities that the Plan managers must adhere to. Certain assets or transactions are prohibited in the management of Plan assets, such as commodities, real estate (except mutual funds or REITS), venture capital, private placements, purchasing securities on margin and short selling.
The Company expects to contribute $6.1 million to its defined benefit pension plans in 2011, $2.1 million to meet minimum required contributions and $4.0 million as an additional voluntary contribution. With this additional voluntary contribution, the Company expects its defined benefit pension plans will be approximately 80% funded by the end of fiscal 2012. The Company expects to contribute $0.8 million to its defined contribution retirement plans and $0.2 million to its excess benefit plan in 2011.
The following benefit payments, which reflect expected future service, as appropriate, are expected to be paid:
|
(THOUSANDS OF DOLLARS)
|
2011
|
2012
|
2013
|
2014
|
2015
|
2016 - 2020
|
|||||
|
$2,143
|
$2,175
|
$2,310
|
$2,444
|
$2,579
|
$14,924
|
31
The fair value framework requires the categorization of pension plan assets into three levels based upon the assumptions (inputs) used to price the pension plan assets. Level 1 provides the most reliable measure of fair value, whereas Level 3 generally requires significant management judgment. The three levels are defined as follows:
|
Level 1
|
Unadjusted quoted prices in active markets for identical assets.
|
|
Level 2
|
Observable inputs other than those included in Level 1. For example, quoted prices for similar assets in active markets or quoted prices for identical assets in inactive markets.
|
|
Level 3
|
Unobservable inputs reflecting management's own assumptions about the inputs used in pricing the asset.
|
The fair values of our financial assets and liabilities are categorized as follows:
|
(THOUSANDS OF DOLLARS)
|
JANUARY 1, 2011
|
JANUARY 2, 2010
|
|||||||||||||
|
LEVEL 1
|
LEVEL 2
|
LEVEL 3
|
TOTAL
|
LEVEL 1
|
LEVEL 2
|
LEVEL 3
|
TOTAL
|
||||||||
|
Assets:
|
|||||||||||||||
|
Domestic Equities (A) (B)
|
$9,832
|
$-
|
$-
|
$9,832
|
$4,135
|
$-
|
$-
|
$4,135
|
|||||||
|
International Equities (A)
|
2,532
|
-
|
-
|
2,532
|
2,255
|
-
|
-
|
2,255
|
|||||||
|
Fixed Income Securities (A), (C)
|
10,111
|
-
|
-
|
10,111
|
13,622
|
144
|
-
|
13,766
|
|||||||
|
Foreign Fixed Income Securities (C)
|
-
|
6,575
|
-
|
6,575
|
-
|
6,447
|
-
|
6,447
|
|||||||
|
All Asset Fund (A)
|
3,686
|
-
|
-
|
3,686
|
3,515
|
-
|
-
|
3,515
|
|||||||
|
Cash and Cash Equivalents
|
192
|
-
|
-
|
192
|
251
|
-
|
-
|
251
|
|||||||
|
Total Assets at Fair Value
|
$26,353
|
$6,575
|
$-
|
$32,928
|
$23,778
|
$6,591
|
$-
|
$30,369
|
|||||||
NOTE I - OMNIBUS INCENTIVE PLAN (THE “OI PLAN”)
The Company's OI Plan permits the Compensation Committee of the Board of Directors of the Company to grant various long-term incentive awards, generally equity based, to officers and key employees from one pool of reserved shares. The OI Plan provides for grants of awards, including but not limited to Non-Qualified Stock Options, at an exercise price determined by the Compensation Committee; Stock Appreciation Rights, which are rights to receive an amount equal to the increase, between the date of grant and the date of exercise, in the fair market value of the number of shares of common stock subject to the Stock Appreciation Right; Non-Vested Equity Shares, which are common shares that have certain conditions attached to them that must be satisfied in order to have unencumbered rights to them; and Performance Awards, which are awards in common shares or cash. The OI Plan has no definite expiration date but may be terminated by the Board of Directors at any time. At January 1, 2011, there were 1,528,364 shares reserved and 87,815 shares available to be issued under the OI Plan.
The fair value of each stock option granted under the Company's OI Plan was estimated on the date of grant using the Black-Scholes option-pricing model. It should be noted that the option-pricing model used was designed to value readily tradable stock options with relatively short lives. The options granted to employees are not tradable and have contractual lives of up to ten years unless employment is terminated. However, management believes that the assumptions used and the model applied to value the awards yield a reasonable estimate of the fair value of the grants made under the circumstances. No stock options were exercised in 2009 and 2008. Other information related to stock options follows:
|
2010
|
2009
|
2008
|
|||
|
Weighted average fair value per share of stock options granted
|
$1.28
|
$0.89
|
$1.38
|
||
|
Key assumptions used to value stock options granted:
|
|||||
|
Weighted average risk-free rate
|
1.56%
|
1.98%
|
1.98%
|
||
|
Average expected life in years
|
3
|
7
|
7
|
||
|
Volatility
|
43.32%
|
36.69%
|
36.69%
|
||
|
Dividend yield
|
0%
|
0%
|
0%
|
32
|
JANUARY 1, 2011
|
JANUARY 2, 2010
|
||
|
Stock price used to determine intrinsic values at end of year
|
$9.79
|
$4.98
|
|
|
(MILLIONS OF DOLLARS)
|
|||
|
Intrinsic value of stock options outstanding at end of year
|
$7.6
|
$0.9
|
|
|
Intrinsic value of stock options exercisable at end of year
|
$6.4
|
$0.3
|
|
|
Intrinsic value of stock options exercised
|
$0.3
|
N/A
|
The fair value of non-vested equity shares granted under the Company's OI Plan was determined on the date of grant. At January 1, 2011, the total unrecognized cost for Non-Vested Equity Shares under the OI Plan was approximately $2.3 million with a weighted-average life of 2.3 years. Other information related to non-vested equity shares follows:
|
2010
|
2009
|
2008
|
|||
|
(MILLIONS OF DOLLARS)
|
|||||
|
Fair value of shares vested at vesting dates
|
$1.4
|
$0.4
|
$1.3
|
||
|
Compensation expense recognized
|
$1.1
|
$0.5
|
$1.2
|
Director Retainers are shares of Company stock issued to Directors for services performed for the Company; they vest upon issuance. The expense related to Director Retainer shares for 2010, 2009 and 2008 were $0.2 million, $0.1 million and $0.2 million, respectively.
The related tax provision on compensation expense recognized under the OI Plan was $0.1 million, $0.1 million and essentially zero in fiscal 2010, 2009 and 2008, respectively.
Stock plan activity during the year ended January 1, 2011 was as follows:
|
SHARES
|
WEIGHTED AVERAGE
EXERCISE PRICE |
SHARES RESERVED
|
|||
|
Shares reserved at January 2, 2010
|
2,395,476
|
||||
|
Stock Options:
|
|||||
|
Outstanding at January 2, 2010
|
1,182,479
|
$5.07
|
-
|
||
|
Granted
|
534,351
|
$4.16
|
-
|
||
|
Exercised
|
(214,655)
|
$6.37
|
(214,655)
|
||
|
Cancelled
|
(61,626)
|
$5.24
|
-
|
||
|
Outstanding at January 1, 2011
|
1,440,549
|
$4.54
|
|||
|
WEIGHTED AVERAGE
GRANT DATE FAIR VALUE |
|||||
|
Non-Vested Equity Shares:
|
|||||
|
Outstanding at January 2, 2010
|
341,450
|
$9.89
|
-
|
||
|
Granted
|
725,000
|
$4.28
|
(725,000)
|
||
|
Vested
|
(146,331)
|
$9.80
|
-
|
||
|
Cancelled
|
(104,214)
|
$9.95
|
104,214
|
||
|
Outstanding at January 1, 2011
|
815,905
|
$4.91
|
|||
|
Director Retainers
|
31,671
|
$4.83
|
(31,671)
|
||
|
Shares reserved at January 1, 2011
|
1,528,364
|
The Company also has an Employee Stock Purchase Plan (the “ESP Plan”), allowing eligible employees, other than officers and directors, to purchase shares of the Company's Class A common stock at 10% less than the mean between the high and low prices of the stock on the date of purchase. A maximum of 320,000 shares is available under the ESP Plan, and the aggregate numbers of shares reserved and available for purchase under the ESP Plan were 78,134, 81,822 and 86,729 at January 1, 2011, January 2, 2010 and January 3, 2009, respectively.
33
NOTE J - INCOME TAXES
The components of income before income taxes were:
|
(THOUSANDS OF DOLLARS)
|
2010
|
2009
|
2008
|
|||
|
U.S.
|
$2,410
|
$(2,901)
|
$(767)
|
|||
|
Non-U.S.
|
5,694
|
3,271
|
3,536
|
|||
|
$8,104
|
$370
|
$2,769
|
The provision for income taxes consists of the following:
|
(THOUSANDS OF DOLLARS)
|
2010
|
2009
|
2008
|
|||
|
Currently Payable (Receivable):
|
||||||
|
Federal
|
$1,233
|
$(879)
|
$(767)
|
|||
|
State
|
214
|
(182)
|
334
|
|||
|
Foreign
|
1,094
|
1,015
|
897
|
|||
|
2,541
|
(46)
|
464
|
||||
|
Deferred:
|
||||||
|
Federal
|
(708)
|
(1,403)
|
1,732
|
|||
|
State
|
-
|
29
|
(9)
|
|||
|
Foreign
|
(102)
|
(65)
|
88
|
|||
|
(810)
|
(1,439)
|
1,811
|
||||
|
Total
|
$1,731
|
$(1,485)
|
$2,275
|
The reconciliation of income taxes computed at the statutory Federal income tax rate to the provision for income taxes from operations is as follows:
|
(THOUSANDS OF DOLLARS)
|
2010
|
2009
|
2008
|
|||
|
Statutory Federal income tax provision
|
$2,836
|
$130
|
$969
|
|||
|
State income tax expense, less Federal tax benefit
|
134
|
(118)
|
217
|
|||
|
Foreign tax rate differential
|
(1,001)
|
(298)
|
4
|
|||
|
Goodwill Impairment
|
-
|
-
|
1,380
|
|||
|
Adjustment related to uncertain tax benefits
|
(223)
|
(367)
|
(283)
|
|||
|
Settlement of items subject to audit
|
-
|
(818)
|
-
|
|||
|
Miscellaneous
|
(15)
|
(14)
|
(12)
|
|||
|
Income Tax Provision (Benefit)
|
$1,731
|
$(1,485)
|
$2,275
|
The tax effects of temporary differences that give rise to significant portions of the deferred tax assets and deferred tax liabilities at January 1, 2011 and January 2, 2010 are as follows:
|
(THOUSANDS OF DOLLARS)
|
2010
|
2009
|
||
|
Current Deferred Tax Assets:
|
||||
|
Additional costs inventoried for tax purposes and
|
||||
|
inventory adjustments not deductible for tax purposes
|
$3,726
|
$2,658
|
||
|
Excess benefit plan
|
889
|
825
|
||
|
Accrued pension costs
|
668
|
490
|
||
|
Other
|
1,466
|
2,265
|
||
|
6,749
|
6,238
|
|||
|
Less Valuation Allowance
|
(1,159)
|
(1,146)
|
||
|
Current Deferred Tax Assets
|
$5,590
|
$5,092
|
34
|
2010
|
2009
|
|||
|
Long-Term Deferred Tax Assets and Liabilities:
|
||||
|
Assets:
|
||||
|
Intangible assets
|
$682
|
$1,094
|
||
|
Accrued warranty costs
|
773
|
755
|
||
|
Foreign tax credit carryforward
|
1,682
|
2,054
|
||
|
Net operating loss carryforward
|
2,665
|
3,020
|
||
|
Accrued pension costs
|
6,427
|
5,486
|
||
|
Deferred gain on sale of real estate
|
1,329
|
1,512
|
||
|
Property, plant and equipment, principally due to
|
||||
|
differences in depreciation
|
-
|
384
|
||
|
Other
|
1,584
|
1,032
|
||
|
15,142
|
15,337
|
|||
|
Less Valuation Allowance
|
(3,624)
|
(3,559)
|
||
|
Long-Term Deferred Tax Assets
|
$11,518
|
$11,778
|
||
|
Liabilities:
|
||||
|
Property, plant and equipment, principally due to
|
||||
|
differences in depreciation
|
(200)
|
-
|
||
|
Long-Term Deferred Tax Liabilities
|
(200)
|
-
|
||
|
Net Long-Term Deferred Tax Asset
|
$11,318
|
$11,778
|
||
|
Net Deferred Tax Asset
|
$16,908
|
$16,870
|
At January 1, 2011 and January 2, 2010, undistributed earnings of foreign subsidiaries amounted to approximately $30.9 million and $26.2 million, respectively. These earnings could become subject to additional tax if they are remitted as dividends or if certain other circumstances exist. The amount of additional taxes that might be payable on the undistributed foreign earnings of $30.9 million approximates $8.8 million. This amount has not been recorded because it is the Company's intention to permanently invest the remainder of the undistributed earnings of its foreign subsidiaries in the growth of business outside the United States.
At January 1, 2011, the Company had state net operating loss carryforwards of approximately $23.9 million, which expire in fiscal years from 2011 to 2029. Net operating loss carryforwards for certain foreign subsidiaries were approximately $4.9 million for tax purposes. A portion of these losses will expire in fiscal years from 2011 to 2023 and a portion does not expire. A valuation allowance has been provided for the foreign and state net operating losses and temporary differences that are estimated to expire before they are utilized. The decrease of $0.1 million in 2010 and the increase of $0.2 million in 2009 in the valuation allowance primarily related to changes in state deferred tax assets.
Deferred income taxes arise from temporary differences between the tax and financial statement recognition of revenue and expense. In evaluating our ability to recover our deferred tax assets within the jurisdiction from which they arise we consider all available positive and negative evidence, including reversals of deferred tax liabilities, projected future taxable income, tax planning strategies and recent financial operations. It is management's assertion based on the evaluation of this evidence that it is more likely than not that sufficient future taxable income will be generated to realize the tax benefit of the deferred tax assets, net of the valuation allowance.
As of January 1, 2011, the liability for uncertain tax positions is $0.4 million and $0.3 million of the unrecognized tax benefit would impact the Company's effective tax rate, if recognized.
The following is a tabular reconciliation of beginning and ending balances of unrecognized tax benefits.
|
(THOUSANDS OF DOLLARS)
|
2010
|
2009
|
2008
|
|||
|
Beginning of Year
|
$586
|
$1,848
|
$2,063
|
|||
|
Gross decreases - tax positions in prior period
|
-
|
(722)
|
(18)
|
|||
|
Gross increases - current period tax positions
|
92
|
98
|
9
|
|||
|
Lapse of statute limitations
|
(302)
|
(638)
|
(206)
|
|||
|
End of Year
|
$376
|
$586
|
$1,848
|
The Company is currently subject to audit by the Internal Revenue Service (“IRS”) and certain foreign jurisdictions for the calendar years ended 2007 through 2010. The Company concluded the IRS audit of the 2005 tax year in the first quarter of 2009 and recorded those results in that quarter. In certain foreign jurisdictions, the Company is currently subject to audit for tax years prior to 2005; this varies depending on the jurisdiction. The Company and its subsidiaries' state income tax returns are subject to audit for the calendar years ended 2006 through 2010.
35
As of January 2, 2010, the Company had accrued $0.2 million of interest and $0.1 million of penalties related to uncertain tax positions. As of January 1, 2011, the amount of accrued interest was $0.1 million and the amount of accrued penalties was immaterial. The Company accounts for interest and penalties related to uncertain tax positions as part of its provision for income taxes. The liabilities resulting from the adoption of an accounting standard update related to uncertain tax positions, including tax, interest and penalty, are included in other long-term liabilities on the Company's consolidated balance sheet.
The Company is subject to income taxes in many jurisdictions around the world. Significant judgment is required in determining the worldwide provision for income taxes. In the ordinary course of business, there are many transactions and calculations in which the ultimate tax determination is uncertain. Although the Company believes the estimates for uncertain tax positions are reasonable and recorded in accordance with accounting standards, the final determination of tax audits and any related litigation could be materially different than that which is reflected in historical income tax provisions and accruals. Additional taxes assessed as a result of an audit or litigation could have a material effect on the Company's income tax provision and net income in the period or periods in which the determination is made. Changes in estimates made in fiscal 2010 and 2009 were the result of more precise information, current actions by taxing authorities and the expiration of statutes of limitation in certain jurisdictions.
NOTE K - SEGMENT INFORMATION
The following chart sets forth segment information for the Company for the three fiscal years ended January 1, 2011:
|
(THOUSANDS OF DOLLARS)
|
CROSS
ACCESSORY
DIVISION
|
CROSS
OPTICAL
GROUP
|
TOTAL
|
||||
|
2010:
|
|||||||
|
Revenues from external customers
|
$ 97,776
|
$ 60,536
|
$158,312
|
||||
|
Depreciation and amortization
|
4,780
|
1,835
|
6,615
|
||||
|
Operating income
|
1,071
|
8,253
|
9,324
|
||||
|
Segment assets
|
96,472
|
48,154
|
144,626
|
||||
|
Goodwill
|
-
|
15,279
|
15,279
|
||||
|
Expenditures for long-lived assets
|
3,734
|
1,085
|
4,819
|
||||
|
2009:
|
|||||||
|
Revenues from external customers
|
$ 90,892
|
$ 50,872
|
$141,764
|
||||
|
Depreciation and amortization
|
4,374
|
1,499
|
5,873
|
||||
|
Operating (loss) income
|
(4,756
|
)
|
6,056
|
1,300
|
|||
|
Restructuring charges
|
1,860
|
-
|
1,860
|
||||
|
Segment assets
|
94,358
|
44,061
|
138,419
|
||||
|
Goodwill
|
-
|
15,279
|
15,279
|
||||
|
Expenditures for long-lived assets
|
4,181
|
1,737
|
5,918
|
||||
|
2008:
|
|||||||
|
Revenues from external customers
|
$111,455
|
$ 48,691
|
$160,146
|
||||
|
Depreciation and amortization
|
4,610
|
1,171
|
5,781
|
||||
|
Operating (loss) income
|
(4,328
|
)
|
7,879
|
3,551
|
|||
|
Restructuring charges
|
2,526
|
-
|
2,526
|
||||
|
Goodwill impairment charge
|
3,944
|
-
|
3,944
|
||||
|
Segment assets
|
99,836
|
44,123
|
143,959
|
||||
|
Goodwill
|
-
|
14,526
|
14,526
|
||||
|
Expenditures for long-lived assets
|
3,922
|
19,604
|
23,526
|
||||
Total Company and segment operating income (loss) reconciles to consolidated income before income taxes by the inclusion of interest income, interest expense and other income.
The Company defines long-lived assets as property, plant and equipment and intangibles.
36
Geographic Information
|
(THOUSANDS OF DOLLARS)
|
2010
|
2009
|
2008
|
|||||
|
NET SALES:
|
||||||||
|
United States
|
$ 90,322
|
$ 80,891
|
$ 85,794
|
|||||
|
Europe, Middle East and Africa
|
34,631
|
33,238
|
43,902
|
|||||
|
Asia Pacific
|
22,438
|
18,906
|
20,609
|
|||||
|
International Americas
|
10,921
|
8,729
|
9,841
|
|||||
|
Total Consolidated Net Sales
|
$158,312
|
$141,764
|
$160,146
|
|||||
|
Revenues are attributed to countries based on the location of customers.
|
||||||||
|
LONG-LIVED ASSETS:
|
||||||||
|
United States
|
$ 31,786
|
$ 32,451
|
$ 32,305
|
|||||
|
Foreign countries
|
8,033
|
9,165
|
8,958
|
|||||
|
Total Consolidated Long-Lived Assets
|
$ 39,819
|
$ 41,616
|
$ 41,263
|
|||||
NOTE L - COMMITMENTS AND CONTINGENCIES
The Company leases administrative facilities and/or manufacturing and warehouse space for its CAD segment operations in Rhode Island, U.S., the United Kingdom, France, Japan, Hong Kong, Taiwan, Singapore and China. The CAD segment also leases retail facilities in Massachusetts and the United Kingdom. The Company's COG segment leases administrative and warehouse facilities in Florida and Colorado. All leases expire prior to the end of 2017. Real estate taxes, insurance, and maintenance expenses are generally obligations of the Company. It is expected that in the ordinary course of business, leases that expire will be renewed or replaced by leases on other properties; thus, it is anticipated that future minimum lease commitments will not be less than the amounts shown for 2011. Rent expense for leased facilities was approximately $3.5 million, $3.6 million and $3.0 million in 2010, 2009 and 2008, respectively. At January 1, 2011, future minimum lease payments under all such non-cancelable leases, including renewal options the Company believes it will exercise, were approximately:
|
(THOUSANDS OF DOLLARS)
|
2011
|
2012
|
2013
|
2014
|
2015
|
Thereafter
|
Total
|
|||||||
|
$ 3,114
|
$ 2,724
|
$ 2,689
|
$ 2,595
|
$ 2,502
|
$3,638
|
$17,262
|
||||||||
The Company was named as one of approximately ninety defendants in a contribution suit brought by CCL/Unilever relating to the J.M. Mills Landfill Site (the “Site”), which is part of the Peterson/Puritan Superfund Site in Cumberland, Rhode Island. These complaints alleged that the Company was liable under the Comprehensive Environmental Response, Compensation and Liability Act ("CERCLA") for contribution for Site investigation costs. The Company has reached settlement of the case and paid a settlement amount of approximately $0.2 million in 2010.
The Company expects that the Federal Environmental Protection Agency ("EPA") will select a remedy for the Site in 2011. At that time, the EPA will initiate an administrative process (the "Special Notice Process") pursuant to CERCLA whereby the EPA will request that those entities that the EPA contends arranged for the disposal of hazardous materials at the Site (the PRPs), undertake the selected remedy at the Site. The EPA contends that the Company is a PRP at the Site. During the Special Notice Process, the Company and the other PRPs will engage in negotiations with the EPA regarding the remedy, and among themselves regarding the contribution of each PRP to overall remediation costs. Neither the cost of the remedy nor the identity of all PRPs is known at this time. Therefore it is not possible to assess the outcome of the Special Notice Process as it may relate to the Company's contribution to remediation costs.
The Pension Benefit Guaranty Corporation (“PBGC”) has asserted that it believes that the Company has had a triggering event under Section 4062(e) of ERISA, which, had such an event occurred, would lead to an acceleration of funding contributions to the Company’s defined benefit plan in the amount of $11.9 million. The PBGC has indicated that such contributions, if required, could be satisfied over a period of several years via a variety of funding alternatives. Specifically, during 2010, the PBGC has asserted that the Company closed a facility in the USA when it completed the transfer of a significant portion of its manufacturing operations offshore. The Company maintains that the facility did not close, and therefore no triggering event occurred. Currently, the Company employs approximately 170 employees in the facility at issue. Notwithstanding the foregoing, the Company intends to ensure that its defined benefit plan remains viable and healthy and intends to continue to make all legally required contributions under the plan. Ongoing discussions continue between the Company and PBGC. The Company further believes that it has sufficient liquidity to meet any required contributions to the Plan, up to and including the $11.9 million.
37
The Company is involved in various other litigation and legal matters that have arisen in the ordinary course of business. To its knowledge, management believes that the ultimate resolution of any of those existing matters will not have a material adverse effect on the Company's consolidated financial position or results of operations.
NOTE M - COMMON STOCK
Holders of Class A common stock have the right to elect one-third of the number of directors from time to time fixed by the holders of Class A and Class B common stock voting together as a single class. Holders of Class B common stock have the right to elect the remaining directors. Class A and Class B common stock vote together as a single class to reserve shares to be issued pursuant to options granted with respect to the acquisition of assets or shares of another company under certain circumstances. Except as described above or as otherwise required by law, all voting power is vested in the holders of Class B common stock.
NOTE N - FAIR VALUE OF FINANCIAL INSTRUMENTS
The fair value framework requires the categorization of assets and liabilities into three levels based upon the assumptions (inputs) used to price the assets or liabilities. Level 1 provides the most reliable measure of fair value, whereas Level 3 generally requires significant management judgment. The three levels are defined as follows:
|
Level 1
|
Unadjusted quoted prices in active markets for identical assets and liabilities.
|
|
Level 2
|
Observable inputs other than those included in Level 1. For example, quoted prices for similar assets
or liabilities in active markets or quoted prices for identical assets or liabilities in inactive markets. |
|
Level 3
|
Unobservable inputs reflecting management's own assumptions about the inputs used in pricing the
asset or liability. |
The fair values of our financial assets and liabilities are categorized as follows:
|
(THOUSANDS OF DOLLARS)
|
JANUARY 1, 2011
|
JANUARY 2, 2010
|
|||||||||||||||||
|
LEVEL 1
|
LEVEL 2
|
LEVEL 3
|
TOTAL
|
LEVEL 1
|
LEVEL 2
|
LEVEL 3
|
TOTAL
|
||||||||||||
|
Assets:
|
|||||||||||||||||||
|
Money market funds (A)
|
$7,003
|
$ -
|
$ -
|
$ 7,003
|
$1,427
|
$ -
|
$ -
|
$1,427
|
|||||||||||
|
Short-term investments (B)
|
2,514
|
-
|
-
|
2,514
|
7,217
|
-
|
-
|
7,217
|
|||||||||||
|
Derivatives not designated as
|
|||||||||||||||||||
|
Hedging instruments:
|
|||||||||||||||||||
|
Foreign exchange contracts (C)
|
-
|
-
|
-
|
-
|
-
|
614
|
-
|
614
|
|||||||||||
|
Total Assets at Fair Value
|
$9,517
|
$ -
|
$ -
|
$9,517
|
$8,644
|
$614
|
$ -
|
$9,258
|
|||||||||||
|
(THOUSANDS OF DOLLARS)
|
JANUARY 1, 2011
|
JANUARY 2, 2010
|
||||||||||||||||||
|
LEVEL 1
|
LEVEL 2
|
LEVEL 3
|
TOTAL
|
LEVEL 1
|
LEVEL 2
|
LEVEL 3
|
TOTAL
|
|||||||||||||
|
Liabilities
|
||||||||||||||||||||
|
Derivatives designated as
|
||||||||||||||||||||
|
Hedging instruments:
|
||||||||||||||||||||
|
Interest rate swaps (D)
|
$ -
|
$ 184
|
$ -
|
$ 184
|
$ -
|
$541
|
$ -
|
$ 541
|
||||||||||||
|
Derivatives not designated as
|
||||||||||||||||||||
|
Hedging instruments:
|
||||||||||||||||||||
|
Foreign exchange contracts (C)
|
-
|
154
|
-
|
154
|
-
|
111
|
-
|
111
|
||||||||||||
|
Total Liabilities at Fair Value
|
$ -
|
$ 338
|
$ -
|
$ 338
|
$ -
|
$652
|
$ -
|
$ 652
|
||||||||||||
|
(A)
|
Value based on quoted market prices of identical instruments, fair value included in cash and cash equivalents
|
|||||||||||||||||||
|
(B)
|
Value based on quoted market prices of identical instruments
|
|||||||||||||||||||
|
(C)
|
Value based on the present value of the forward rates less the contract rate multiplied by the notional amount, fair value included in other current assets or accounts payable, accrued expenses and other liabilities
|
|||||||||||||||||||
|
(D)
|
Value derived from a discounted cash flow analysis based on the terms of the contract and the interest rate curve, fair value included in accounts payable, accrued expenses and other liabilities
|
|||||||||||||||||||
38
Accounts receivable are recorded at net realizable value, which approximates fair value. Accounts payable, included in accounts payable, accrued expenses and other current liabilities, are recorded at historical cost, which approximates fair value due to the short-term nature of the liabilities. Long-term debt is recorded at historical cost, which approximates fair value due to the variable interest rate.
The effective portion of the pre-tax (losses) gains on our derivative instruments are categorized in the following table:
|
(THOUSANDS OF DOLLARS)
|
YEARS ENDED
|
|||||
|
JANUARY 1, 2011
|
JANUARY 2, 2010
|
|||||
|
Fair Value / Non-designated Hedges:
|
||||||
|
Foreign exchange contracts (A)
|
$ (154
|
)
|
$ 503
|
|||
|
Cash Flow Hedges:
|
||||||
|
Effective portion recognized in other comprehensive income:
|
||||||
|
Interest rate swaps
|
$ 870
|
$ 748
|
||||
|
Effective portion reclassified from other comprehensive income:
|
||||||
|
Interest rate swaps (B)
|
$ (513
|
)
|
$ (501
|
)
|
||
|
(A)
|
Included in selling, general and administrative expenses
|
|||||
|
(B)
|
Included in interest expense
|
|||||
NOTE O - SHORT-TERM INVESTMENTS
At January 1, 2011, the Company had short-term equity investments with a value of $2.5 million, classified as trading securities. Realized and unrealized gains or losses on these short-term investments are included in other (expense) income. The net unrealized gain on short-term investments held at January 1, 2011 was approximately $29,000.
NOTE P - RELATED PARTY TRANSACTIONS
Pursuant to a Stock Redemption Agreement with Galal Doss, a director and major stockholder of the Company at that time, the Company purchased approximately 1.4 million shares of the Company’s Class A common stock in the third quarter of 2010 for approximately $5.6 million.
NOTE Q - QUARTERLY RESULTS OF OPERATIONS (UNAUDITED)
The following is a tabulation of the unaudited quarterly results of operations for the years ended January 1, 2011 and January 2, 2010:
|
(THOUSANDS, EXCEPT PER SHARE DATA)
|
||||||||||
|
2010:
|
APRIL 3
|
JULY 3
|
OCTOBER 2
|
JANUARY 1
|
||||||
|
Net Sales
|
$34,373
|
$41,748
|
$38,156
|
$44,035
|
||||||
|
Gross Profit
|
19,519
|
23,905
|
20,746
|
24,306
|
||||||
|
Net Income
|
174
|
2,714
|
1,630
|
1,855
|
||||||
|
Net Income Per Share:
|
||||||||||
|
Basic
|
$0.01
|
$0.20
|
$0.13
|
$0.16
|
||||||
|
Diluted
|
$0.01
|
$0.20
|
$0.13
|
$0.15
|
||||||
|
Weighted Average Shares Outstanding:
|
||||||||||
|
Denominator for Basic Net Income Per Share
|
13,269
|
13,339
|
12,124
|
11,957
|
||||||
|
Effect of Dilutive Securities:
|
||||||||||
|
Common stock equivalents
|
86
|
119
|
400
|
645
|
||||||
|
Denominator for Diluted Net Income Per Share
|
13,355
|
13,458
|
12,524
|
12,602
|
||||||
39
|
(THOUSANDS, EXCEPT PER SHARE DATA)
|
||||||||||
|
2009:
|
APRIL 4
|
JULY 4
|
OCTOBER 3
|
JANUARY 2
|
||||||
|
Net Sales
|
$30,840
|
$37,306
|
$34,129
|
$39,489
|
||||||
|
Gross Profit
|
16,756
|
20,402
|
17,945
|
21,615
|
||||||
|
Net (Loss) Income
|
(949
|
)
|
635
|
926
|
1,243
|
|||||
|
Net (Loss) Income Per Share:
|
||||||||||
|
Basic
|
$(0.06
|
)
|
$0.04
|
$0.06
|
$0.09
|
|||||
|
Diluted
|
$(0.06
|
)
|
$0.04
|
$0.06
|
$0.09
|
|||||
|
Weighted Average Shares Outstanding:
|
||||||||||
|
Denominator for Basic Net Income Per Share
|
14,847
|
14,581
|
14,578
|
14,400
|
||||||
|
Effect of Dilutive Securities:
|
||||||||||
|
Common stock equivalents
|
-
|
(A)
|
12
|
68
|
55
|
|||||
|
Denominator for Diluted Net Income Per Share
|
14,847
|
14,593
|
14,646
|
14,455
|
||||||
|
(A) 178 incremental shares related to options are not included due to the net loss in the quarter since the effect of such shares would be anti-dilutive.
|
||||||||||
40
|
Item 9
|
CHANGES IN AND DISAGREEMENTS WITH ACCOUNTANTS ON ACCOUNTING AND FINANCIAL DISCLOSURE
|
None
|
Item 9A
|
CONTROLS AND PROCEDURES
|
|
A
|
Evaluation of Disclosure Controls and Procedures
|
We have established disclosure controls and procedures designed to ensure that material information relating to us, including our consolidated subsidiaries, is made known to the officers who certify our financial reports and to other members of senior management and the Board of Directors.
Our management, with the participation of our principal executive officer and principal financial officer, evaluated the effectiveness of the design and operation of our disclosure controls and procedures (as defined in Rules 13a-15(e) and 15d-15(e) under the Exchange Act) as of the end of the period covered by this Annual Report on Form 10-K. Based on this evaluation, our principal executive officer and principal financial officer concluded that our disclosure controls and procedures were effective as of January 1, 2011.
|
B
|
Management's Report on Internal Control over Financial Reporting
|
Our management is responsible for establishing and maintaining adequate internal control over financial reporting, as such term is defined in Exchange Act Rules 13a-15(f). Our management conducted an evaluation of the effectiveness of our internal control over financial reporting based on the framework in Internal Control - Integrated Framework issued by the Committee of Sponsoring Organizations of the Treadway commission. Based on this evaluation under the framework in Internal control - Integrated Framework, our management concluded that our internal control over financial reporting was effective as of January 1, 2011.
This Annual Report does not include an attestation report of the Company's registered public accounting firm regarding internal control over financial reporting. Management's report was not subject to attestation by the Company's registered public accounting firm pursuant to rules of the SEC that permit the Company to provide only management's report in this Annual Report.
|
C
|
Changes in Internal Control over Financial Reporting
|
There were no changes in our internal control over financial reporting that occurred during the fourth quarter of 2010 that have materially affected, or is reasonably likely to materially affect, our internal control over financial reporting.
|
Item 9B
|
OTHER INFORMATION
|
None
41
PART III
|
Item 10
|
DIRECTORS, EXECUTIVE OFFICERS AND CORPORATE GOVERNANCE
|
See “Election of Directors,” “Corporate Governance,” “Committees of the Board of Directors” and “Section 16(a) Beneficial Ownership Reporting Compliance” in the registrant's definitive proxy statement for the 2011 annual meeting of shareholders, which sections are incorporated by reference herein. See also the “Executive Officers of the Company” section of “Business” in Item 1 of this Annual Report on Form 10-K.
We have a Code of Ethics and Business Conduct that applies to all of our employees, including our chief executive officer and senior financial and accounting officers, which meets the requirements of a “code of ethics” as defined in Item 406 of Regulation S-K. The text of our Code of Ethics and Business Conduct is posted in the Investor Relations section of our website, www.cross.com. Disclosure regarding any amendments to, or waivers from, provisions of our code of ethics and business conduct that apply to our chief executive officer and senior financial and accounting officers will be included in a Current Report on Form 8-K within four business days following the date of the amendment or waiver, unless website posting of such amendments or waivers is permitted by the rules of the NASDAQ Stock Exchange.
|
Item 11
|
EXECUTIVE COMPENSATION
|
See “Executive Compensation, Compensation Discussion and Analysis,” “Compensation Committee Report” and “Director Compensation” in the registrant's definitive proxy statement for the 2011 annual meeting of shareholders, which section is incorporated by reference herein. Such incorporation by reference shall not be deemed to specifically incorporate by reference the information referred to in Item 402(a)(8) of Regulation S-K.
|
Item 12
|
SECURITY OWNERSHIP OF CERTAIN BENEFICIAL OWNERS AND MANAGEMENT AND RELATED STOCKHOLDER MATTERS
|
See “Security Ownership of Certain Beneficial Owners and Management” in the registrant's definitive proxy statement for the 2011 annual meeting of shareholders, which section is incorporated by reference herein.
Equity Compensation Plan Information
The following table details the Company's equity compensation plans as of January 1, 2011:
|
(A)
|
(B)
|
(C)
|
||||
|
PLAN CATEGORY:
|
NUMBER OF SECURITIES
TO BE ISSUED UPON
EXERCISE OF OUTSTANDING
OPTIONS, WARRANTS
AND RIGHTS
|
WEIGHTED AVERAGE
EXERCISE PRICE OF
OUTSTANDING OPTIONS,
WARRANTS AND RIGHTS
|
NUMBER OF SECURITIES
REMAINING AVAILABLE FOR
FUTURE ISSUANCE UNDER
EQUITY COMPENSATION PLANS
(EXCLUDING SECURITIES
REFLECTED IN COLUMN (A))
|
|||
|
Equity compensation plans
|
||||||
|
approved by security holders
|
1,440,549
|
$4.54
|
87,815
|
|||
|
Equity compensation plans not
|
||||||
|
approved by security holders
|
-
|
-
|
-
|
|||
|
Total
|
1,440,549
|
$4.54
|
87,815
|
|||
|
Item 13
|
CERTAIN RELATIONSHIPS AND RELATED TRANSACTIONS, AND DIRECTOR INDEPENDENCE
|
See “Election of Directors” in the registrant's definitive proxy statement for the 2011 annual meeting of shareholders, which sections are incorporated by reference herein.
|
Item 14
|
PRINCIPAL ACCOUNTING FEES AND SERVICES
|
See “Appointment of Independent Public Accountants” and “Principal Accounting Firm Fees” in the registrant's definitive proxy statement for the 2011 annual meeting of shareholders, which sections are incorporated by reference herein.
42
PART IV
|
Item 15
|
EXHIBITS, FINANCIAL STATEMENT SCHEDULES
|
|
A
|
(1) and
|
The following consolidated financial statements of A.T. Cross Company and subsidiaries are
|
||||||
|
(2)
|
incorporated by reference to Item 8 of this Annual Report on Form 10-K:
|
|||||||
|
Report of Independent Registered Public Accounting Firm
|
||||||||
|
Consolidated Balance Sheets as of January 1, 2011 and January 2, 2010
|
||||||||
|
Consolidated Statements of Income for the Years Ended January 1, 2011,
|
||||||||
|
January 2, 2010 and January 3, 2009
|
||||||||
|
Consolidated Statements of Comprehensive Income (Loss) for the Years Ended
|
||||||||
|
January 1, 2011, January 2, 2010 and January 3, 2009
|
||||||||
|
Consolidated Statements of Changes in Shareholders' Equity for the Years Ended
|
||||||||
|
January 1, 2011, January 2, 2010 and January 3, 2009
|
||||||||
|
Consolidated Statements of Cash Flows for the Years Ended January 1, 2011,
|
||||||||
|
January 2, 2010 and January 3, 2009
|
||||||||
|
Notes to Consolidated Financial Statements
|
||||||||
|
(3) Listing of Exhibits
|
||||||||
|
EXHIBIT
|
||||||||
|
NUMBER
|
DESCRIPTION
|
|||||||
|
(3.1)
|
Restated Articles of Incorporation and By-laws (incorporated by reference to Exhibit (3) to the
|
|||||||
|
registrant's report on Form 10-K for the year ended December 31, 1980)
|
||||||||
|
(3.2)
|
Amendment to Restated Articles of Incorporation (incorporated by reference to Exhibit (3) to the
|
|||||||
|
registrant's report on Form 10-K for the year ended December 31, 1994)
|
||||||||
|
(3.3)
|
Amendment to By-laws adopted December 2, 1988 (incorporated by reference to Exhibit (3) to the
|
|||||||
|
registrant's report on Form 10-K for the year ended December 31, 1989)
|
||||||||
|
(3.4)
|
Amendment to By-laws adopted February 6, 1992 (incorporated by reference to Exhibit (3) to the
|
|||||||
|
registrant's report on Form 10-K for the year ended December 31, 1991)
|
||||||||
|
(10.1)
|
A.T. Cross Company Unfunded Excess Benefit Plan (as amended) (incorporated by reference to
|
|||||||
|
Exhibit (10.6) to the registrant's report on Form 10-K for the year ended December 31, 1994) *
|
||||||||
|
(10.2)
|
A.T. Cross Company Executive Life Insurance Program (incorporated by reference to Exhibit (10.8) to
|
|||||||
|
the Registrant's report on Form 10-K for the year ended December 31, 1997) *
|
||||||||
|
(10.3)
|
A.T. Cross Company Deferred Compensation Plan for Employee Officers and Directors (incorporated
|
|||||||
|
by Reference to Exhibit (10.4) to the registrant's report on Form 10-K for the year ended
|
||||||||
|
December 28, 2002) *
|
||||||||
|
(10.4)
|
A.T. Cross Company Deferred Compensation Plan for Non-Employee Directors (incorporated by
|
|||||||
|
reference to Exhibit (10.5) to the registrant's report on Form 10-K for the year ended
|
||||||||
|
December 28, 2002) *
|
||||||||
|
(10.5)
|
A.T. Cross Company Omnibus Incentive Plan (incorporated by reference to Exhibit (10) to the
|
|||||||
|
registrant's report on Form 10-Q for the quarterly period ended July 3, 2004) *
|
||||||||
43
|
(10.6)
|
Executive Employment Contract - Charles S. Mellen dated November 21, 2004 (incorporated by
|
||
|
reference to Exhibit (10.9) to the registrant's report on Form 10-K for the year ended January 1, 2005) *
|
|||
|
(10.7)
|
Executive Employment Contract - Kevin F. Mahoney dated January 11, 2005 (incorporated by reference
|
||
|
to Exhibit (10.10) to the registrant's report on Form 10-K for the year ended January 1, 2005) *
|
|||
|
(10.8)
|
A.T. Cross Company Long Term Incentive Plan and Severance Program for senior management
|
||
|
(incorporated by reference to the registrant's report on Form 8-K filed October 25, 2005) *
|
|||
|
(10.9)
|
Credit Agreement and first amendment with Bank of America, N.A., (incorporated by reference to
|
||
|
Exhibit (10) to the registrant's report on Form 10-Q for the quarterly period ended October 3, 2009)
|
|||
|
(10.10)
|
Second amendment to Credit Agreement with Bank of America, N.A. (incorporated by reference to
|
||
|
Exhibit (10) to the registrant's report on Form 10-K for the year ended January 3, 2009)
|
|||
|
(10.11)
|
Third amendment to Credit Agreement with Bank of America, N.A. (incorporated by reference to
|
||
|
Exhibit (10) to the registrant's report on Form 10-K for the year ended January 2, 2010)
|
|||
|
(10.12)
|
Amended and Restated Credit Agreement with Bank of America, N.A. (incorporated by reference to
|
||
|
Exhibit (10) to the registrant’s report on Form 10-Q for the quarterly period ended July 3, 2010)
|
|||
|
(11)
|
Statement Re: Computation of Net (Loss) Income per Share - (incorporated by reference to the
|
||
|
“Consolidated Statements of Income” financial statement in Item 8 of this Annual Report on
|
|||
|
Form 10-K)
|
|||
|
(21)
|
A.T. Cross Company Subsidiaries, Branches and Divisions
|
||
|
(23)
|
Consent of Independent Registered Public Accounting Firm
|
||
|
(31.1)
|
Certifications pursuant to Section 302 of the Sarbanes-Oxley Act of 2002
|
||
|
(31.2)
|
Certifications pursuant to Section 302 of the Sarbanes-Oxley Act of 2002
|
||
|
(32)
|
Certification pursuant to Section 906 of the Sarbanes-Oxley Act of 2002
|
||
|
* Management contract, compensatory plan or arrangement
|
|||
|
B
|
Exhibits - See Item A (3) above
|
||
44
SIGNATURES
Pursuant to the requirements of Section 13 or 15(d) of the Securities Exchange Act of 1934, the registrant has duly caused this report to be signed on its behalf by the undersigned, thereunto duly authorized.
|
A.T. CROSS COMPANY
(registrant)
|
|
|
By /s/
|
RUSSELL A. BOSS
(Russell A. Boss)
Chairman
|
|
Date: March 15, 2011
|
|
Pursuant to the requirements of the Securities Exchange Act of 1934, this report has been signed below by the following persons on behalf of the registrant in the capacities and on the dates indicated:
|
SIGNATURE
|
TITLE
|
DATE
|
|
/s/RUSSELL A. BOSS
(Russell A. Boss)
|
Chairman & Director
|
March 15, 2011
|
|
/s/DAVID G. WHALEN
(David G. Whalen)
|
President & Director
(Chief Executive Officer)
|
March 15, 2011
|
|
/s/KEVIN F. MAHONEY
(Kevin F. Mahoney)
|
Vice President
(Chief Financial Officer)
|
March 15, 2011
|
|
/s/GARY S. SIMPSON
(Gary S. Simpson)
|
Corporate Controller
(Chief Accounting Officer)
|
March 15, 2011
|
|
_____________________
(Bernard V. Buonanno, Jr.) |
Director
|
|
|
/s/EDWARD J. COONEY
(Edward J. Cooney)
|
Director
|
March 15, 2011
|
|
/s/DWAIN L. HAHS
(Dwain L. Hahs)
|
Director
|
March 15, 2011
|
|
____________________
(Harlan M. Kent) |
Director
|
|
|
/s/ANDREW J. PARSONS
(Andrew J. Parsons)
|
Director
|
March 15, 2011
|
45