Attached files
UNITED STATES SECURITIES AND EXCHANGE COMMISSION
Washington, D. C. 20549
|
Form 10-K
|
(Mark One)
|
[X]
|
ANNUAL REPORT PURSUANT TO SECTION 13 OR 15(d) OF THE SECURITIES EXCHANGE ACT OF 1934
|
For the fiscal year ended December 31, 2010
|
|
or
|
|
[ ]
|
TRANSITION REPORT PURSUANT TO SECTION 13 OR 15(d) OF THE SECURITIES EXCHANGE ACT OF 1934
|
|
|
For the transition period from . . . . . . . . . . . . to . . . . . . . . . . . . . .
|
|
|
Commission File No. 001-10852
|
|
|
International Shipholding Corporation
|
|
|
(Exact name of registrant as specified in its charter)
|
|
Delaware
|
36-2989662
|
|
(State or other jurisdiction of incorporation or organization)
|
|
(I.R.S. Employer Identification No.)
|
|
11 North Water St. Suite 18290 Mobile, AL
|
36602
|
|
(Address of principal executive offices)
|
(Zip Code)
|
|
|
Registrant's telephone number, including area code: (251) 243-9100
|
|
|
Securities registered pursuant to Section 12(b) of the Act:
|
|
Title of each class
|
Name of each exchange on which registered
|
|
Common Stock, $1 Par Value
|
New York Stock Exchange
|
Indicate by check mark if the registrant is a well-known seasoned issuer, as defined in Rule 405 of the Securities Act. Yes ☐ No þ
Indicate by check mark if the registrant is not required to file reports pursuant to Section 13 or Section 15(d) of the Act. Yes ☐ No þ
Indicate by check mark whether the registrant (1) has filed all reports required to be filed by Section 13 or 15(d) of the Securities Exchange Act of 1934 during the preceding 12 months (or for such shorter period that the registrant was required to file such reports), and (2) has been subject to such filing requirements for the past 90 days. Yes þ No ☐
Indicate by check mark if disclosure of delinquent filers pursuant to Item 405 of Regulation S-K is not contained herein, and will not be contained, to the best of registrant’s knowledge, in definitive proxy or information statements incorporated by reference in Part III of this Form 10-K or any amendment to this Form 10-K. ☐
Indicate by check mark whether the registrant has submitted electronically and posted on its corporate Web site, if any, every Interactive Data File required to be submitted and posted pursuant to Rule 405 of Regulation S-T during the preceding 12 months (or for such shorter period that the registrant was required to submit and post such files). Yes ☐ No ☐
Indicate by check mark whether the registrant is a large accelerated filer, an accelerated filer, a non-accelerated filer, or a smaller reporting company. See definition of “large accelerated filer”, “accelerated filer” and “smaller reporting company” in Rule 12b-2 of the Exchange Act. (Check one):
Large accelerated filer ☐ Accelerated filer þ Non-accelerated filer ☐ Smaller reporting company ☐
Indicate by check mark whether the registrant is a shell company (as defined in Rule 12b-2 of the Exchange Act). Yes ☐ No þ
State the aggregate market value of the voting common equity held by non-affiliates computed by reference to the price at which the common equity was last sold, or the average bid and asked price of such common equity, as of the last business day of the registrant’s most recently completed second fiscal quarter.
Date Amount
June 30, 2010 $119,610,127
Indicate the number of shares outstanding of each of the registrant's classes of common stock, as of the latest practicable date.
Common stock, $1 par value. . . . . . . . 7,244,986 shares outstanding as of March 3, 2011
DOCUMENTS INCORPORATED BY REFERENCE
Portions of the registrant's definitive proxy statement to be furnished in connection with registrant’s 2011annual meeting of stockholders are incorporated by reference into Part III of this Form 10-K.
INTERNATIONAL SHIPHOLDING CORPORATION
TABLE OF CONTENTS
In this report, the terms “we,” “us,” “our” and the “Company” refer to International Shipholding Corporation and its subsidiaries. In addition, the term “COA” means a Contract of Affreightment, the term “MPS” means the maritime prepositioning ship program of the U.S. Navy, the term “MSC” means the U.S. Military Sealift Command, the term “Newbuildings” means a vessel that is under construction, the term “Notes” means the Notes to our Consolidated Financial Statements contained elsewhere in this report, the term “PCTC” means a Pure Car/Truck Carrier vessel, the term “RO/RO” means a Roll-On/Roll-Off vessel, and the term “SEC” means the U.S. Securities and Exchange Commission.
General
Through our subsidiaries, we operate a diversified fleet of U.S. and International Flag vessels that provide international and domestic maritime transportation services to commercial and governmental customers primarily under medium to long-term time charters or contracts of affreightment. As of March 3, 2011 we owned or operated 33 ocean-going vessels and had seven Newbuildings on order for future delivery.
Our current operating fleet of 33 ocean-going vessels consists of:
|
·
|
Six U.S. flag Pure Car/Truck Carriers specifically designed to transport fully assembled automobiles, trucks and larger vehicles,
|
|
·
|
Three International flag Pure Car/Truck Carriers with the capability of transporting heavyweight and large dimension trucks and buses, as well as automobiles,
|
|
·
|
Two multi-purpose vessels, two container vessels and one tanker vessel, which are used to transport supplies for the Indonesian operations of a mining company,
|
|
·
|
One U.S. flag Molten Sulphur Carrier, which is used to carry molten sulphur from Texas to a processing plant on the Florida Gulf Coast,
|
|
·
|
Two special purpose vessels modified as Roll-On/Roll-Off vessels to transport loaded rail cars between the U.S. Gulf and Mexico,
|
|
·
|
One U.S. flag conveyor belt-equipped self-unloading Coal Carrier, which carries coal in the coastwise trade,
|
|
·
|
Three Roll-On/Roll-Off vessels that permit rapid deployment of rolling stock, munitions, and other military cargoes requiring special handling,
|
|
·
|
Two U.S. flag container vessels which began operating on time charters in 2008,
|
|
·
|
Three Double Hull Handy-Size Bulk Carriers, which are trading worldwide under a revenue sharing agreement with European partners,
|
|
·
|
Two Capesize Bulk Carriers trading worldwide on time charters in which we own a 50% interest of each, and
|
|
·
|
Five Mini-Bulkers trading worldwide under a commercial management agreement in which we own a 25% interest of each.
|
As described further in Item 2 below, we own 14 of these 33 vessels.
We also have the following interests in the following seven newbuildings:
|
·
|
Two Handymax Bulk Carriers newbuildings in which we own a 50% interest of each, and
|
|
·
|
Five Mini-Bulker newbuildings in which we own a 25% interest of each.
|
Our fleet is operated by our principal subsidiaries, Central Gulf Lines, Inc. (“Central Gulf”), LCI Shipholdings, Inc. (“LCI”), Waterman Steamship Corporation (“Waterman”), CG Railway, Inc. (“CG Railway”), Enterprise Ship Company, Inc. (“ESC”), and East Gulf Shipholding, Inc. (“EGS”). Other of our subsidiaries provide ship charter brokerage, agency and other specialized services.
Additional information on our vessels appears on the Fleet Statistics Schedule located in the front of our combined Annual Report and 10-K report furnished to our stockholders.
Operating Segments
We have five operating segments, Time Charter Contracts – U.S. Flag, Time Charter Contracts – International Flag, Contracts of Affreightment (“COA”), Rail-Ferry Service, and Other, as described below. Most of our revenues and gross voyage profits are contributed by our time charter contracts segment. Beginning with the second quarter Form 10-Q report, we split Time Charter Contracts into two different operating segments, Time Charter Contracts – U.S. Flag and Time Charter Contracts – International Flag. Although our previous segment reporting was appropriate, this change further aligns our segment disclosures with the information reviewed by our chief operating decision maker. In this report, we recast all prior period data for the previous Time Charter Contracts Segment based on the new operating segments.
For additional information about our operating segments and markets see Note K - Significant Operations. In addition to our five operating segments, we have investments in several unconsolidated entities of which we own 50% or less and have the ability to exercise significant influence over operating and financial activities. A sixth operating segment, Liner Services, was discontinued in 2007. During the first quarter of 2008, we sold the one remaining LASH vessel and the remaining LASH barges for scrapping and these results are reflected as discontinued operations. (See Note P – Discontinued Operations).
Time Charter Contracts-U.S. Flag: Time charters are contracts by which our charterer obtains the right for a specified period to direct the movements and utilization of the vessel in exchange for payment of a specified daily rate, but we retain operating control over the vessel. Typically, we fully equip the vessel and are responsible for normal operating expenses, repairs, crew wages, and insurance, while the charterer is responsible for voyage expenses, such as fuel, port and stevedoring expenses. Our Time Charter Contracts-U.S. Flag segment includes contracts for commercial and supplementary cargo for six PCTCs, and an electric utility for a conveyor-equipped, self-unloading Coal Carrier. Also included in this segment are contracts under which the MSC charters three RO/ROs that are under operating contracts described further below, and contracts with another shipping company for two container vessels.
Time Charter Contracts-International Flag: We operate this segment in the same manner as our Time Charter Contracts – U.S. Flag segment, except with International flagged vessels. This segment included contracts for most of 2010 with Far Eastern and South American shipping companies for three PCTCs. Also included in this segment are two multi-purpose vessels, one tanker and two container vessels, which service ISC’s long-term contract to transport supplies for a mining company’s Indonesian operations.
Contract of Affreightment: Contracts of Affreightments are contracts by which we undertake to provide space on our vessel for the carriage of specified goods or a specified quantity of goods on a single voyage or series of voyages over a given period of time between named ports or within certain geographical areas in return for the payment of an agreed amount per unit of cargo carried. Generally, we are responsible for all operating and voyage expenses. Our COA segment includes one contract, serviced by one vessel, which is for the transportation of molten sulphur through December 31, 2013, subject to additional renewal options in favor of the charterer.
Rail-Ferry Service: This service uses our two Roll-on/Roll-off Special Purpose double-deck vessels, which carry loaded rail cars between the U.S. Gulf Coast and Mexico. We began operations out of our new terminal in Mobile, Alabama and the upgraded terminal in Mexico during the third quarter of 2007. The upgrades to the Mexican terminal were made to accommodate the second decks, which were added to our vessels in the second and third quarters of 2007 to double the capacity of the vessels. (See Item 1a., Risk Factors, for a description of material risks relating to this service).
Other: This segment consists of operations that include more specialized services than the above-mentioned four segments and ship charter brokerage and agency services. Also included in the Other category are corporate related items, results of insignificant operations, and income and expense items not allocated to reportable segments.
Unconsolidated Entities. We have a 50% interest in a company that (i) owns two Cape-Size Bulk Carriers and (ii) has two Handymax Bulk Carrier Newbuildings on order for delivery in 2012. We also have a 49% interest in a company that operates the rail terminal in Coatzacoalcos, Mexico that is used by our Rail-Ferry Service, and a 50% interest in a company that owns and operates a transloading and rail and truck service warehouse storage facility in New Orleans, Louisiana. In December 2009, we acquired a 25% interest in Oslo Bulk AS (“Oslo”) for $6,250,000, which owns four newly built Mini-Bulkers and has four Mini-Bulker Newbuildings to be delivered in early 2011. In December 2009, we acquired a 25% interest in Tony Bulkers Pte Ltd (“Tony Bulkers”) for $2,269,000, which owns one newly built Mini-Bulker and has one Mini-Bulker Newbuilding to be delivered in early 2011. This investment is accounted for under the equity method and our share of earnings or losses will be reported in our consolidated statements of income net of taxes.
Business Strategy
The company operates a diversified fleet of U.S. and International Flag vessels that provide international and domestic maritime transportation services to customers primarily under medium to long-term contracts. Our business strategy consists of identifying growth opportunities as market needs change, utilizing our extensive experience to meet those needs, and continuing to maintain a diverse portfolio of medium to long-term contracts, under which we can serve our long-standing customer base by providing quality transportation services. We plan to continue this strategy by expanding our relationships with existing customers, seeking new customers, and selectively pursuing acquisitions.
Because our strategy is to seek medium to long-term contracts and because we have diversified customer and cargo bases, we believe we are generally insulated from the cyclical nature of the shipping industry to a greater degree than those companies who operate in the spot markets.
History
The Company was originally founded as Central Gulf Steamship Corporation in 1947 by the late Niels F. Johnsen and his sons, Niels W. Johnsen, a retired past CEO and Director, and Erik F. Johnsen, a past CEO and current Director of the Company. Central Gulf was privately held until 1971 when it merged with Trans Union Corporation. In 1978, International Shipholding Corporation was formed to act as a holding company for Central Gulf, LCI, and certain other affiliated companies in connection with the 1979 spin-off by Trans Union of our common stock to Trans Union’s stockholders. In 1986, we acquired the assets of Forest Lines, and in 1989 we acquired Waterman. Since our spin-off from Trans Union, we have continued to act solely as a holding company, and our only significant assets are the capital stock of our subsidiaries.
Competitive Strengths
Diversification. Our strategy for many years has been to seek and obtain contracts that provide predictable cash flows and contribute to a diversification of operations. These diverse operations vary from chartering vessels to the United States government, to chartering vessels for the transportation of automobiles, transportation of paper, steel, wood and wood pulp products, carriage of supplies for a mining company, transporting molten sulphur, transporting coal for use in generating electricity, and transporting standard size railroad cars.
Predictable Operating Cash Flows. Our operations have historically generated cash flows sufficient to cover our debt service requirements and operating expenses, including the recurring drydocking requirements of our fleet. For the years ending December 31, 2010 and December 31, 2009, approximately 62% and 47%, respectively, of our revenues were generated from fixed contracts. The length and structure of our contracts, the creditworthiness of our customers, and our diversified customer and cargo bases all contribute to our ability to consistently meet such requirements in an industry that tends to be cyclical in nature. Our medium to long-term time charters provide for a daily charter rate that is payable whether or not the charterer utilizes the vessel. These time charters generally require the charterer to pay certain voyage operating costs, including fuel, port, and stevedoring expenses, and in some cases include cost escalation features covering certain of our expenses. In addition, our COA operation guarantees a minimum amount of cargo for transportation. Our cash flow from operations was approximately $64.4 million, $62.7 million and $42.2 million for the years ended December 31, 2010, 2009 and 2008, respectively, after deducting cash used for drydocking payments of $2.5 million, $16.0 million and $4.2 million for each of those years, respectively. Regularly scheduled repayment of debt was $14.5 million, $14.2 million and $13.0 million for the years ended December 31, 2010, 2009 and 2008, respectively.
Longstanding Customer Relationships. We currently have medium to long-term time charters or contracts of affreightment with a variety of creditworthy customers. Most of these companies have been customers of ours for over ten years. Substantially all of our current cargo contracts and time charter agreements are renewals or extensions of previous agreements. In recent years, we have been successful in winning extensions or renewals of a substantial majority of all of the contracts. We believe that our longstanding customer relationships are in part due to our excellent reputation for providing quality specialized maritime service in terms of on-time performance, minimal cargo damage claims and reasonable timecharter and freight rates.
Experienced Management Team. Our management team has substantial experience in the shipping industry. Our CEO, President, and Chief Financial Officer have over 105 years of collective experience with the Company. We believe that the experience of our management team is important to maintaining long-term relationships with our customers.
Types of Service
Through our principal operating subsidiaries, we provide specialized maritime transportation services to our customers primarily under medium to long-term contracts. Our five operating segments, Time Charter Contracts – U.S. Flag, Time Charter Contracts – International Flag, Contracts of Affreightment, Rail-Ferry Service, and Other are described below. For further information on the amount of revenues and gross voyage profits contributed by each segment, please see Item 7 of this report.
I. Time Charter Contracts
Military Sealift Command Charters
We have had contracts with the MSC (or its predecessor) almost continuously for over 30 years. In 1983, Waterman was awarded a contract to operate three U.S. Flag RO/RO vessels under time charters to the MSC for use by the United States Navy in its maritime prepositioning ship (“MPS”) program. These vessels currently represent three of the 16 MPS vessels which are part of the MSC’s worldwide fleet and provide support to the U.S. Marine Corps. These ships are designed primarily to carry rolling stock and containers. One of the current agreements is set to expire by the end of March 2011. On February 24, 2011, the MSC notified us of their intent to exercise the option to extend the agreement for up to an additional four months. The remaining two agreements are set to expire in May 2011, with the MSC holding options to further extend these agreements. In July 2010, MSC notified us that we would be excluded from further consideration for extending the current operating agreements on the three U.S. Flag roll on-roll off vessels. Shortly thereafter, we protested this action and were reinstated for consideration by MSC. These three contracts represented 11.9% of our total revenue in 2010. Even if we successfully retain any one or more of these MSC contracts, we anticipate materially reduced revenues.
Pure Car/Truck Carriers
U.S. Flag. Our fleet currently includes six U.S. Flag PCTCs, of which five are owned by us and one is leased. In 1986, we entered into multi-year time charters to carry Toyota and Honda automobiles from Japan to the United States. To service these charters, we had constructed two car carriers that were specially designed to carry 4,000 and 4,660 fully assembled automobiles, respectively. Both vessels were built in Japan and were registered under the U.S. Flag. In 2000 and 2001, we replaced these two vessels with larger PCTCs, which are operating under time charters with a Japanese shipping company. On January 3, 2011 we exercised our option to purchase the one leased vessel effective July 17, 2011.
In 1998, we acquired a 1994-built PCTC, which we reflagged as a U.S. Flag vessel. After being delivered to us in April of 1998, this vessel entered a long-term charter, with the aforementioned Japanese shipping company. In 1999, we acquired a newly built PCTC, which we reflagged as a U.S. Flag vessel, which immediately after being delivered to us in September 1999 entered into a long-term charter with the same Japanese shipping company. This contract may be extended beyond the initial term at the option of the Japanese shipping company.
In 2005, we acquired a 1998-built PCTC, which we reflagged as a U.S. Flag vessel. Immediately after being delivered to us in September of 2005, we chartered this vessel to the same Japanese shipping company.
In 2007, we acquired a 2007-built PCTC, which we reflagged to U.S. Flag. Immediately after being delivered to us in September of 2007, we chartered this vessel through August of 2010 to a Far East based shipping company, which held an option to purchase the vessel at the end of the contract. On February 5, 2010, the charterer notified us of its intention to not exercise their option to purchase the vessel. Subsequently, the charterer did not exercise its purchase option, and we also negotiated a mutually acceptable early redelivery of the vessel effective February 14, 2010. The vessel is currently employed on a long-term time charter with a Japanese shipping company.
International Flag. Our current fleet includes three International Flag PCTCs. Of the three, two are owned by us and one is leased. In 1988, we had two new car carriers constructed by a shipyard affiliated with Hyundai Motor Company, each with a carrying capacity of 4,800 fully assembled automobiles, to transport Hyundai automobiles from South Korea primarily to the United States under two long-term time charters. In 1998 and 1999, we sold these car carriers and replaced them with two newly built PCTCs, each with the capacity to carry heavy and large size rolling stock in addition to automobiles and trucks. We immediately entered into long-term time charters of these vessels to a Korean shipping company. One of these PCTCs was subsequently sold to an unaffiliated party and leased back under an operating lease. On January 13, 2011 we exercised our option to purchase this vessel effective July 3, 2011.
In April 2010, we acquired a newly built 6400 Car Equivalent Units PCTC. The vessel is employed on a medium term time charter.
Under each of our international Flag PCTC contracts, the charterers are responsible for voyage operating costs such as fuel, port, and stevedoring expenses, while we are responsible for other operating expenses including crew wages, repairs, and insurance. During the terms of these charters, we are entitled to our full time charter hire irrespective of the number of voyages completed or the number of cars carried per voyage.
Coal Carrier
In 1995, we purchased an existing U.S. Flag conveyor belt-equipped, self-unloading Coal Carrier that was time-chartered to a New England electric utility to carry coal in the coastwise trade. Effective December 2010, the time charter was extended for a further period.
Southeast Asia Transportation Contract
Our contract to transport supplies for a mining company in Indonesia which commenced in 1995, is serviced by two multi-purpose vessels, a small tanker, and two container vessels. The contract was renewed in 2009. We own the tanker and manage the other four vessels.
Container Vessels
We currently operate two U.S. Flag vessels that are bareboat chartered in and time chartered out.
Bulk Carriers
We currently operate three newly built International Flag double hull Handy-Size Bulk Carriers, delivered to us in January 2011.
II. Contracts of Affreightment
In 1994, we entered into a 15-year transportation contract with an affiliate of Freeport-McMoRan Sulphur LLC for which we had built a 28,000 dead-weight ton Molten Sulphur Carrier that carries molten sulphur from Louisiana and Texas to a fertilizer plant on the Florida Gulf Coast. Under a December 2008 contract amendment, the initial term of the contract was extended. Under the terms of this contract, we are guaranteed the transportation of a minimum of 1.8 million tons of molten sulphur per year. The amended contract also gives the charterer renewal options.
III. Rail-Ferry Service
This service uses two of our special purpose vessels, which carry loaded rail cars between the U.S. Gulf and Mexico. The service provides departures every four days from Mexico and the U.S. Gulf Coast, respectively, for a three-day transit between ports. We began operations out of our new terminal in Mobile, Alabama and the upgraded terminal in Mexico during the third quarter of 2007. The upgrades to the Mexican terminal were made to accommodate the second decks added to our vessels in 2007 to double their carrying capacity. (See Item 1a., Risk Factors, for a description of material risks relating to this service).
IV. Other
Several of our subsidiaries provide ship charter brokerage, agency, and other specialized services to our operating subsidiaries and, in the case of ship charter brokerage and agency services, to unaffiliated companies. The income produced by these services substantially covers the related overhead expenses. These services facilitate our operations by allowing us to avoid reliance on third parties to provide these essential shipping services.
Marketing
We maintain marketing staffs in New York, Mobile, Singapore, and Shanghai and a network of marketing agents in major cities around the world who market our time charter and contracts of affreightment services. We market our Rail-Ferry Service under the name “CG Railway.” We market our remaining transportation services under the names Central Gulf Lines, Waterman Steamship Corporation and East Gulf Shipholding. We advertise our services in trade publications in the United States and abroad.
Insurance
We maintain protection and indemnity (“P&I”) insurance to cover liabilities arising out of our ownership and operation of vessels with the Standard Steamship Owners’ Protection & Indemnity Association (Bermuda) Ltd., which is a mutual shipowners’ insurance organization commonly referred to as a P&I club. The club is a participant in and subject to the rules of its respective international group of P&I associations. The premium terms and conditions of the P&I coverage provided to us are governed by the rules of the club.
We maintain hull and machinery insurance policies on each of our vessels in amounts related to the value of each vessel. This insurance coverage, which includes increased value and time charter hire, is maintained with a syndicate of hull underwriters from the U.S., British, Dutch, Japanese and French insurance markets. We maintain war risk insurance on each of our vessels in an amount equal to each vessel’s total insured hull value. War risk insurance is placed through U.S., British, Norwegian and French insurance markets and covers physical damage to the vessels and P&I risks for which coverage would be excluded by reason of war exclusions under either the hull policies or the rules of the P&I club. Our war risk insurance also covers liability to third parties caused by war or terrorism, but does not cover damages to our land-based assets caused by war or terrorism. (See Item 1a., Rick Factors, for a description of material risks relating to terrorism).
The P&I insurance also covers our vessels against liabilities arising from the discharge of oil or hazardous substances in U.S., international, and foreign waters, subject to various exclusions.
We also maintain loss of hire insurance with U.S., British, Dutch and French insurance markets to cover our loss of revenue in the event that a vessel is unable to operate for a certain period of time due to loss or damage arising from the perils covered by the hull and machinery policy and war risk policy.
Insurance coverage for shoreside property, shipboard consumables and inventory, spare parts, workers’ compensation, office contents, and general liability risks is maintained with underwriters in U.S. and British markets.
Insurance premiums for the coverage described above vary from year to year depending upon our loss record and market conditions. In order to reduce premiums, we maintain certain deductible and co-insurance provisions that we believe are prudent and generally consistent with those maintained by other shipping companies. Certain exclusions under our insurance policies could limit our ability to receive payment for our losses. (See Note D – Self-Retention Insurance).
Tax Matters
Under United States tax laws in effect prior to 2005, U.S. companies such as ours and their domestic subsidiaries generally were taxed on all income, which in our case includes income from shipping activities, whether operated in the United States or abroad. With respect to any foreign subsidiary in which we hold more than a 50 percent interest (referred to in the tax laws as a controlled foreign corporation, or “CFC”), we were treated as having received a current taxable distribution of our pro rata share of income derived from foreign shipping operations when earned.
The American Jobs Creation Act of 2004 (“Jobs Creation Act”), which became effective for us on January 1, 2005, changed the United States tax treatment of the foreign operations of our U.S. Flag vessels and the operations of our International Flag vessels. As a result of the Jobs Creation Act, the taxable income from the shipping operations of CFCs is not subject to United States income tax until that income is repatriated. We have a plan to re-invest indefinitely some of our foreign earnings, and accordingly have not provided deferred taxes against those earnings. As permitted under the Jobs Creation Act, we have elected to have our U.S. Flag operations (other than those of two ineligible vessels used exclusively in United States coastwise commerce) taxed under a “tonnage tax” regime rather than under the usual U.S. corporate income tax regime. Because we made the tonnage tax election in December 2004 referred to above, our gross income for United States income tax purposes with respect to our eligible U.S. Flag vessels for 2005 and subsequent years does not include (1) income from qualifying shipping activities in U.S. foreign trade (such as transportation between the U.S. and foreign ports or between foreign ports), (2) income from cash, bank deposits and other temporary investments that are reasonably necessary to meet the working capital requirements of our qualifying shipping activities, and (3) income from cash or other intangible assets accumulated pursuant to a plan to purchase qualifying shipping assets. Our taxable income with respect to the operations of our eligible U.S. Flag vessels is based on a “daily notional taxable income,” which is taxed at the highest corporate income tax rate. The daily notional taxable income from the operation of a qualifying vessel is 40 cents per 100 tons of the net tonnage of the vessel up to 25,000 net tons, and 20 cents per 100 tons of the net tonnage of the vessel in excess of 25,000 net tons. The taxable income of each qualifying vessel is the product of its daily notional taxable income and the number of days during the taxable year that the vessel operates in United States foreign trade. All other domestic operations are taxed at the U.S. corporation statutory rate.
As of December 31, 2010, our net deferred tax asset/liability was reduced to zero as a result of the establishment of a full valuation allowance with respect to our net deferred tax asset during the fourth quarter of 2010. The valuation allowance was established as a result of recent losses incurred with respect to our operations taxed at the U.S. Corporate Statutory rate. The establishment of the valuation allowance resulted in a higher effective tax rate during 2010.
Regulation
Our operations between the United States and foreign countries are subject to the Shipping Act of 1984 (the “Shipping Act”), which is administered by the Federal Maritime Commission, and certain provisions of the Federal Water Pollution Control Act, the Oil Pollution Act of 1990, the Act to Prevent Pollution from Ships, and the Comprehensive Environmental Response Compensation and Liability Act, all of which are administered by the U.S. Coast Guard and other federal agencies, and certain other international, federal, state, and local laws and regulations, including international conventions and laws and regulations of the Flag nations of our vessels. On October 16, 1998, the Ocean Shipping Reform Act of 1998 was enacted, which amended the Shipping Act to promote the growth and development of United States exports through certain reforms in the regulation of ocean transportation. This legislation, in part, repealed the requirement that a common carrier or conference file tariffs with the Federal Maritime Commission, replacing it with a requirement that tariffs be open to public inspection in an electronically available, automated tariff system. Furthermore, the legislation required that only the essential terms of service contracts be published and made available to the public.
On October 8, 1996, Congress adopted the Maritime Security Act of 1996, which created the Maritime Security Program (MSP) and authorized the payment of $2.1 million per year per ship for 47 U.S. Flag ships through the fiscal year ending September 30, 2005. This program eliminated the trade route restrictions imposed by the previous federal program and provides flexibility to operate freely in the competitive market. On December 20, 1996, Waterman entered into four MSP operating agreements with the United States Maritime Administration (“MarAd”), and Central Gulf entered into three MSP operating agreements with MarAd. We also participate in the Voluntary Intermodal Sealift Agreement (“VISA”) program administered by MarAd. Under this VISA program, and as a condition of participating in the MSP, we have committed to providing vessel capacity for the movement of military cargoes in times of war or national emergency. By law, the MSP is subject to annual appropriations from Congress. In the event that sufficient appropriations are not made for the MSP by Congress in any fiscal year, the Maritime Security Act of 1996 permits MSP participants, such as Waterman and Central Gulf, to re-flag their vessels under foreign registry expeditiously. In 2003, Congress authorized an extension of the MSP through 2015, increased the number of ships eligible to participate in the program from 47 to 60, and increased MSP payments to companies in the program, all made effective on October 1, 2005. Authorized annual payments per fiscal year for each vessel for the current MSP program were $2.6 million for years 2007 and 2008, and $2.9 million for years 2009 to 2011, and $3.1 million for years 2012 to 2015, subject to annual appropriation by the Congress, which is not assured. On October 15, 2004, Waterman and Central Gulf each filed applications to extend their MSP operating agreements for another ten years through September 30, 2015, all seven of which were effectively grandfathered in the MSP reauthorization. Simultaneously, we offered additional ships for participation in the MSP. On January 12, 2005, MarAd awarded Central Gulf four MSP operating agreements and Waterman four MSP operating agreements, effective October 1, 2005, for a net increase of one MSP operating agreement. In January of 2011, the President signed into law legislation that extends the MSP under its current terms and conditions through September 30, 2025. The terms of the MSP contracts of Waterman and Central Gulf currently run though September 30, 2015. It is anticipated that, as a result of the recent law extending the MSP for an additional ten years, MarAd will initiate a process to allow MSP contractors to submit applications to extend their current MSP contracts, but this process has not yet commenced.
Under the Merchant Marine Act, U.S. Flag vessels are subject to requisition or charter to the United States Navy’s Military Sealift Command (“MSC”) by the United States whenever the President declares that national security requires such action. The owners of any such vessels must receive just compensation as provided in the Merchant Marine Act, but there is no assurance that lost profits, if any, will be fully recovered. In addition, during any extension period under each MSC charter or contract, the MSC has the right to terminate the charter or contract on 30 days’ notice.
Certain laws governing our operations, as well as our U.S. Coastwise transportation contracts, require us to be 75% owned by U.S. citizens. We monitor our stock ownership to verify our continuing compliance with these requirements. Our certificate of incorporation allows our board of directors to restrict the acquisition of our capital stock by non-U.S. citizens. Under our certificate of incorporation, our board of directors may, in the event of a transfer of our capital stock that would result in non-U.S. citizens owning more than 23% (the “permitted amount”) of our total voting power, declare such transfer to be void and ineffective. In addition, our board of directors may, in its sole discretion, deny voting rights and withhold dividends with respect to any shares of our capital stock owned by non-U.S. citizens in excess of the permitted amount. Furthermore, our board of directors is entitled under our certificate of incorporation to redeem shares owned by non-U.S. citizens in excess of the permitted amount in order to reduce the ownership of our capital stock by non-U.S. citizens to the permitted amount.
We are required by various governmental and quasi-governmental agencies to obtain permits, licenses, and certificates with respect to our vessels. The kinds of permits, licenses, and certificates required depend upon such factors as the country of registry, the commodity transported, the waters in which the vessel operates, the nationality of the vessel’s crew, the age of the vessel, and our status as a vessel owner or charterer. We believe that we have, or can readily obtain, all permits, licenses, and certificates necessary to permit our vessels to operate.
The International Maritime Organization (“IMO”) amended the International Convention for the Safety of Life at Sea (“SOLAS”), to which the United States is a party, to require nations that are parties to SOLAS to implement the International Safety Management (“ISM”) Code. The ISM Code requires that responsible companies, including owners or operators of vessels engaged on foreign voyages, develop and implement a safety management system to address safety and environmental protection in the management and operation of vessels. Companies and vessels to which the ISM Code applies are required to receive certification and documentation of compliance. Vessels operating without such certification and documentation in the U.S. and ports of other nations that are parties to SOLAS may be denied entry into ports, detained in ports or fined. We implemented a comprehensive safety management system and obtained timely IMO certification and documentation for our companies and all of our vessels. In addition, our ship management subsidiary, LMS Shipmanagement, Inc., is certified under the ISO 9001-2008 Quality Standard.
In 2003, SOLAS was again amended to require parties to the convention to implement the International Ship and Port Facility Security (“ISPS”) Code. The ISPS Code requires owners and operators of vessels engaged on foreign voyages to conduct vulnerability assessments and to develop and implement company and vessel security plans, as well as other measures, to protect vessels, ports and waterways from terrorist and criminal acts. In the U.S., these provisions were implemented through the Maritime Transportation Security Act of 2002 (“MTSA”). These provisions became effective on July 1, 2004. As with the ISM Code, companies and vessels to which the ISPS Code applies must be certificated and documented. Vessels operating without such certification and documentation in the U.S. and ports of other nations that are parties to SOLAS may be denied entry into ports, detained in ports or fined. Vessels subject to fines in the U.S. are liable in rem, which means vessels may be subject to arrest by the U.S. government. For U.S. Flag vessels, company and vessel security plans must be reviewed and approved by the U.S. Coast Guard. We have conducted the required security assessments and submitted plans for review and approval as required, and we believe that we are in compliance in all material respects with all ISPS Code and MTSA security requirements.
The Coast Guard and Maritime Transportation Act of 2004 amended the Oil Pollution Act of 1990 (“OPA”) to require owners or operators of all non-tanker vessels of 400 gross tons or greater to develop and submit plans for responding, to the maximum extent practicable, to worst case discharges and substantial threats of discharges of oil from these vessels. This statute extends to all types of vessels of 400 gross tons or greater. The vessel response planning requirements of the OPA had previously only applied to tanker vessels. We have submitted response plans timely for our vessels, and have received Coast Guard approval for all of our vessels.
Also, under the OPA, vessel owners, operators and bareboat charterers are jointly, severally and strictly liable for all response costs and other damages arising from oil spills from their vessels in waters subject to U.S. jurisdiction, with certain limited exceptions. Other damages include, but are not limited to, natural resource damages, real and personal property damages, and other economic damages such as net loss of taxes, royalties, rents, profits or earning capacity, and loss of subsistence use of natural resources. For non-tanker vessels, the OPA limits the liability of responsible parties to the greater of $1,000 per gross ton or $854,400. The limits of liability do not apply if it is shown that the discharge was proximately caused by the gross negligence or willful misconduct of, or a violation of a federal safety, construction or operating regulation by, the responsible party, an agent of the responsible party or a person acting pursuant to a contractual relationship with the responsible party. Further, the limits do not apply if the responsible party fails or refuses to report the incident, or to cooperate and assist in oil spill removal activities. Additionally, the OPA specifically permits individual states to impose their own liability regimes with regard to oil discharges occurring within state waters, and some states have implemented such regimes.
The Comprehensive Environmental Response, Compensation, and Liability Act (“CERCLA”) also applies to owners and operators of vessels, and contains a similar liability regime for cleanup and removal of hazardous substances and natural resource damages. Liability under CERCLA is limited to the greater of $300 per gross ton or $5 million per vessel.
Under the OPA, vessels are required to establish and maintain with the U.S. Coast Guard evidence of financial responsibility sufficient to meet the highest limit of their potential liability under the act. Under Coast Guard regulations, evidence of financial responsibility may be demonstrated by insurance, surety bond, self-insurance or guaranty. An owner or operator of more than one vessel must demonstrate financial responsibility for the entire fleet in an amount equal to the financial responsibility of the vessel having greatest maximum liability under the OPA and CERCLA. We insure each of our vessels with pollution liability insurance in the amounts required by law. A catastrophic spill could exceed the insurance coverage available, in which event our financial condition and results of operations could be adversely affected.
Many countries have ratified and follow the liability plan adopted by the IMO as set out in the International Convention on Civil Liability for Oil Pollution Damage of 1969 (the “1969 Convention”) and the Convention for the Establishment of an International Fund for Oil Pollution of 1971. Under these conventions, the registered owner of a vessel is strictly liable for pollution damage caused in the territorial seas of a state party by the discharge of persistent oil, subject to certain defenses. Liability is limited to approximately $183 per gross registered ton (a unit of measurement of the total enclosed spaces in a vessel) or approximately $19.3 million, whichever is less. If a country is a party to the 1992 Protocol to the International Convention on Civil Liability for Oil Pollution Damage (the “1992 Protocol”), the maximum liability limit is $82.7 million. The limit of liability is tied to a unit of account that varies according to a basket of currencies. The right to limit liability is forfeited under the 1969 Convention when the discharge is caused by the owner's actual fault, and under the 1992 Protocol, when the spill is caused by the owner's intentional or reckless misconduct. Vessels operating in waters of states that are parties to these conventions must provide evidence of insurance covering the liability of the owner. In jurisdictions that are not parties to these conventions, various legislative schemes or common law govern. We believe that our pollution insurance policy covers the liability under the IMO regimes.
Competition
The shipping industry is intensely competitive and is influenced by events largely outside the control of shipping companies. Varying economic factors can cause wide swings in freight rates and sudden shifts in traffic patterns. Vessel redeployments and new vessel construction can lead to an overcapacity of vessels offering the same service or operating in the same market. Changes in the political or regulatory environment can also create competition that is not necessarily based on normal considerations of profit and loss. Our strategy is to reduce the effects of cyclical market conditions by operating specialized vessels in niche market segments and deploying a substantial number of our vessels under medium to long-term time contracts with creditworthy customers and on trade routes where we have established market share. We also seek to compete effectively in the traditional areas of price, reliability, and timeliness of service.
Our Time Charter Contract and Contracts of Affreightment segments primarily include medium and long-term contracts with long standing customers. While our PCTCs in our Time Charter Contract segment operate worldwide in markets where International Flag vessels with foreign crews predominate, we believe that our U.S. Flag PCTCs can compete effectively in obtaining renewals of existing contracts if we are able to continue to participate in the MSP and continue to receive cooperation from our seamen’s unions in controlling costs.
Our Rail-Ferry Service faces competition principally from companies who transport cargo over land rather than water, including railroads and trucking companies that cross land borders.
Employees
As of December 31, 2010, we employed approximately 377 shipboard personnel and 124 shoreside personnel. We consider relations with our employees to be excellent.
All of Central Gulf, Waterman, and our other U.S. shipping companies’ shipboard personnel are covered by collective bargaining agreements. Some of these agreements relate to particular vessels and have terms corresponding with the terms of their respective vessel’s charter. We have experienced no strikes or other significant labor problems during the last ten years.
Available Information
Our internet address is www.intship.com. We make available free of charge through our website our annual report on Form 10-K, proxy statement for our annual meeting of stockholders, quarterly reports on Form 10-Q, current reports on Form 8-K, and amendments to those reports filed or furnished pursuant to Section 13(a) or 15(d) of the Securities Exchange Act of 1934 as soon as reasonably practicable after we electronically file such material with, or furnish it to, the SEC. The information found on our website is not part of this or any other report.
Unless otherwise indicated, information contained in this annual report and other documents filed by us under the federal securities laws concerning our views and expectations regarding the marine transportation industry are based on estimates made by us using data from industry sources, and on assumptions made by us based on our management’s knowledge and experience in the markets in which we operate and the marine transportation industry generally. We believe these estimates and assumptions are accurate on the date made. However, this information may prove to be inaccurate because it cannot always be verified with certainty. You should be aware that we have not independently verified data from industry or other third-party sources and cannot guarantee its accuracy or completeness. Our estimates and assumptions involve risks and uncertainties and are subject to change based on various factors, including those discussed immediately below in Item 1A of this annual report.
ITEM 1A. RISK FACTORS
Our revenues decreased in 2010 and could decrease further in 2011.
Beginning in 2008, our revenues and gross voyage profits benefited from significant increases in the volume of supplemental cargos carried by our vessels. These supplemental cargoes peaked during the fourth quarter of 2009, and have decreased every quarter since then to levels comparable to 2008. If our supplemental cargo volumes continue to decrease, our revenues and gross voyage profits will be negatively impacted.
We may not be able to renew our time charters and contracts when they expire at favorable rates or at all.
During 2010, we received approximately 62% of our revenue from time charters (excluding supplemental cargoes), bareboat charters or contracts of affreightment. However, there can be no assurance that any of these charters or contracts, which are generally for periods of one year or more, will be renewed at favorable rates, or at all. Shipping rates are based on several factors that are unpredictable and beyond our control. If upon expiration of our existing charters and contracts, we are unable to obtain new charters or contracts at rates comparable to those received under the expired charters or contracts, our revenues and earnings may be adversely affected.
In particular, we cannot assure that we will be able to renew the three contracts we have with the MSC that are currently scheduled to end in March and May 2011. These three contracts represented 11.9% of our total revenue in 2010.
We operate in a highly competitive industry.
The shipping industry is intensely competitive and can be influenced by economic and political events that are outside the control of shipping companies. We compete with companies that have greater resources than we have, or who may be better positioned to adapt to changes in market or economic conditions. Consequently, there can be no assurance that we will be able to deploy our vessels on economically attractive terms, maintain attractive freight rates, pass cost increases through to our customers or otherwise successfully compete against our competitors. Any failure to remain competitive in the shipping industry could have an adverse effect on our results of operations and financial condition.
Changes in the demand for our services or vessels could cause our charter and cargo rates to decline, which could have a material adverse effect on our revenues and earnings.
Historically, the shipping industry has been cyclical. The nature, timing and degree of changes to industry conditions are generally unpredictable and may adversely affect the values of our assets or our financial performance. Various factors influence the demand for our transportation services, including worldwide demand for the products we carry and changes in the supply and demand of vessels. The worldwide supply of vessels generally increases with deliveries of new, refurbished or converted vessels and decreases with the scrapping of older vessels. If the available supply of vessels exceeds the number of vessels being scrapped, vessel capacity and competition in the markets where we operate may increase. In the absence of a corresponding increase in the demand for these vessels, the charter hire and cargo rates for our vessels could fluctuate significantly and result in, among other things, lower operating revenues and reduced earnings.
If Congress does not make sufficient appropriations under the Maritime Security Act of 1996, we may not continue to receive certain payments.
If Congress does not make sufficient appropriations under the Maritime Security Act of 1996 in any fiscal year, we may not continue to receive annual payments with respect to certain of our vessels that we have committed to the federal government under the U.S. Maritime Security Program. Under this program, each participating vessel received an annual payment of $2.9 million in 2009 and 2010. These vessels are eligible to receive $2.9 million in year 2011, and $3.1 million in years 2012 to 2015. As of December 31, 2010, eight of our vessels operated under contracts issued under this program. Since payments under this program are subject to annual appropriations by Congress and are not guaranteed, we cannot assure you that we will continue to receive these annual payments, in full or in part.
We cannot assure that we will be able to comply with all of our loan covenants.
Substantially all of our credit agreements require us to comply with various loan covenants, including financial covenants that stipulate minimum levels of net worth and maximum amounts of debt leverage. We are currently evaluating several alternatives designed to alleviate potential covenant breaches that we project could otherwise arise in the near future based on current operating trends. While we currently believe that we have available options to prevent or mitigate such breaches, we cannot assure that we will be able to implement them timely or at all, or that they will enable us to meet all of our current covenants
Recent turmoil in the credit markets could negatively impact our business, results of operations, financial condition or liquidity, or those of our customers.
Our operations are affected by local, national and worldwide economic conditions and the condition of the shipping industry in general. Over the last couple of years, worldwide economic conditions have experienced a significant downturn as a result of, among other things, the failure of several financial institutions, slower overall economic activity, fluctuations in commodity prices, and other adverse business conditions and related concerns. Any continuation or worsening of these trends could ultimately have a negative impact on our financial performance and condition, including our ability to borrow money from current credit sources or secure additional financing to fund our ongoing operations.
We are subject to certain risks with respect to our counterparties on contracts, and failure of such counterparties to meet their obligations could cause us to suffer losses or otherwise adversely affect our business.
The ability of our counterparties to perform their obligations under their contracts with us will depend upon a number of factors that are beyond our control and may include, among other things, general economic conditions and the overall financial condition of these counterparties, especially in light of the recent global financial crisis. If our counterparties fail to honor their obligations under their agreements with us, we could sustain significant losses or a reduction in our vessel usage, both of which could have an adverse effect on our financial condition, results of operations and cash flows.
Older vessels have higher operating costs and are potentially less desirable to charterers.
The average age of the vessels in our fleet that we own or lease is approximately 12 years, including the average age of our owned and leased Pure Car/Truck Carrier Fleet, which is approximately 10 years. In general, capital expenditures and other costs necessary for maintaining a vessel in good operating condition increase and become more difficult to estimate with accuracy as the age of the vessel increases. Moreover, customers generally prefer modern vessels over older vessels, which places the older vessels at a competitive disadvantage, especially in weak markets. In addition, changes in governmental regulations, compliance with classification society standards and customer requirements or competition may require us to make additional expenditures for alternations or the addition of new equipment. In order to make such alterations or add such equipment, we may be required to take our vessels out of service, thereby reducing our revenues. Expenditures such as these may also require us to incur additional debt or raise additional capital. There can be no assurance that market or general economic conditions will enable us to replace our existing vessels with new vessels, justify the expenditures necessary to maintain our older vessels in good operating condition or enable us to operate our older vessels profitably during the remainder of their estimated useful lives.
Our Rail-Ferry Service has a history of losses, and we can give no assurances as to its future profitability.
This service began operating in February of 2001 and has been unprofitable every year except 2008, when the two vessels used to provide this service averaged approximately 75% capacity utilization. Beginning in 2009, the worldwide economic downturn negatively impacted the volumes and cargo rates for this service, especially on its northbound route to the U.S. As a result of a reduction in future anticipated cash flows generated by this service, we recognized a non-cash impairment charge of $25.4 million in the third quarter of 2010 to reduce the carrying value of these assets to their estimated fair value. We cannot assure you that this service will be operated profitably in the future, however even at unprofitable levels, the service remains cash positive.
We are subject to the risk of continuing high prices, and increasing prices, of the fuel we consume in our Rail-Ferry operations.
We are exposed to commodity price risks with respect to fuel consumption in our Rail-Ferry operations, and we can give no assurance that we will be able to offset higher fuel costs due to the competitive nature of these operations. Although we currently have fuel surcharges in place, a material increase in current fuel prices that we cannot recover through these fuel cost surcharges could adversely affect our results of operations and financial condition.
Our business and operations are highly regulated, which can adversely affect our operations.
Our business and the shipping industry in general are subject to increasingly stringent laws and regulations governing our vessels, including worker’s health and safety, and the staffing, construction, operation, insurance and transfer of our vessels. Compliance with or the enforcement of these laws and regulations could have an adverse effect on our business, results of operations or financial condition. For example, in the event of war or national emergency, our U.S. Flag vessels are subject to requisition by the U.S. government. Although we would be entitled to compensation in the event of a requisition of one or more of our vessels, the amount and timing of such payments would be uncertain and there would be no guarantee that such amounts would be paid, or if paid, would fully satisfy lost profits associated with the requisition.
In addition, we are required by various governmental and quasi-governmental agencies to obtain and maintain certain permits, licenses and certificates with respect to our operations. In certain instances, the failure to obtain or maintain these authorizations could have an adverse effect on our business. We may also be required to periodically modify operating procedures or alter or introduce new equipment for our existing vessels to appropriately respond to changes in governmental regulation.
Our operations are also subject to laws and regulations related to environmental protection. Compliance with these laws and regulations can be costly. Failure to comply with these laws and regulations may result in penalties, sanctions or, in certain cases, the ultimate suspension or termination of our operations. Additionally, some environmental laws impose strict and, under certain circumstances, joint and several liability for remediation of spills and the release of hazardous materials. As a result, we could become subject to liability irrespective of fault or negligence. These laws and regulations may also expose us to liability for the conduct of or conditions caused by our charterers or other parties.
Terrorist attacks, piracy and international hostilities can affect the transportation industry, which could adversely affect our business.
Terrorist attacks or piracy attacks against merchant ships, particularly in the Gulf of Aden and off the East Coast of Africa, the outbreak of war, or the existence of international hostilities could damage the world economy, adversely affect the availability of and demand for transportation services, and adversely affect our ability to profitably operate and deploy our vessels. We operate in a sector of the economy that we believe is particularly likely to be adversely impacted by the effects of political instability, terrorist attacks, war, international hostilities or piracy.
Marine transportation is inherently risky, and insurance may be insufficient to cover losses that may occur to our assets or result from our operations.
The operation of our vessels are subject to inherent risks, such as: (i) catastrophic marine disaster; (ii) adverse weather conditions; (iii) mechanical failure; (iv) collisions; (v) hazardous substance spills; (vi) seizure or expropriation of our vessels by governments, pirates, combatants or others; and (vii) navigation and other human errors. The occurrence of any of these events may result in, among other things, damage to or loss of our vessels and our vessels' cargo or other property, delays in delivery of cargo, damage to other vessels and the environment, loss of revenues, termination of vessel charters or other contracts, fines or other restrictions on conducting business, damage to our reputation and customer relationships, and injury to personnel. Such occurrences may also result in a significant increase in our operating costs or liability to third parties. In addition, such occurrences may result in our company being held strictly liable for pollution damages under the Oil Pollution Act of 1990, the Comprehensive Environmental Response Compensation and Liability Act or one of the international conventions to which our vessels operating in foreign waters may be subject.
Although we maintain insurance coverage against most of these risks at levels our management considers to be customary in the industry, risks may arise for which we are not adequately insured. Additionally, any particular claim may not be covered by our policies, or may be subject to deductibles, the aggregate amount of which could be material. Any uninsured or underinsured loss could have an adverse effect on our financial performance or condition. We also make no assurances that we will be able to renew our existing insurance coverage at commercially reasonable rates or that such coverage will be adequate to cover future claims that may arise.
Additionally, certain of our insurance coverage is maintained through mutual “protection and indemnity” associations. As a mutual club, a substantial portion of its continued viability to effectively manage liability risks is reliant upon the premiums paid by its members. As a member of such associations, we may incur the obligation to satisfy payments in addition to previously established or budgeted premiums to the extent member claims would surpass the reserves of the association. We may be subject to calls or premiums in amounts based not only on our own claim records, but also the claim records of all other members over which we have no control. Our payment of these calls could result in significant additional expenses.
We are subject to risks associated with operating internationally.
Our international shipping operations are subject to risks inherent in doing business in countries other than the United States. These risks include, among others: (i) economic, political and social instability; (ii) potential vessel seizure, terrorist attacks, piracy, kidnapping, the expropriation of assets and other governmental actions, many of which are not covered by our insurance; (iii) currency restrictions and exchange rate fluctuations; (iv) potential submission to the jurisdiction of a foreign court or arbitration panel; (v) pandemics or epidemics that disrupt worldwide trade or the movement of vessels; (vi) import and export quotas; and (vii) the imposition of unanticipated or increased taxes, increased environmental and safety regulations or other forms of public and governmental regulation that increase our operating expenses. Many of these risks are beyond our control, and we cannot predict the nature or the likelihood of the occurrence or corresponding affect of any such events, each of which could have an adverse effect on our financial condition and results of operations.
Our vessels could be seized by maritime claimants, which could result in a significant loss of earnings and cash flow for the related off-hire period.
Crew members, suppliers of goods and services to a vessel, shippers of cargo and other parties may be entitled to a maritime lien against a vessel for unsatisfied debts or claims for damages. In many jurisdictions, a maritime lienholder may enforce its lien by either arresting or attaching a vessel through foreclosure proceedings. The arrest or attachment of one or more of our vessels could result in a significant loss of earnings and cash flow during the detainment period.
In addition, international vessel arrest conventions and certain national jurisdictions allow so-called “sister ship” arrests, that allow the arrest of vessels that are within the same legal ownership as the vessel which is subject to the claim or lien. Certain jurisdictions go further, permitting not only the arrest of vessels within the same legal ownership, but also any “associated” vessel. In nations with these laws, an “association” may be recognized when two vessels are owned by companies controlled by the same party. Consequently, a claim may be asserted against us or any of our subsidiaries or our vessels for the liability of one or more of the other vessels we own. While we have insurance coverage for these types of claims, we cannot guarantee it will cover all of our potential exposure.
A substantial number of our shipboard employees are unionized. In the event of a strike or other work stoppage, our business and operations may be adversely affected.
As of December 31, 2010, approximately 76% of our 377 shipboard personnel were unionized employees covered by collective bargaining agreements. Given the prevalence of maritime trade unions and their corresponding influence over its members, the shipping industry is vulnerable to work stoppages and other potentially disruptive actions by employees. We may also have difficulty successfully negotiating renewals to our collective bargaining agreements with these unions or face resistance to any future efforts to place restrains on wages, reduce labor costs or moderate work practices. Any of these events may result in strikes, work disruptions and have other potentially adverse consequences. While we have experienced no strikes, work stoppages or other significant labor problems during the last ten years, we cannot assure that such events will not occur in the future or be material in nature. In the event we experience one or more strikes, work stoppages or other labor problems, our business and, in turn, our results of operations may be adversely affected.
The market value of vessels fluctuates significantly, which could adversely affect our liquidity, result in breaches of our financing agreements or otherwise adversely affect our financial condition.
The market value of vessels fluctuates over time. The fluctuation in market value of vessels over time is based upon various factors, including:
|
·
|
age of the vessel,
|
|
·
|
general economic and market conditions affecting the transportation industry, including the availability of vessel financing,
|
|
·
|
number of vessels in the world fleet,
|
|
·
|
types and sizes of vessels available,
|
|
·
|
changes in trading patterns affecting demand for particular sizes and types of vessels,
|
|
·
|
cost of newbuildings,
|
|
·
|
prevailing levels of charter rates,
|
|
·
|
competition from other shipping companies and other modes of transportation, and
|
|
·
|
technological advances in vessel design and propulsion.
|
Declining values of our vessels could adversely affect our liquidity by limiting our ability to raise cash by refinancing vessels. Declining vessel values could also result in a breach of loan covenants or trigger events of default under relevant financing agreements that require us to maintain certain loan-to-value ratios. In such instances, if we are unable or unwilling to pledge additional collateral to offset the decline in vessel values, our lenders could accelerate our debt and foreclose on our vessels pledged as collateral for the loans.
Delays or cost overruns in building new vessels (including the failure to deliver new vessels) could harm us.
Building new vessels is subject to risks of delay (including the failure to timely deliver new vessels to customers) or cost overruns caused by one or more of the following:
|
·
|
financial difficulties of the shipyard building a vessel, including bankruptcy,
|
|
·
|
unforeseen quality or engineering problems,
|
|
·
|
work stoppages,
|
|
·
|
weather interference,
|
|
·
|
unanticipated cost increases,
|
|
·
|
delays in receipt of necessary materials or equipment,
|
|
·
|
changes to design specifications, and
|
|
·
|
inability to obtain the requisite permits, approvals or certifications from governmental authorities and the applicable classification society upon completion of work.
|
Significant delays, cost overruns and failure to timely deliver new vessels to customers could adversely affect us in several ways, including delaying the implementation of our business strategies or materially increasing our expected contract commitments to customers.
We face periodic drydocking costs for our vessels, which can be substantial.
Vessels must be drydocked periodically for regulatory compliance and for maintenance and repair. Our drydocking requirements are subject to associated risks, including delay and cost overruns, lack of necessary equipment, unforeseen engineering problems, employee strikes or other work stoppages, unanticipated cost increases, inability to obtain necessary certifications and approvals and shortages of materials or skilled labor. A significant delay in drydockings could have an adverse effect on our contract commitments. The cost of repairs and renewals required at each drydock are difficult to predict with certainty and can be substantial. Our insurance does not cover these costs.
Some of our employees are covered by laws limiting our protection from exposure to certain claims.
Some of our employees are covered by several maritime laws, statutes and regulations which circumvent and nullify certain liability limits established by state workers’ compensation laws, including provisions of the Jones Act, the Death on the High Seas Act, and the Seamen’s Wage Act. We are not generally protected by the limits imposed by state workers’ compensation statutes for these particular employees, and as a result our exposure for claims asserted by these employees may be greater than would otherwise be the case.
We are subject to the control of our principal stockholders.
As of March 3, 2011, three of our directors, Erik F. Johnsen, Niels M. Johnsen and Erik L. Johnsen, and their respective family members and affiliated entities, beneficially owned an aggregate of 24.36% of our common stock. Niels M. Johnsen and Erik L. Johnsen are also executive officers of the Company, and their respective fathers are former executive officers. Erik F. Johnsen continued to provide consulting services to us through December 31, 2010. As a result, the Johnsen family may have the ability to exert significant influence over our affairs and management, including the election of directors and other corporate actions requiring stockholder approval.
As a holding company with no operations of our own, we rely on payments from our operating companies to meet our obligations.
As a holding company without any material assets or operations, substantially all of our income and operating cash flow is dependent upon the earnings of our subsidiaries and the distribution of those earnings to us or upon loans or other payments of funds by those subsidiaries to us. As a result, we rely upon our subsidiaries to generate the funds necessary to meet our obligations, including the payment of amounts owed under our long-term debt. The ability of our subsidiaries to generate sufficient cash flow from operations to allow us and them to make scheduled payments on our respective obligations will depend on their future financial performance, which will be affected by a range of economic, competitive and business factors, many of which are outside of our control. Additionally, our subsidiaries are separate and distinct legal entities and have no obligation to pay any amounts owed by us or, subject to limited exceptions for tax-sharing purposes, to make any funds available to us to pay dividends or to repay our debt or other obligations. Our rights to receive assets of any subsidiary upon its liquidation or reorganization will also be effectively subordinated to the claims of creditors of that subsidiary, including trade creditors. The footnotes to our consolidated financial statements incorporated by reference herein describe these matters in additional detail.
The agreements governing certain of our debt instruments impose restrictions on our business.
The agreements governing certain of our debt instruments contain a number of covenants imposing restrictions on our business. The restrictions these covenants place on us include limitations on our ability to: (i) consolidate or merge; (ii) incur new debt; (iii) engage in transactions with affiliates; (iv) create or permit to exist liens on our assets: and (v) in the case of a breach in certain financial covenants, pay cash dividends. These agreements also require us to attain a number of financial ratios that measure our financial position and performance. Our ability to satisfy these and other covenants depends on our results of operations and ability to respond to changes in business and economic conditions. Several of these matters are beyond our control or may be significantly restricted, and, as a result, we may be prevented from engaging in transactions that otherwise might be considered beneficial to us and our common stockholders.
In addition, as our debt obligations are represented by separate agreements with different lenders, in some cases the breach of any of these covenants or other default under one agreement may create an event of default under other agreements, resulting in the acceleration of our obligation to pay principal, interest and potential penalties under such other agreements (even though we may otherwise be in compliance with all of our obligations under those agreements). Thus, an event of default under a single agreement, including one that is technical in nature or otherwise not material, could result in the acceleration of significant indebtedness under multiple lending agreements. If amounts outstanding under such agreements were to be accelerated, there can be no assurance that our assets would be sufficient to generate sufficient cash flow to repay the accelerated indebtedness, or that our lenders would not proceed against the collateral securing that indebtedness.
We are highly leveraged when considering commitments under operating leases.
Our leverage could have material adverse consequences for us, including:
|
·
|
hindering our ability to adjust to changing market, industry or economic conditions,
|
|
·
|
limiting our ability to access the capital markets to refinance maturing debt or to fund acquisitions of vessels or businesses,
|
|
·
|
limiting the amount of free cash flow available for future operations, dividends, stock repurchases or other uses,
|
|
·
|
making us more vulnerable to economic or industry downturns, including interest rate increases, and
|
|
·
|
placing us at a competitive disadvantage to those of our competitors that have less indebtedness.
|
In connection with executing our business strategies, from time to time we evaluate the possibility of acquiring additional vessels or businesses, and we may elect to finance such acquisitions by incurring additional indebtedness. Moreover, if we were to suffer uninsured material losses or liabilities, we could be required to raise substantial additional capital to fund liabilities that we could not pay with our free cash flow. Our ability to arrange additional financing will depend on, among other factors, our financial position and performance, as well as prevailing market conditions and other factors beyond our control. We cannot assure you that we will be able to obtain additional financing on terms acceptable to us or at all. If we are able to obtain additional financing, our credit may be adversely affected and our ability to satisfy our obligations under our current indebtedness could be adversely affected.
We have a Yen-denominated loan and volatility in the USD/Yen exchange rate could cause material adjustments to the earnings we report each quarter.
We have a Yen-denominated loan of Yen 5,102,500,000 which as of December 31, 2010 converted to a USD $61.8 million liability at a USD/Yen exchange rate of $1 to Yen 81.22. As described further in our periodic SEC reports, current accounting guidelines require us to record adjustments to our earnings each quarter based on changes in exchange rates. Volatility in the USD/Yen exchange rate could cause material adjustments to the earnings we report each quarter.
Repeal, amendment, suspension or failure to enforce the Jones Act could have an adverse affect on our business and results of operations.
A portion of our shipping operations are conducted in the U.S. coastwise trade. Under the Jones Act, this trade is restricted to vessels built in the United States, owned and manned by U.S. citizens and registered under U.S. law. Our failure to comply with these restrictions could subject us to severe penalties, including the permanent loss of the right to engage in U.S. coastwise trade. If the Jones Act were repealed, substantially amended or waived, it could potentially result in additional competition from vessels built in generally lower-cost foreign shipyards and owned and manned by foreign nationals, which could have an adverse effect on our business, results of operations and financial condition. We cannot assure you that the Jones Act will not be repealed or modified.
Loss of our senior management or other key personnel could have an adverse effect on our business, financial condition and results of operations.
Our future success will depend, in significant part, upon the continued services of our senior management team and other key personnel, especially those of our CEO, President, and Chief Financial Officer, who have substantial experience in the shipping industry and over 105 years of collective experience with us. We believe that the experience of our senior management team is a vital component to maintain long-term relationships with our customers. The loss of the services of any of these individuals could adversely affect our future operating results, and we may have to incur significant costs to find sufficient replacements for them, if available.
We are susceptible to severe weather and natural disasters.
Given the nature and scope of our operations, we are constantly vulnerable to disruption as a result of adverse weather conditions, including hurricanes, typhoons, earthquakes and other natural disasters. These type of events may, among other things, (i) hinder our ability to effectively and timely provide scheduled service to our customers whether due to damage to our properties, to our customers’ operations, or to dock or other transportation facilities; (ii) interfere with our terminal operations; (iii) damage our vessels and equipment; or (iv) result in injury or death to our employees. Any of these factors, especially to the extent not fully covered by insurance, could have an adverse affect on our business, financial condition and results of operation.
We cannot assure that we will have the necessary funds to pay dividends on our common stock or we may elect not to pay dividends on our common stock in the future.
While our Board currently plans to continue our dividend program, our stockholders may not receive additional dividends in the future for reasons that may include, without limitation, any of the following factors:
|
·
|
we may not have enough cash to pay such dividends due to changes in our cash requirements, capital or vessel spending plans, strategic objectives, cash flow or financial position,
|
|
·
|
debt covenants and corporate law limitations could restrict our ability to pay dividends, or the ability of our subsidiaries to pay dividends to us, and
|
|
·
|
the actual amount of dividends distributed and the decision to make any distribution remains at all times entirely at the discretion of our Board of Directors, who are free to change or suspend our dividend program at any time.
|
Our common stockholders should be aware that they have no contractual or other legal right to dividends.
We may be required to contribute cash to meet our obligations under certain multi-employer pension plans.
Domestically, we participate in and make periodic contributions to various multi-employer pension plans under union and industry-wide agreements that generally provide defined benefits to employees covered by collective bargaining agreements. Absent an applicable exemption, a contributor to a multi-employer plan is liable, upon termination or withdrawal from the plan, for its proportionate share of the plan’s underfunded vested liability. Funding requirements for benefit obligations of our pension plans are subject to certain regulatory requirements and we may be required to make cash contributions which may be material to one or more of these plans to satisfy certain underfunded benefit obligations. Information from the plans’ administrators is not readily available to permit us to determine whether there may be unfunded vested benefits.
We are exposed to risks arising out of tax audits.
As a significant taxpayer, we are subject to frequent and regular audits and examinations by the Internal Revenue Service, as well as state and local tax authorities. These tax audits and examinations may result in tax liabilities that differ materially from those that we have recorded in our consolidated financial statements. Because the ultimate outcomes of these matters are uncertain, we can give no assurance as to whether an adverse result from one or more of them will have a material effect on our financial results
We are exposed to risks arising out of recent legislation affecting U.S. public companies, including risks relating to evaluations of controls required by Section 404 of the Sarbanes-Oxley Act.
Changing laws, regulations and standards relating to corporate governance and public disclosure, including the Sarbanes-Oxley Act and the Dodd-Frank Wall Street Reform and Consumer Protection Act, and related regulations implemented by the SEC, the New York Stock Exchange and the Public Company Accounting Oversight Board, are increasing legal and financial compliance costs and making some activities more time consuming. Any future failure to successfully or timely complete annual assessments of our internal controls required by Section 404 of the Sarbanes-Oxley Act could subject us to sanctions or investigation by regulatory authorities. Any such action could adversely affect our financial results or investors’ confidence in us, and could cause our stock price to fall. If we fail to maintain effective controls and procedures, we may be unable to provide financial information in a timely and reliable manner, which could in certain instances limit our ability to borrow or raise capital.
If conditions or assumptions differ from the judgments, assumptions or estimates used in our critical accounting policies, the accuracy of our financial statements and related disclosures could be affected.
The preparation of financial statements and related disclosures in conformity with U.S. generally accepted accounting principles requires us to make judgments, assumptions and estimates that affect the amounts reported in our consolidated financial statements and accompanying notes. For a discussion of our critical accounting policies, see “Management’s Discussion and Analysis of Financial Condition and Results of Operations – Critical Accounting Policies and Estimates” in Item 7 of our most recent annual report on Form 10-K incorporated herein by reference. If future events or assumptions differ significantly from the judgments, assumptions and estimates in our critical accounting policies, these events or assumptions could have a material impact on our consolidated financial statements and related disclosures.
Other Risks
We face other risks.
The list of risks above is not all inclusive, and you should be aware that we face various other risks.
ITEM 1B. UNRESOLVED STAFF COMMENTS
None
ITEM 2. PROPERTIES
Vessels
Of the 33 ocean-going vessels operating in our fleet at March 3, 2011, and seven Newbuildings presently on order for future delivery, fourteen were 100% owned by us, four were 50% owned by us, ten were 25% owned by us, seven were leased, bareboat chartered or time chartered by us, and five were operated by us under operating contracts.
Under governmental regulations, insurance policies, and certain of our financing agreements and charters, we are required to maintain our vessels in accordance with standards of seaworthiness, safety, and health prescribed by governmental regulations or promulgated by certain vessel classification societies. We have implemented the quality and safety management program mandated by the IMO and have obtained certification of all vessels currently required to have a Safety Management Certificate. We seek to maintain our vessels in accordance with governmental regulations and the highest classification standards of the International Association of Classification Societies Ltd.
Certain of the vessels owned by our subsidiaries are mortgaged to various lenders to secure such subsidiaries’ long-term debt (See Note C - Long-Term Debt).
Other Properties
We lease our corporate headquarters in Mobile, Alabama, our administrative, sales and chartering office in New York, our administrative office in Singapore, which was reestablished on October 1, 2009, and our agency and chartering office in Shanghai. In 2010, the aggregate annual rental payments under these operating leases totaled approximately $1.5 million.
ITEM 3. LEGAL PROCEEDINGS
We have been named as a defendant in numerous lawsuits claiming damages related to occupational diseases, primarily related to asbestos and hearing loss. We believe that most of these claims are without merit, and that insurance and the indemnification of a previous owner of one of our subsidiaries mitigate our exposure. (For additional information, See Note H – Commitments and Contingencies.)
In the normal course of our operations, we become involved in various litigation matters including, among other things, claims by third parties for alleged property damages, personal injuries and other matters. While the outcome of such claims cannot be predicted with certainty, we believe that our insurance coverage and reserves with respect to such claims are adequate and that such claims should not have a material adverse effect on our business or financial condition. (For additional information, See Note H – Commitments and Contingencies.)
On June 23, 2009, a complaint was filed in U.S. District Court of Oregon by ten plaintiffs against approximately 40 defendants, including Waterman Steamship Corporation, which is one of our wholly owned subsidiaries. The suit was filed for contribution and recovery of both past and future cost associated with the investigation and remediation of the Portland Harbor Superfund Site. Based on our preliminary review to date, we believe we have no exposure, but our exposure, if any, would be limited to an insurance deductible which we believe would be immaterial.
We do not believe, based on current knowledge, that any of the foregoing legal proceedings or claims are likely to have a material adverse effect on our financial position, results of operations or cash flows, although we cannot provide any assurances to this effect.
ITEM 4. [Reserved]
ITEM 5. MARKET FOR REGISTRANT'S COMMON EQUITY, RELATED STOCKHOLDER MATTERS AND ISSUER PURCHASES OF EQUITY SECURITIES
Market Information
Our common stock is listed on the New York Stock Exchange and is traded under the symbol ISH. The following table sets forth the high and low sales prices, along with the quarterly dividends, for each of the quarters indicated.
|
2009
|
High
|
Low
|
Paid
|
|||
|
1st Quarter
|
$ 25.96 |
$ 16.43
|
$ 0.50/Share
|
|||
|
2nd Quarter
|
27.62
|
17.72
|
$ 0.50/Share
|
|||
|
3rd Quarter
|
32.96
|
23.93
|
$ 0.50/Share
|
|||
|
4th Quarter
|
36.84
|
28.01
|
$ 0.50/Share
|
|||
|
Dividends
|
||||||
|
2010
|
High
|
Low
|
Paid
|
|||
|
1st Quarter
|
$ 32.25
|
$ 26.06
|
$ 0.50/Share
|
|||
|
2nd Quarter
|
32.43
|
20.87
|
$ 0.375/Share
|
|||
|
3rd Quarter
|
28.93
|
20.64
|
$ 0.375/Share
|
|||
|
4th Quarter
|
29.49
|
23.82
|
$ 0.375/Share
|
|||
As described in greater detail in Item 1A of this report, the declaration and payment of dividends is at the discretion of our Board of Directors, and will depend upon our financial results, cash requirements, future prospects and other factors deemed relevant by the Board of Directors.
As of March 3, 2011, there were approximately 413 stockholders of record of our common stock. As of March 3, 2011, the closing stock price of our common stock was $24.09.
Performance Graph
The following graph compares the cumulative total shareholder return of our Common Stock to that of the S&P 500 Index and an Industry Peer Group (which consists of Overseas Shipholding Group, Diana Shipping Inc, Alexander & Baldwin, Inc., and Eagle Bulk Shipping Inc) for the Corporation's last five fiscal years.
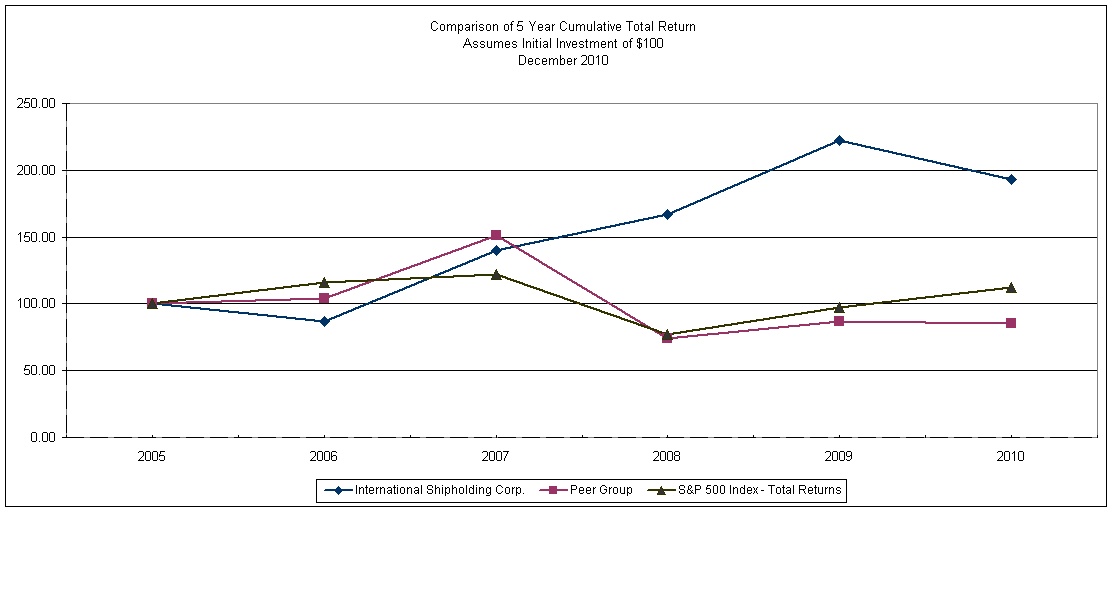
*Assumes $100 invested at the close of trading on the last trading day in 2005 in ISH common stock, the S&P 500, and the Industry Peer Group. Also assumes reinvestment of dividends.
December 31,
|
2005
|
2006
|
2007
|
2008
|
2009
|
2010
|
|
|
ISH --♦--
|
$100.00
|
$ 86.76
|
$140.02
|
$166.62
|
$221.96
|
$193.26
|
|
S&P --▲--
|
$100.00
|
$115.79
|
$122.16
|
$ 76.97
|
$ 97.33
|
$112.00
|
|
Peer Group --■--
|
$100.00
|
$104.24
|
$151.13
|
$ 73.87
|
$ 86.81
|
$ 85.09
|
In accordance with New York Stock Exchange rules, Niels M. Johnsen, our Chief Executive Officer, has certified to the NYSE that, as of May 24, 2010, he was not aware of any violation by us of the NYSE’s corporate governance listing standards. The certification is to be submitted to the NYSE each year no later than 30 days after our annual stockholders meeting.
The Chief Executive Officer and Chief Financial Officer certifications required for 2010 by Section 302 of the Sarbanes-Oxley Act of 2002 are included as exhibits to this Form 10-K.
Equity Compensation Plans
The information in Item 12 of this annual report regarding equity compensation plans is incorporated herein by reference.
Stock Repurchases
The information in Item 12 of this annual report regarding our stock repurchases in incorporated herein by reference.
ITEM 6. SELECTED FINANCIAL DATA
|
INTERNATIONAL SHIPHOLDING CORPORATION
|
||||||||||||
|
SUMMARY OF SELECTED CONSOLIDATED FINANCIAL DATA
|
||||||||||||
|
The following summary of selected consolidated financial data is not covered by the auditors' report appearing elsewhere herein. However,
|
||||||||||||
|
in the opinion of management, the summary of selected consolidated financial data includes all adjustments necessary for a fair representation of
|
||||||||||||
|
each of the years presented.
|
||||||||||||
|
This summary should be read in conjunction with the consolidated financial statements and the notes thereto appearing elsewhere in this annual
|
||||||||||||
|
report.
|
||||||||||||
|
(All Amounts in Thousands Except Share and Per Share Data)
|
||||||||||||
|
Year Ended December 31,
|
||||||||||||
|
2010
|
2009
|
2008 (2)
|
2007
|
2006
|
||||||||
|
Income Statement Data (1):
|
||||||||||||
|
Revenues (3)
|
$290,049
|
$379,951
|
$281,901
|
$218,113
|
$ 203,498
|
|||||||
|
Impairment Loss (4)
|
25,430
|
2,899
|
369
|
-
|
8,866
|
|||||||
|
Gross Voyage Profit
|
37,343
|
61,120
|
41,693
|
28,776
|
19,054
|
|||||||
|
Operating Income
|
16,183
|
36,270
|
20,279
|
10,630
|
1,445
|
|||||||
|
Income from Continuing Operations
|
15,302
|
42,221
|
34,222
|
11,792
|
18,194
|
|||||||
|
Net Income Available to Common Stockholders
|
15,302
|
42,221
|
38,961
|
15,016
|
14,648
|
|||||||
|
Basic and Diluted Earnings Per Common Share (5):
|
||||||||||||
|
Net Income Available to Common Stockholders - Basic
|
2.14
|
5.84
|
|
4.67
|
1.48
|
2.58
|
||||||
|
Net Income Available to Common Stockholders - Diluted
|
2.12
|
5.80
|
|
4.56
|
1.41
|
2.24
|
||||||
|
Balance Sheet Data:
|
||||||||||||
|
Working Capital
|
15,094
|
40,538
|
50,506
|
23,189
|
3,024
|
|||||||
|
Total Assets
|
544,123
|
496,650
|
434,111
|
440,655
|
428,042
|
|||||||
|
Long-Term Debt, Less Current Maturities
|
||||||||||||
|
(including Capital Lease Obligations)
|
200,241
|
97,635
|
126,841
|
130,523
|
98,984
|
|||||||
|
Convertible Exchangeable Preferred Stock
|
-
|
-
|
-
|
37,554
|
37,554
|
|||||||
|
Stockholders' Investment
|
233,750
|
238,931
|
205,192
|
173,702
|
153,736
|
|||||||
|
Other Data:
|
||||||||||||
|
Cash Flow from Operations
|
64,387
|
62,681
|
42,185
|
20,231
|
22,981
|
|||||||
|
Cash Flow from Investing Activities
|
(114,876)
|
(79,776)
|
41,434
|
(2,180)
|
27,532
|
|||||||
|
Cash Flow from Financing Activities
|
27,179
|
12,728
|
(45,887)
|
(48,221)
|
(22,418)
|
|||||||
|
Cash Dividends Per Share of Common Stock
|
1.625
|
2.00
|
0.50
|
-
|
-
|
|||||||
|
Weighted Average Shares of Common Stock Outstanding:
|
||||||||||||
|
Basic
|
7,158,439
|
7,224,748
|
7,314,216
|
6,360,208
|
6,116,036
|
|||||||
|
Diluted
|
7,231,178
|
7,282,119
|
7,501,555
|
8,369,473
|
8,122,578
|
|||||||
|
(1)
|
During 2007, the decision was made to discontinue our LASH Liner Service. As a result, the LASH Liner Service results were removed from continuing operations and reclassified into Discontinued Operations for all years presented above.
|
|||||||||||
|
(2)
|
Includes income from the sale of a Dry Bulk vessel, of which we owned a 50% share.
|
|||||||||||
|
(3)
|
Starting with the filing of our Form 10-Q for the quarterly period ended March 31, 2009, we began to report our revenues and voyage expenses for our supplemental cargoes on our U.S. flag Pure Car Truck Carriers on a gross basis. All periods presented includes a reclassification for grossing up of our revenues and voyage expenses. This reclassification does not change what we previously reported for gross voyage profit, net income or earnings per share. The reclassification applies only to the reporting of revenues and voyage expenses for carriage of our supplemental cargo on our U.S. flag Pure Car Truck Carriers which is part of our Time Charter Segment.
|
|||||||||||
|
(4)
|
During the third quarter of 2010, we recorded a non-cash impairment loss of $25.4 million on two of our Roll-on/Roll-off special purpose vessels included in our Rail Ferry Service segment. In 2009, the segment began to feel the impact of the current economic recession and reported lower than expected gross voyage profit results. The lower results were further dampened by the loss of one of the segment’s largest customers in December of 2009. As a result, the Company has routinely performed an impairment test in prior periods and determined based on the projected results it could recover the carrying value of the assets. However, based on the challenge to replace the major customer lost in 2009, a lack of improvement throughout 2010, and no improvement expected in the short term for the segment’s operating results, the Company determined that the cash flows expected to be generated by the long-lived assets of its Rail-Ferry segment are less than the carrying amount of these assets. The fair value of these assets was estimated based upon an independent third party appraiser (Level 2 inputs).
|
|||||||||||
|
During the second quarter of 2009 we recorded a non-cash impairment loss of $2.9 million on one of our International flag container vessels included in our Time Charter Contracts segment. This charge was the result of the termination of our Time Charter agreement on the vessel upon the mutual agreement with our customer. We agreed to the early termination in exchange for an increase in charter hire on the other International flag container vessel remaining under timecharter.
|
||||||||||||
|
Results for 2006 reflect an Impairment Loss of approximately $8.9 million. This non-cash charge was made to write down our investment in the terminal located in New Orleans, Louisiana utilized in our Rail-Ferry Service. This service relocated its U.S. operations during 2007 to Mobile, Alabama, where a new terminal was constructed.
|
||||||||||||
|
(5)
|
Basic and diluted earnigns per common share from continuing operations.
|
|||||||||||
ITEM 7. MANAGEMENT'S DISCUSSION AND ANALYSIS OF FINANCIAL CONDITION AND RESULTS OF OPERATIONS
NOTICE REGARDING FORWARD-LOOKING STATEMENTS
This report on Form 10-K and other documents filed or furnished by us under the federal securities law include, and future oral or written statements or press releases by us and our management may include, forward-looking statements within the meaning of the safe harbor provisions of the Private Securities Litigation Reform Act of 1995, and as such may involve known and unknown risks, uncertainties, and other factors that may cause our actual results to be materially different from the anticipated future results expressed or implied by such forward-looking statements. Forward-looking statements may include the words “may,” “will,” “estimate,” “intend,” “continue,” “believe,” “expect,” “plan,” “anticipate,” “project,” “seek,” “hope,” “should” or “could” and other similar words.
Our forward-looking statements are based upon our judgment and assumptions as of the date such statements are made concerning future developments and events, many of which are outside of our control. These forward looking statements, and the assumptions upon which such statements are based, are inherently speculative and are subject to uncertainties that could cause our actual results to differ materially from such statements. Important factors that could cause our actual results to differ materially from our expectations include, but are not limited to, those which may be set forth in this prospectus supplement, the accompanying prospectus and the documents incorporated by reference herein and therein.
Such statements include, without limitation, statements regarding (1) anticipated future operating and financial performance, financial position and liquidity, growth opportunities and growth rates, acquisition and divestiture opportunities, business prospects, regulatory and competitive outlook, investment and expenditure plans, investment results, pricing plans, strategic alternatives, business strategies, and other similar statements of expectations or objectives; (2) estimated fair values of capital assets, the recoverability of the cost of those assets, the estimated future cash flows attributable to those assets, and the appropriate discounts to be applied in determining the net present values of those estimated cash flows; (3) estimated scrap values of assets; (4) estimated proceeds from selling assets and the anticipated cost of constructing or purchasing new or existing vessels; (5) estimated fair values of financial instruments, such as interest rate, commodity and currency swap agreements; (6) estimated losses (including independent actuarial estimates) under self-insurance arrangements, as well as estimated gains or losses on certain contracts, trade routes, lines of business or asset dispositions; (7) estimated losses attributable to asbestos claims or other litigation; (8) estimated obligations, and the timing thereof, relating to vessel repair or maintenance work; (9) the adequacy of our capital resources and the availability of additional capital resources on commercially acceptable terms; (10) our ability to remain in compliance with our debt covenants; (11) anticipated trends in government sponsored cargoes; (12) our ability to effectively service our debt; (13) financing opportunities and sources (including the impact of financings on our financial position, financial performance or credit ratings); (14) changes in laws, regulations or tax rates, or the outcome of pending legislative or regulatory initiatives; and (15) assumptions underlying any of the foregoing.
Important factors that could cause our actual results to differ materially from our expectations include our ability to:
|
·
|
identify customers who require marine transportation services or vessels offered by us,
|
|
·
|
secure financing on satisfactory terms to repay existing debt or support operations, including to acquire, modify, or construct vessels if such financing is necessary to service the potential needs of current or future customers,
|
|
·
|
maximize the usage of our vessels and other assets on favorable economic terms,
|
|
·
|
manage the amount and rate of growth of our administrative and general expenses and costs associated with operating our vessels,
|
|
·
|
manage our growth in terms of implementing internal controls and information systems and hiring or retaining key personnel, among other things, and
|
|
·
|
effectively handle our substantial leverage by servicing and meeting the covenant requirements in each of our debt instruments, thereby avoiding any defaults under those instruments and avoiding cross defaults under others.
|
|
·
|
Other factors that could cause actual results to differ materially from our expectations include, without limitation:
|
|
·
|
unanticipated changes in vessel utilization or cargo rates, or in charter hire, fuel, or other operating expenses,
|
|
·
|
the rate at which competitors add or scrap vessels, as well as demolition scrap prices and the availability of scrap facilities in the areas in which we operate,
|
|
·
|
changes in interest rates, which could increase or decrease the amount of interest we incur on our variable rate debt and the availability and cost of capital to us,
|
|
·
|
the impact on our financial statements of nonrecurring accounting charges that may result from our ongoing evaluation of business strategies, asset valuations, and organizational structures,
|
|
·
|
changes in accounting policies and practices adopted voluntarily or as required by accounting principles generally accepted in the United States,
|
|
·
|
changes in laws and regulations such as those related to government assistance programs and tax rates,
|
|
·
|
the frequency and severity of claims against us, and unanticipated outcomes of current or possible future legal proceedings,
|
|
·
|
unexpected out-of-service days on our vessels whether due to unplanned maintenance or other causes,
|
|
·
|
the ability of customers to fulfill their obligations with us,
|
|
·
|
the performance of unconsolidated subsidiaries,
|
|
·
|
political events in the United States and abroad, including terrorism and piracy, and the U.S. military's response to those events,
|
|
·
|
election results, regulatory activities and the appropriation of funds by the U.S. Congress,
|
|
·
|
changes in foreign currency exchange rates, and
|
|
·
|
other economic, competitive, governmental, and technological factors which may affect our operations.
|
Due to these uncertainties, we cannot assure that we will attain our anticipated results, that our judgments or assumptions will prove correct, or that unforeseen developments will not occur. Accordingly, you are cautioned not to place undue reliance upon any of our forward-looking statements, which speak only as of the date made. Additional risks that we currently deem immaterial or that are not presently known to us could also cause our actual results to differ materially from those expected in our forward-looking statements. Except for meeting our ongoing obligations under the federal securities laws, we undertake no obligation to update or revise for any reason any forward-looking statements made by us or on our behalf, whether as a result of new information, future events or developments, changed circumstances or otherwise.
For additional information, see the description of our business included above in Item 1 of this report, as well as Item 7 of this report below.
CRITICAL ACCOUNTING POLICIES
Set forth below is a discussion of the accounting policies and related estimates that we believe are the most critical to understanding our consolidated financial statements, financial condition, and results of operations and which require complex management judgments or estimates and entail material uncertainties. Information regarding our other accounting policies is included in the Notes to Consolidated Financial Statements appearing elsewhere herein.
Voyage Revenue and Expense Recognition
Revenues and expenses relating to our Rail-Ferry Service segment voyages are recorded over the duration of the voyage. Our voyage expenses are estimated at the beginning of the voyages based on historical actual costs or from industry sources familiar with those types of charges. As the voyage progresses, these estimated costs are revised with actual charges and timely adjustments are made. The expenses are allocated over the voyage based on the number of days in progress at the end of the period. We believe there is no material difference between recording estimated expenses ratably over the voyage versus recording expenses as incurred. Revenues and expenses relating to our other segments' voyages, which require no estimates or assumptions, are recorded when earned or incurred during the reporting period.
Depreciation
Provisions for depreciation are computed on the straight-line method based on estimated useful lives of our depreciable assets. Various methods are used to estimate the useful lives and salvage values of our depreciable assets. Due to the capital intensive nature of our business and our large base of depreciable assets, changes in such estimates could have a material effect on our results of operations.
Drydocking Costs
We defer certain costs related to the drydocking of our vessels. Deferred drydocking costs are capitalized as incurred and amortized on a straight-line basis over the period between drydockings (generally two to five years). Because drydocking charges can be material in any one period, we believe that the acceptable deferred method provides a better matching for the amortization of those costs over future revenue periods benefiting from the drydocking of our vessel. We capitalize only those costs that are incurred to meet regulatory requirements or upgrades, or that add economic life to the vessel. Normal repairs, whether incurred as part of the drydocking or not, are expensed as incurred.
Income Taxes
Income taxes are accounted for in accordance with ASC Topic 740-10. Provisions for income taxes include deferred income taxes that are provided on items of income and expense, which affect taxable income in one period and financial income in another. Certain foreign operations are not subject to income taxation under pertinent provisions of the laws of the country of incorporation or operation. However, pursuant to existing U.S. tax laws, earnings from certain of our foreign operations are subject to U.S. income taxes when those earnings are repatriated to the U.S. We intend to permanently re-invest $12,583,000, $3,051,000 and $24,135,000 of our 2010, 2009 and 2008 foreign earnings, respectively, and accordingly, have not provided deferred taxes against those earnings. As described further in Item 1 of this report, the Jobs Creation Act, which first applied to us on January 1, 2005, changed the United States tax treatment of the foreign operations of our U.S. flag vessels and our international flag shipping operations. We made an election under the Jobs Creation Act to have our qualifying U.S. flag operations taxed under a “tonnage tax” rather than under the usual U.S. corporate income tax regime.
We account for uncertain tax positions in accordance with ASC Topic 740-10-05. ASC 740-10-05 clarifies the accounting for income taxes by prescribing the minimum recognition threshold a tax position is required to meet before being recognized in the financial statements. ASC 740-10-05 also provides guidance on derecognition, measurement, classification, interest and penalties, accounting in interim periods, disclosure and transition.
As of December 31, 2010, our net deferred tax asset/liability was reduced to zero as a result of the establishment of a full valuation allowance with respect to our net deferred tax asset during the fourth quarter of 2010. The valuation allowance was established as a result of recent losses incurred with respect to our operations taxed at the U.S. Corporate Statutory rate. The establishment of the valuation allowance resulted in a higher effective tax rate during 2010.
Self-Retention Insurance
We maintain provisions for estimated losses under our self-retention insurance based on estimates of the eventual claims settlement costs. Our estimates are determined based on various factors, such as (1) severity of the injury (for personal injuries) and estimated potential liability based on past judgments and settlements, (2) advice from legal counsel based on its assessment of the facts of the case and its experience in other cases, (3) probability of pre-trial settlement which would mitigate legal costs, (4) historical experience on claims for each specific type of cargo (for cargo damage claims), and (5) whether our seamen are employed in permanent positions or temporary revolving positions. It is reasonably possible that changes in our estimated exposure may occur from time to time. The measurement of our exposure for self-insurance liability requires management to make estimates and assumptions that affect the amount of loss provisions recorded during the reporting period. Actual results could differ materially from those estimates.
Asbestos Claims
We maintain provisions for estimated losses for asbestos claims based on estimates of eventual defense and settlement costs. Our policy is to establish provisions based on a range of estimated exposure. We estimate this potential range of exposure using input from legal counsel and internal estimates based on the individual deductible levels for each policy year. We believe that insurance and the indemnification of a previous owner of one of our wholly-owned subsidiaries will partially mitigate our exposure. The measurement of our exposure for asbestos liability requires management to make estimates and assumptions that affect the amount of the loss provisions recorded during the period. Our estimates and assumptions are formed from variables such as the maximum deductible levels in a claim year, the amount of the indemnification recovery and the claimant's employment history with the company. Actual results could differ materially from those estimates.
Derivative Instruments and Hedging Activities
Under ASC Topic 815-10, in order to consider a derivative instrument as a hedge, (i) we must designate the instrument as a hedge of future transactions, and (ii) the instrument must reduce our exposure to the applicable risk. If the above criteria are not met, we must record the fair market value of the instrument at the end of each period and recognize the related gain or loss through earnings. If the instrument qualifies as a hedge, net settlements under the agreement are recognized as an adjustment to earnings, while changes in the fair market value of the hedge are recorded through Stockholders’ Investment in Other Comprehensive Income (Loss). We currently employ, or have employed in the recent past, interest rate swap agreements, foreign currency contracts, and commodity swap contracts.
Pension and Postretirement Benefits
Our pension and postretirement benefit costs are calculated using various actuarial assumptions and methodologies as prescribed by ASC Topic 715-10-15. These assumptions include discount rates, health care cost trend rates, inflation rates, rate of compensation increases, expected return on plan assets, mortality rates, and other factors. We believe that the assumptions utilized in recording the obligations under our plans are reasonable based on input from our outside actuary and information as to historical experience and performance. Differences in actual experience or changes in assumptions may affect our pension and postretirement obligations and future expense.
We account for our pension and post retirement benefit plans in accordance with ASC Topic 715-30-35. This statement requires balance sheet recognition of the overfunded or underfunded status of pension and postretirement benefit plans. Under ASC Topic 715-30-35, actuarial gains and losses, prior service costs or credits, and any remaining transition assets or obligations that have not been recognized under previous accounting standards must be recognized in Other Comprehensive Income, net of tax effects, until they are amortized as a component of net periodic benefit cost. In addition, the measurement date, the date at which plan assets and the benefit obligation are measured, is required to be the company’s fiscal year end.
Impairment of Long-Lived Assets
We review the carrying amounts of our vessels for possible impairment when events or circumstances indicate that the carrying value of a particular vessel may not be recoverable. The carrying values of the our vessels may not represent their fair market value at any point in time because the market prices of vessels tend to fluctuate with changes in charter rates, second hand vessel sales and the cost of newbuildings. We record impairment losses only when events occur that cause us to believe that future cash flows for any individual vessel will be less than its carrying value. In such instances, we would recognize an impairment charge in the period in which that determination is made if the estimate of the undiscounted future cash flows expected to result from the use of the vessel and its eventual disposition is less than the vessel’s carrying amount. In developing estimates of future cash flows, we must make assumptions about future charter rates, ship operating expenses, and the estimated remaining useful lives of the vessels. These assumptions are based on historical trends as well as future expectations. Although management believes that the assumptions used to evaluate potential impairment are reasonable and appropriate, such assumptions are highly subjective. For information on recent fixed asset impairment charges, see “ – Liquidity and Capital Resources – Rail-Ferry Service.”
Impairment of Investments
Our holdings in marketable securities are classified as available-for-sale and are thus carried on the balance sheet at fair value with changes in carrying value recorded in accumulated other comprehensive income/(loss) until the investments are sold. We review these investments for impairment when there is evidence that fair value may be below the carrying cost. We write down an investment if fair value is below the carrying cost and the impairment is other than temporary. If we determine that a material decline in fair value below the carrying cost is other than temporary, we would record a noncash impairment loss in our consolidated statement of income in the period in which that determination is made. The carrying value of that security would then be written down to its fair value at the end of that period, establishing a new cost basis. In determining the fair value of an investment and assessing whether any identified impairment is other than temporary, we use significant estimates and considerable judgments. Although management believes that the assumptions used to evaluate potential impairment are reasonable and appropriate, such assumptions are highly subjective. For information on recent investment impairment charges, see the discussion of our “Other Income and Expenses” for 2010, 2009 and 2008 appearing below.
EXECUTIVE SUMMARY
Overview of 2010
Overall Strategy
The company operates a diversified fleet of U.S. and International Flag vessels that provide international and domestic maritime transportation services to customers primarily under medium to long-term contracts. Our business strategy consists of identifying growth opportunities as market needs change, utilizing our extensive experience to meet those needs, and continuing to maintain a diverse portfolio of medium to long-term contracts, under which we can serve our long-standing customer base by providing quality transportation services.
2010 Consolidated Financial Performance
Overall adjusted net income decreased from $45.1 million in 2009 to $40.7 million for 2010, excluding impairment charges of $2.9 million in 2009 and $25.4 million in 2010, respectively (as described further in the Non-GAAP reconciliation table below). The decrease of $4.4 million can be attributed to i) a decrease in gross profits of $1.3 million, ii) a non-cash foreign exchange loss in 2010 of $8.2 million on our Yen facility debt and iii) a decrease in our tax benefits of $2.2 million; partially offset by (iv) a decrease in administrative and general expenses of $1.4 million, (v) a $2.2 million increase in income from unconsolidated entities and (vi) a loss on the sale of assets occurring in 2009 of $2.2 million.
Key 2010 developments include the following:
|
§
|
Decrease in consolidated gross voyage profit was primarily due to a drop in supplemental cargo income partially offset by income from the addition of an international flagged PCTC in the first quarter of 2010.
|
|
§
|
Decrease in overhead expenses of $1.4 million was primarily due to a charge in 2009 related to the repayment of incentive awards to governmental agencies.
|
|
§
|
Non-cash foreign exchange loss was due to the strengthening of the Yen to U.S. Dollar exchange ratio from 92.46 at year end 2009 to 81.22 at year end 2010.
|
|
§
|
Lower tax benefits were due to changes in the valuation allowance on our deferred tax assets.
|
|
§
|
Increase in income from our unconsolidated entities was primarily due to a gain on the sale of the one remaining Panamax bulk carrier in 2010.
|
|
§
|
A decrease in 2010 of our depreciation and amortization costs (discussed further in Note W) had the effect of increasing our 2010 net income by $3.7 million, or $.51 per share.
|
Segment Performance
Time Charter Contracts- U.S. Flag
§ Decrease in gross profits from $54.7 million in 2009 to $48.3 million in 2010.
§ Decrease in our supplemental cargo volumes.
Time Charter Contracts- International Flag
|
§
|
Improved gross profit results of $9.6 million.
|
|
§
|
Delivery of new PCTC in the first quarter of 2010.
|
Contract of Affreightment
|
§
|
Decrease in gross profits of $2.8 million primarily due to a scheduled freight rate reduction.
|
Rail-Ferry
|
§
|
Overall improvement in gross profit of $1.0 million, excluding $25.4 million impairment charge in 2010.
|
§ Continued to operate at maximum capacity on southbound voyages.
§ Improvements in northbound volumes at the end of 2010.
Other
|
§
|
Net income from unconsolidated entities increased by $2.3 million mainly due to the sale of the one remaining Panamax bulk carrier in the first quarter of 2010.
|
Financial Discipline & Strong Balance Sheet
|
§
|
Operating cash flow increased from $62.7 million in 2009 to $64.4 million in 2010.
|
|
§
|
Temporary decrease in working capital (Current Assets less Current Liabilities) from $40.5 million at year end 2009 to $15.1 million for year end 2010 due to final construction payments on three Handy-Size Bulk Carriers delivered in January 2011. Permanent financing replenished the installment payments in early 2011.
|
|
§
|
Cash dividend payments of $1.625 per share for the fiscal year.
|
Non-GAAP Financial Measures
In Management’s Discussion and Analysis of Financial Condition and Results of Operations, we refer to adjusted net income and adjusted gross voyage profit, which excludes non-cash impairment charges on fixed assets. We believe this is useful information to investors because it provides comparable information with respect to our financial condition and results of operations excluding such non-cash charges. The following table provides a reconciliation of net income to adjusted net income and gross voyage profit to adjusted gross voyage profit.
|
(All amounts in thousands)
|
For the Year Ended
|
|||||||
|
December 31,
|
||||||||
|
2010
|
2009
|
|||||||
|
Gross Voyage Profit
|
$ | 37,343 | $ | 61,120 | ||||
|
Impairment Charge
|
25,430 | 2,899 | ||||||
|
Adjusted Gross Voyage Profit
|
$ | 62,773 | $ | 64,019 | ||||
|
Net Income
|
$ | 15,302 | $ | 42,221 | ||||
|
Impairment Charge
|
25,430 | 2,899 | ||||||
|
Adjusted Net Income
|
$ | 40,732 | $ | 45,120 | ||||
YEAR ENDED DECEMBER 31, 2010
COMPARED TO YEAR ENDED DECEMBER 31, 2009
|
|
|
|||||||||||||||||||||||
|
(All Amounts in Thousands)
|
Time Charter Contracts-
U.S. Flag
|
Time Charter Contracts-International Flag
|
COA
|
Rail-Ferry Service
|
Other
|
Total
|
||||||||||||||||||
|
2010
|
||||||||||||||||||||||||
|
Revenues from External Customers
|
$ | 197,311 | $ | 47,208 | $ | 16,283 | $ | 26,672 | $ | 2,575 | $ | 290,049 | ||||||||||||
|
Voyage Expenses
|
139,269 | 29,588 | 16,930 | 22,648 | 912 | 209,347 | ||||||||||||||||||
|
Vessel Depreciation
|
9,755 | 2,982 | - | 5,181 | 11 | 17,929 | ||||||||||||||||||
|
Impairment Charge
|
- | - | - | 25,430 | - | 25,430 | ||||||||||||||||||
|
Gross Voyage Profit (Loss)
|
48,287 | 14,638 | (647 | ) | (26,587 | ) | 1,652 | 37,343 | ||||||||||||||||
|
Adjusted Gross Voyage Profit (Loss)
|
48,287 | 14,638 | (647 | ) | (1,157 | ) | 1,652 | 62,773 | ||||||||||||||||
|
2009
|
||||||||||||||||||||||||
|
Revenues from External Customers
|
$ | 279,879 | $ | 50,966 | $ | 18,046 | $ | 27,891 | $ | 3,169 | $ | 379,951 | ||||||||||||
|
Voyage Expenses
|
211,850 | 41,501 | 15,827 | 24,585 | 1,915 | 295,678 | ||||||||||||||||||
|
Vessel Depreciation
|
13,368 | 1,407 | - | 5,468 | 11 | 20,254 | ||||||||||||||||||
|
Impairment Loss
|
- | 2,899 | - | - | - | 2,899 | ||||||||||||||||||
|
Gross Voyage Profit (Loss)
|
54,661 | 5,159 | 2,219 | (2,162 | ) | 1,243 | 61,120 | |||||||||||||||||
|
Adjusted Gross Voyage Profit (Loss)
|
54,661 | 8,058 | 2,219 | (2,162 | ) | 1,243 | 64,019 | |||||||||||||||||
The following table shows the breakout of Revenues by segment between fixed and variable for the years 2010 and 2009, respectively:
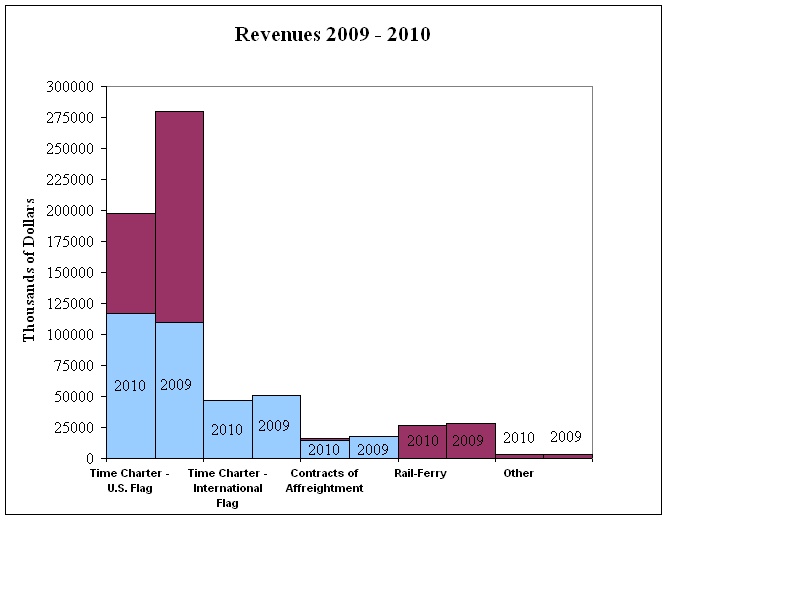
o Variable Revenue o Fixed Revenue
Adjusted gross voyage profit represents gross voyage profit excluding non-cash impairment charges on fixed assets (as described further under “Non-GAAP Financial Measures” above). Beginning with the second quarter 2010, we split Time Charter Contracts operations into two different operating segments, U.S. Flag and International Flag. The changes of revenue and expenses associated with each of our segments are discussed within the gross voyage analysis below.
Time Charter Contracts-U.S. Flag: The decrease in this segment’s gross voyage profit from $54.7 million in 2009 to $48.2 million in 2010 is primarily due to the decrease in the carriage of supplemental cargoes on our U.S. Flag Pure Car Truck Carriers, which is partially offset by the reduction in 2010 in depreciation expense on our U.S. Flag Coal Carrier from extending its economic life to match the extension of the vessel’s time charter contract. Gross revenues for the segment decreased from $279.9 million in 2009 to $197.3 million in 2010 primarily as a result of the decrease in supplemental cargoes. Our fixed revenues of $117.1 million in 2010 and $109.5 million in 2009 represent revenues derived from our fixed time charter contracts, and our variable revenues of $80.2 million in 2010 and $170.4 million in 2009 represent revenues derived from our supplemental cargoes.
Time Charter Contracts-International Flag: The increase in this segment’s gross voyage profit from $8.1 million in 2009 to $14.6 million in 2010 is primarily due to more operating days on vessels servicing our Indonesian customer, and the initial employment of a newly constructed PCTC commencing in late March 2010. Revenues for the segment decreased from $51.0 million in 2009 to $47.2 million in 2010 due to vessels with lower profit margins ending their service in late 2009 and early 2010.
Contract of Affreightment: The decrease in this segment’s gross voyage profit from $2.2 million in 2009 to a loss of $647,000 in 2010 was primarily due to a decrease in revenues due to a contractually scheduled freight rate adjustment. Although the current results for the segment have decreased, the benefit from a 2007 sale leaseback is reflected in a lower consolidated effective tax rate.
Rail-Ferry Service: Adjusted gross voyage profit improved from a $2.2 million loss in 2009 to a $1.2 million loss for 2010, excluding a $25.4 million impairment charge recognized in 2010 on the segment’s two Roll-on/Roll-off Special Purpose double deck vessels. This improvement is mainly due to reduced amortization costs (which are discussed further in Note W). In December 2009, we were notified by one of our major Northbound customers of their intention to discontinue using the service effective immediately sighting a sourcing decision as their reason for the change. We were able to offset this loss partially with additional Northbound volumes driven by our service being used as an alternative source of transportation resulting from outages in Mexico’s cross border rail service and a negotiated retroactive settlement to reduce our port costs.
We based the aforementioned non-cash impairment charge taken in the third quarter of 2010 on our determination that the cash flows expected to be generated by the long-lived assets of the Rail-Ferry segment were less than the carrying amount of these assets due partially to the challenge of replacing a major customer lost in late 2009.
Other: Gross voyage profit for this segment increased from $1.2 million in 2009 to $1.7 million in 2010. This was primarily due to an increase in chartering brokerage income.
Other Income and Expenses
Administrative and general expenses (A&G) decreased 6% from $22.6 million in 2009 to $21.2 million in 2010. An increase in executive stock compensation was offset by a charge in 2009 related to the repayment of certain incentives received from various Alabama agencies.
The following table shows the significant A&G components for the twelve months ending December 31, 2010 and 2009 respectively:
|
(All amounts in thousands)
|
Year Ended December 31,
|
|||||||||||
|
A&G Account
|
2010
|
2009
|
Variance
|
|||||||||
|
Wages and Benefits
|
$ | 10,172 | $ | 10,142 | $ | (30 | ) | |||||
|
Executive Stock Compensation
|
2,342 | 1,834 | (508 | ) | ||||||||
|
Professional Services
|
2,639 | 2,627 | (12 | ) | ||||||||
|
Office Building Expense
|
1,444 | 1,292 | (152 | ) | ||||||||
|
Other
|
4,605 | 6,270 | 1,665 | |||||||||
|
Consulting Fees*
|
- | 476 | 476 | |||||||||
|
TOTAL:
|
$ | 21,202 | $ | 22,641 | $ | 1,439 | ||||||
* Fees associated with unaffiliated company’s offer to purchase the Company.
Interest Expense increased from $6.1 million in 2009 to $7.2 million in 2010 due to (i) entering into a new loan agreement in the third quarter of 2009 to finance the purchase of two Multi-Purpose vessels that were subsequently sold to an Indonesian company and (ii) higher interest expense due to the incurrence of bank indebtedness in 2010 to fund the final installment owed on our International Flag PCTC Newbuilding.
Derivative Loss in 2010 represents the ineffective portion of a derivative contract and the related mark-to-market adjustment associated with this portion of the derivative. (See Foreign Currency Exchange Rate Risk on page 38.)
Investment (Income) Loss improved from a loss of $72,000 in 2009 to income of $1.8 million in 2010 due to other than temporary impairment losses taken on certain investments in 2009, higher average cash balances in the first quarter 2010 and higher average balances of interest-bearing debt securities.
Other Income from Vessel Financing increased from $655,000 in 2009 to $2.3 million in 2010 due to interest earned on a note receivable on vessels sold to an Indonesian company in the third quarter of 2009.
Foreign Exchange Loss in 2010 reflects the strengthening of the Japanese Yen against the U.S. Dollar related to the non-cash revaluation of our Yen denominated loan facility associated with the financing of our International Flag PCTC delivered in March 2010. (See Item 1A Risk Factors.)
Income Taxes
For 2010, we recorded a benefit for income taxes of $1.3 million on $4.7 million of income from continuing operations before income from unconsolidated entities, reflecting tax losses on operations taxed at the U.S. corporate statutory rate. For 2009, our benefit was $3.5 million on $31.7 million of income from continuing operations before income from unconsolidated entities. Our tax benefit decreased from the comparable prior year primarily as a result of improved gross profits of the Company’s U.S. Flag Coal Carrier and establishment of a valuation allowance with respect to our net deferred tax asset as discussed below.
As a result of the recent losses on operations taxed at the U.S. corporate statutory rate, we are unable to rely on projections of future taxable income in assessing the realizability of the deferred tax assets associated with such operations. Accordingly, we have assessed the realizability of such deferred tax assets based on the future reversals of existing deferred tax liabilities, which resulted in the establishment of a full valuation allowance with respect to our net deferred tax assets as of December 31, 2010. The establishment of the valuation allowance had a negative impact on our effective tax rate and future changes to the valuation allowance will impact the effective tax rate.
Equity in Net Income of Unconsolidated Entities
Equity in net income of unconsolidated entities, net of taxes, increased from $7.0 million in 2009 to $9.3 million in 2010.
The results were driven by our 50% investment in Dry Bulk Cape Holding Ltd (“Dry Bulk”), which owns two Capesize Bulk Carriers and has two Handymax Bulk Carrier Newbuildings on order for delivery in 2012. Dry Bulk contributed $6.8 million in 2009 as compared to $10.8 million in 2010. Included in the 2010 results is a gain of $1.4 million on the sale of the remaining Panamax Bulk Carrier by a Dry Bulk affiliate. Offsetting Dry Bulk’s favorable results were 2010 losses of $1.1 million and $196,000 attributable to our 25% investments in Oslo and Tony Bulkers, respectively (See Note L).
YEAR ENDED DECEMBER 31, 2009
COMPARED TO YEAR ENDED DECEMBER 31, 2008
|
|
|
|||||||||||||||||||||||
|
(All Amounts in Thousands)
|
Time Charter Contracts-
U.S. Flag
|
Time Charter Contracts-International Flag
|
COA
|
Rail-Ferry Service
|
Other
|
Total
|
||||||||||||||||||
|
2009
|
||||||||||||||||||||||||
|
Revenues from External Customers
|
$ | 279,879 | $ | 50,966 | $ | 18,046 | $ | 27,891 | $ | 3,169 | $ | 379,951 | ||||||||||||
|
Voyage Expenses
|
211,850 | 41,501 | 15,827 | 24,585 | 1,915 | 295,678 | ||||||||||||||||||
|
Vessel Depreciation
|
13,368 | 1,407 | - | 5,468 | 11 | 20,254 | ||||||||||||||||||
|
Impairment Charge
|
- | 2,899 | - | - | - | 2,899 | ||||||||||||||||||
|
Gross Voyage Profit (Loss)
|
54,661 | 5,159 | 2,219 | (2,162 | ) | 1,243 | 61,120 | |||||||||||||||||
|
Adjusted Gross Voyage Profit (Loss)
|
54,661 | 8,058 | 2,219 | (2,162 | ) | 1,243 | 64,019 | |||||||||||||||||
|
2008
|
||||||||||||||||||||||||
|
Revenues from External Customers
|
$ | 167,153 | $ | 53,490 | $ | 19,199 | $ | 39,491 | $ | 2,568 | $ | 281,901 | ||||||||||||
|
Voyage Expenses
|
129,996 | 39,446 | 17,793 | 32,136 | 869 | 220,240 | ||||||||||||||||||
|
Vessel Depreciation
|
13,386 | 1,205 | - | 5,365 | 12 | 19,968 | ||||||||||||||||||
|
Gross Voyage Profit
|
23,771 | 12,839 | 1,406 | 1,990 | 1,687 | 41,693 | ||||||||||||||||||
The following table shows the breakout of Revenues by segment between fixed and variable for the years 2009 and 2008, respectively:
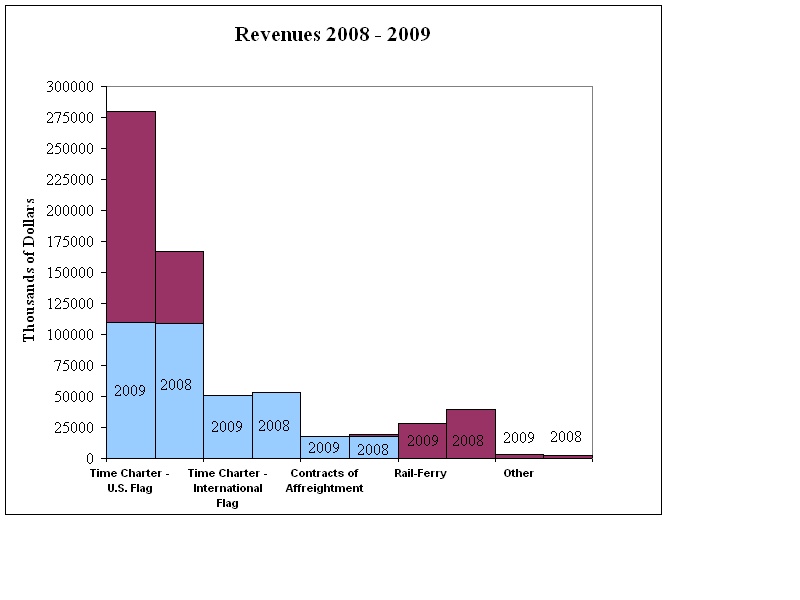
o Variable Revenue o Fixed Revenue
Beginning with the second quarter 2010, we split Time Charter Contracts operations into two different operating segments, U.S. Flag and International Flag. The changes of revenue and expenses associated with each of our segments are discussed within the gross voyage analysis below.
Time Charter Contracts-U.S. Flag: The increase in this segment’s gross voyage profit from $23.8 million in 2008 to $54.7 million in 2009 is primarily due to an increase in the carriage of supplemental cargoes on our U.S. Flag Pure Car Truck Carriers. Gross revenues for the segment increased from $167.2 million in 2008 to $279.9 million in 2009 primarily as a result of the increase in supplemental cargoes. Our fixed revenues of $109.5 million in 2009 and $108.7 million in 2008 represent revenue derived from our fixed time charter contracts, and our variable revenues of $170.4 million in 2009 and $58.5 million in 2008 represent revenues derived from our supplemental cargoes.
Time Charter Contracts-International Flag: The decrease in this segment’s adjusted gross voyage profit from $12.8 million in 2008 to $8.1 million in 2009 is due to reduced charter hire rates on two container vessels, with one ending service in August 2009.
Contract of Affreightment: The increase in this segment’s gross voyage profit from $1.4 million in 2008 to $2.2 million in 2009 was primarily due to lower fuel costs in 2009, which was partially offset by a decrease in revenues due to contractually scheduled freight rate adjustment.
Rail-Ferry Service: Gross voyage results for this segment decreased from a profit of $1.9 million in 2008 to a loss of $2.2 million in 2009, while revenues decreased from $39.4 million in 2008 to $27.9 million in 2009. The weak market conditions had a negative impact especially with the northbound service. In December 2009, we were notified by one of our major northbound customers of their intention to discontinue using the service effective immediately sighting a sourcing decision as their reason for the change. This loss represents approximately 23% of total revenue for this segment.
Other: Gross voyage profit for this segment decreased from $1.7 million in 2008 to $1.2 million in 2009. This decrease was primarily due to foreign currency exchange losses related to our unconsolidated interest in an entity in Mexico, an exchange loss on the Yen denominated facility revaluation adjustment and a favorable earnings adjustment for one of our 50% owned investments, which increased gross profit and were recorded in 2008.
Other Income and Expenses
Administrative and general expenses (A&G) increased 6% from $21.4 million in 2008 to $22.6 million in 2009. A substantial portion of this increase was due to the expansion of our executive stock compensation program initiated in April 2008 and the accrual of a contingent liability associated with incentives received from various Alabama agencies.
The following table shows the significant A&G components for the twelve months ending December 31, 2009 and 2008 respectively:
|
(All amounts in thousands)
|
Year Ended December 31,
|
|||||||||||
|
A&G Account
|
2009
|
2008
|
Variance
|
|||||||||
|
Wages and Benefits
|
$ | 10,142 | $ | 9,574 | $ | (568 | ) | |||||
|
Executive Stock Compensation
|
1,834 | 874 | (960 | ) | ||||||||
|
Professional Services
|
2,627 | 2,875 | 248 | |||||||||
|
Office Building Expense
|
1,292 | 1,159 | (133 | ) | ||||||||
|
Other
|
6,270 | 5,971 | (299 | ) | ||||||||
|
Consulting Fees
|
476 | 961 | 485 | |||||||||
|
TOTAL:
|
$ | 22,641 | $ | 21,414 | $ | (1,227 | ) | |||||
Interest expense decreased 11.3% from $6.9 million in 2008 to $6.1 million in 2009. The decrease was primarily due to lower interest rates and lower principal balances.
Investment income (loss) decreased from $525,000 of income in 2008 to a loss of $72,000 in 2009. Included in these amounts are recognized impairment losses of $369,000 in the fourth quarter of 2008 and $757,000 in the first three quarters of 2009 on the Company’s investments in marketable securities. These charges reflect investments in certain equity securities whose market values had been materially impacted by poor economic conditions. During the fourth quarter of 2009, we sold our stock portfolio and recognized a gain of approximately $980,000 on the sale, which is reported as a separate line item under Interest and Other on the Income Statement.
Income Taxes
For 2009, we recorded a benefit for income taxes of $3.5 million on $31.7 million of income from continuing operations before income from unconsolidated entities, reflecting tax losses on operations taxed at the U.S. corporate statutory rate. For 2008, our benefit was $877,000 on $12.4 million of income from continuing operations before income from unconsolidated entities. Our tax benefit increased from the comparable prior year primarily as a result of lower results of the Company’s U.S. Flag Coal Carrier and Rail Ferry segments, which are subject to the higher corporate statutory rate.
Equity in Net Income of Unconsolidated Entities
Equity in net income of unconsolidated entities, net of taxes, decreased from $20.9 million in 2008 to $7.0 million in 2009.
The results were driven by our 50% investment in Dry Bulk Cape Holding Ltd (“Dry Bulk”), which owns one Panamax-size Bulk Carrier, two Capesize Bulk Carriers and has two Handymax Bulk Carrier Newbuildings on order for delivery in 2012. Dry Bulk contributed $6.8 million in 2009 as compared to $21.2 million in 2008. The 2008 results included a gain on the sale of one of Dry Bulk’s vessels, a Panamax Bulk Carrier, of approximately $15.9 million in June 2008.
LIQUIDITY AND CAPITAL RESOURCES - 2010
The following discussion should be read in conjunction with the more detailed Consolidated Balance Sheets and Consolidated Statements of Cash Flows included elsewhere herein as part of our Consolidated Financial Statements.
Our working capital (which we define as the difference between our total current assets and total current liabilities) decreased from $40.5 million at December 31, 2009, to $15.1 million at December 31, 2010. The decrease in our working capital was temporary and is primarily related to construction payments on our three Handy-Size Bulk Carriers delivered in January 2011. Permanent financing replenished the installment payments in early January 2011. Cash and cash equivalents decreased during 2010 by $23.3 million to a total of $24.2 million. This decrease was due to cash provided by operating activities of $64.4 million and cash provided by financing activities of $27.2 million being offset by cash used by investing activities of $114.9 million. Of the $53.4 million in current liabilities at December 31, 2010, $21.3 million related to current maturities of long-term debt.
Net cash provided by operating activities of $64.4 million for 2010 was generated after adjusting for the items listed in our Consolidated Statements of Cash Flows, including non-cash items such as (i) a $25.4 million impairment loss on two of our special purpose vessels, (ii) amortization of deferred charges of $6.6 million and (iii) an $8.2 million loss on a foreign currency exchange related to the revaluation of our Yen denominated loan facility. These items were partially offset by a non-cash deduction of $9.3 million from the equity in net income of unconsolidated entities, and deferred drydocking payments of $2.5 million. During 2010, we received cash dividends of $3.0 million from the normal operations of our unconsolidated entities.
Net cash used in investing activities of $114.9 million for 2010 included capital outlays of $123.1 million and the purchase, net of sale, of short-term corporate bonds of $1.3 million, partially offset by proceeds from the sale of assets of $3.9 million, principal payments received under direct financing leases of $5.5 million, and cash investments in unconsolidated entities of $4.9 million. Included in the $123.1 million of capital payments are $51.4 million for the final installment payment on an International Flag Pure Car Truck Carrier delivered in late March 2010 and installment payments of $71.0 million on three Handy-size Bulk Carrier Newbuildings delivered in the first quarter of 2011. We have obtained permanent financing for both of these as noted below.
Net cash provided by financing activities of $27.2 million for 2010 included outflows of regularly scheduled debt payments of $14.5 million, an additional $6.0 million paid toward principal payment on debt affiliated with the purchase of two Multi-Purpose vessels in 2009, the buyback of shares of our common stock of $5.2 million and cash dividends paid of $11.9 million. These cash outflows were offset by the net effect of (i) a line of credit draw of $36.0 million offset by line of credit payments of $26.0 million, (ii) a debt payment of $48.4 million and loan proceeds of $46.0 million from the refinancing of the 2007 U.S. Flag PCTC, (iii) loan proceeds of $4.2 million and subsequent pay off of a bridge loan for $12.6 million, (iv) proceeds of $46.1 million from the final bank draw associated with financing of the International Flag PCTC Newbuilding and (v) proceeds of $21.2 million from bank draws on the facility agreement to finance the construction and delivery of three Handy-Size dry bulk carriers delivered in January 2011.
In 2007, we acquired a 2007-built PCTC, which we reflagged as a U.S. Flag vessel. The vessel was financed with a three year Yen denominated loan with a balloon payment of 4.25 billion Yen due on September 10, 2010. Immediately after being delivered to us in September of 2007, we chartered this vessel through August of 2010 to a Far East based shipping company, which held an option to purchase the vessel at the end of the contract. A portion of the charter was based on Yen capital hire payments which corresponded with our Yen debt payments. On February 5, 2010, the charterer notified us of their intention not to exercise their option to purchase the vessel and did not exercise their option on the due date of February 6, 2010. On February 14, 2010, we negotiated a mutually acceptable early redelivery of the vessel under the time charter. On March 8, 2010, we entered into a U.S. denominated bridge loan which converted our total outstanding debt of 4.32 billion Yen to approximately $47.9 million. On June 29, 2010 we entered into a refinancing loan agreement to establish long-term financing on this vessel for $46.0 million. As a result of the time charterer’s redelivery of the vessel in February 2010, we reclassified on our balance sheet $48.1 million of net investment in direct financing leases from current assets to vessels in the first quarter of 2010. This vessel is currently employed on a long-term time charter.
On March 31, 2010 we adjusted our $30 million unsecured revolving line of credit upward to $35 million and extended the maturity date to April 6, 2012. As of December 31, 2010, we had pledged $6.4 million as collateral for a letter of credit. The remaining $18.6 million was available as of December 31, 2010, after a $10 million draw late in the fourth quarter of 2010. Associated with this credit facility is a commitment fee of .125% per year on the undrawn portion of this facility.
We filed a universal shelf registration statement with the Securities and Exchange Commission which was declared effective on October 27, 2010. We believe this registration statement will provide us with additional flexibility to access the public equity and debt capital markets as needed for accretive opportunities. For further information, see the Form S-3, filed with the Securities and Exchange Commission on October 13, 2010.
We routinely evaluate the acquisition of additional vessels or businesses. At any given time, we may be engaged in discussions or negotiations regarding additional acquisitions. We generally do not announce our acquisitions or dispositions until we have entered into a definitive agreement. We may require additional financing in connection with any such acquisitions, the consummation of which could have a material impact on our financial condition or operations.
Stock Repurchase Program
On January 25, 2008, our Board of Directors approved a share repurchase program for up to a total of 1,000,000 shares of our common stock. We expect that any share repurchases under this program will be made from time to time for cash in open market transactions at prevailing market prices. The timing and amount of any purchases under the program will be determined by management based upon market conditions and other factors. In 2008, we repurchased 491,572 shares of our common stock for $11.5 million. Thereafter, we suspended repurchases until the second quarter of 2010, when we repurchased 223,051 shares of our Common Stock for $5.2 million. Unless and until the Board otherwise provides, this authorization will remain open indefinitely, or until we reach the 1,000,000 share limit.
Debt and Lease Obligations
As of December 31, 2010, we held five vessels under operating contracts, five vessels under bareboat charter or lease agreements and two vessels under time charter agreements. The types of vessels held under these agreements include (i) two Pure Car/Truck Carriers, two Breakbulk/Multi Purpose vessels, three Roll-On/Roll-Off vessels and four container vessels, all of which operate in our Time Charter-U.S. Flag and Time Charter-International Flag segments, and (ii) a Molten Sulphur Carrier operating in our Contracts of Affreightment segment. We also conduct certain of our operations from leased office facilities. See Item 2 of this report.
We have lease agreements on our offices in Mobile, AL, New York, NY and Shanghai, China, which expire in April 2027, June 2018 and June 2011, respectively. We also have a lease agreement on our office in Singapore, which expires in September 2014, with an option to renew for a further period of three years.
Debt Covenants
Substantially all of our credit agreements require us to comply with various loan covenants, including financial covenants that stipulate minimum levels of net worth and maximum amounts of debt leverage. While we currently believe that we have available options to prevent or mitigate such breaches, we cannot be sure that we will be able to implement them timely or at all, or that they will enable us to meet all of our current covenants.
In the unanticipated event that our cash flow and capital resources are not sufficient to fund our debt service obligations, we could be forced to reduce or delay capital expenditures, sell assets, obtain additional equity capital, enter into financings of our unencumbered vessels or restructure debt. We believe we can continue to fund our working capital and routine capital investment liquidity needs through cash flow from operations. To the extent we are required to seek additional capital, our efforts could be hampered by the recent turmoil in the credit markets. See “Risk Factors” in Item 1A of this annual report. We presently have variable to fixed interest rate swaps on 61% of our long-term debt.
Contractual Obligations and Other Commitments
The following is a summary of the scheduled maturities by period of our debt and lease obligations that were outstanding as of December 31, 2010:
|
Debt and lease obligations (000’s)
|
Total
|
2011
|
2012
|
2013
|
2014
|
2015
|
Thereafter
|
|
Long-term debt (including current maturities)
|
$221,565
|
$ 21,324
|
$44,067
|
$ 35,675
|
$ 19,809
|
$ 16,000
|
$ 84,690
|
|
Interest payments
|
34,931
|
7,502
|
6,691
|
5,282
|
4,253
|
3,593
|
7,610
|
|
Operating leases
|
45,122
|
10,371
|
4,932
|
4,956
|
4,924
|
4,800
|
15,139
|
|
Vessel Commitments
|
89,480
|
79,480
|
10,000
|
-
|
-
|
-
|
-
|
|
Total by period
|
$391,098
|
$118,677
|
$65,690
|
$ 45,913
|
$ 28,986
|
$ 24,393
|
$ 107,439
|
Reflected in the table under “Vessel Commitments” is our obligation to repurchase two vessels that we formally owned and are currently leasing under two separate sale and leaseback arrangements. On January 3, 2011 and January 13, 2011, respectively, we exercised early buy options on both vessels. Based on the terms of the existing lease agreements, the total of the early buy out prices for both vessels is expected to be about $64.5 million, payable in July 2011. We are currently evaluating our options to finance the acquisitions.
The above contractual obligations table does not include our approximate $17 million obligation to the Alabama State Port Authority related to the terminal upgrades in Mobile, Alabama, to be paid by us over the ten-year terminal lease. This long-term obligation, reported in other long-term liabilities, will be met by the usage fees paid by our Rail Ferry vessels in the Mobile port. The table further excludes (i) contingent equity contributions that may be payable to Dry Bulk under the circumstances described under “Liquidity and Capital Resources – Bulk Carriers” and (ii) contributions that we expect to make to our pension plan in 2011, as described further below and in Note E.
Current Economic and Market Issues
The downturn in the worldwide economy that followed the bankruptcy of Lehman Brothers in September 2008 impacted our Rail-Ferry service and certain other aspects of our operations. Nonetheless, customers who owed us payments under our fixed contracts generally paid us in full in the ordinary course. We cannot assure you that this will continue. For more information, see our list of Risk Factors included in Item 1A of this report.
During the year ended 2010, the financial markets recovered. By maintaining our asset allocation within our stated policy guidelines with targets of approximately 57% equities and 43% fixed instruments, our pension plan also participated in the recovery. We are evaluating our requirements going forward as to asset allocation mixes, with the potential of reducing our equity exposure further to 50% throughout 2011. While as of December 31, 2010 we continue to show an underfunded status in other comprehensive income, we have exceeded our required funding obligations under the current Pension Protection Act. We expect to contribute $600,000 to our pension plan for fiscal year 2011.
Rail-Ferry Service
As noted above, in 2009, this segment began to feel the impact of the poor economic recession and reported lower than expected gross profit results. The lower results were further dampened by the loss of one of the segment’s largest customers in December of 2009. As a result, we tested regularly to determine if service was impaired. In the third quarter of 2010, we determined that the cash flows expected to be generated by the long-lived assets of its Rail-Ferry segment are less than the carrying amount of these assets. and we recognized a non-cash impairment charge of $25.4 million to reduce the carrying value of these assets to their estimated fair value. The fair value of these assets was estimated based upon an independent third party appraiser (Level 2 inputs).
We intend to continue to operate the Rail-Ferry segment as long as it can generate positive cash flows and further utilize the vessels available capacity to generate a return that would be accretive to net income.
As of December 31, 2010, the cost of our total investment in a joint venture that owns a trans-loading and storage facility (RTI), which was used to support the Rail-Ferry service in New Orleans, included an equity investment in unconsolidated entities of $1.2 million and an outstanding loan of approximately $2.2 million due from our 50% partner in the venture. As a result of our terminal operations moving from New Orleans to Mobile, an impairment test to determine our loss exposure on this facility was required. As of December 31, 2010, no impairment was recorded as we expect to recover our total investment.
Bulk Carriers
In November 2009, we contracted with a Korean shipyard to construct three double hull Handy-Size Bulk Carrier Newbuildings. We made equity payments of $17.0 million in the fourth quarter 2009 and $71.0 million in 2010 on these vessels. All three vessels were delivered in January 2011. With our equity position on these Newbuildings being fully funded, on August 2, 2010, we entered into a $55.2 million Senior Secured Term Loan Facility Agreement to finance the construction and delivery installment payments under separate shipbuilding contracts for these three Newbuildings. The Facility matures in seven years and is based on a 15-year amortization. See Exhibit 10.12 to this report for a copy of the facility agreement and our Current Report on Form 8-K dated August 2, 2010 for a further description of this facility.
We have a 50% interest in Dry Bulk, which owns 100% of subsidiary companies which own two Cape-Size Bulk Carriers. This investment is accounted for under the equity method and our share of earnings or losses are reported in our consolidated statements of income net of taxes. Dry Bulk’s subsidiary companies have entered into ship purchase agreements with a Japanese company for two Handymax Bulk Carrier newbuildings, scheduled to be delivered in 2012. Total investment in the newbuildings is anticipated to be approximately $74.0 million, of which our share would be 50% or approximately $37.0 million. During the period of construction up to delivery, where 50% of the projected overall costs will be expended, Dry Bulk plans to finance the interim construction costs with equity contributions of up to 15% with the 85% balance of the cost being financed with a bank construction loan. Due to current financial market conditions, it is likely that the permanent financing will require additional equity contributions. We anticipate our share of the additional contributions to be $2 million in 2011 and $10 million in 2012.
In December 2009, we acquired for $6,250,000 a 25% investment in Oslo Bulk AS (“Oslo Bulk”), which, in 2008, contracted to build eight new Mini Bulkers. Four of the eight Mini-Bulkers were delivered and entered into a commercial management agreement as of December 31, 2010. The remaining four vessels are expected to be delivered in the first quarter of 2011. During 2010, we invested an additional $3.9 million in Tony Bulkers Pte Ltd, (“Tony Bulkers”), an affiliate of Oslo Bulk AS, for our 25% share of the installment payments for two more new Mini-Bulkers. One of the Mini-Bulkers was delivered in the fourth quarter, 2010. We paid our remaining share of installment payments associated with the Mini-Bulker Newbuilding of approximately $1.7 million in January 2011 and the vessel is expected to be delivered in the second quarter 2011. These investments are accounted for under the equity method and our share of earnings or losses is reported in our consolidated statements of income net of taxes.
Dividend Payments
The payment of dividends to common stockholders is at the discretion of our board of directors. On October 29, 2008, our Board of Directors authorized the reinstitution of a quarterly cash dividend program beginning in the fourth quarter of 2008. Since then, the Board has declared a cash dividend each quarter.
Environmental Issues
Our environmental risks primarily relate to oil pollution from the operation of our vessels. We have pollution liability insurance coverage with a limit of $1 billion per occurrence, with deductible amounts not exceeding $500,000 for each incident.
On June 23, 2009, a complaint was filed in U.S. District Court of Oregon by ten plaintiffs against approximately 40 defendants, including Waterman Steamship Corporation, which is one of our wholly owned subsidiaries. See Item 3 of this annual report for further information.
New Accounting Pronouncements
In January 2010, the Financial Accounting Standards Board (“FASB”) issued guidance which expanded the required disclosures about fair value measurements. In particular, this guidance requires (i) separate disclosure of the amounts of significant transfers in and out of Level 1 and Level 2 fair value measurements along with the reasons for such transfers, (ii) information about purchases, sales, issuances and settlements to be presented separately in the reconciliation for Level 3 fair value measurements, (iii) fair value measurement disclosures for each class of assets and liabilities and (iv) disclosures about the valuation techniques and inputs used to measure fair value for both recurring and nonrecurring fair value measurements for fair value measurements that fall in either Level 2 or Level 3. The adoption of this guidance did not have a material effect on our financial condition or results of operations.
In February 2010, the FASB issued guidance related to events that occur after the balance sheet date but before financial statements are issued or are available to be issued. This guidance amends existing standards to address potential conflicts with Securities and Exchange Commission guidance and refines the scope of the reissuance disclosure requirements to include revised financial statements only. Under this guidance, SEC filers are no longer required to disclose the date through which subsequent events have been evaluated. The adoption of this standard did not have a material effect on our financial condition or results of operations.
In June 2009, the FASB issued an accounting standard to require an enterprise to perform an analysis to determine whether the enterprise’s variable interest or interests give it a controlling financial interest in a variable interest entity (“VIE”), identifying the primary beneficiary of a VIE, and to require ongoing reassessment of whether an enterprise is the primary beneficiary of a VIE, rather than only when specific events occur. The standard also eliminated the quantitative approach previously required for determining the primary beneficiary of a VIE, amended certain guidance for determining whether an entity is a VIE, added an additional reconsideration event when changes in facts and circumstances pertinent to a VIE occur, eliminated the exception for troubled debt restructuring regarding VIE reconsideration and required advanced disclosures that provide users of financial statements with more transparent information about an enterprise’s involvement in a VIE. We adopted this accounting standard effective January 1, 2010. The adoption of this standard did not have a material effect on our financial condition or results of operations.
LIQUIDITY - 2009
The following discussion should be read in conjunction with the more detailed Consolidated Balance Sheets and Consolidated Statements of Cash Flows included elsewhere herein as part of our Consolidated Financial Statements.
Our working capital (which we define as the difference between our total current assets and total current liabilities) decreased from $50.5 million at December 31, 2008, to $40.5 million at December 31, 2009. Cash and cash equivalents decreased during 2009 by $4.4 million to a total of $47.5 million. This decrease was due to cash provided by operating activities of $62.7 million, and cash provided by investing activities of $12.7 million, offset by cash used by financing activities of $79.8 million. Of the $98.8 million in current liabilities at December 31, 2009, $68.8 million related to current maturities of long-term debt. Approximately $48.0 million of this debt is offset in current assets as the current portion of a direct finance lease on a PCTC we purchased in 2007.
Operating activities generated positive cash flow after adjusting net income of $42.2 million for non-cash provisions such as depreciation, amortization and gains on sales of assets and investments. Cash provided by operating activities of $62.7 million for 2009 was generated after adjusting for non-cash items such as $2.9 million impairment loss on one of our International Flag container vessels, amortization of deferred charges, a non-cash deduction of $7.0 million from the equity in net income of unconsolidated entities, and deferred drydocking payments of $16.0 million. During 2009, we received cash dividends of $3.0 million from the normal operations of our unconsolidated entities.
Cash used by investing activities of $79.8 million for 2009 included capital outlays of $80.3 million and the purchase of short-term corporate bonds of $10.6 million, partially offset by proceeds from the sale of assets of $5.0 million and principal payments received under direct financing leases of $7.8 million. Included in the $80.3 million of capital payments is $40.7 million for the purchase of the two vessels used in our Indonesian mining service, subsequently sold to a third party under an installment sale described further below. Additionally, we made equity payments of $17 million paid toward the construction of three new Handy size double-hull Drybulk Carriers, and $16.6 million in installment payments toward the construction of a Pure Car/ Truck Carrier to be delivered in March 2010.
Cash provided by financing activities of $12.7 million for 2009 included regularly scheduled debt payments of $14.2 million and cash dividends paid of $14.5 million, partially offset by proceeds from new debt of $41.6 million, including a $25.0 million loan relating to the purchase of the two vessels previously mentioned to be used in our Indonesian mining service.
We entered into a financing agreement with Regions Bank on August 27, 2009 for a five year facility to finance up to $40.0 million for the purchase of additional vessels. As of December 31, 2009, the Company has drawn $25.0 million under this facility towards the purchase of the vessels to fulfill the additional requirements under the Indonesian mining contract. The vessels purchased with the loan proceeds were subsequently sold to a third party in the third quarter of 2009, generating a deferred gain of approximately $10.6 million. In addition to a $1.1 million payment received from the buyer, a ten year note receivable was agreed to for the remaining balance. We hold a first mortgage covering the vessels until the note is fully satisfied. Due to our financing of the transaction, the gain realized on the sale was deferred. This deferral will be recognized over ten years, the length of the agreement with the buyer. With this financing, our unsecured revolving line of credit was reduced from $35 million to $30 million, expiring in April of 2011. As of December 31, 2009, $6.4 million of this revolving credit facility was pledged as collateral for letters of credit, and the remaining $23.6 million was available.
In 2007, we acquired a 2007-built PCTC, which we reflagged to U.S. Flag. The vessel was financed with a three year Yen denominated note with a balloon payment of 4.25 billion Yen due on September 10, 2010. Immediately after being delivered to us in September of 2007, we chartered this vessel through August of 2010 to a Far East based shipping company, which held an option to purchase the vessel at the end of the contract. The charter was based on Yen capital hire payments which correspond with our Yen debt payments. On February 5, 2010, the charterer notified us of their intention not to exercise their option to purchase the vessel, and we subsequently negotiated a mutually acceptable redelivery of the vessel effective February 14, 2010. On March 8, 2010 we entered into a U.S. dollar denominated bridge loan which converted our total outstanding debt of 4.32 billion Yen to approximately $48 million USD. On June 29, 2010 we entered into a refinancing loan agreement to establish long-term financing on this vessel for $46.0 million. As a result of the time charterer’s redelivery of the vessel in February 2010, we reclassified on our balance sheet $48.1 million of net investment in direct financing leases from current assets to vessels in the first quarter of 2010. This vessel is currently employed on a long-term time charter.
As a result of the redelivery of the vessel in February 2010, we reclassified approximately $48.0 million of net investment in direct financing leases from current assets to vessels in the first quarter of 2010. This reclassification resulted in a decrease in our working capital of $48.0 million. On June 29, 2010 we entered into a refinancing loan agreement to establish long term financing on this vessel for $46.0 million. On March 31, 2010 we adjusted our $30 million unsecured revolving line of credit upward to $35 million and extended the maturity date to April 6, 2012.
LIQUIDITY - 2008
The following discussion should be read in conjunction with the more detailed Consolidated Balance Sheets and Consolidated Statements of Cash Flows included elsewhere herein as part of our Consolidated Financial Statements.
Our working capital (which we define as the difference between our total current assets and total current liabilities) increased from $23.2 million at December 31, 2007, to $50.5 million at December 31, 2008. Cash and cash equivalents increased during 2008 by $37.1 million to a total of $51.8 million. This increase was due to cash provided by operating activities of $42.2 million, and cash provided by investing activities of $41.4 million, offset by cash used by financing activities of $45.9 million. Of the $39.8 million in current liabilities at December 31, 2008, $13.3 million related to current maturities of long-term debt.
Operating activities generated positive cash flow after adjusting net income of $39.1 million for non-cash provisions such as depreciation, amortization and gains on sales of assets and investments. Cash provided by operating activities of $42.2 million for 2008 also included, among other things, the add back of the non-cash loss of $1.4 million on the early redemption of Preferred Stock, the deduction of the non-cash $4.6 million pre-tax gain on the sale of LASH assets, and the deduction of the non-cash recognition of $20.9 million in earnings from our equity in net income of unconsolidated entities, which included a gain on the sale of a Panamax Bulk Carrier. We received cash dividends of $6.0 million from the normal operations of our unconsolidated entities, with the proceeds from the aforementioned sale presented in investing activities.
Cash provided by investing activities of $41.4 million for 2008 included proceeds from the sale of our discontinued LASH liner service assets of $10.8 million, proceeds from Dry Bulk’s subsidiary company’s sale of the Panamax Bulk Carrier of $25.5 million, net proceeds from the sale and purchase of short term investments of $1.6 million and principal payments received under direct financing leases of $7.5 million, partially offset by capital improvements of $4.0 million, including improvements to our information technology systems and additional tank work on our Rail-Ferry vessels.
Cash used for financing activities of $45.9 million for 2008 included regularly scheduled debt payments of $13.0 million, payment of $17.3 million on the early redemption of our Preferred Stock, $11.5 million of repurchases of our common stock, and $3.7 million on cash dividends paid on our common stock.
In March of 2008, we signed an agreement with Regions Bank to provide us with an unsecured revolving line of credit for $35 million. This facility replaced the prior secured revolving line of credit for the like amount. As of December 31, 2008, $6.4 million of the $35 million revolving credit facility was available.
ITEM 7a. QUANTITATIVE AND QUALITATIVE DISCLOSURES ABOUT MARKET RISK
In the ordinary course of our business, we are exposed to foreign currency, interest rate, and commodity price risk. We utilize derivative financial instruments including interest rate swap agreements and forward exchange contracts, and in the past we have also utilized commodity swap agreements to manage certain of these exposures. We hedge only firm commitments or anticipated transactions and do not use derivatives for speculation. We neither hold nor issue financial instruments for trading purposes.
Interest Rate Risk
The fair value of our cash and short-term investment portfolio at December 31, 2010, approximated its carrying value due to its short-term duration. The potential decrease in fair value resulting from a hypothetical 10% increase in interest rates at year-end for our investment portfolio is not material.
The fair value of long-term debt, including current maturities, was estimated to be $221.6 million compared to a carrying value of $221.6 million. The potential increase in fair value resulting from a hypothetical 10% adverse change in the borrowing rates applicable to our long-term debt at December 31, 2010 is not material.
We have entered into seven interest rate swap agreements with commercial banks, two in September of 2005, one in November of 2005, three in September of 2007, and one in January 2008, in order to reduce the possible impact of higher interest rates in the long-term market by utilizing the fixed rate available with the swap. For each of these agreements, the fixed rate payor is the Company, and the floating rate payor is the commercial bank. While these arrangements are structured to reduce our exposure to increases in interest rates, it also limits the benefit we might otherwise receive from any decreases in interest rates, and our weighted average cost of capital.
The fair value of these agreements at December 31, 2010, estimated based on the amount that the banks would receive or pay to terminate the swap agreements at the reporting date, taking into account current market conditions and interest rates, is a liability of $9.6 million. A hypothetical 10% decrease in interest rates as of December 31, 2010 would have resulted in a $10.2 million liability.
Commodity Price Risk
As of December 31, 2010, we do not have commodity swap agreements in place to manage our exposure to price risk related to the purchase of the estimated 2011 fuel requirements for our Rail-Ferry Service segment. We have fuel surcharges in place for our Rail-Ferry Service, which we expect to effectively manage the price risk for those services during 2011. Revenue from fuel surcharges in 2010 for the Rail-Ferry Service was $2.5 million. If we had commodity swap agreements, they could be structured to reduce our exposure to increases in fuel prices. However, they would also limit the benefit we might otherwise receive from any price decreases associated with this commodity. A 20% increase in the price of fuel for the period January 1, 2010 through December 31, 2010 would have resulted in an increase of approximately $747,000 in our fuel costs for the same period, and in a corresponding decrease of approximately $0.10 in our basic earnings per share based on the shares of our common stock outstanding as of December 31, 2010. The additional fuel costs assumes no additional revenue was generated from fuel surcharges, however, we believe that some or all of the price increase could have been passed on to our customers through the aforementioned fuel surcharges during the same period but might have been limited by our need to maintain competitive rates. Our charterers in the Time Charter segment are responsible for purchasing vessel fuel requirements; thus, we have no fuel price risk in this segment.
Foreign Currency Exchange Rate Risk
We entered into foreign exchange contracts to hedge certain firm purchase commitments during 2010. These contracts mature on various dates during 2011. The fair value of these contracts at December 31, 2010, is an asset of $157,000. The potential fair value of these contracts that would have resulted from a hypothetical 10% adverse change in the exchange rates would be an asset of $142,000.
On January 23, 2008, a wholly-owned subsidiary of the Company entered into a Senior Secured Term Loan Facility denominated in Japanese Yen for the purchase of a 6400 CEU Newbuilding PCTC, which was completed and delivered in March 2010. The decision to enter into this Yen loan was driven by the lower Yen interest rates versus the USD interest rates at that time. Subsequently, we entered into a Yen interest rate swap designed to cap the interest at 2.065%. In June 2009, we received notification that the banking institution would be exercising their option to reduce the Yen financing on this vessel from 80% to 65% of the delivered vessel cost. The loan was fully drawn in March 2010 to the full amount available of Yen 5,102,500,000. Under current accounting guidelines, since this Facility is not denominated in our functional currency, the outstanding balance of the Facility as of the end of each reporting period is to be revalued, with any adjustments recorded to earnings. Due to the amount of the Facility, we may sustain fluctuations that may cause material swings in our reported results. As an example, a hypothetical 1 to 5 Yen increase or decrease on the exchange rate between the U.S. Dollar and Yen, which was $1 to Yen 81.22 at December 31, 2010, would impact our earnings by approximately $600,000 to $3.0 million for the reporting period (See Item 1A-Risk Factors). While we believe that these fluctuations may smooth out over time, any particular reporting period could be materially impacted by these adjustments. There was a 12% appreciation in the Yen to USD exchange rate at December 31, 2010 compared to December 31, 2009, resulting in a $8.2 million foreign exchange loss for the year ended December 31, 2010, reported under Interest and Other on our consolidated Statement of Income. We continue to monitor the movements in the foreign currency markets in order to take advantage of potential opportunities. During the month of September, the Japanese Government intervened into the foreign currency market causing a temporary weakening of the Yen to USD. We bought forward contracts to purchase Yen to cover our installments due under the Facility for the periods December 15, 2010 and March 15, 2011. The rate of exchange for these transactions was approximately Yen 85.4 to 1 USD, with total USD equivalents of $3,005,000. On January 27, 2011 we purchased another 128 million Yen to cover the June 15, 2011 installment for 82.80 to 1 USD, or a USD equivalent of $1,546,000.
ITEM 8. FINANCIAL STATEMENTS AND SUPPLEMENTARY DATA
The information required by Item 8 begins on page F-1 of this Form 10-K.
ITEM 9. CHANGES IN AND DISAGREEMENTS WITH ACCOUNTANTS ON ACCOUNTING AND FINANCIAL DISCLOSURE
None.
ITEM 9a. CONTROLS AND PROCEDURES
Evaluation of Disclosure Controls and Procedures
We maintain disclosure controls and procedures that are designed to ensure that information required to be disclosed in our Securities Exchange Act reports is recorded, processed, summarized and reported within the time periods specified in the SEC’s rules and forms, and that such information is accumulated and communicated to our management, including our Chief Executive Officer and Chief Financial Officer, as appropriate, to allow timely decisions regarding required disclosure.
As of December 31, 2010, we conducted an evaluation of the effectiveness of our disclosure controls and procedures. The evaluation was carried out under the supervision and with the participation of our management, including our Chief Executive Officer (“CEO”) and Chief Financial Officer (“CFO”).
Based on that evaluation as of such date, our CEO and CFO have concluded that our disclosure controls and procedures have been effective in providing reasonable assurance that they have been timely alerted of material information required to be filed in this annual report. During the quarter ended December 31, 2010, we did not make any changes to our internal control over financial reporting that materially affected, or that we believe are reasonably likely to materially affect, our internal control over financial reporting. The design of any system of controls is based in part upon certain assumptions about the likelihood of future events and contingencies, and there can be no assurance that any design will succeed in achieving our stated goals. Because of the inherent limitations in any control system, you should be aware that misstatements due to error or fraud could occur and not be detected.
Management’s Report on Internal Control Over Financial Reporting
Our management, with the participation of our CEO and CFO, is responsible for establishing and maintaining adequate internal control over financial reporting. Our management has assessed the effectiveness of our internal control over financial reporting as of December 31, 2010. In making this assessment, we used the criteria set forth by the Committee of Sponsoring Organizations of the Treadway Commission (COSO) in Internal Control — Integrated Framework. Based on our assessment we have concluded that, as of December 31, 2010, our internal control over financial reporting is effective based on those criteria. Our independent registered public accounting firm for 2010, Ernst & Young LLP, has provided the following attestation report on management’s assessment of our internal control over financial reporting as of December 31, 2010.
REPORT OF INDEPENDENT REGISTERED PUBLIC ACCOUNTING FIRM
The Board of Directors and Stockholders
International Shipholding Corporation
We have audited International Shipholding Corporation’s internal control over financial reporting as of December 31, 2010, based on criteria established in Internal Control-Integrated Framework issued by the Committee of Sponsoring Organizations of the Treadway Commission (the COSO criteria). International Shipholding Corporation’s management is responsible for maintaining effective internal control over financial reporting, and for its assessment of the effectiveness of internal control over financial reporting included in the accompanying Management’s Report on Internal Control Over Financial Reporting. Our responsibility is to express an opinion on the company’s internal control over financial reporting based on our audit.
We conducted our audit in accordance with the standards of the Public Company Accounting Oversight Board (United States). Those standards require that we plan and perform the audit to obtain reasonable assurance about whether effective internal control over financial reporting was maintained in all material respects. Our audit included obtaining an understanding of internal control over financial reporting, assessing the risk that a material weakness exits, testing and evaluating the design and operating effectiveness of internal control based on the assessed risk, and performing such other procedures as we considered necessary in the circumstances. We believe that our audit provides a reasonable basis for our opinion.
A company’s internal control over financial reporting is a process designed to provide reasonable assurance regarding the reliability of financial reporting and the preparation of financial statements for external purposes in accordance with generally accepted accounting principles. A company’s internal control over financial reporting includes those policies and procedures that (1) pertain to the maintenance of records that, in reasonable detail, accurately and fairly reflect the transactions and dispositions of the assets of the company; (2) provide reasonable assurance that transactions are recorded as necessary to permit preparation of financial statements in accordance with generally accepted accounting principles, and that receipts and expenditures of the company are being made only in accordance with authorizations of management and directors of the company; and (3) provide reasonable assurance regarding prevention or timely detection of unauthorized acquisition, use, or disposition of the company’s assets that could have a material effect on the financial statements.
Because of its inherent limitations, internal control over financial reporting may not prevent or detect misstatements. Also, projections of any evaluation of effectiveness to future periods are subject to the risk that controls may become inadequate because of changes in conditions, or that the degree of compliance with the policies or procedures may deteriorate.
In our opinion, International Shipholding Corporation maintained, in all material respects, effective internal control over financial reporting as of December 31, 2010, based on the COSO criteria.
We also have audited, in accordance with the standards of the Public Company Accounting Oversight Board (United States), the consolidated balance sheets of International Shipholding Corporation as of December 31, 2010 and 2009, and the related consolidated statements of income, changes in stockholders’ investment, and cash flows for each of the three years in the period ended December 31, 2010 of International Shipholding Corporation and our report dated March 14, 2011 expressed an unqualified opinion thereon.
|
/s/ Ernst & Young LLP
|
||||
New Orleans, Louisiana
March 14, 2011
ITEM 9b. OTHER INFORMATION
- None -
ITEM 10. DIRECTORS, EXECUTIVE OFFICERS AND CORPORATE GOVERNANCE
We have adopted a written Code of Business Conduct and Ethics applicable to all officers, directors and employees, including our principal executive officer, principal financial officer and principal accounting officer. In addition, (i) the audit, compensation and nominating and governance committees of our board have each adopted written charters governing their operations and (ii) our board has adopted written corporate governance guidelines. Interested persons may obtain a copy of these materials without charge by writing to International Shipholding Corporation, Attention: Manuel G. Estrada, Vice President and Chief Financial Officer, 11 North Water Street, RSA Battle House Tower, 18th Floor, Mobile, Alabama 36602. Copies are also available on the Investor Relations section of our website at www.intship.com.
The information relating to Directors and Executive Officers called for by Item 10 will be included in our definitive proxy statement to be filed pursuant to Section 14(a) of the Securities Exchange Act of 1934, and is incorporated herein by reference.
ITEM 11. EXECUTIVE COMPENSATION
The information called for by Item 11 will be included in our definitive proxy statement to be filed pursuant to Section 14(a) of the Securities Exchange Act of 1934, and is incorporated herein by reference.
ITEM 12. SECURITY OWNERSHIP OF CERTAIN BENEFICIAL OWNERS AND MANAGEMENT AND RELATED STOCKHOLDER MATTERS
Stock Repurchase Plan
On January 25, 2008, our Board of Directors approved a share repurchase program for up to a total of 1,000,000 shares of our common stock. We expect that any share repurchases under this program will be made from time to time for cash in open market transactions at prevailing market prices. The timing and amount of any purchases under the program will be determined by management based upon market conditions and other factors. In 2008, we repurchased 491,572 shares of our common stock for $11.5 million. Thereafter, we suspended repurchases until the second quarter of 2010, when we repurchased 223,051 shares of our Common Stock for $5.2 million. Unless and until the Board otherwise provides, this authorization will remain open indefinitely, or until we reach the 1,000,000 share limit.
We did not repurchase any of our shares of common stock during the fourth fiscal quarter of 2010. As of December 31, 2010, we had 285,377 shares available to be purchased under our 2008 repurchase plan.
|
ISSUER PURCHASES OF EQUITY SECURITIES
|
||||
|
Period
|
(a) Total Number of Shares Purchased
|
(b) Average Price Paid per Share
|
(c) Total Number of Shares Purchased as Part of Publicly Announced Plan
|
(d) Maximum Number of Shares that May Yet Be Purchased Under the Plan
|
|
October 1, 2010 – October 31, 2010
|
-
|
-
|
-
|
285,377
|
|
November 1, 2010 - November 30, 2010
|
-
|
-
|
-
|
285,377
|
|
December 1, 2010 – December 31, 2010
|
-
|
-
|
-
|
285,377
|
On February 2, 2010 and May 6, 2010, 13,534 and 8,826 shares of Common Stock, respectively, were retired in order to meet tax liabilities associated with the vesting of Restricted Stock Grants by our executive officers.
Equity Compensation Plan Information
The following table sets forth information as of December 31, 2010:
|
Plan category
|
Number of securities to be issued upon exercise of outstanding options,
warrants and rights
|
Weighted average exercise price of outstanding options, warrants and rights
|
Number of securities remaining available
for future issuance
|
|
Equity compensation plans approved by security holders
|
-
|
-
|
105,000
|
|
Total
|
-
|
-
|
105,000
|
Other
The balance of the information called for by Item 12 will be included in our definitive proxy statement to be filed pursuant to Section 14(a) of the Securities Exchange Act of 1934, and is incorporated herein by reference.
ITEM 13. CERTAIN RELATIONSHIPS AND RELATED TRANSACTIONS, AND DIRECTOR INDEPENDENCE
The information called for by Item 13 will be included in our definitive proxy statement to be filed pursuant to Section 14(a) of the Securities Exchange Act of 1934, and is incorporated herein by reference.
ITEM 14. PRINCIPAL ACCOUNTING FEES AND SERVICES
The information called for by Item 14 will be included in our definitive proxy statement to be filed pursuant to Section 14(a) of the Securities Exchange Act of 1934, and is incorporated herein by reference.
ITEM 15. EXHIBITS, FINANCIAL STATEMENT SCHEDULES
The following financial statements, schedules and exhibits are filed as part of this report:
(a) 1. Financial Statements
The following financial statements and related notes are included on pages F-1 through F-14 of this Form
10-K.
Report of Independent Registered Public Accounting Firm
Consolidated Statements of Income for the years ended December 31, 2010, 2009, and 2008
Consolidated Balance Sheets at December 31, 2010 and 2009
Consolidated Statements of Changes in Stockholders' Investment for the years ended December 31, 2010, 2009, and 2008
Consolidated Statements of Cash Flows for the years ended December 31, 2010, 2009, and 2008
Notes to Consolidated Financial Statements
2. Financial Statement Schedules
The following financial statement schedules are included on pages S-1 through S-3 of this Form 10-K.
Report of Independent Registered Public Accounting Firm
Schedule II -- Valuation and Qualifying Accounts and Reserves
All other financial statement schedules are not required under the related instructions or are inapplicable and therefore have been omitted.
3. Exhibits
|
(3.1)
|
Restated Certificate of Incorporation of the Registrant, as amended through May 19, 2010 (filed with the Securities and Exchange Commission as Exhibit 3.1 to the Registrant's Form 10-Q dated July 28, 2010 and incorporated herein by reference)
|
|
(3.2)
|
By-Laws of the Registrant as amended through October 28, 2009 (filed with the Securities and Exchange Commission as Exhibit 3.2 to the Registrant's Form Current Report on Form 8-K dated November 2, 2009 and incorporated herein by reference)
|
|
(4.1)
|
Specimen of Common Stock Certificate (filed as an exhibit to the Registrant's Form 8-A filed with the Securities and Exchange Commission on April 25, 1980 and incorporated herein by reference)
|
|
(10.1)
|
Credit Agreement, dated as of September 30, 2003, by and among LCI Shipholdings, Inc. and Central Gulf Lines, Inc., as Joint and Several Borrowers, the banks and financial institutions listed therein, as Lenders, Deutsche Schiffsbank Aktiengesellschaft as Facility Agent and Security Trustee, DnB NOR Bank ASA, as Documentation Agent, and the Registrant, as Guarantor (filed with the Securities and Exchange Commission as Exhibit 10.2 to Pre-Effective Amendment No. 2, dated December 10, 2004 and filed with the Securities and Exchange Commission on December 10, 2004, to the Registrant's Registration Statement on Form S-1 (Registration No. 333-120161) and incorporated herein by reference)
|
|
(10.2)
|
Credit Agreement, dated September 26, 2005, by and among Central Gulf Lines, Inc., as Borrower, the banks and financial institutions listed therein, as Lenders, DnB NOR Bank ASA, as Facility Agent and Arranger, and Deutsche Schiffsbank Aktiengesellschaft, as Security Trustee and Arranger, and the Registrant, as Guarantor (filed with the Securities and Exchange Commission as Exhibit 10.1 to the Registrant's Current Report on Form 8-K dated September 30, 2005 and incorporated herein by reference)
|
|
(10.3)
|
Credit Agreement, dated December 13, 2005, by and among CG Railway, Inc., as Borrower, the investment company, Liberty Community Ventures III, L.L.C., as Lender, and the Registrant, as Guarantor (filed with the Securities and Exchange Commission as Exhibit 10.4 to the Registrant's Form 10-K for the annual period ended December 31, 2005 and incorporated herein by reference)
|
|
(10.4)
|
Credit Agreement, dated as of June 29, 2010, by and among Waterman Steamship Corporation, as borrower, the Registrant, as guarantor, and Regions as lender, relating to a $46.0 million term loan (filed with the Securities and Exchange Commission as Exhibit 10.11 to the Registrant's Form 10-Q dated July 28, 2010 and incorporated herein by reference)
|
|
(10.5)
|
Credit Agreement, dated as of August 2, 2010, by and among East Gulf Shipholding, Inc., as borrower, the Registrant, as guarantor, the banks and financial institutions listed therein, as lenders, and ING Bank N.V., London Branch, as facility agent and security trustee. (filed with the Securities and Exchange Commission as Exhibit 10.12 to the Registrant’s Form 10-Q/A dated December 23, 2010 and incorporated herein by reference) (On December 28, 2010, the Securities and Exchange Commission granted confidential treatment with respect to certain portions of this exhibit.)
|
|
(10.6)
|
$35,000,000 Revolving Loan to the Registrant and seven of its subsidiaries by Regions Bank dated March 7, 2008, as amended by instruments dated March 3, 2009, August 13, 2009 and March 31, 2010 *
|
|
(10.7)
|
Credit Agreement, dated as of January 23, 2008, by and among East Gulf Shipholding, Inc., as borrower, the Registrant, as guarantor, the banks and financial institutions party thereto, as lenders, DnB NOR Bank ASA, as facility agent, and Deutsche Schiffsbank Aktiengesellschaft, as security trustee. (filed with the Securities and Exchange Commission as Exhibit 10.13 to the Registrant’s Form 10-K for the annual period ended December 31, 2007 and incorporated herein by reference)
|
|
(10.8)
|
Consulting Agreement, dated December 15, 2010, between the Registrant and Erik F. Johnsen *
|
|
(10.9)
|
International Shipholding Corporation 2009 Stock Incentive Plan (filed with the Securities and Exchange Commission as Exhibit 99.2 to the Registrant's Current Report on Form 8-K dated April 30, 2009 and incorporated herein by reference)
|
|
(10.10)
|
Form of Restricted Stock Agreement under the International Shipholding Corporation 2009 Stock Incentive Plan (filed with the Securities and Exchange Commission as Exhibit 10.1 to the Registrant’s Form 8-K dated May 6, 2008 and incorporated herein by reference)
|
|
(10.11)
|
Form of Restricted Stock Agreement dated May 6, 2009 under the International Shipholding Corporation 2009 Stock Incentive Plan (filed with the Securities and Exchange Commission as Exhibit 99.2 to the Registrant's Current Report on Form 8-K dated May 7, 2009 and incorporated herein by reference)
|
|
(10.12)
|
Form of Restricted Stock Agreement dated January 27, 2010 under the International Shipholding Corporation 2009 Stock Incentive Plan (filed with the Securities and Exchange Commission as Exhibit 10.9 to the Registrant's Form 10-Q dated July 28, 2010 and incorporated herein by reference)
|
|
(10.13)
|
Form of Restricted Stock Agreement dated January 26, 2011 under the International Shipholding Corporation 2009 Stock Incentive Plan *
|
|
(10.14)
|
Form of Restricted Stock Agreement dated January 26, 2011 under the International Shipholding Corporation 2009 Stock Incentive Plan *
|
|
(10.15)
|
Description of Life Insurance Benefits Provided by the Registrant to Niels W. Johnsen and Erik F. Johnsen Plan (filed with the Securities and Exchange Commission as Exhibit 10.8 to the Registrant's Form 10-K for the annual period ended December 31, 2004 and incorporated herein by reference)
|
|
(10.16)
|
SHIPSALES Agreement, dated as of September 21, 2007, by and between East Gulf Shipholding, Inc., as buyer, and Clio Marine Inc., as seller. (filed with the Securities and Exchange Commission as Exhibit 10.12 to the Registrant’s Current Report on Form 8-K dated January 14, 2009 and incorporated herein by reference) (On March 3, 2009, the Securities and Exchange Commission granted confidential treatment with respect to certain portions of this exhibit.)
|
|
(10.17)
|
Change of Control Agreement, by and between the Registrant and Niels M. Johnsen, effective as of August 6, 2008 (filed with the Securities and Exchange Commission as Exhibit 10.14 to the Registrant’s Form 10-Q for quarterly period ended June 30, 2008 and incorporated herein by reference)
|
|
(10.18)
|
Change of Control Agreement, by and between the Registrant and Erik L. Johnsen, effective as of August 6, 2008 (filed with the Securities and Exchange Commission as Exhibit 10.15 to the Registrant’s Form 10-Q for quarterly period ended June 30, 2008 and incorporated herein by reference)
|
|
(10.19)
|
Change of Control Agreement, by and between the Registrant and Manuel G. Estrada, effective as of August 6, 2008 (filed with the Securities and Exchange Commission as Exhibit 10.16 to the Registrant’s Form 10-Q for quarterly period ended June 30, 2008 and incorporated herein by reference)
|
|
(10.20)
|
Form of Indemnification Agreement, by and between the Registrant and members of the Board of Directors, effective as of November 11, 2009 (filed with the Securities and Exchange Commission as Exhibit 10.20 to the Registrant’s Form 10-K for the annual period ended December 31, 2009 and incorporated herein by reference)
|
|
(10.21)
|
Shipbuilding Contract, dated as of November 6, 2009, by and between East Gulf Shipholding, Inc., as buyer, and Hyundai Mipo Dockyard Co., Ltd. as seller (filed in redacted form in redacted form with the Securities and Exchange Commission as Exhibit 10.21 to the Registrant’s Form 10-K for the annual period ended December 31, 2009 and incorporated herein by reference) (On May 20, 2010, the Securities and Exchange Commission granted confidential treatment with respect to certain portions of this exhibit.)
|
|
(10.22)
|
Shipbuilding Contract, dated as of November 6, 2009, by and between East Gulf Shipholding, Inc., as buyer, and Hyundai Mipo Dockyard Co., Ltd. as seller (filed in redacted form with the Securities and Exchange Commission as Exhibit 10.22 to the Registrant’s Form 10-K for the annual period ended December 31, 2009 and incorporated herein by reference) (On May 20, 2010, the Securities and Exchange Commission granted confidential treatment with respect to certain portions of this exhibit.)
|
|
(10.23)
|
Shipbuilding Contract, dated as of November 6, 2009, by and between East Gulf Shipholding, Inc., as buyer, and Hyundai Mipo Dockyard Co., Ltd. as seller (filed in redacted form with the Securities and Exchange Commission as Exhibit 10.23 to the Registrant’s Form 10-K for the annual period ended December 31, 2009 and incorporated herein by reference) (On May 20, 2010, the Securities and Exchange Commission granted confidential treatment with respect to certain portions of this exhibit.)
|
|
(10.24)
|
Performance Guarantee, dated as of November 11, 2009, by International Shipholding Corporation, as guarantor (filed in redacted form with the Securities and Exchange Commission as Exhibit 10.24 to the Registrant’s Form 10-K for the annual period ended December 31, 2009 and incorporated herein by reference) (On May 20, 2010, the Securities and Exchange Commission granted confidential treatment with respect to certain portions of this exhibit.)
|
|
(10.25)
|
Performance Guarantee, dated as of November 11, 2009, by International Shipholding Corporation, as guarantor (filed in redacted form with the Securities and Exchange Commission as Exhibit 10.25 to the Registrant’s Form 10-K for the annual period ended December 31, 2009 and incorporated herein by reference) (On May 20, 2010, the Securities and Exchange Commission granted confidential treatment with respect to certain portions of this exhibit.)
|
|
(10.26)
|
Performance Guarantee, dated as of November 11, 2009, by International Shipholding Corporation, as guarantor (filed in redacted form with the Securities and Exchange Commission as Exhibit 10.26 to the Registrant’s Form 10-K for the annual period ended December 31, 2009 and incorporated herein by reference) (On May 20, 2010, the Securities and Exchange Commission granted confidential treatment with respect to certain portions of this exhibit.)
|
|
(10.27)
|
Letter of Guarantee, dated as of November 12, 2009, by Korea Eximbank, as guarantor (filed in redacted form with the Securities and Exchange Commission as Exhibit 10.27 to the Registrant’s Form 10-K for the annual period ended December 31, 2009 and incorporated herein by reference) (On May 20, 2010, the Securities and Exchange Commission granted confidential treatment with respect to certain portions of this exhibit.)
|
|
(10.28)
|
Letter of Guarantee, dated as of November 12, 2009, by Korea Eximbank, as guarantor (filed in redacted form with the Securities and Exchange Commission as Exhibit 10.28 to the Registrant’s Form 10-K for the annual period ended December 31, 2009 and incorporated herein by reference) (On May 20, 2010, the Securities and Exchange Commission granted confidential treatment with respect to certain portions of this exhibit.)
|
|
(10.29)
|
Letter of Guarantee, dated as of November 12, 2009, by Korea Eximbank, as guarantor (filed in redacted form with the Securities and Exchange Commission as Exhibit 10.29 to the Registrant’s Form 10-K for the annual period ended December 31, 2009 and incorporated herein by reference) (On May 20, 2010, the Securities and Exchange Commission granted confidential treatment with respect to certain portions of this exhibit.)
|
(21.1)Subsidiaries of International Shipholding Corporation *
(23.1)Consent of Ernst & Young LLP *
|
(31.1)
|
Certification of Chief Executive Officer Pursuant to Section 302 of the Sarbanes-Oxley Act of 2002 *
|
|
|
(31.2)
|
Certification of Chief Financial Officer Pursuant to Section 302 of the Sarbanes-Oxley Act of 2002 *
|
|
|
(32.1)
|
Certification of Chief Executive Officer Pursuant to 18 U.S.C. Section 1350 as Adopted Pursuant to Section 906 of the Sarbanes-Oxley Act of 2002 *
|
|
|
(32.2)
|
Certification of Chief Financial Officer Pursuant to 18 U.S.C. Section 1350 as Adopted Pursuant to Section 906 of the Sarbanes-Oxley Act of 2002 *
|
|
|
*These exhibits filed with this 10-K report
|
SIGNATURES
Pursuant to the requirements of Section 13 or 15(d) of the Securities Exchange Act of 1934, the registrant has duly caused this report to be signed on its behalf by the undersigned, thereunto duly authorized.
INTERNATIONAL SHIPHOLDING CORPORATION
(Registrant)
/s/ Manuel G. Estrada
March 14, 2011 By ______________________________
Manuel G. Estrada
Vice President and Chief Financial Officer
Pursuant to the requirements of the Securities Exchange Act of 1934, this report has been signed below by the following persons on behalf of the registrant and in the capacities and on the dates indicated.
INTERNATIONAL SHIPHOLDING CORPORATION
(Registrant)
/s/ Niels M. Johnsen
March 14, 2011 By ____________________________
Niels M. Johnsen
Chairman of the Board and
Chief Executive Officer
/s/ Erik L. Johnsen
March 14, 2011 By ____________________________
Erik L. Johnsen
President and Director
/s/ Erik F. Johnsen
March 14, 2011 By ____________________________
Erik F. Johnsen
Director
/s/ Edwin A. Lupberger
March 14, 2011 By ____________________________
Edwin A. Lupberger
Director
/s/ H. Merritt Lane III
March 14, 2011 By ____________________________
H. Merritt Lane III
Director
/s/ T. Lee Robinson, Jr.
March 14, 2011 By ____________________________
T. Lee Robinson, Jr.
Director
/s/ James J. McNamara
March 14, 2011 By ____________________________
James J. McNamara
Director
/s/ Kenneth H. Beer
March 14, 2011 By ____________________________
Kenneth H. Beer
Director
/s/ Harris V. Morrissette
March 14, 2011 By ____________________________
Harris V. Morrissette
Director
/s/ Manuel G. Estrada
March 14, 2011 By ____________________________
Manuel G. Estrada
Vice President and Chief Financial Officer
/s/ Kevin M. Wilson
March 14, 2011 By __________________________
Kevin M. Wilson
Controller
INDEX OF FINANCIAL STATEMENTS
REPORT OF INDEPENDENT REGISTERED PUBLIC ACCOUNTING FIRM
The Board of Directors and Stockholders
International Shipholding Corporation
We have audited the accompanying consolidated balance sheets of International Shipholding Corporation as of December 31, 2010 and 2009, and the related consolidated statements of income, changes in stockholders’ investment, and cash flows for each of the three years in the period ended December 31, 2010. These financial statements are the responsibility of the Company’s management. Our responsibility is to express an opinion on these financial statements based on our audits.
We conducted our audits in accordance with the standards of the Public Company Accounting Oversight Board (United States). Those standards require that we plan and perform the audit to obtain reasonable assurance about whether the financial statements are free of material misstatement. An audit includes examining, on a test basis, evidence supporting the amounts and disclosures in the financial statements. An audit also includes assessing the accounting principles used and significant estimates made by management, as well as evaluating the overall financial statement presentation. We believe that our audits provide a reasonable basis for our opinion.
In our opinion, the financial statements referred to above present fairly, in all material respects, the consolidated financial position of International Shipholding Corporation at December 31, 2010 and 2009, and the consolidated results of its operations and its cash flows for each of the three years in the period ended December 31, 2010, in conformity with U.S. generally accepted accounting principles.
We also have audited, in accordance with the standards of the Public Company Accounting Oversight Board (United States), International Shipholding Corporation's internal control over financial reporting as of December 31, 2010, based on criteria established in Internal Control-Integrated Framework issued by the Committee of Sponsoring Organizations of the Treadway Commission and our report dated March 14, 2011 expressed an unqualified opinion thereon.
/s/ Ernst & Young LLP
New Orleans, Louisiana
March 14, 2011
|
INTERNATIONAL SHIPHOLDING CORPORATION
|
||||||||||||
|
CONSOLIDATED STATEMENTS OF INCOME
|
||||||||||||
|
(All Amounts in Thousands Except Share Data)
|
||||||||||||
|
Year ended December 31,
|
||||||||||||
|
2010
|
2009
|
2008
|
||||||||||
|
Revenues
|
$ | 290,049 | $ | 379,951 | $ | 281,901 | ||||||
|
Operating Expenses:
|
||||||||||||
|
Voyage Expenses
|
209,347 | 295,678 | 220,240 | |||||||||
|
Vessel Depreciation
|
17,929 | 20,254 | 19,968 | |||||||||
|
Impairment Loss
|
25,430 | 2,899 | - | |||||||||
|
Gross Voyage Profit
|
37,343 | 61,120 | 41,693 | |||||||||
|
Administrative and General Expenses
|
21,202 | 22,641 | 21,414 | |||||||||
|
Loss (Gain) on Sale of Other Assets
|
(42 | ) | 2,209 | - | ||||||||
|
Operating Income
|
16,183 | 36,270 | 20,279 | |||||||||
|
Interest and Other:
|
||||||||||||
|
Interest Expense
|
7,157 | 6,110 | 6,886 | |||||||||
|
Derivative Loss
|
426 | - | - | |||||||||
|
(Gain) Loss on Sale of Investments
|
(213 | ) | (980 | ) | 148 | |||||||
|
Loss on Redemption of Preferred Stock
|
- | - | 1,371 | |||||||||
|
Other Income from Vessel Financing
|
(2,335 | ) | (655 | ) | - | |||||||
|
Investment (Income) Loss
|
(1,778 | ) | 72 | (525 | ) | |||||||
|
Foreign Exchange Loss
|
8,196 | - | - | |||||||||
| 11,453 | 4,547 | 7,880 | ||||||||||
|
Income Before (Benefit) Provision for Income Taxes and
|
||||||||||||
|
Equity in Net Income of Unconsolidated Entities
|
4,730 | 31,723 | 12,399 | |||||||||
|
(Benefit) Provision for Income Taxes:
|
||||||||||||
|
Current
|
692 | 306 | 33 | |||||||||
|
Deferred
|
(1,982 | ) | (3,845 | ) | (910 | ) | ||||||
| (1,290 | ) | (3,539 | ) | (877 | ) | |||||||
|
Equity in Net Income of Unconsolidated
|
||||||||||||
|
Entities (Net of Applicable Taxes)
|
9,282 | 6,959 | 20,946 | |||||||||
|
Income from Continuing Operations
|
15,302 | 42,221 | 34,222 | |||||||||
|
Income from Discontinued Operations:
|
||||||||||||
|
Income from Discontinued Operations
|
- | - | 220 | |||||||||
|
Gain on Sale of Liner Assets
|
- | - | 4,607 | |||||||||
|
Net Income from Discontinued Operations
|
- | - | 4,827 | |||||||||
|
Net Income
|
$ | 15,302 | $ | 42,221 | $ | 39,049 | ||||||
|
Preferred Stock Dividends
|
- | - | 88 | |||||||||
|
Net Income Available to Common Stockholders
|
$ | 15,302 | $ | 42,221 | $ | 38,961 | ||||||
|
Basic and Diluted Earnings Per Common Share:
|
||||||||||||
|
Continuing Operations
|
$ | 2.14 | $ | 5.84 | $ | 4.67 | ||||||
|
Discontinued Operations
|
- | - | 0.66 | |||||||||
|
Basic Earnings Per Common Share:
|
$ | 2.14 | $ | 5.84 | $ | 5.33 | ||||||
|
Continuing Operations
|
$ | 2.12 | $ | 5.80 | $ | 4.56 | ||||||
|
Discontinued Operations
|
- | - | 0.64 | |||||||||
|
Diluted Earnings Per Common Share:
|
$ | 2.12 | $ | 5.80 | $ | 5.20 | ||||||
|
Weighted Average Shares of Common Stock Outstanding:
|
||||||||||||
|
Basic
|
7,158,439 | 7,224,748 | 7,314,216 | |||||||||
|
Diluted
|
7,231,178 | 7,282,119 | 7,501,555 | |||||||||
|
Dividends Per Share
|
$ | 1.625 | $ | 2.00 | - | |||||||
The accompanying notes are an integral part of these statements.
|
INTERNATIONAL SHIPHOLDING CORPORATION
|
||||||||
|
CONSOLIDATED BALANCE SHEETS
|
||||||||
|
(All Amounts in Thousands)
|
||||||||
|
December 31,
|
December 31,
|
|||||||
|
ASSETS
|
2010
|
2009
|
||||||
|
Current Assets:
|
||||||||
|
Cash and Cash Equivalents
|
$ | 24,158 | $ | 47,468 | ||||
|
Marketable Securities
|
11,527 | 10,333 | ||||||
|
Accounts Receivable, Net of Allowance for Doubtful Accounts
|
||||||||
|
of $311 and $299 in 2010 and 2009:
|
||||||||
|
Traffic
|
6,364 | 5,221 | ||||||
|
Agents'
|
1,555 | 3,353 | ||||||
|
Other
|
8,555 | 12,637 | ||||||
|
Federal Income Taxes Receivable
|
242 | - | ||||||
|
Net Investment in Direct Financing Leases
|
5,596 | 52,649 | ||||||
|
Other Current Assets
|
2,513 | 1,640 | ||||||
|
Notes Receivable
|
4,248 | 5,348 | ||||||
|
Material and Supplies Inventory
|
3,774 | 3,100 | ||||||
|
Total Current Assets
|
68,532 | 141,749 | ||||||
|
Investment in Unconsolidated Entities
|
27,261 | 15,971 | ||||||
|
Net Investment in Direct Financing Leases
|
50,102 | 55,046 | ||||||
|
Property, Plant and Equipment:
|
||||||||
|
Vessels
|
365,797 | 314,534 | ||||||
|
Leasehold Improvements
|
26,128 | 26,128 | ||||||
|
Construction in Progress
|
78,355 | 49,496 | ||||||
|
Furniture and Equipment
|
7,863 | 6,966 | ||||||
| 478,143 | 397,124 | |||||||
|
Less - Accumulated Depreciation
|
(143,667 | ) | (185,292 | ) | ||||
| 334,476 | 211,832 | |||||||
|
Other Assets:
|
||||||||
|
Deferred Charges, Net of Accumulated Amortization
|
14,482 | 15,914 | ||||||
|
of $14,525 and $20,826 in 2010 and 2009, Respectively
|
||||||||
|
Acquired Contract Costs, Net of Accumulated Amortization
|
- | 364 | ||||||
|
of $30,526 and $30,162 in 2010 and 2009, Respectively
|
||||||||
|
Due from Related Parties
|
4,124 | 5,043 | ||||||
|
Notes Receivable
|
40,142 | 44,390 | ||||||
|
Other
|
5,004 | 6,341 | ||||||
| 63,752 | 72,052 | |||||||
|
|
$ | 544,123 | $ | 496,650 | ||||
|
INTERNATIONAL SHIPHOLDING CORPORATION
|
||||||||
|
CONSOLIDATED BALANCE SHEETS
|
||||||||
|
(All Amounts in Thousands)
|
||||||||
|
December 31,
|
December 31,
|
|||||||
|
|
2010
|
2009
|
||||||
|
LIABILITIES AND STOCKHOLDERS' INVESTMENT
|
|
|
||||||
|
Current Liabilities:
|
||||||||
|
Current Maturities of Long-Term Debt
|
$ | 21,324 | $ | 68,789 | ||||
|
Accounts Payable and Accrued Liabilities
|
32,114 | 32,422 | ||||||
|
Total Current Liabilities
|
53,438 | 101,211 | ||||||
|
Long-Term Debt, Less Current Maturities
|
200,241 | 97,635 | ||||||
|
Other Long-Term Liabilities:
|
||||||||
|
Deferred Income Taxes
|
- | 2,070 | ||||||
|
Lease Incentive Obligation
|
7,022 | 6,262 | ||||||
|
Other
|
49,672 | 50,541 | ||||||
| 56,694 | 58,873 | |||||||
|
Stockholders' Investment:
|
||||||||
|
Common Stock, $1.00 Par Value, 10,000,000 Shares Authorized,
|
8,564 | 8,484 | ||||||
|
7,075,659 And 7,228,570 Shares Issued at December 31, 2010 and
|
||||||||
|
December 31, 2009, Respectively
|
||||||||
|
Additional Paid-In Capital
|
84,846 | 83,189 | ||||||
|
Retained Earnings
|
183,541 | 180,121 | ||||||
|
Treasury Stock, 1,388,066 and 1,165,015 Shares
|
(25,403 | ) | (20,172 | ) | ||||
|
at December 31, 2010 and 2009, Respectively
|
||||||||
|
Accumulated Other Comprehensive Loss
|
(17,798 | ) | (12,691 | ) | ||||
| 233,750 | 238,931 | |||||||
| $ | 544,123 | $ | 496,650 | |||||
The accompanying notes are an integral part of these statements.
|
CONSOLIDATED STATEMENTS OF CHANGES IN STOCKHOLDERS' INVESTMENT
|
||||||||||||||||||||||||
|
(All Amounts in Thousands)
|
||||||||||||||||||||||||
|
|
Accumulated
|
|||||||||||||||||||||||
|
Additional
|
|
Other
|
|
|||||||||||||||||||||
|
Common
|
Paid-In
|
Retained
|
Treasury
|
Comprehensive
|
||||||||||||||||||||
|
Stock
|
Capital
|
Earnings
|
Stock
|
(Loss) Income
|
Total
|
|||||||||||||||||||
|
Balance at December 31, 2007
|
$ | 7,193 | $ | 60,177 | $ | 117,008 | $ | (8,704 | ) | $ | (1,972 | ) | $ | 173,702 | ||||||||||
|
Comprehensive Income:
|
||||||||||||||||||||||||
|
Net Income
|
- | - | 39,050 | - | - | 39,050 | ||||||||||||||||||
|
Other Comprehensive Income (Loss):
|
||||||||||||||||||||||||
|
Unrealized Holding Gain on Marketable Securities,
|
||||||||||||||||||||||||
|
Net of Deferred Taxes of ($465)
|
- | - | - | - | (848 | ) | (848 | ) | ||||||||||||||||
|
Net Change in Fair Value of Derivatives, Net of
|
||||||||||||||||||||||||
|
Deferred Taxes of ($1,275)
|
- | - | - | - | (9,809 | ) | (9,809 | ) | ||||||||||||||||
|
Change in Funding Status of Benefit Plans, Net of
|
||||||||||||||||||||||||
|
Deferred Taxes of $970
|
- | - | - | - | (4,219 | ) | (4,219 | ) | ||||||||||||||||
|
Total Comprehensive Income
|
24,174 | |||||||||||||||||||||||
|
Compensation Expense - restricted stock
|
41 | 716 | - | - | - | 757 | ||||||||||||||||||
|
Repurchase of Common Stock
|
- | - | - | (11,468 | ) | - | (11,468 | ) | ||||||||||||||||
|
Preferred Stock Dividends
|
- | - | (88 | ) | - | - | (88 | ) | ||||||||||||||||
|
Common Stock Dividends ($0.50 per share)
|
- | - | (3,591 | ) | - | - | (3,591 | ) | ||||||||||||||||
|
Preferred Stock Conversion
|
1,156 | 20,550 | - | - | - | 21,706 | ||||||||||||||||||
|
Balance at December 31, 2008
|
$ | 8,390 | $ | 81,443 | $ | 152,379 | $ | (20,172 | ) | $ | (16,848 | ) | $ | 205,192 | ||||||||||
|
Comprehensive Income:
|
||||||||||||||||||||||||
|
Net Income
|
- | - | 42,221 | - | - | 42,221 | ||||||||||||||||||
|
Other Comprehensive Income (Loss):
|
||||||||||||||||||||||||
|
Unrealized Foreign Currency Translation Loss
|
- | - | - | - | 65 | 65 | ||||||||||||||||||
|
Unrealized Holding Gain on Marketable Securities,
|
||||||||||||||||||||||||
|
Net of Deferred Taxes of $131
|
- | - | - | - | 222 | 222 | ||||||||||||||||||
|
Net Change in Fair Value of Derivatives, Net of
|
||||||||||||||||||||||||
|
Deferred Taxes of $200
|
- | - | - | - | 4,156 | 4,156 | ||||||||||||||||||
|
Change in Funding Status of Benefit Plans, Net of
|
||||||||||||||||||||||||
|
Deferred Taxes of $11
|
- | - | - | - | (286 | ) | (286 | ) | ||||||||||||||||
|
Total Comprehensive Income
|
46,378 | |||||||||||||||||||||||
|
Compensation Expense - restricted stock
|
94 | 1,746 | - | - | - | 1,840 | ||||||||||||||||||
|
Common Stock Dividends ($2.00 per share)
|
- | - | (14,479 | ) | - | - | (14,479 | ) | ||||||||||||||||
|
Preferred Stock Conversion
|
- | - | - | - | - | - | ||||||||||||||||||
|
Balance at December 31, 2009
|
$ | 8,484 | $ | 83,189 | $ | 180,121 | $ | (20,172 | ) | $ | (12,691 | ) | $ | 238,931 | ||||||||||
|
Comprehensive Income:
|
||||||||||||||||||||||||
|
Net Income
|
- | - | 15,302 | - | - | 15,302 | ||||||||||||||||||
|
Other Comprehensive Income (Loss):
|
||||||||||||||||||||||||
|
Unrealized Foreign Currency Translation Gain
|
- | - | - | - | 111 | 111 | ||||||||||||||||||
|
Unrealized Holding Gain on Marketable Securities, Net of Deferred Taxes of $72
|
- | - | - | - | 133 | 133 | ||||||||||||||||||
|
Net Change in Fair Value of Derivatives, Net of
|
||||||||||||||||||||||||
|
Deferred Taxes of ($137)
|
- | - | - | - | (1,856 | ) | (1,856 | ) | ||||||||||||||||
|
Change in Funding Status of Benefit Plans, Net of Deferred Taxes of $0
|
- | - | - | - | (3,495 | ) | (3,495 | ) | ||||||||||||||||
|
Total Comprehensive Income
|
10,195 | |||||||||||||||||||||||
|
Stock-Based Compensation, net of Shares Withheld
|
80 | 1,657 | - | - | - | 1,737 | ||||||||||||||||||
|
Repurchase of Common Stock
|
- | - | - | (5,231 | ) | - | (5,231 | ) | ||||||||||||||||
|
Common Stock Dividends ($1.625 per share)
|
- | - | (11,882 | ) | - | - | (11,882 | ) | ||||||||||||||||
|
Balance at December 31, 2010
|
$ | 8,564 | $ | 84,846 | $ | 183,541 | $ | (25,403 | ) | $ | (17,798 | ) | $ | 233,750 | ||||||||||
The accompanying notes are an integral part of these statements.
|
CONSOLIDATED STATEMENTS OF CASH FLOWS
|
||||||||||||
|
(All Amounts in Thousands)
|
||||||||||||
|
|
Year Ended December 31,
|
|||||||||||
|
2010
|
2009
|
2008
|
||||||||||
|
Cash Flows from Operating Activities:
|
||||||||||||
|
Net Income
|
$ | 15,302 | $ | 42,221 | $ | 39,050 | ||||||
|
Adjustments to Reconcile Net Income to Net Cash Provided by
|
||||||||||||
|
Operating Activities:
|
||||||||||||
|
Depreciation
|
18,898 | 21,020 | 20,351 | |||||||||
|
Amortization of Deferred Charges and Other Assets
|
6,569 | 9,878 | 8,566 | |||||||||
|
Deferred Benefit for Income Taxes
|
(1,982 | ) | (3,845 | ) | (910 | ) | ||||||
|
Impairment Loss
|
25,430 | 2,899 | - | |||||||||
|
Loss on Early Redemption of Preferred Stock
|
- | - | 1,371 | |||||||||
|
Non-Cash Stock Based Compensation
|
2,341 | 1,834 | 757 | |||||||||
|
Equity in Net Income of Unconsolidated Entities
|
(9,282 | ) | (6,959 | ) | (20,946 | ) | ||||||
|
Distributions from Unconsolidated Entities
|
3,000 | 3,000 | 6,000 | |||||||||
|
(Gain) Loss on Sale of Assets
|
(42 | ) | 2,209 | (4,607 | ) | |||||||
|
(Gain) Loss on Sale of Investments
|
(213 | ) | (980 | ) | 148 | |||||||
|
Loss on Foreign Currency Exchange
|
8,196 | - | - | |||||||||
|
Deferred Drydocking Charges
|
(2,516 | ) | (15,960 | ) | (4,171 | ) | ||||||
|
Changes in:
|
||||||||||||
|
Accounts Receivable
|
4,737 | 1,649 | (3,202 | ) | ||||||||
|
Inventories and Other Current Assets
|
(1,287 | ) | 704 | (72 | ) | |||||||
|
Other Assets
|
1,337 | (913 | ) | (386 | ) | |||||||
|
Accounts Payable and Accrued Liabilities
|
(3,906 | ) | 6,059 | 1,041 | ||||||||
|
Other Long-Term Liabilities
|
(2,195 | ) | (135 | ) | (805 | ) | ||||||
|
Net Cash Provided by Operating Activities
|
64,387 | 62,681 | 42,185 | |||||||||
|
Cash Flows from Investing Activities:
|
||||||||||||
|
Principal Payments Received under Direct Financing Leases
|
5,522 | 7,763 | 7,497 | |||||||||
|
Purchases of Property, Plant and Equipment
|
(123,146 | ) | (80,303 | ) | (4,024 | ) | ||||||
|
Proceeds from Sale of Assets
|
3,853 | 5,020 | 10,818 | |||||||||
|
Purchase of Marketable Securities
|
(10,938 | ) | (10,617 | ) | (4,743 | ) | ||||||
|
Proceeds from Sale of Marketable Securities
|
9,615 | 3,529 | 6,361 | |||||||||
|
Investment in Unconsolidated Entities
|
(4,949 | ) | (6,250 | ) | - | |||||||
|
Distributions from Unconsolidated Entities
|
- | - | 25,500 | |||||||||
|
Payments on Note Receivables
|
5,167 | 1,082 | 25 | |||||||||
|
Net Cash (Used in) Provided by Investing Activities
|
(114,876 | ) | (79,776 | ) | 41,434 | |||||||
|
Cash Flows from Financing Activities:
|
||||||||||||
|
Redemption of Preferred Stock
|
- | - | (17,306 | ) | ||||||||
|
Common Stock Repurchase
|
(5,231 | ) | - | (11,468 | ) | |||||||
|
Proceeds from Issuance of Debt
|
153,476 | 41,617 | - | |||||||||
|
Repayment of Debt
|
(108,029 | ) | (14,175 | ) | (12,950 | ) | ||||||
|
Additions to Deferred Financing Charges
|
(1,155 | ) | (235 | ) | (484 | ) | ||||||
|
Preferred Stock Dividends Paid
|
- | - | (88 | ) | ||||||||
|
Common Stock Dividends Paid
|
(11,882 | ) | (14,479 | ) | (3,591 | ) | ||||||
|
Net Cash Provided by (Used in) Financing Activities
|
27,179 | 12,728 | (45,887 | ) | ||||||||
|
Net (Decrease) Increase in Cash and Cash Equivalents
|
(23,310 | ) | (4,367 | ) | 37,732 | |||||||
|
Cash and Cash Equivalents at Beginning of Period
|
47,468 | 51,835 | 14,103 | |||||||||
|
Cash and Cash Equivalents at End of Period
|
$ | 24,158 | $ | 47,468 | $ | 51,835 | ||||||
|
Noncash investing and financing activities:
|
||||||||||||
|
Note received as consideration in sale of vessels
|
$ | - | $ | 50,800 | $ | - | ||||||
|
Noncash investing activities:
|
||||||||||||
|
Reclassification of direct financing lease to vessels
|
$ | 48,093 | $ | - | $ | - | ||||||
The accompanying notes are an integral part of these statements.
NOTE A - SUMMARY OF SIGNIFICANT ACCOUNTING POLICIES
Basis of Presentation
The accompanying consolidated financial statements include the accounts of International Shipholding Corporation (a Delaware corporation) and its majority-owned subsidiaries. In this report, the terms “we,” “us,” “our,” and “the Company” refer to International Shipholding Corporation and its subsidiaries. All significant intercompany accounts and transactions have been eliminated.
Our policy is to consolidate all subsidiaries in which we hold a greater than 50% voting interest or otherwise control its operating and financial activities. We use the equity method to account for investments in entities in which we hold a 20% to 50% voting interest and have the ability to exercise significant influence over their operating and financial activities, and the cost method to account for investments in entities in which we hold less than 20% voting interest and in which we cannot exercise significant influence over operating and financial activities.
Certain reclassifications have been made to the prior period financial information in order to conform to current year presentation.
Nature of Operations
Through our subsidiaries, we operate a diversified fleet of U.S. and international flag vessels that provide domestic and international maritime transportation services to commercial customers and agencies of the United States government primarily under medium- to long-term charters or contracts. At December 31, 2010, our fleet consisted of 40 ocean-going vessels or newbuildings and related shoreside handling facilities. Our strategy is to (i) identify customers with high credit quality and marine transportation needs requiring specialized vessels or operating techniques, (ii) seek medium- to long-term charters or contracts with those customers and, if necessary, modify, acquire, or construct vessels to meet the requirements of those charters or contracts, and (iii) provide our customers with reliable, high quality service at a reasonable cost.
Use of Estimates
The preparation of financial statements in conformity with accounting principles generally accepted in the United States requires management to make estimates and assumptions that affect the reported amounts of assets and liabilities and disclosure of contingent assets and liabilities at the date of the financial statements and the reported amounts of revenues and expenses during the reporting period. Actual results could differ from those estimates. Estimates are primarily used in accounting for the impairment and depreciation of fixed assets, self retention insurance, asbestos claims, pension and postretirement benefits, derivative instruments and hedging activities and income taxes.
Voyage Revenue and Expense Recognition
Revenues and expenses relating to our Rail-Ferry Service segment’s voyages are recorded over the duration of the voyage. Our voyage expenses are estimated at the beginning of the voyages based on historical actual costs or from industry sources familiar with those types of charges. As the voyage progresses, these estimated costs are revised with actual charges and timely adjustments are made. The expenses are allocated over the voyage based on the number of days in progress at the end of the period. We believe there is no material difference between recording estimated expenses allocated over the voyage versus recording expenses as incurred. Revenues and expenses relating to our other segments’ voyages, which require no estimates or assumptions, are recorded when earned or incurred during the reporting period.
Maritime Security Program
The Maritime Security Act, which established the Maritime Security Program (“MSP”), was signed into law in October of 1996 and has been extended to 2015. As of December 31, 2010, six of our Pure Car/Truck Carriers (“PCTCs”), and two of our container vessels were qualified and received contracts for MSP participation. Annual payments for each vessel in the MSP program were $2,900,000 in 2010 and 2009 and $2,600,000 in 2008. We recognize MSP revenue on a monthly basis over the duration of the qualifying contracts.
Cash and Cash Equivalents
We consider highly liquid debt instruments, mutual funds, and money market funds with an original maturity of three months or less to be cash equivalents. The carrying amount approximates fair value for these instruments.
Inventories
Inventories aboard our vessels are carried at the lower of cost or market based on the first-in, first-out method of accounting. As of December 31, 2010 and 2009, inventory including all spare parts was approximately $3,800,000 and $3,100,000, respectively.
Allowance for Doubtful Accounts
We provide an allowance for doubtful accounts for accounts receivable balances estimated to be non-collectible. These provisions are maintained based on identified specific accounts, past experiences, and current trends, and require management’s estimates with respect to the amounts that are non-collectible. Accounts receivable balances are written off against our allowance for doubtful accounts when deemed non-collectible.
Property, Plant and Equipment
For financial reporting purposes, property, plant and equipment are depreciated over their estimated useful lives using the straight-line method to the estimated salvage value. The estimated useful lives of property, plant and equipment at December 31, 2010 are as follows:
|
Years
|
||||
|
7 Pure Car/Truck Carriers
|
20
|
|||
|
1 Coal Carrier
|
15
|
|||
|
3 Other Vessels *
|
25
|
|||
|
Leasehold Improvements
|
10-20
|
|||
|
Other Equipment
|
3-12
|
|||
|
Furniture and Equipment
|
3-10
|
* Includes two Special Purpose vessels and one Tanker vessel.
At December 31, 2010, our fleet of 40 vessels also included (i) three Roll-On/Roll-Off (“RO/RO”) vessels, which we operate, (ii) a Molten Sulphur Carrier, two Multi-Purpose vessels and four container vessels, which we charter in one of our services, (iii) two PCTCs which we lease for our Time Charter contracts, (iv) three Handy-size Double Hull newbuildings, which were delivered to us in the first quarter of 2011, (v) two Cape-Size Bulk Carriers and two Handymax-size Bulk Carrier Newbuildings in which we own a 50% interest and (vi) five Mini Bulker Carriers and five Mini Bulker Newbuildings in which we own a 25% interest.
Costs of all major property additions and betterments are capitalized. Ordinary maintenance and repair costs are expensed as incurred. Interest and finance costs relating to vessels and other equipment under construction are capitalized to properly reflect the cost of assets acquired. Capitalized interest totaled $1,788,000, $943,000, and $698,000 for the years ended December 31, 2010, 2009, and 2008, respectively. Capitalized interest was calculated based on our weighted-average interest rate on our outstanding debt.
We monitor our fixed assets for impairment and perform an impairment analysis in accordance with Accounting Standards Codification (“ASC”) Topic 360-10-05 when triggering events or circumstances indicate a fixed asset or asset group may be impaired. Such events or circumstances may include a decrease in the market price of the long-lived asset or asset group or a significant change in the way the asset is being used. Once a triggering event or circumstance is identified an analysis is done which shows the net book value of the asset as compared to the estimated undiscounted future cash flows the asset will generate over its remaining useful life. It is possible that our asset impairment review would include a determination of the asset’s fair value based on a third-party evaluation or appraisal. An impairment loss is measured as the amount by which the carrying amount of a long-lived asset or asset group exceeds its fair value.
We recorded an impairment charge of $25,430,000 in 2010 on our Rail Ferry service assets and a charge of $2,899,000 on an International Flag container vessel (See Note V – Impairment of Long Lived Assets).
Drydocking Costs
We defer certain costs related to the drydocking of our vessels. Deferred drydocking costs are capitalized as incurred and amortized on a straight-line basis over the period between drydockings (generally two to five years). Because drydocking charges can be material in any one period, we believe that the capitalization and amortization of these costs over the drydocking period provides a better matching with the future revenue generated by our vessel. We capitalize only those costs that are incurred to meet regulatory requirements. Normal repairs, whether incurred as part of the drydocking or not, are expensed as incurred (See Note J – Deferred Charges and Acquired Contract Costs).
Deferred Financing Charges and Acquired Contract Costs
We amortize our deferred financing charges and acquired contract costs over the terms of the related financing agreements and contracts using the effective interest method (See Note J – Deferred Charges and Acquired Contract Costs on).
Self-Retention Insurance
We maintain provisions for estimated losses under our self-retention insurance program based on estimates of the eventual claims settlement costs. The measurement of our exposure for self-insurance liability requires management to make estimates and assumptions that affect the amount of loss provisions recorded during the reporting period. Actual results could differ materially from those estimates (See Note D – Self-Retention Insurance).
Asbestos Claims
We maintain provisions for estimated losses for asbestos claims based on estimates of eventual claims settlement costs. Our policy is to establish provisions based on a range of estimated exposure. We estimate this potential range of exposure using input from legal counsel and internal estimates based on the individual deductible levels for each policy year. We believe that insurance and the indemnification of a previous owner of one of our wholly-owned subsidiaries will partially mitigate our exposure. The measurement of our exposure for asbestos liability requires management to make estimates and assumptions that affect the amount of the loss provisions recorded during the period. Our estimates and assumptions are formed from variables such as the maximum deductible levels in a claim year, the amount of the indemnification recovery and the claimant's employment history with the company. Actual results could differ materially from those estimates.
Income Taxes
Income taxes are accounted for in accordance with ASC Topic 740-10. Provisions for income taxes include deferred income taxes that are provided on items of income and expense, which affect taxable income in one period and financial statement income in another.
Certain foreign operations are not subject to income taxation under pertinent provisions of the laws of the country of incorporation or operation. However, pursuant to existing U.S. tax laws, earnings from certain of our foreign operations are subject to U.S. income taxes when those earnings are repatriated to the U.S.
The Jobs Creation Act, which first applied to us on January 1, 2005, changed the U.S. tax treatment of the foreign operations of our U.S. flag vessels and our international flag shipping operations. We made an election under the Jobs Creation Act to have our qualifying U.S. flag operations taxed under the “tonnage tax” regime rather than under the usual U.S. corporate income tax regime (See Note F – Income Taxes).
Foreign Currency Transactions
Certain of our revenues and expenses are converted into or denominated in foreign currencies, primarily the Singapore Dollar, Indonesian Rupiah, Euro, British Pound, Mexican Peso, Australian Dollar, and Japanese Yen. All exchange adjustments are charged or credited to income in the year incurred. We recognized an exchange gain of $1,259,000 for the year ended December 31, 2010 and a loss of $208,000 and $35,000 for the years ended December 31, 2009 and 2008, respectively. These gains and losses are recorded as operating gains and losses.
In addition to the foreign currency operational transactions, we also recorded a non-cash foreign exchange loss of $8.2 million, reflecting the periodic remeasurement of a Yen-denominated credit facility to U.S. Dollars. This loss is reflected in our consolidated statements of income as “Interest and Other.”
Dividend Policy
The payment of dividends is at the discretion of our Board of Directors. On October 29, 2008, our Board of Directors authorized the reinstitution of a quarterly cash dividend program beginning in the fourth quarter of 2008.
Earnings Per Share
Basic earnings per share was computed based on the weighted average number of common shares issued and outstanding during the relevant periods. Diluted earnings per share also reflects dilutive potential common shares, including shares issuable under stock options and restricted stock grants using the treasury stock method.
Derivative Instruments and Hedging Activities
Under ASC Topic 815-10, in order to consider a derivative instrument as a hedge, (i) we must designate the instrument as a hedge of future transactions, and (ii) the instrument must reduce our exposure to the applicable risk. If the above criteria are not met, we must record the fair market value of the instrument at the end of each period and recognize the related gain or loss through earnings. If the instrument qualifies as a hedge, net settlements under the agreement are recognized as an adjustment to earnings, while changes in the fair market value of the hedge are recorded through Stockholders’ Investment in Other Comprehensive Income (Loss). We currently employ, or have employed in the recent past, interest rate swap agreements and foreign currency contracts (See Note N – Fair Value of Financial Instruments and Derivatives).
Stock-Based Compensation
Under ASC Topic 505-50, we determine compensation cost based on the grant date fair value of awards and record compensation expense over the vesting period of such awards. The compensation cost related to our restricted stock is determined based on the average stock price on the date of grant and is amortized on a straight-line basis over the vesting period. (See Note S – Stock-Based Compensation).
Pension and Postretirement Benefits
Our pension and postretirement benefit costs are calculated using various actuarial assumptions and methodologies. These assumptions include discount rates, health care cost trend rates, inflation, rate of compensation increases, expected return on plan assets, mortality rates, and other factors. We believe that the assumptions utilized in recording the obligations under our plans are reasonable based on input from our outside actuary and information as to historical experience and performance. Differences in actual experience or changes in assumptions may affect our pension and postretirement obligations and future expense.
We account for our pension and postretirement benefit plans in accordance with ASC Topic 715-30-35. This statement requires balance sheet recognition of the overfunded or underfunded status of pension and postretirement benefit plans. Under ASC Topic 715-30-35, actuarial gains and losses, prior service costs or credits, and any remaining transition assets or obligations that have not been recognized under previous accounting standards must be recognized in Other Comprehensive Income (Loss), net of tax effects, until they are amortized as a component of net periodic benefit cost. In addition, the measurement date, the date at which plan assets and the benefit obligation are measured, is required to be the Company’s fiscal year end. This standard does not change the determination of net periodic benefit cost included in net income or the measurement issues associated with benefit plan accounting. For the period ended December 31, 2010, the effect of the adjustment to our underfunded status was an increase in the liability of $3,495,000, and an Other Comprehensive Loss of $3,495,000, net of taxes of $0. For the period ended December 31, 2009, the effect of the adjustment to our underfunded status was an increase in the liability of $275,000, and an Other Comprehensive Loss of $286,000, net of taxes of $11,000 (See Note E – Employee Benefit Plans).
New Accounting Pronouncements
In January 2010, the Financial Accounting Standards Board (“FASB”) issued guidance which expanded the required disclosures about fair value measurements. In particular, this guidance requires (i) separate disclosure of the amounts of significant transfers in and out of Level 1 and Level 2 fair value measurements along with the reasons for such transfers, (ii) information about purchases, sales, issuances and settlements to be presented separately in the reconciliation for Level 3 fair value measurements, (iii) fair value measurement disclosures for each class of assets and liabilities and (iv) disclosures about the valuation techniques and inputs used to measure fair value for both recurring and nonrecurring fair value measurements for fair value measurements that fall in either Level 2 or Level 3. The adoption of this guidance did not have a material effect on our financial condition or results of operations.
In June 2009, the FASB issued an accounting standard to require an enterprise to perform an analysis to determine whether the enterprise’s variable interest or interests give it a controlling financial interest in a variable interest entity (“VIE”), identifying the primary beneficiary of a VIE, and to require ongoing reassessment of whether an enterprise is the primary beneficiary of a VIE, rather than only when specific events occur. The standard also eliminated the quantitative approach previously required for determining the primary beneficiary of a VIE, amended certain guidance for determining whether an entity is a VIE, added an additional reconsideration event when changes in facts and circumstances pertinent to a VIE occur, eliminated the exception for troubled debt restructuring regarding VIE reconsideration and required advanced disclosures that provide users of financial statements with more transparent information about an enterprise’s involvement in a VIE. We adopted this accounting standard effective January 1, 2010. The adoption of this standard did not have a material effect on our financial condition or results of operations.
NOTE B – PROPERTY, PLANT & EQUIPMENT
Property, plant and equipment consisted of the following (in thousands):
|
December 31,
|
||||||||
|
(All Amounts in Thousands)
|
2010
|
2009
|
||||||
|
Pure Car/Truck Carriers*
|
$ | 227,947 | $ | 97,031 | ||||
|
Special Purpose Vessels**
|
37,070 | 109,934 | ||||||
|
Coal Carrier
|
92,771 | 92,771 | ||||||
|
Container Ships
|
- | 14,798 | ||||||
|
Tanker
|
8,009 | - | ||||||
|
Non-vessel related property, plant and equipment
|
33,991 | 33,094 | ||||||
| 399,788 | 347,628 | |||||||
|
Less: Accumulated depreciation
|
(143,667 | ) | (185,292 | ) | ||||
| 256,121 | 162,336 | |||||||
|
Construction-in-progress
|
78,355 | 49,496 | ||||||
| $ | 334,476 | $ | 211,832 | |||||
* Recently constructed PCTC placed in service in April 2010 and redelivery of PCTC previously under direct finance lease, classified as PP&E in 2010.
**Writedown of two Roll-on/Roll-off Special Purpose double-deck vessels (see Note V – Impairment of Long Lived Assets)
NOTE C – LONG-TERM DEBT
Long-term debt consisted of the following:
|
( in thousands)
|
Interest Rate
|
Total Principal Due
|
|||||||
|
December 31,
|
December 31,
|
Maturity
|
December 31,
|
December 31,
|
|||||
|
Description
|
2010
|
2009
|
Date
|
2010
|
2009
|
||||
|
Secured:
|
|||||||||
|
Notes Payable – Variable Rate
|
*
|
1.2894%
|
1.2506%
|
2015
|
$ 18,000
|
$ 20,667
|
|||
|
Notes Payable – Variable Rate
|
*
|
0.0000%
|
0.0000%
|
2012
|
13,300
|
13,440
|
|||
|
Notes Payable – Variable Rate
|
**
|
1.2894%
|
1.5325%
|
2013
|
36,857
|
44,325
|
|||
|
Notes Payable – Variable Rate
|
N/A
|
1.1306%
|
2010
|
-
|
47,125
|
||||
|
Notes Payable – Variable Rate
|
3.2575%
|
4.7500%
|
2014
|
15,739
|
24,000
|
||||
|
Notes Payable – Variable Rate
|
***
|
1.0829%
|
1.1778%
|
2020
|
61,776
|
8,434
|
|||
|
Notes Payable – Variable Rate
|
3.0563%
|
N/A
|
2017
|
44,722
|
-
|
||||
|
Notes Payable – Variable Rate
|
2.77-2.79%
|
N/A
|
2018
|
21,171
|
-
|
||||
|
Bridge Loan – Variable Rate
|
N/A
|
3.1697%
|
2010
|
-
|
8,433
|
||||
|
Line of Credit
|
4.7575%
|
N/A
|
2012
|
10,000
|
-
|
||||
|
221,565
|
166,424
|
||||||||
|
Less Current Maturities
|
(21,324)
|
(68,789)
|
|||||||
|
$ 200,241
|
$ 97,635
|
||||||||
* We have interest rate swap agreements in place to fix the interest rates on our variable rate notes payable expiring in 2015 and 2012 at 4.41% and 5.17%, respectively. After applicable margin adjustments, the effective interest rates on these notes payable are fixed at 4.67% and 5.41%, respectively. The swap agreements are for the same terms as the associated notes payable.
** We have three interest rate swap agreements currently in place to fix the interest rate on portions of this variable note payable at 3.46%, 2.69% and 2.45% respectively through the termination of the loan. After applicable margin adjustments, the effective interest rates on the swapped portion of these notes payable are 4.46%, 3.69% and 3.45%, respectively. Two of these swap agreements became effective in 2010 when the previous swap agreements terminated and the remaining agreement has been in place since the inception of the loan.
*** We have an interest rate swap agreement in place to fix the interest rate on our variable rate note payable expiring in 2020 at 2.065%. After applicable margin adjustments, the effective interest rate on this note payable is fixed at 2.965%. The swap agreement is for the same term as the associated note payable.
All of the debt listed in the chart above was either (i) issued directly by International Shipholding Corporation or (ii) issued by one or more subsidiaries of International Shipholding Corporation and guaranteed by International Shipholding Corporation. Our variable rate notes payable and our line of credit are secured by assets with an aggregate net book value of $256,500,000 as of December 31, 2010, and by a security interest in certain operating contracts and receivables.
The aggregate principal payments required as of December 31, 2010, for each of the next five years are $21,324,000 in 2011, $44,067,000 in 2012, $35,675,000 in 2013, $19,809,000 in 2014, $16,000,000 in 2015 and $84,690,000 thereafter.
In August 2009, we reduced our $35 million credit facility to $30 million. As of December 31, 2009, we had $6.4 million of our $30 million revolving credit facility, which expires in April of 2011, pledged as collateral for a letter of credit. The remaining $23.6 million of that credit facility was available as of December 31, 2009. In March 2010, we increased our $30 million credit facility back to $35 million and extended the maturity date to April of 2012. As of December 31, 2010, we had $6.4 million of our $35 million revolving credit facility, which expires in April of 2012, pledged as collateral for a letter of credit. Additionally, $10 million was drawn for working capital purposes and repaid in January 2011. We had $18.6 million of available borrowings on the credit facility as of December 31, 2010. Associated with this credit facility is a commitment fee of .125% per year on the undrawn portion of this facility. The net weighted average interest rate on all of our long-term debt after consideration of the effect of our interest rate swaps at December 31, 2010 and December 31, 2009 was 3.5478% and 4.7082%, respectively.
We entered into a financing agreement with Regions Bank on August 27, 2009 for a five year facility to finance up to $40.0 million for the purchase of additional vessels. As of December 31, 2009, the Company had drawn $25.0 million under this facility towards the purchase of the vessels to fulfill the additional requirements under a contract to provide services to an Indonesian mining company. The vessels purchased with the loan proceeds were subsequently sold to a third party in the third quarter of 2009, generating a deferred gain of approximately $10.6 million. The loan was refinanced on June 29, 2010 for seven years with an additional equity payment by the Company of $6.1 million. In addition to a $1.1 million payment received from the buyer, a ten year note receivable was agreed to for the remaining balance. We hold a first mortgage covering the vessels until the note is fully satisfied. Due to our financing of the transaction, the gain realized on the sale was deferred. This deferral will be recognized over ten years, the length of the agreement with the buyer.
Additionally we entered into a credit facility with ING Bank on August 2, 2010 to finance 65% of the construction price of each of three Korean built vessels to be delivered in early 2011 with a maximum amount of $55,200,000. As of December 31, 2010, a total of $21,171,000 had been drawn on this facility and we had available borrowings of $34,029,000.
Most of our debt agreements, among other things, impose defined minimum working capital and net worth requirements, impose leverage requirements, and prohibit us from incurring, without prior written consent, additional debt or lease obligations, except as defined. As of December 31, 2010, we met all of the financial covenants under our various debt agreements, the most restrictive of which include the working capital, leverage ratio, minimum net worth and interest coverage ratios.
Certain of our loan agreements restrict the ability of our subsidiaries to dispose of collateralized assets or any other asset which is substantial in relation to our assets taken as a whole without the approval from the lender. We have consistently remained in compliance with this provision of the loan agreements.
NOTE D – SELF-RETENTION INSURANCE
We are self-insured for Hull and Machinery claims in excess of $150,000/Hull and $250,000/Machinery for each incident and for Loss of Hire claims in excess of 14 days. The aggregate stop loss included in the policy is $1,000,000 for Hull and $500,000 for Machinery per policy year. Once the aggregate stop loss amount is exceeded, we have coverage up to limits provided.
Protection and Indemnity claims, including cargo and personal injury claims, are not included in our self-retention insurance program. We have third party insurance coverage for these claims with deductible levels ranging from $100,000 to $250,000 per incident depending on vessel type.
The current and non-current liabilities for self-insurance exposure and for claims under deductible levels were $641,000 and $461,000, respectively, as of December 31, 2010. The current and non-current liabilities were $641,000 and $1,751,000, respectively, as of ended December 31, 2009.
NOTE E – EMPLOYEE BENEFIT PLANS
Pension and Postretirement Benefits
We maintain a defined benefit pension plan (the “Retirement Plan”) for employees hired prior to September 1, 2006, and all such employees of our domestic subsidiaries who are not covered by union sponsored plans may participate after one year of service. Employees hired on or after September 1, 2006 with at least one year of service as of June 30, 2008, were eligible to participate in the new Cash Balance Plan as of July 1, 2008. Computation of benefits payable under the defined pension plan is based on years of service, up to thirty years, and the employee's highest sixty consecutive months of compensation, which is defined as the participant’s base salary plus overtime (excluding incentive pay), bonuses or other extra compensation, in whatever form. Our funding policy is based on minimum contributions required under ERISA as determined through an actuarial computation. Plan assets consist primarily of investments in equity and fixed income mutual funds and money market holdings. The target asset allocation range is 40% in fixed income investments and 60% in equity investments. The asset allocation as of December 31, 2010 was 42.74%, or $10,688,000, in fixed income investments and 57.26%, or $14,319,000, in equity investments. The asset allocation as of December 31, 2009 was 38.78%, or $8,717,000, in fixed income investments and 61.22%, or $13,757,000, in equity investments. The plan’s prohibited investments include selling short, commodities and futures, letter stock, unregistered securities, options, margin transactions, derivatives, leveraged securities, and International Shipholding Corporation securities. The plan’s diversification strategy includes limiting equity securities in any single industry to 25% of the equity portfolio market value, limiting the equity holdings in any single corporation to 10% of the market value of the equity portfolio, and diversifying the fixed income portfolio so that no one issuer comprises more than 10% of the aggregate fixed income portfolio, except for issues of the U.S. Treasury or other Federal Agencies. The plan’s assumed future returns are based primarily on the asset allocation and on the historic returns for the plan’s asset classes determined from both actual plan returns and, over longer time periods, market returns for those asset classes. As of December 31, 2010, the plan has assets of $25,007,000 and a projected pension obligation of $27,473,000.
Our postretirement benefit plan currently provides medical, dental, and life insurance benefits to eligible retired employees and their eligible dependents.
The following table sets forth the plans’ changes in the benefit obligations and fair value of assets and a statement of the funded status:
|
(All Amounts in Thousands)
|
Pension Plan
|
Postretirement Benefits
|
||||||
|
Year Ended December 31,
|
Year Ended December 31,
|
|||||||
|
2010
|
2009
|
2010
|
2009
|
|||||
|
Change in Benefit Obligation
|
||||||||
|
Benefit Obligation at Beginning of Year
|
$ 25,432
|
$ 22,601
|
$ 6,863
|
$ 6,764
|
||||
|
Service Cost
|
477
|
468
|
76
|
16
|
||||
|
Interest Cost
|
1,470
|
1,481
|
586
|
416
|
||||
|
Actuarial (Gain) Loss
|
1,377
|
2,134
|
3,753
|
659
|
||||
|
Benefits Paid and Actual Expenses
|
(1,283)
|
(1,252)
|
(599)
|
(1,051)
|
||||
|
Medicare Part D Reimbursements
|
-
|
-
|
50
|
59
|
||||
|
Benefit Obligation at End of Year
|
$ 27,473
|
$ 25,432
|
$ 10,729
|
$ 6,863
|
||||
|
Change in Plan Assets
|
||||||||
|
Fair Value of Plan Assets at Beginning of Year
|
$ 22,473
|
$ 18,100
|
$ -
|
$ -
|
||||
|
Actual Return on Plan Assets
|
2,867
|
3,625
|
-
|
-
|
||||
|
Employer Contribution
|
950
|
2,000
|
549
|
992
|
||||
|
Benefits Paid and Actual Expenses
|
(1,283)
|
(1,252)
|
(599)
|
(1,051)
|
||||
|
Medicare Part D reimbursements
|
-
|
-
|
50
|
59
|
||||
|
Fair Value of Plan Assets at End of Year
|
$ 25,007
|
$ 22,473
|
$ -
|
$ -
|
||||
|
Unfunded Status
|
$ (2,466)
|
$ (2,959)
|
$ (10,729)
|
$ (6,863)
|
||||
|
Key Assumptions
|
||||||||
|
Discount Rate
|
5.50%
|
6.00%
|
5.50%
|
6.00%
|
||||
|
Rate of Compensation Increase
|
4.50%
|
4.50%
|
N/A
|
N/A
|
||||
The accumulated benefit obligation for the pension plan was $25,117,000 and $23,081,000 at December 31, 2010 and 2009, respectively.
The following table shows amounts recognized in accumulated other comprehensive income (loss):
|
(All Amounts in Thousands)
|
Pension Plan
|
Postretirement Benefits
|
|||||||||||||||
|
Year Ended December 31,
|
Year Ended December 31,
|
||||||||||||||||
|
2010
|
2009
|
2010
|
2009
|
||||||||||||||
|
Prior Service Cost
|
$ | 26 | $ | 29 | $ | 55 | $ | 67 | |||||||||
|
Net Loss
|
(6,368 | ) | (6,494 | ) | (3,741 | ) | (186 | ) | |||||||||
|
Amounts in Other Comprehensive Loss
|
$ | (6,342 | ) | $ | (6,465 | ) | $ | (3,686 | ) | $ | (119 | ) | |||||
The following table provides the components of net periodic benefit cost for the plans:
|
(All Amounts in Thousands)
|
Pension Plan
|
Postretirement Benefits
|
||||||||||
|
Year Ended December 31,
|
Year Ended December 31,
|
|||||||||||
|
2010
|
2009
|
2008
|
2010
|
2009
|
2008
|
|||||||
|
Components of Net Periodic Benefit Cost
|
||||||||||||
|
Service Cost
|
$ 477
|
$ 468
|
$ 597
|
$ 76
|
$ 16
|
$ 18
|
||||||
|
Interest Cost
|
1,470
|
1,481
|
1,415
|
586
|
416
|
428
|
||||||
|
Expected Return on Plan Assets
|
(1,706)
|
(1,426)
|
(1,792)
|
-
|
-
|
-
|
||||||
|
Amortization of Prior Service Cost
|
(3)
|
(3)
|
(2)
|
(11)
|
(11)
|
(12)
|
||||||
|
Amortization of Net Actuarial Loss
|
342
|
409
|
-
|
198
|
(16)
|
-
|
||||||
|
Net Periodic Benefit Cost
|
$ 580
|
$ 929
|
$ 218
|
$ 849
|
$ 405
|
$ 434
|
||||||
|
The assumptions used in the measurement of net pension cost are shown in the following table:
|
||||||||||||
|
Key Assumptions
|
||||||||||||
|
Discount Rate
|
6.00%
|
6.75%
|
6.25%
|
6.00%
|
6.00%
|
6.75%
|
||||||
|
Expected Return on Plan Assets
|
7.75%
|
7.75%
|
7.75%
|
N/A
|
N/A
|
N/A
|
||||||
|
Rate of Compensation Increase
|
4.50%
|
4.50%
|
5.00%
|
N/A
|
N/A
|
N/A
|
||||||
For measurement purposes, the health cost trend was assumed to be 7.6% and the dental care cost trend rate was assumed to be 2.1% in 2010 and 2011. The health care cost trend will increase by 0.2% in 2011 and 2012, decrease by 1.4% in 2012 and 2013 and will decrease steadily by .10% each year thereafter. The health cost and dental care cost trends above are the same for employees over 65. A one percent change in the assumed health care cost trend rates would have the following effects:
|
(All Amounts in Thousands)
|
1% Increase
|
1% Decrease
|
||||||
|
Change in total service and interest cost components
|
||||||||
|
for the year ended December 31, 2010
|
$ | 69 | $ | (58 | ) | |||
|
Change in postretirement benefit obligation as of December 31, 2010
|
1,232 | (1,035 | ) | |||||
The following table provides the expected future benefit payments as of December 31, 2010:
|
(All Amounts in Thousands)
|
||||
|
Fiscal Year Beginning
|
Pension Plan
|
Postretirement Benefits
|
||
|
2011
|
$ 1,447
|
$ 676
|
||
|
2012
|
1,465
|
670
|
||
|
2013
|
1,532
|
685
|
||
|
2014
|
1,584
|
687
|
||
|
2015
|
1,624
|
684
|
||
|
2016-2020
|
9,219
|
3,572
|
||
We continue to evaluate ways in which we can better manage these benefits and control the costs. Any changes in the plan or revisions to assumptions that affect the amount of expected future benefits may have a significant effect on the amount of the reported obligation and annual expense.
Crew members on our U.S. flag vessels belong to union-sponsored pension plans. We contributed approximately $3,526,000, $3,184,000, and $2,588,000 to these plans for the years ended December 31, 2010, 2009, and 2008, respectively. These contributions are in accordance with provisions of negotiated labor contracts and generally are based on the amount of straight pay received by the union members. Information from the plans’ administrators is not readily available to permit us to determine whether there may be unfunded vested benefits.
In December of 2003, the Medicare Prescription Drug, Improvements, and Modernization Act of 2003 (“Act”) was signed into law. The Act included a special subsidy for employers that sponsor retiree health plans with prescription drug benefits that are at least as favorable as the new Medicare Part D benefit. We determined that our plan is actuarially equivalent and as such we have been receiving this special subsidy. The law resulted in a decrease in our annual net periodic benefit cost.
In early 2010, Congress passed and the President signed into law the Health Care and Education Affordability Reconciliation Act of 2010. Based on our review and evaluation of the law, we do not believe the impact on our postretirement benefits will be material to us at this time.
401(k) Savings Plan
We provide a 401(k) tax-deferred savings plan to all full-time employees. We match 50% of the employee’s first $2,000 contributed to the plan annually. We contributed $96,000, $105,000 and $109,000 to the plan for the years ended December 31, 2010, 2009 and 2008, respectively.
Stock Incentive Plan
In April 2009, our stockholders approved the International Shipholding Corporation 2009 Stock Incentive Plan (the “Plan”). The compensation committee of the board of directors of the Company will generally administer the Plan, and has the authority to grant awards under the Plan, including setting the terms of the awards. Incentives under the Plan may be granted in any one or a combination of the following forms: incentive stock options under Section 422 of the Internal Revenue Code, nonqualified stock options, restricted stock, restricted stock units, stock appreciation rights, and other stock-based awards.
A total of 200,000 shares of the Company’s common stock are authorized to be issued under the Plan with 53,066 shares available to be issued. The Company has no other equity compensation plan with shares available for issuance. Officers, directors, and key employees of the Company and the Company’s consultants and advisors will be eligible to receive incentives under the Plan when designated by the compensation committee as Plan participants (See Note S – Stock-Based Compensation).
Life Insurance
We have agreements with the two former Chairmen of the Company whereby their estates or designated beneficiaries will be paid approximately $822,000 and $627,000, respectively, upon death. We have recorded reserve amounts to fund a portion of these death benefits, which amount to $822,000 and $410,000, respectively.
NOTE F - INCOME TAXES
Under previous United States tax law, U.S. companies like us and their domestic subsidiaries generally have been taxed on all income, including in our case income from shipping operations, whether derived in the United States or abroad. With respect to any foreign subsidiary in which we hold more than a 50 percent interest (referred to in the tax laws as a controlled foreign corporation, or “CFC”), we were treated as having received a current taxable distribution of our pro rata share of income derived from foreign shipping operations.The American Jobs Creation Act, which became effective for us on January 1, 2005, changed the United States tax treatment of our U.S. flag vessels and our foreign flag shipping operations operating in CFCs.
In December of 2004, we made an election under the Jobs Creation Act to have our U.S. flag operations (other than those of two ineligible vessels used exclusively in United States coastwise commerce) taxed under a “tonnage tax” regime rather than under the usual U.S. corporate income tax regime. As a result of that election, our gross income and taxable income for United States income tax purposes with respect to our eligible U.S. flag vessels will not include (1) income from qualifying shipping activities in U.S. foreign trade (i.e., transportation between the U.S. and foreign ports or between foreign ports), (2) income from cash, bank deposits and other temporary investments that are reasonably necessary to meet the working capital requirements of our qualifying shipping activities, and (3) income from cash or other intangible assets accumulated pursuant to a plan to purchase qualifying shipping assets.
Under the tonnage tax regime, our taxable income with respect to the operations of our eligible U.S. flag vessels will instead be based on a “daily notional taxable income,” which is taxed at the highest corporate income tax rate.
Our Federal income tax returns are filed on a consolidated basis and include the results of operations of our wholly-owned U.S. subsidiaries. Pursuant to the Tax Reform Act of 1986, the recognition of earnings of foreign subsidiaries, which were $2,564,000 in 2010, $2,015,000 in 2009, and $1,243,000 in 2008, have been included in our federal tax provision calculations. No foreign tax credits are expected to be utilized on the federal return as of December 31, 2010.
Components of the net deferred tax liability (asset) are as follows:
|
December 31,
|
December 31,
|
|||||||
|
(All Amounts in Thousands)
|
2010
|
2009
|
||||||
|
Liabilites:
|
||||||||
|
Fixed Assets
|
$ | 9,615 | $ | 12,016 | ||||
|
Deferred Charges
|
2,668 | 2,492 | ||||||
|
Other Liabilities
|
236 | 286 | ||||||
|
Total Liabilities
|
12,519 | 14,794 | ||||||
|
Assets:
|
||||||||
|
Derivatives
|
(1,492 | ) | (1,331 | ) | ||||
|
Post-Retirement Benefits
|
(814 | ) | (719 | ) | ||||
|
Alternative Minimum Tax Credit
|
(4,577 | ) | (4,577 | ) | ||||
|
Net Operating Loss Carryforward
|
(5,053 | ) | (4,171 | ) | ||||
|
Valuation Allowance
|
452 | - | ||||||
|
Other Assets
|
(1,035 | ) | (1,926 | ) | ||||
|
Total Assets
|
(12,519 | ) | (12,724 | ) | ||||
|
Total Deferred Tax Liability, Net
|
$ | - | $ | 2,070 | ||||
The following is a reconciliation of the U.S. statutory tax rate to our effective tax rate expense (benefit):
|
Year Ended December 31,
|
|||
|
2010
|
2009
|
2008
|
|
|
Statutory Rate
|
35.00%
|
35.00%
|
35.00%
|
|
State Income Taxes
|
0.70%
|
(0.05)%
|
0.36%
|
|
Effect of Tonnage Tax Rate
|
(280.91)%
|
(46.30)%
|
(42.76)%
|
|
Foreign Earnings - Indefinitely Reinvested
|
-
|
(1.18)%
|
(6.84)%
|
|
Controlled Foreign Corporation Disallowed Losses
|
193.67%
|
0.65%
|
-
|
|
Foreign Earnings
|
7.29%
|
-
|
4.23%
|
|
Change in Valuation Allowance
|
9.56%
|
-
|
-
|
|
Foreign Income Taxes
|
10.23%
|
0.55%
|
-
|
|
Permanent Differences and Other, Primarily Non-deductible Expenditures
|
(2.79)%
|
0.17%
|
2.94%
|
|
(27.25)%
|
(11.16)%
|
(7.07)%
|
|
Foreign income taxes of $581,000, $497,000, and $525,000 are included in our consolidated statements of income in the Provision (Benefit) for Income Taxes for the years ended December 31, 2010, 2009, and 2008, respectively. We pay foreign income taxes in Indonesia, Singapore and Mexico.
For U.S. federal income tax purposes, in 2010, we generated $2,891,000 in net operating loss carryforwards (“NOLs”), which will be added to the previous carryforward of $11,544,000. The balance at December 31, 2010 of approximately $14,435,000 will expire in 2024 through 2029. We also have approximately $4,577,000 of alternative minimum tax credit carryforwards, which are not subject to expiration and are available to offset future regular income taxes subject to certain limitations.
We had total income from continuing operations before (benefit) provision for income taxes and equity in net income of unconsolidated entities of $4,730,000, $31,723,000, and $12,399,000, for 2010, 2009, and 2008, respectively. Income from continuing U.S. operations was $29,321,000, $33,727,000, and $11,282,000. Income (loss) from continuing foreign operations was ($24,591,000), ($2,004,000), and $1,117,000 for 2010, 2009, and 2008, respectively.
We file income tax returns in the U.S. federal and various state and foreign jurisdictions. The number of years that are open under the statute of limitations and subject to audit varies depending on the tax jurisdiction. Our U.S. income tax returns for 2004 and subsequent years remain open to examination. It is our policy to recognize interest and penalties associated with underpayment of income taxes as interest expense and general and administrative expenses, respectively. If recognized, substantially all of our unrecognized tax benefits would impact our effective rate.
The following is a reconciliation of the total amounts of unrecognized tax benefits as of December 31, 2010 and 2009:
|
2010
|
2009
|
|||
|
Total unrecognized tax benefits as of: January 1,
|
$ 1,400
|
$ 1,855
|
||
|
Increases (decreases) in unrecognized tax benefits as a result of:
Tax positions taken during a prior year
|
-
|
(270)
|
||
|
Lapse of applicable statute of limitations
|
-
|
(185)
|
||
|
Total unrecognized tax benefits as of: December 31,
|
$ 1,400
|
$ 1,400
|
||
NOTE G – TRANSACTIONS WITH RELATED PARTIES
We own a 50% interest in RTI Logistics L.L.C. (“RTI”) (See Note L-Unconsolidated Entities). At December 31, 2010, we had two long-term receivables of $1,900,000 and $427,050, respectively, due from RTI. The long-term portion of both of these receivables is recorded on our consolidated balance sheets under “ Due from Related Parties.” Interest income on the $1,900,000 receivable is earned at the rate of 5% per year for seven years. A total of $20,000 was repaid in 2010 on this receivable. A total of $20,000 per year is due on this receivable with the balance of $1,880,000 due by December 31, 2012. Interest income on the $427,050 receivable is earned at the rate of 6% per year, and the receivable along with the accrued interest is payable on demand.
We own a 49% interest in Terminales Transgolfo (“TTG”) (See Note L- Unconsolidated Entities). At December 31, 2010, we had a note receivable of $2,113,000 due from TTG. The long-term portion of this receivable is recorded on our consolidated balance sheets under “ Due from Related Parties.” The note receivable has no fixed payment schedule but payment in full is due by December 31, 2020. Interest income on this receivable is earned at the rate of 7.65% per year for seven years.
A son of one of our Directors serves as our Secretary and is a partner in, and member of the Board of Directors of, the law firm of Jones, Walker, Waechter, Poitevent, Carrere and Denegre, which has represented us since our inception. Fees paid to the firm for legal services rendered to us were approximately $1,261,000, $1,106,000, and $1,099,000 for the years ended December 31, 2010, 2009 and 2008, respectively. There were no amounts due to the legal firm at December 31, 2010, 2009 and 2008, respectively.
NOTE H - COMMITMENTS AND CONTINGENCIES
Commitments
As of December 31, 2010, 20 vessels that we own or operate were committed under various contracts extending beyond 2010 and expiring at various dates through 2019. Certain of these agreements also contain options to extend the contracts beyond their minimum terms.
Contingencies
In the normal course of our operations, we become involved in various litigation matters including, among other things, claims by third parties for alleged property damages, personal injuries, and other matters. While we believe that we have meritorious defenses against these claims, our management has used significant estimates in determining our potential exposure. Our estimates are determined based on various factors, such as (1) severity of the injury (for personal injuries) and estimated potential liability based on past judgments and settlements, (2) advice from legal counsel based on its assessment of the facts of the case and its experience in other cases, (3) probability of pre-trial settlement which would mitigate legal costs, (4) historical experience on claims for each specific type of cargo (for cargo damage claims), and (5) whether our seamen are employed in permanent positions or temporary revolving positions. It is reasonably possible that changes in our estimated exposure may occur from time to time. As is true of all estimates based on historical experience, these estimates are subject to some volatility. However, because our total exposure is limited by our aggregate stop loss levels (see Note D for further discussion of our self-retention insurance program), we believe that our exposure is within our estimated levels. Where appropriate, we have recorded provisions, included in Other Long-Term Liabilities: Other, to cover our potential exposure and recorded anticipated recoveries from insurance companies, included in Other Assets. Although it is difficult to predict the costs of ultimately resolving such issues, we have determined that our current insurance coverage is sufficient to limit any additional exposure to an amount that would not be material to our financial position. Therefore, we do not expect such changes in these estimates to have a material effect on our financial position or results of operations, although we cannot provide assurances to this effect.
We have been named as a defendant in numerous lawsuits claiming damages related to occupational diseases, primarily related to asbestos and hearing loss. We believe that most of these claims are without merit, and that insurance and the indemnification of a previous owner of one of our subsidiaries may mitigate our exposure. Based on consultation with outside legal counsel, we have estimated our current overall exposure to the numerous lawsuits in question, after considering insurance coverage for these claims, to be approximately $284,000. We believe those estimates are reasonable and have established reserves accordingly. Our reserves for these lawsuits as of December 31, 2010 and 2009 were approximately $284,000 and $279,000, respectively. There is a reasonable possibility that there will be additional claims associated with occupational diseases asserted against us. However, we do not believe that it is reasonably possible that our exposure from those claims will be material because (1) the lawsuits filed since 1989 claiming damages related to occupational diseases in which we have been named as a defendant have primarily involved seamen that served on-board our vessels and the number of such persons still eligible to file a lawsuit against us is diminishing and (2) we believe such potential additional claims, if pursued, would be covered under either or both of (i)an indemnification agreement with a previous owner of one of our subsidiaries or (ii) one or more of our existing insurance policies with deductibles ranging from $2,500 to $25,000 per claim.
NOTE I - LEASES
Direct Financing Leases
In 2005, we entered into a direct financing lease for a U.S. flag PCTC expiring in 2015 and in 1999, we entered into a direct financing lease of an international flag PCTC expiring in 2019. The schedule of future minimum rentals to be received by us under these direct financing leases at December 31, 2010, is as follows:
|
(All Amounts in Thousands)
|
Receivables Under
Financing Leases
|
|||
|
Year Ended December 31,
|
||||
|
2011
|
$ | 13,097 | ||
|
2012
|
13,117 | |||
|
2013
|
13,096 | |||
|
2014
|
12,707 | |||
|
2015
|
11,044 | |||
|
Thereafter
|
23,207 | |||
|
Total Minimum Lease Payments Receivable
|
86,268 | |||
|
Estimated Residual Value of Leased Property
|
8,051 | |||
|
Less Unearned Income
|
(38,621 | ) | ||
|
Total Net Investment in Direct Financing Leases
|
55,698 | |||
|
Current Portion
|
(5,596 | ) | ||
|
Long-Term Net Investment in Direct Financing Leases at December 31, 2010
|
$ | 50,102 | ||
Operating Leases
As of December 31, 2010, we leased from third parties vessels and office space. The Company is currently committed to leases for three vessels with terms expiring on July 2013, July 2016, and August 2017. We operate the vessels under these leases under fixed charter agreements covering the terms of the respective leases.
Our operating lease agreements have fair value renewal options and fair value purchase options. Most of the agreements impose defined minimum working capital and net worth requirements, impose restrictions on the payment of dividends, and prohibit us from incurring, without prior written consent, additional debt or lease obligations, except as defined. On January 3, 2011 and January 13, 2011, we exercised the early buy out option on two of these vessels. Based on the terms of the existing lease agreements, the aggregate early buy out price for both vessels is approximately $64.5 million and is payable in July 2011. We are currently evaluating our options to finance the acquisitions.
The Mobile corporate office lease, which commenced on April 1, 2007, has a twenty year term with periodic graduating payments that are accounted for on a straight line basis. We incurred $730,000 in leasehold improvements and were provided with incentives in the amount of $1.4 million, both of which are amortized over the life of the lease with the incentives amortized as a credit to rent expense. In October 2008, the Company renewed its lease agreement on its New York office space under a ten year term with the first nine months as free rent and including periodic graduating payments. The rent expense is amortized on a straight line basis. In addition, we incurred $503,000 in leasehold improvements which are being amortized over the life of the lease. We also lease a Shanghai office, with the current term expiring in June 2011, and a Singapore office, with the current term expiring in September 2014 with an option to renew for three years. We incurred $199,000 in leasehold improvements on the Singapore office which are being amortized over the life of the lease.
In addition to those operating leases with terms expiring after December 31, 2010, we also operated certain vessels under short-term operating charters during 2010.
Rent expense related to all of our operating leases, including charter hire rate payments, totaled approximately $28,844,000, $35,745,000 and $33,837,000 for the years ended December 31, 2010, 2009 and 2008, respectively. The following is a schedule, by year, of future minimum payments required under operating leases that have initial non-cancelable terms in excess of one year as of December 31, 2010:
|
Payments Under Operating Leases*
|
||||||||||||||||
|
(All Amounts in Thousands)
|
U.S. Flag Vessels
|
International Flag Vessel
|
Other Leases
|
Total
|
||||||||||||
|
Year Ended December 31,
|
||||||||||||||||
|
2011
|
$ | 5,966 | $ | 3,170 | $ | 1,235 | $ | 10,371 | ||||||||
|
2012
|
3,729 | - | 1,203 | 4,932 | ||||||||||||
|
2013
|
3,729 | - | 1,227 | 4,956 | ||||||||||||
|
2014
|
3,729 | - | 1,195 | 4,924 | ||||||||||||
|
2015
|
3,729 | - | 1,071 | 4,800 | ||||||||||||
|
Thereafter
|
5,904 | - | 9,235 | 15,139 | ||||||||||||
|
Total Future Minimum Payments
|
$ | 26,786 | $ | 3,170 | $ | 15,166 | $ | 45,122 | ||||||||
*Does not include the two vessels under lease for which we exercised the early buy out option discussed above.
NOTE J - DEFERRED CHARGES AND ACQUIRED CONTRACT COSTS
Deferred charges and acquired contract costs are comprised of the following:
|
December 31,
|
December 31,
|
|||||||
|
(All Amounts in Thousands)
|
2010
|
2009
|
||||||
|
Drydocking Costs
|
$ | 12,338 | $ | 14,342 | ||||
|
Financing Charges and Other
|
2,144 | 1,572 | ||||||
|
Acquired Contract Costs
|
- | 364 | ||||||
| $ | 14,482 | $ | 16,278 | |||||
The Acquired Contract Costs represent the portion of the purchase price paid for our wholly-owned subsidiary, Waterman Steamship Corporation, applicable to that company’s three U.S. flag RO/RO vessels under maritime prepositioning ship contract agreements, which were originally scheduled to expire at the end of the second quarter 2010 but were subsequently extended by the Military Sealift Command (“MSC”). One of the current agreements is set to expire by the end of March 2011 and the remaining two agreements are set to expire in May 2011, with the MSC holding options to further extend all three agreements. The amortization expense for the year ended December 31, 2010 was $364,000 and the amortization expense for the years ended December 31, 2009 and 2008 was $1,455,000, respectively.
The amortization expense for drydock and financing charges for the years ended December 31, 2010, 2009 and 2008 were $5,288,000 and $582,000, $7,858,000 and $446,000 and $6,714,000 and $400,000, respectively.
NOTE K - SIGNIFICANT OPERATIONS
Major Customers
We have several medium to long-term contracts related to the operations of various vessels (See Note H – Commitments and Contingencies), from which revenues represent a significant amount of our total revenue. Revenues from contracts with the MSC were $34,401,000, $32,012,000 and $29,988,000 for the years ended December 31, 2010, 2009 and 2008, respectively. In July 2009, we received notification from the MSC that we were being excluded from further consideration for extending the current operating agreements on three U.S. flag roll on-roll off vessels. Shortly thereafter, we protested this action and were reinstated for consideration by the MSC. One of the current agreements is set to expire by the end of March 2011. On February 24, 2011, the MSC notified us of their intent to exercise the option to extend the agreement for up to an additional four months. The remaining two agreements are set to expire in May 2011, with the MSC holding options to further extend these agreements.
We have six U.S. flag PCTCs, also qualified under the MSP, which carry automobiles for a Japanese charterer. Revenues, from these customers including MSP revenue, were $54,225,000, $51,590,000 and $50,208,000 for the years ended December 31, 2010, 2009, and 2008, respectively.
These six U.S. flag PCTCs carry supplemental cargo. Revenues under these contracts were $79,778,000, $171,493,000, and $58,414,000 for the years ended December 31, 2010, 2009 and 2008, respectively.
All of the aforementioned revenues are included in our Time Charter-U.S. Flag segment.
Until the fourth quarter of 2010, we operated five international flag PCTCs under various contracts that transport automobiles from South Korea to the United States and Europe, with two of these contracts lapsing in the fourth quarter 2010. The vessels associated with the contracts that lapsed were chartered in under charter agreements that terminated when these contracts lapsed. Revenues under these contracts were $25,566,000, $25,883,000 and $26,065,000 for the years ended December 31, 2010, 2009 and 2008 respectively.
All of the aforementioned revenues are included in our Time Charter-International Flag segment.
Concentrations
A significant portion of our traffic receivables is due from contracts with the MSC and transportation of government sponsored cargo. There are no concentrations of receivables from customers or geographic regions that exceeded 10% of stockholders’ investment at December 31, 2010, 2009 or 2008.
With only minor exceptions related to personnel aboard certain international flag vessels, all of our shipboard personnel are covered by collective bargaining agreements under multiple unions. The percentage of the Company’s total work force that is covered by these agreements is approximately 75.6%. Seven of these contracts representing 16% of our workforce expire in June 2011, one of these contracts representing 12% of our workforce expires in September 2011, and three of these contracts representing 22% of our workforce expire in December 2011.
We have two Special Purpose vessels, which carry loaded rail cars between the U.S. Gulf Coast and Mexico. Revenues from this service were $26,768,000, $27,405,000 and $39,410,000 for the years ended December 31, 2010, 2009 and 2008, respectively. Revenues from these two Special Purpose vessels are included in our Rail-Ferry segment. This segment has been adversely impacted by the economic recession, including the fact that one of its major northbound customers stopped shipments in December 2009. The Company recognized a non-cash impairment charge of $25,430,000 in the third quarter of 2010 to reduce the carrying value of these assets to their estimated fair value.
Geographic Information
We have operations in several principal markets, including international service between U.S. Gulf and East Coast ports and ports in Mexico, the Middle East and the Far East, and domestic transportation services along the U.S. Gulf and East Coast. Revenues attributable to the major geographic areas of the world are presented in the following table. Revenues for our Time Charter Contracts-U.S. Flag, Time Charter Contracts-International Flag, Contract of Affreightment, Rail-Ferry Service, and Other segments are assigned to regions based on the location of the customer. Because we operate internationally, most of our assets are not restricted to specific locations. Accordingly, an allocation of identifiable assets to specific geographic areas is not applicable.
|
Year Ended December 31,
|
||||||||||||
|
(All Amounts in Thousands)
|
2010
|
2009
|
2008
|
|||||||||
|
United States
|
$ | 179,127 | $ | 265,416 | $ | 154,068 | ||||||
|
Asian Countries
|
84,146 | 86,000 | 87,329 | |||||||||
|
Rail-Ferry Service Operating Between U.S. Gulf Coast and Mexico
|
26,768 | 27,405 | 39,410 | |||||||||
|
Other Countries
|
8 | 1,130 | 1,094 | |||||||||
|
Total Revenues
|
$ | 290,049 | $ | 379,951 | $ | 281,901 | ||||||
Operating Segments
Our operating segments are identified primarily based on the characteristics of the contracts or terms under which the fleet of vessels are operated. Each of the reportable segments is managed separately as each requires different resources depending on the nature of the contract or terms under which each vessel within the segment operates. Beginning with the second quarter 2010, we split Time Charter Contracts operations into two different operating segments, U.S. Flag and International Flag. Our operating segments are identified and described below.
Time Charter Contracts-U.S. Flag: Time charters are contracts by which our charterer obtains the right for a specified period to direct the movements and utilization of the vessel in exchange for payment of a specified daily rate, but we retain operating control over the vessel. Typically, we fully equip the vessel and are responsible for normal operating expenses, repairs, crew wages, and insurance, while the charterer is responsible for voyage expenses, such as fuel, port and stevedoring expenses. Our Time Charter Contracts – U.S. Flag segment includes contracts for commercial and supplementary cargo for six PCTCs, and an electric utility for a conveyor-equipped, self-unloading Coal Carrier. Also included in this segment are contracts under which the MSC charters three RO/ROs that are under an operating contract, and contracts with another shipping company for two container vessels.
Time Charter Contracts-International Flag: We operate this segment in the same manner as our Time Charter Contracts-U.S. Flag segment, except with International flagged vessels. Our Time Charter Contracts – International Flag segment includes contracts with Far Eastern and South American shipping companies for five PCTCs, two of which we no longer operate as of the fourth quarter, 2010. Also included in this segment are two multi-purpose vessels, one tanker and two container vessels, which service ISC’s long-term contract to transport supplies for a mining company’s Indonesian operations and contracts with another shipping company for two container vessels, of which we no longer operate as of fourth quarter, 2010.
Contract of Affreightment (“COA”): For this type of contract, we undertake to provide space on our vessel for the carriage of specified goods or a specified quantity of goods on a single voyage or series of voyages over a given period of time between named ports or within certain geographical areas in return for the payment of an agreed amount per unit of cargo carried. Generally, we are responsible for all operating and voyage expenses. Our COA segment includes one contract, which is for the transportation of molten sulphur.
Rail-Ferry Service: This service uses our two Special Purpose vessels, which carry loaded rail cars between the U.S. Gulf Coast and Mexico. Each vessel currently has a capacity for 113 standard size rail cars. With departures every four days from Coatzacoalcos, Mexico and the U.S. Gulf Coast, it offers with each vessel a three-day transit between these ports and provides a total of 90 trips per year in each direction when both ships are operating.
Other: This segment consists of operations that include more specialized services than the above-mentioned segments and ship charter brokerage and agency services. Also included in the Other category are corporate related items, results of insignificant operations, and income and expense items not allocated to reportable segments.
The following table presents information about segment profit and loss and segment assets. Beginning with the second quarter 2010, we split Time Charter Contracts operations into two different operating segments, U.S. Flag and International Flag. We do not allocate administrative and general expenses, gains or losses on sales of investments, investment income, gains or losses on early extinguishment of debt, equity in net income of unconsolidated entities, income taxes, or losses from discontinued operations to our segments. Intersegment revenues are based on market prices and include revenues earned by our subsidiaries that provide specialized services to the operating segments. Expenditures for segment assets represent cash outlays during the periods presented, including purchases of assets, improvements to assets, and drydock payments.
|
Time Charter
|
|
|||||||||||||||||||||||
|
(All Amounts in Thousands)
|
Time Charter Contracts-U.S. Flag
|
Contracts-International Flag
|
COA
|
Rail-Ferry Service
|
Other
|
Total
|
||||||||||||||||||
|
2010
|
||||||||||||||||||||||||
|
Revenues from External Customers
|
$ | 197,311 | $ | 47,208 | $ | 16,283 | $ | 26,672 | $ | 2,575 | $ | 290,049 | ||||||||||||
|
Intersegment Revenues (Eliminated)
|
- | - | - | - | 18,642 | 18,642 | ||||||||||||||||||
|
Intersegment Expenses (Eliminated)
|
- | - | - | - | (18,642 | ) | (18,642 | ) | ||||||||||||||||
|
Voyage Expenses
|
139,269 | 29,588 | 16,930 | 22,648 | 912 | 209,347 | ||||||||||||||||||
|
Depreciation
|
9,755 | 2,982 | - | 5,181 | 11 | 17,929 | ||||||||||||||||||
|
Impairment Loss
|
- | - | - | 25,430 | - | 25,430 | ||||||||||||||||||
|
Gross Voyage (Loss) Profit
|
48,287 | 14,638 | (647 | ) | (26,587 | ) | 1,652 | 37,343 | ||||||||||||||||
|
Interest Expense
|
3,034 | 2,774 | - | 831 | 518 | 7,157 | ||||||||||||||||||
|
Segment Profit (Loss)
|
45,253 | 11,864 | (647 | ) | (27,418 | ) | 1,134 | 30,186 | ||||||||||||||||
|
Segment Assets
|
136,402 | 195,594 | 1,832 | 40,511 | 24,721 | 399,060 | ||||||||||||||||||
|
Expenditures for Segment Assets
|
570 | 117,767 | 330 | 6,695 | 300 | 125,662 | ||||||||||||||||||
|
2009
|
||||||||||||||||||||||||
|
Revenues from External Customers
|
$ | 279,879 | $ | 50,966 | $ | 18,046 | $ | 27,891 | $ | 3,169 | $ | 379,951 | ||||||||||||
|
Intersegment Revenues (Eliminated)
|
- | - | - | - | 12,975 | 12,975 | ||||||||||||||||||
|
Intersegment Expenses (Eliminated)
|
- | - | - | - | (12,975 | ) | (12,975 | ) | ||||||||||||||||
|
Voyage Expenses
|
211,850 | 41,501 | 15,827 | 24,585 | 1,915 | 295,678 | ||||||||||||||||||
|
Depreciation
|
13,368 | 1,407 | - | 5,468 | 11 | 20,254 | ||||||||||||||||||
|
Impairment Loss
|
- | 2,899 | - | - | - | 2,899 | ||||||||||||||||||
|
Gross Voyage Profit (Loss)
|
54,661 | 5,159 | 2,219 | (2,162 | ) | 1,243 | 61,120 | |||||||||||||||||
|
Interest Expense
|
3,240 | 892 | - | 1,427 | 551 | 6,110 | ||||||||||||||||||
|
Segment Profit (Loss)
|
51,421 | 4,267 | 2,219 | (3,589 | ) | 692 | 55,010 | |||||||||||||||||
|
Segment Assets
|
103,485 | 87,585 | 2,546 | 63,600 | 25,940 | 283,156 | ||||||||||||||||||
|
Expenditures for Segment Assets
|
11,726 | 78,305 | 2 | 4,686 | 1,544 | 96,263 | ||||||||||||||||||
|
2008
|
||||||||||||||||||||||||
|
Revenues from External Customers
|
$ | 167,153 | $ | 53,490 | $ | 19,199 | $ | 39,491 | $ | 2,568 | $ | 281,901 | ||||||||||||
|
Intersegment Revenues (Eliminated)
|
- | - | - | - | 19,626 | 19,626 | ||||||||||||||||||
|
Intersegment Expenses (Eliminated)
|
- | - | - | - | (19,626 | ) | (19,626 | ) | ||||||||||||||||
|
Voyage Expenses
|
129,996 | 39,446 | 17,793 | 32,136 | 869 | 220,240 | ||||||||||||||||||
|
Depreciation
|
13,386 | 1,205 | - | 5,365 | 12 | 19,968 | ||||||||||||||||||
|
Gross Voyage Profit
|
23,771 | 12,839 | 1,406 | 1,990 | 1,687 | 41,693 | ||||||||||||||||||
|
Interest Expense
|
3,691 | 1,113 | - | 1,502 | 580 | 6,886 | ||||||||||||||||||
|
Segment Profit
|
20,080 | 11,726 | 1,406 | 488 | 1,107 | 34,807 | ||||||||||||||||||
|
Segment Assets
|
164,860 | 62,961 | 3,934 | 67,470 | 27,155 | 326,380 | ||||||||||||||||||
|
Expenditures for Segment Assets
|
2,904 | 1,534 | 169 | 1,694 | 1,894 | 8,195 | ||||||||||||||||||
In 2007, we elected to discontinue our U.S. flag LASH service and our International LASH service. Those services were reported in the Liner Services segment in previous periods. The segment information for 2008 presented above has been restated to remove the effects of those operations to reflect the reclassification from continuing operations to discontinued operations (See Note P – Discounted Operations).
Following is a reconciliation of the totals reported for the operating segments to the applicable line items in the consolidated financial statements:
|
(All Amounts in Thousands)
|
Year Ended December 31,
|
|||||||||||
|
Profit or Loss:
|
2010
|
2009
|
2008
|
|||||||||
|
Total Profit for Reportable Segments
|
$ | 30,186 | $ | 55,010 | $ | 34,807 | ||||||
|
Unallocated Amounts:
|
||||||||||||
|
Administrative and General Expenses
|
(21,202 | ) | (22,641 | ) | (21,414 | ) | ||||||
|
Loss (Gain) on Sale of Other Assets
|
42 | (2,209 | ) | - | ||||||||
|
Ineffective Portion on Derivative Instrument
|
(426 | ) | - | - | ||||||||
|
Gain (Loss) on Sale of Investment
|
213 | 980 | (148 | ) | ||||||||
|
Investment (Loss) Income
|
1,778 | (72 | ) | 525 | ||||||||
|
Other Income from Vessel Financing
|
2,335 | 655 | - | |||||||||
|
Foreign Exchange Loss
|
(8,196 | ) | - | - | ||||||||
|
(Loss) on Redemption of Preferred Stock
|
- | - | (1,371 | ) | ||||||||
|
Income from Continuing Operations Before (Benefit)
|
||||||||||||
|
Provision for Income Taxes and Equity in Net
|
||||||||||||
|
Income of Unconsolidated Entities
|
$ | 4,730 | $ | 31,723 | $ | 12,399 | ||||||
|
December 31,
|
December 31,
|
|||||||
|
Assets:
|
2010
|
2009
|
||||||
|
Total Assets for Reportable Segments
|
$ | 399,060 | $ | 283,156 | ||||
|
Unallocated Amounts:
|
||||||||
|
Current Assets
|
68,532 | 141,749 | ||||||
|
Investment in Unconsolidated Entities
|
27,261 | 15,971 | ||||||
|
Due from Related Parties
|
4,124 | 5,043 | ||||||
|
Other Assets
|
5,004 | 6,341 | ||||||
|
Note Receivable
|
40,142 | 44,390 | ||||||
|
Total Assets
|
$ | 544,123 | $ | 496,650 | ||||
NOTE L - UNCONSOLIDATED ENTITIES
Bulk Carriers
In 2003, we acquired a 50% investment in Dry Bulk Cape Holding Inc. (“Dry Bulk”) for $3,479,000, which owns 100% of subsidiary companies that currently own two Capesize Bulk Carriers and have two Handymax Bulk Carrier Newbuildings on order for delivery in 2012. This investment is accounted for under the equity method and our share of earnings or losses is reported in our consolidated statements of income net of taxes. For the years ended December 31, 2010, 2009 and 2008, our portions of earnings net of taxes were $10,818,000, $6,845,000 and $21,239,000, respectively. Included in the 2010 results is a gain of $1,400,000 on the sale of one Dry Bulk’s Panamax Bulk Carriers. We received dividends of $3,000,000, $3,000,000 and $31,500,000 in 2010, 2009 and 2008, respectively. The 2008 amount included a cash distribution for our share of the proceeds from Dry Bulk’s sale of a Panamax Bulk Carrier in the amount of $25.5 million in July 2008.
The unaudited condensed financial position and results of operations of Dry Bulk are summarized below:
|
December 31,
|
December 31,
|
|||||||
|
(Amounts in Thousands)
|
2010
|
2009
|
||||||
|
Current Assets
|
$ | 17,518 | $ | 8,385 | ||||
|
Noncurrent Assets
|
69,477 | 91,692 | ||||||
|
Current Liabilities
|
1,438 | 1,706 | ||||||
|
Noncurrent Liabilities
|
58,756 | 87,278 | ||||||
|
Year Ended December 31,
|
|||||||||||||
|
(Amounts in Thousands)
|
2010
|
2009
|
2008
|
||||||||||
|
Operating Revenues
|
$ | 28,222 | $ | 27,417 | $ | 25,682 | |||||||
|
Operating Income
|
22,851 | 17,089 | 14,249 | ||||||||||
|
Net Income
|
21,364 | 13,760 | 42,129 | ||||||||||
In December 2009, we acquired for $6,250,000 a 25% investment in Oslo Bulk AS (“Oslo Bulk”), which, in 2008, contracted to build eight new Mini Bulkers. Four of the eight Mini-Bulkers were delivered and under contract as of December 31, 2010. The remaining four vessels are expected to be delivered in the first quarter of 2011. During 2010, we invested an additional $3.9 million in Tony Bulkers Pte Ltd, (“Tony Bulkers”), an affiliate of Oslo Bulk AS, for our 25% share of the installment payments for two additional new Mini-Bulkers, one of which was delivered in the fourth quarter of 2010. We paid our remaining share of installment payments associated with the other Mini-Bulker Newbuilding of approximately $1.6 million in January 2011 and the vessel is expected to be delivered in the second quarter of 2011. These investments are accounted for under the equity method and our share of earnings or losses is reported in our consolidated statements of income net of taxes. Our portion of the earnings of Oslo Bulk and Tony Bulkers was a loss of $1.1 million and $196,000, respectively, for the year ended December 31, 2010.
Terminal Management Company
In 2000, we acquired a 50% interest in Terminales Transgolfo (“TTG”) for $228,000, which operates a terminal in Coatzacoalcos, Mexico, utilized by our Rail-Ferry Service. During 2005, the other unaffiliated 50% owner of TTG acquired 1% of our 50% interest in TTG. As of December 31, 2010, we have a 49% interest in TTG. In 2006, TTG began making improvements to the terminal in Mexico to accommodate the second decks that were added to the two vessels operating in our Rail-Ferry Service during the first half of 2007. We funded 49% of the cost of the terminal improvements, of which 30% is a capital contribution and is reported as an investment in unconsolidated entities. The remaining 70% is a loan to TTG (see Note G-Transactions with Related Parties). No capital contributions were made during the years ended December 31, 2010 and 2009. During the year ended December 31, 2008, we made capital contributions of $120,000 associated with funding improvements to the terminal. The investment is accounted for under the equity method, and our share of earnings or losses, which was immaterial for all periods presented, is reported in our consolidated statements of income net of taxes. No distributions were made by TTG during 2010, 2009 and 2008. As of December 31, 2010, 2009 and 2008, TTG owed us $2,113,000, $3,295,000 and $4,459,000, respectively. (See Note G- Transactions with Related Parties).
Transloading and Storage Facility Company
In 2005, we acquired a 50% interest in RTI Logistics L.L.C. (“RTI”), which owns a transloading and storage facility that was used in our Rail-Ferry Service, for $1,587,000. We purchased our shares from a former owner at a premium, which resulted in a difference of approximately $973,000 between our investment in RTI and the underlying equity in net assets of the subsidiary. Additional investments of approximately $386,000 were made in 2006. The investment is accounted for under the equity method, and our share of earnings or losses is reported in our consolidated statements of income net of taxes. The Company’s interest in the earnings from the date of this investment through December 31, 2010, was immaterial. No distributions were made by RTI during 2010, 2009 and 2008. We have also loaned funds to RTI, and as of December 31, 2010, 2009 and 2008, RTI owed us $2,327,000, $2,230,000 and $2,250,000, respectively (See Note G- Transactions with Related Parties).
NOTE M - SUPPLEMENTAL CASH FLOW INFORMATION
|
Year Ended December 31,
|
||||||||||||
|
(All Amounts in Thousands)
|
2010
|
2009
|
2008
|
|||||||||
|
Cash Payments:
|
||||||||||||
|
Interest Paid
|
$ | 6,825 | $ | 5,570 | $ | 7,589 | ||||||
|
Taxes Paid
|
744 | 530 | 597 | |||||||||
NOTE N -FAIR VALUE OF FINANCIAL INSTRUMENTS, DERIVATIVES AND MARKETABLE SECURITIES
The Company uses derivative instruments to manage certain foreign currency exposures and interest rate exposures. The Company does not use derivative instruments for speculative trading purposes. All derivative instruments must be recorded on the balance sheet at fair value. For derivatives designated as cash flow hedges, the effective portion of changes in the fair value of the derivative is recorded to other comprehensive income, and is reclassified to earnings when the derivative instrument is settled. Any ineffective portion of changes in the fair value of the derivative is reported in earnings. None of the Company’s derivative contracts contain credit-risk related contingent features that would require us to settle the contract upon the occurrence of such contingency. However, all of our contracts contain clauses specifying events of default under specified circumstances, including failure to pay or deliver, breach of agreement, default under the specific agreement to which the hedge relates, bankruptcy, misrepresentation and mergers, without exception. The remedy for default is settlement in entirety or payment of the fair market value of the contracts, which is $9,500,000 in the aggregate for all of our contracts less a posted collateral of $693,000 for the year ended December 31, 2010. The unrealized loss related to the Company’s derivative instruments included in accumulated other comprehensive loss was $8,700,000 and $6,800,000 as of December 31, 2010 and 2009, respectively.
The notional and fair value amounts of our derivative instruments as of December 31, 2010 were as follows:
|
(Amounts in thousands)
|
Asset Derivatives 2010
|
Liability Derivatives 2010
|
|||
|
Current Notional
|
Balance Sheet
|
Fair
|
Balance Sheet
|
Fair Value
|
|
|
As of December 31, 2010
|
Amount
|
Location
|
Value
|
Location
|
|
|
Interest Rate Swaps*
|
$ 143,466
|
-
|
-
|
Other Liabilities
|
$9,620
|
|
Foreign Exchange Contracts
|
$3,000
|
Other Current Assets
|
$157
|
-
|
-
|
|
Total Derivatives designated as hedging instruments
|
$146,466
|
-
|
$157
|
-
|
$9,620
|
|
*With regard to the interest rates of our long-term debt that have been swapped to a fixed rate under contracts, they include an interest rate swap on a Yen based facility for the financing of a new PCTC delivered in March 2010. The notional amount under this contract is approximately $75,300,000 (Based on a Yen to USD exchange rate of 82). With the bank exercising its option to reduce the underlying Yen loan from 80% to 65% funding of the vessel’s delivery cost, the 15% reduction represents the ineffective portion, which consists of the portion of the derivative instrument that is no longer supported by an underlying credit facility. The change in fair value related to the ineffective portion of this swap was a $426,000 loss for the year ended December 31, 2010 and this amount was included in earnings.
.
|
|||||
The effect of derivative instruments designated as cash flow hedges on our consolidated statement of income for the year ended December 31, 2010 is as follows:
|
(Amounts in thousands)
|
Gain (Loss) Recognized in Other Comprehensive Income
|
Location of Gain (Loss) Reclassified from AOCI to Income
|
Amount of Gain (Loss) Reclassified from AOCI to Income
|
Gain (Loss) Recognized in Income from Ineffective portion
|
|
Interest Rate Swaps
|
($1,514)
|
Interest Expense
|
($3,966)
|
($426)
|
|
Foreign Exchange Contracts
|
($342)
|
Voyage Expenses
|
$1,589
|
-
|
|
Total
|
($1,856)
|
-
|
($2,377)
|
($426)
|
The following methods and assumptions were used to estimate the fair value of each class of financial instruments:
Interest Rate Swap Agreements
We enter into interest rate swap agreements to manage well-defined interest rate risks. The Company records the fair value of the interest rate swaps as an asset or liability on its balance sheet. The Company’s interest rate swaps are accounted for as effective cash flow hedges. Accordingly, the effective portion of the change in fair value of the swap is recorded in Other Comprehensive Income (Loss). As of December 31, 2010, the Company has the following swap contracts outstanding:
|
Effective
Date
|
Termination
Date
|
Current Notional Amount
|
Swap Rate
|
Type
|
|
11/30/05
|
11/30/12
|
$13,300,000
|
5.17%
|
Fixed
|
|
3/31/08
|
9/30/13
|
$12,285,667
|
3.46%
|
Fixed
|
|
9/30/10
|
9/30/13
|
$12,285,667
|
2.69%
|
Fixed
|
|
9/30/10
|
9/30/13
|
$12,285,667
|
2.45%
|
Fixed
|
|
9/26/05
|
9/28/15
|
$9,000,000
|
4.41%
|
Fixed
|
|
9/26/05
|
9/28/15
|
$9,000,000
|
4.41%
|
Fixed
|
|
3/15/09
|
9/15/20
|
¥ 6,175,333,334
|
2.065%
|
Fixed
|
Foreign Currency Contracts
We enter into forward exchange contracts to hedge certain firm purchase and sale commitments denominated in foreign currencies. The purpose of our foreign currency hedging activities is to protect us from the risk that the eventual dollar cash inflows or outflows resulting from revenue collections from foreign customers and purchases from foreign suppliers will be adversely affected by changes in exchange rates. The term of the currency contracts is rarely more than one year. Our foreign currency contracts are accounted for as effective cash flow hedges. Accordingly, the effective portion of the change in fair value is recorded in Other Comprehensive Income (Loss).
During 2010, we entered into two forward purchase contracts. One contract was for Mexican Pesos for $1,725,000 U.S. Dollar equivalents beginning in September 2010 that expires in August 2011. The other contract was for Indonesian Rupiah for $1,800,000 U.S. Dollar equivalents beginning in January 2011 that expires in December 2011. There were no forward sales contracts as of December 31, 2010 or 2009.
The following table summarizes the outstanding contracts as of December 31, 2010:
|
(Amounts in Thousands)
|
||||||||
|
Transaction Date
|
Type of Currency
|
Transaction Amount in Dollars
|
Effective Date
|
Expiration Date
|
||||
|
June 2010
|
Rupiah
|
1,800
|
January 2011
|
December 2011
|
||||
|
June 2010
|
Peso
|
1,200
|
September 2010
|
August 2011
|
||||
Long-Term Debt
The fair value of long-term debt, which is estimated based on the current rates offered to us on outstanding obligations, approximated the carrying amount as of December 31, 2010 and 2009, primarily as a result of all of our debt being carried at variable rates.
Due from Related Parties and Notes Receivable
The carrying amount of these notes receivable approximated fair market value as of December 31, 2010 and 2009. Fair market value takes into consideration the current rates at which similar notes would be made.
Marketable Securities
We have categorized all marketable securities as available-for-sale securities. Management performs a quarterly evaluation of marketable securities for any other-than-temporary impairment. During 2008, we determined that the unrealized losses in the stocks of several financial institutions were other-than-temporarily impaired due to the duration and severity of the losses. Therefore, we recognized an impairment charge of $369,000 during 2008. During 2009, we recognized an impairment charge of $757,000 related to certain equity investments which were determined to have other-than-temporary impairments. These impairment charges represented the difference between each investment’s cost and fair value on the respective balance sheet dates. The fair value was determined using market prices that represented Level 1 inputs in the fair value hierarchy described in Note U-Fair Value Measurements. Our entire portfolio of stocks was sold in the fourth quarter of 2009, generating a gain of approximately $980,000.
The following tables include cost and valuation information on our investment securities:
|
(All Amounts in Thousands)
|
December 31, 2010
|
|||||||||||
|
Security Type
|
Cost Basis
|
AOCI
Unrealized Holding Gains
|
Estimated Fair Value
|
|||||||||
|
Corporate Bonds*
|
$ | 11,322 | $ | 133 | $ | 11,527 | ||||||
| $ | 11,322 | $ | 133 | $ | 11,527 | |||||||
|
* Various maturity dates from February 2011 – February 2015.
|
||||||||||||
|
December 31, 2009
|
||||||||||||
|
Security Type
|
Cost Basis
|
AOCI
Unrealized Holding Loss
|
Estimated Fair Value
|
|||||||||
|
Corporate Bonds*
|
$ | 10,449 | $ | (116 | ) | $ | 10,333 | |||||
| $ | 10,449 | $ | (116 | ) | $ | 10,333 | ||||||
|
* Various maturity dates from February 2010 – August 2013.
|
||||||||||||
We used the following methods and assumptions in estimating our fair value disclosures of the following financial instruments:
Cash and Cash Equivalents: The carrying amounts reported in the balance sheet for cash and short-term instruments approximates fair value.
Marketable Securities: Fair value of marketable securities is based on quoted market prices, where available. If quoted market prices are not available, fair values are based on quoted market prices of comparable instruments.
Long-Term Debt: The fair value of our debt is estimated based on the current rates offered to us on outstanding obligations.
|
NOTE O – ACCOUNTS PAYABLE AND ACCRUED LIABILITIES
|
||||||||
|
Following are the components of the consolidated balance sheet classification Accounts Payable and Accrued Liabilities:
|
||||||||
|
December 31,
|
December 31,
|
|||||||
|
(All Amounts in Thousands)
|
2010
|
2009
|
||||||
|
Accrued Voyage Expenses
|
$ | 17,608 | $ | 16,750 | ||||
|
Trade Accounts Payable
|
6,647 | 7,151 | ||||||
|
Lease Incentive Obligation
|
2,723 | 3,955 | ||||||
|
Derivative Liability
|
- | 1,063 | ||||||
|
Self-Insurance Liability
|
1,754 | 1,754 | ||||||
|
Accrued Salaries and Benefits
|
2,668 | 1,544 | ||||||
|
Accrued Insurance Premiums
|
301 | - | ||||||
|
Accrued Interest
|
413 | 205 | ||||||
| $ | 32,114 | $ | 32,422 | |||||
NOTE P – DISCONTINUED OPERATIONS
The Company decided in the fourth quarter of 2006 to dispose of certain LASH Liner Service assets. The decision was based on the belief that we could generate substantial cash flow and profit on the disposition of the assets, while improving our future operating results. Accordingly, we sold our LASH Feeder vessel and 114 barges in the first quarter of 2007. In the second quarter of 2007, the Company sold the one remaining U.S. flag LASH vessel and 111 LASH barges. In the third quarter of 2007, the company elected to discontinue its International LASH service by the end of 2007. The one remaining LASH vessel and the remaining barges were sold in the first quarter of 2008.
There were no revenues associated with these operations for the years ended December 31, 2010 and 2009. Revenues associated with these operations for the year ended December 31, 2008 were $220,000.
|
NOTE Q – EARNINGS PER SHARE
|
The calculation of basic and diluted earnings per share is as follows (in thousands except share amounts):
|
Year Ended December 31,
|
||||||||||||
|
2010
|
2009
|
2008
|
||||||||||
|
Numerator
|
||||||||||||
|
Net Income Available to Common Stockholders – Basic
|
||||||||||||
|
Continuing *
|
$ | 15,302 | $ | 42,221 | $ | 34,134 | ||||||
|
Discontinued
|
- | - | 4,827 | |||||||||
| $ | 15,302 | $ | 42,221 | $ | 38,961 | |||||||
|
Net Income- Diluted
|
||||||||||||
|
Continuing
|
$ | 15,302 | $ | 42,221 | $ | 34,222 | ||||||
|
Discontinued
|
- | - | 4,827 | |||||||||
| $ | 15,302 | $ | 42,221 | $ | 39,049 | |||||||
|
Denominator
|
||||||||||||
|
Weighted Avg Share of Common Stock Outstanding:
|
||||||||||||
|
Basic
|
7,158,439 | 7,224,748 | 7,314,216 | |||||||||
|
Plus:
|
||||||||||||
|
Effect of dilutive restrictive stock
|
72,739 | 57,371 | 22,339 | |||||||||
|
Effect of dilutive convertible shares from preferred stock
|
- | - | 165,000 | |||||||||
|
Diluted
|
7,231,178 | 7,282,119 | 7,501,555 | |||||||||
|
Basic and Diluted Earnings Per Common Share
|
||||||||||||
|
Net Income Available to Common
|
||||||||||||
|
Stockholders – Basic
|
||||||||||||
|
Continuing Operations
|
$ | 2.14 | $ | 5.84 | $ | 4.67 | ||||||
|
Discontinued Operations
|
- | - | 0.66 | |||||||||
| $ | 2.14 | $ | 5.84 | $ | 5.33 | |||||||
|
Net Income Available to Common
|
||||||||||||
|
Stockholders – Diluted
|
||||||||||||
|
Continuing Operations
|
$ | 2.12 | $ | 5.80 | $ | 4.56 | ||||||
|
Discontinued Operations
|
- | - | 0.64 | |||||||||
| $ | 2.12 | $ | 5.80 | $ | 5.20 | |||||||
* Income from Continuing Operations less Preferred Stock Dividends
|
NOTE R- ACCUMULATED OTHER COMPREHENSIVE INCOME (LOSS)
|
|||||
|
Accumulated other comprehensive income (loss) is comprised of the following, net of tax:
|
|||||
|
December 31,
|
|||||
|
2010
|
2009
|
||||
|
Unrealized translation loss
|
$ (198)
|
$ (309)
|
|||
|
Unrealizedgain on marketable securities
|
133
|
-
|
|||
|
Fair value of derivatives
|
(8,698)
|
(6,842)
|
|||
|
Funding status of benefit plans
|
(9,035)
|
(5,540)
|
|||
|
$ (17,798)
|
$ (12,691)
|
||||
NOTE S – STOCK BASED COMPENSATION
On April 30, 2008, our Compensation Committee granted the remaining 175,000 shares of restricted stock from the 1998 stock incentive plan to certain executive officers. The shares vest ratably over the respective vesting periods, which range from three to four years. The fair value of the Company’s restricted stock, which is determined using the average stock price as of the date of the grant, is applied to the total shares that are expected to fully vest and is amortized to compensation expense on a straight-line basis over the vesting period
On April 29, 2009, our Compensation Committee granted 47,500 shares of restricted stock to certain executive officers from the 2009 Stock Incentive Plan, which vested on May 6, 2010.
On January 28, 2010, our Compensation Committee granted 47,500 shares of restricted stock to certain executive officers from the 2009 Stock Incentive Plan. These shares vest on the day our 2010 Form 10-K is filed with the SEC.
On January 14, 2011, our independent Directors received unrestricted stock awards of 4,434 shares from the 2009 Stock Incentive Plan.
On January 26, 2011, our Compensation Committee granted 47,500 shares of restricted stock to certain executive officers from the 2009 Stock Incentive Plan. These shares will vest on the day our 2011 Form 10-K is filed with the SEC in 2012, contingent upon the Company achieving certain performance measures for fiscal year 2011 and the executive officer remaining employed by us on such date.
A summary of the activity for restricted stock awards during the years ended December 31, 2010 and 2009 is as follows:
|
2010
|
2009
|
|||||||||||||||
|
Shares
|
Weighted Average Fair Value Per Share
|
Shares
|
Weighted Average Fair Value Per Share
|
|||||||||||||
|
Non-vested
|
177,500 | $ | 19.51 | 175,000 | $ | 19.01 | ||||||||||
|
Shares Granted
|
47,500 | $ | 28.40 | 47,500 | $ | 20.87 | ||||||||||
|
Shares Vested –
|
(92,500 | ) | $ | 19.97 | (45,000 | ) | $ | 19.01 | ||||||||
|
Shares Forfeited
|
- | - | - | - | ||||||||||||
|
Non-vested – December 31,
|
132,500 | $ | 22.38 | 177,500 | $ | 19.51 | ||||||||||
The following table summarizes the future expected amortization of unrecognized compensation cost, which we will include in administrative and general expenses, relating to all of the Company’s restricted stock grants as of December 31, 2010:
|
Grant Date
|
2011
|
2012
|
Total
|
|||||||||
|
April 30, 2008
|
$ | 435,000 | $ | 34,000 | $ | 469,000 | ||||||
|
January 28, 2010
|
$ | 289,000 | $ | - | $ | 289,000 | ||||||
For the year ended December 31, 2010, the Company’s income before taxes and net income included $2,341,000 and $1,522,300, respectively, of stock-based compensation expense charges, while basic and diluted earnings per share were each charged $0.21 per share. For the year ended December 31, 2009, the Company’s income before taxes and net income included $1,834,000 and $1,192,100, respectively, of stock-based compensation expense charges, while basic and diluted earnings per share were each charged $0.17 and $0.16 per share, respectively. For the year ended December 31, 2008, the Company’s income before taxes and net income included $757,000 and $492,000, respectively, of stock-based compensation expense charges, while basic and diluted earnings per share were each charged $0.07 per share.
NOTE T – STOCK REPURCHASE PROGRAM
On January 25, 2008, the Company’s Board of Directors approved a share repurchase program for up to a total of 1,000,000 shares of the Company’s common stock. We expect that any share repurchases under this program will be made from time to time for cash in open market transactions at prevailing market prices. The timing and amount of any purchases under the program will be determined by management based upon market conditions and other factors. In 2008, we repurchased 491,572 shares of our common stock for $11,468,000. Thereafter, we suspended repurchases until the second quarter of 2010, when we repurchased 223,051 shares of our Common Stock for $5,231,000. Unless and until the Board otherwise provides, this authorization will remain open indefinitely, or until we reach the 1,000,000 share limit.
NOTE U - FAIR VALUE MEASUREMENTS
Effective January 1, 2008, we adopted the provisions of Accounting Standards Codification (“ASC”) Topic 820. ASC Topic 820 defines fair value, establishes a framework for measuring fair value in generally accepted accounting principles and expands disclosures about fair value measurements.
ASC Topic 820 defines fair value as the price that would be received to sell an asset or paid to transfer a liability in an orderly transaction between market participants. A fair value measurement assumes that the transaction to sell the asset or transfer the liability occurs in the principal market for the asset or liability or, in the absence of a principal market, the most advantageous market for the asset or liability. The price in the principal (or most advantageous) market used to measure the fair value of the asset or liability is not adjusted for transaction costs. An orderly transaction is a transaction that assumes exposure to the market for a period prior to the measurement date to allow for marketing activities that are usual and customary for transactions involving such assets and liabilities; it is not a forced transaction. Market participants are buyers and sellers in the principal market that are (i) independent, (ii) knowledgeable, and (iii) able and willing to complete a transaction.
ASC Topic 820 requires the use of valuation techniques that are consistent with the market approach, the income approach and/or the cost approach. The market approach uses prices and other relevant information generated by market transactions involving identical or comparable assets and liabilities. The income approach uses valuation techniques to convert future amounts, such as cash flows or earnings, to a single present value on a discounted basis. The cost approach is based on the amount that currently would be required to replace the service capacity of an asset (replacement cost). Valuation techniques should be consistently applied. Inputs to valuation techniques refer to the assumptions that market participants would use in pricing the asset or liability. Inputs may be observable, meaning those that reflect the assumptions market participants would use in pricing the asset or liability developed based on market data obtained from independent sources, or unobservable, meaning those that reflect the reporting entity's own assumptions about the assumptions market participants would use in pricing the asset or liability developed based on the best information available in the circumstances. In that regard, ASC Topic 820 establishes a fair value hierarchy for valuation inputs that gives the highest priority to quoted prices in active markets for identical assets or liabilities and the lowest priority to unobservable inputs. The fair value hierarchy is as follows:
w Level 1 Inputs - Unadjusted quoted prices in active markets for identical assets or liabilities that the reporting entity has the ability to access at the measurement date.
w Level 2 Inputs - Inputs other than quoted prices included in Level 1 that are observable for the asset or liability, either directly or indirectly. These might include quoted prices for similar assets or liabilities in active markets, quoted prices for identical or similar assets or liabilities in markets that are not active, inputs other than quoted prices that are observable for the asset or liability (including interest rates, volatilities, prepayment speeds, credit risks) or inputs that are derived principally from or corroborated by market data by correlation or other means.
|
w
|
Level 3 Inputs - Unobservable inputs for determining the fair values of assets or liabilities that reflect an entity's own assumptions about the assumptions that market participants would use in pricing the assets or liabilities.
|
The following table summarizes our financial assets and financial liabilities measured at fair value on a recurring basis as of December 31, 2010, segregated by the level of the valuation inputs within the fair value hierarchy utilized to measure fair value:
|
(Amounts in thousands)
|
Level 1 Inputs
|
Level 2 Inputs
|
Level 3 Inputs
|
Total Fair Value
|
||||||||||||
|
Marketable securities
|
$ | 11,527 | $ | - | $ | - | $ | 11,527 | ||||||||
|
Derivative assets
|
- | 157 | - | 157 | ||||||||||||
|
Derivative liabilities
|
- | (9,620 | ) | - | (9,620 | ) | ||||||||||
NOTE V - IMPAIRMENT OF LONG LIVED ASSETS
The Company reviews property, plant and equipment for impairment whenever events or changes in circumstances indicate that the carrying amount of an asset may not be recoverable. Recoverability of assets is measured by a comparison of the carrying amount of an asset group to future net undiscounted cash flows expected to be generated by the asset group. If such assets are considered to be impaired, the impairment recognized is measured by the amount by which the carrying amount of the assets exceeds the fair value of the assets.
The Company’s Rail-Ferry segment consists of two Roll-on/Roll-off Special Purpose double-deck vessels, which carry loaded rail cars between the U.S. Gulf Coast and Mexico. In 2009, the segment began to feel the impact of the worldwide economic downturn and reported lower than expected gross profit results. The lower results were further dampened by the loss of one of the segment’s largest customers in December of 2009. As a result, we tested regularly to determine if this service was impaired. In the third quarter of 2010, we determined that the cash flows expected to be generated by the long-lived assets of our Rail-Ferry segment were less than the carrying amount of these assets. As such, we recognized a non-cash impairment charge of $25,430,000 in the third quarter of 2010 to reduce the carrying value of these assets to their estimated fair value. The fair value of these assets was estimated based upon an independent third party appraiser (Level 2 inputs).
We intend to continue to operate the Rail-Ferry segment as long as it can generate positive cash flows and further utilize the vessels available capacity to generate a return that would be accretive to net income.
During the second quarter of 2009, we recorded an impairment charge of $2,899,000 on one of our International flag container vessels included in our Time Charter Contracts-International Flag segment. This charge was the result of the termination of our Time Charter agreement on the vessel upon the mutual agreement with our customer. We agreed to the early termination in exchange for an increase in charter hire on the other international flag container vessel remaining under charter. The amount of the impairment charge was determined by writing down the remaining net book value of the vessel and the remaining unamortized deferred drydocking charges to the estimated fair market value of the vessel. The estimated fair value of the vessel was determined using available market data, which represented Level 2 inputs in the fair value hierarchy. In the third quarter 2009, we sold the vessel and recorded an additional loss of $129,000.
NOTE W – CHANGES IN ACCOUNTING ESTIMATE
In the first quarter of 2010, we extended the economic life on our U.S. flag Coal Carrier, basing this change in estimate on the extension on the vessel’s time charter contract. This change in estimate reduced our depreciation expense and increased our pre-tax income by $5.2 million and our net income by $3.4 million, or $0.47 per share, for the year ended December 31, 2010.
Also in the first quarter of 2010, we extended the economic life of both the Mobile, Alabama and Coatzacoalcos, Mexico rail terminal’s leasehold improvements due to contractual extensions to the rail terminal operating agreement. The amortization periods were extended two and a half years and six years, respectively. The extension of these amortization periods increased our pre-tax income by approximately $1.8 million, and our net income by approximately $1.2 million, or $0.16 per share, for the year ended December 31, 2010.
NOTE X - CONVERTIBLE EXCHANGEABLE PREFERRED STOCK
In January of 2005, we issued 800,000 shares of 6% convertible exchangeable preferred stock, $1.00 par value, at a price of $50.00 per share. The proceeds of the preferred stock offering, after deducting all associated costs, were $37,987,000. Each share of the preferred stock had a liquidation preference of $50 per share and was convertible into shares of our common stock based on the initial conversion price of $20.00 per share. On February 1, 2008 we completed the redemption of our 800,000 outstanding shares of 6% Convertible Exchangeable Preferred Stock. In lieu of cash redemption, holders of 462,382 shares of the Preferred Stock elected to convert their shares into approximately 1,155,955 shares of our common stock. The remaining 337,618 outstanding shares of Preferred Stock were retired for cash (including accrued and unpaid dividends to, but excluding, the redemption date), pursuant to the terms of the Preferred Stock. As a result, we no longer have any shares of the 6% Convertible Exchangeable Preferred Stock outstanding. The total cash payment for the redemption of the Preferred Stock including the accrued and unpaid dividends was $17,306,000. We had a charge to earnings of approximately $1,371,000 in the first quarter of 2008 from the redemption of the Preferred Stock.
NOTE Y – QUARTERLY FINANCIAL INFORMATION – (Unaudited)
|
|
|||||||||||||||||
|
(All Amounts in Thousands Except Share Data)
|
Quarter Ended
|
||||||||||||||||
|
March 31
|
June 30
|
Sept. 30
|
Dec. 31
|
||||||||||||||
|
2010
|
Revenues
|
$ | 72,914 | $ | 85,084 | $ | 74,400 | $ | 57,651 | ||||||||
|
Expenses
|
58,707 | 66,497 | 54,848 | 47,224 | |||||||||||||
|
Impairment Loss
|
- | - | 25,430 | - | |||||||||||||
|
Gross Voyage Profit (Loss)
|
14,207 | 18,587 | (5,878 | ) | 10,427 | ||||||||||||
|
Income (Loss) from Continuing Operations
|
10,568 | 9,616 | (13,823 | ) | 8,941 | ||||||||||||
|
Net Income (Loss) Available to Common Stockholders
|
10,568 | 9,616 | (13,823 | ) | 8,941 | ||||||||||||
|
Basic and Diluted Earnings (Loss) per Common Share:
|
|||||||||||||||||
|
Net Income (Loss) Available to Common Stockholders-Basic
|
|||||||||||||||||
|
Continuing Operations
|
1.46 | 1.33 | (1.95 | ) | 1.26 | ||||||||||||
|
Net Income (Loss) Available to Common Stockholders-Diluted
|
|||||||||||||||||
|
Continuing Operations
|
1.44 | 1.32 | (1.95 | ) | 1.25 | ||||||||||||
|
2009
|
Revenues
|
$ | 98,078 | $ | 99,815 | $ | 92,261 | $ | 89,795 | ||||||||
|
Expenses
|
83,250 | 82,087 | 76,769 | 73,826 | |||||||||||||
|
Impairment Loss
|
- | 2,899 | - | - | |||||||||||||
|
Gross Voyage Profit
|
14,828 | 14,829 | 15,492 | 15,969 | |||||||||||||
|
Income from Continuing Operations
|
9,475 | 10,659 | 11,309 | 10,777 | |||||||||||||
|
Net Income Available to Common Stockholders
|
9,475 | 10,659 | 11,309 | 10,777 | |||||||||||||
|
Basic and Diluted Earnings per Common Share:
|
|||||||||||||||||
|
Net Income Available to Common Stockholders-Basic
|
|||||||||||||||||
|
Continuing Operations
|
1.31 | 1.47 | 1.56 | 1.49 | |||||||||||||
|
Net Income Available to Common Stockholders-Diluted
|
|||||||||||||||||
|
Continuing Operations
|
1.31 | 1.46 | 1.55 | 1.47 | |||||||||||||
INDEX OF SUPPLEMENTAL FINANCIAL STATEMENT SCHEDULES
| Report of Independent Registered Public Accounting Firm | S-2 |
| Schedule II - Valuation and Qualifying Accounts and Reserves | S-3 |
REPORT OF INDEPENDENT REGISTERED PUBLIC ACCOUNTING FIRM
The Board of Directors and Stockholders
International Shipholding Corporation
We have audited the consolidated financial statements of International Shipholding Corporation as of December 31, 2010 and 2009, and for each of the three years in the period ended December 31, 2010, and have issued our report thereon dated March 14, 2011 (included elsewhere in this Form 10-K). Our audits also included the financial statement Schedule II of this Form 10-K. This schedule is the responsibility of the Company’s management. Our responsibility is to express an opinion based on our audits.
In our opinion, the financial statement schedule referred to above, when considered in relation to the basic financial statements taken as a whole, presents fairly in all material respects the information set forth therein.
/s/ Ernst & Young LLP
New Orleans, Louisiana
March 14, 2011
Schedule II - Valuation and Qualifying Accounts and Reserves
(Amounts in Thousands)
|
Deductions
|
||||||||||||||
|
Balance at
|
Additions
|
for purpose for
|
Balance at
|
|||||||||||
|
beginning of
|
Charged to
|
Charged to
|
which accounts
|
end of
|
||||||||||
|
period
|
expense
|
Other accounts
|
were set up
|
period
|
||||||||||
|
December 31, 2008:
|
||||||||||||||
|
Insurance Reserves
|
$ 6,192
|
$ 4,797
|
$ -
|
$ 6,297
|
$ 4,692
|
|||||||||
|
Custom Reserves
|
296
|
-
|
-
|
-
|
296
|
|||||||||
|
Other Reserves
|
836
|
388
|
-
|
-
|
1,224
|
|||||||||
|
Total
|
$ 7,324
|
$ 5,185
|
$ -
|
$ 6,297
|
$ 6,212
|
|||||||||
|
December 31, 2009:
|
||||||||||||||
|
Insurance Reserves
|
$ 4,692
|
$ 3,117
|
$ -
|
$ 3,286
|
$ 4,523
|
|||||||||
|
Custom Reserves
|
296
|
-
|
-
|
296
|
-
|
|||||||||
|
Other Reserves
|
1,224
|
-
|
-
|
103
|
1,121
|
|||||||||
|
Total
|
$ 6,212
|
$ 3,117
|
$ -
|
$ 3,685
|
$ 5,644
|
|||||||||
|
December 31, 2010:
|
||||||||||||||
|
Insurance Reserves
|
$ 4,523
|
$ 1,913
|
$ -
|
$ 3,203
|
$ 3,233
|
|||||||||
|
Other Reserves
|
1,121
|
410
|
-
|
323
|
1,208
|
|||||||||
|
Total
|
$ 5,644
|
$ 2,323
|
$ -
|
$ 3,526
|
$ 4,441
|
|||||||||