Attached files
| file | filename |
|---|---|
| 8-K - FORM 8-K - APARTMENT INVESTMENT & MANAGEMENT CO | c14058e8vk.htm |
Exhibit 99.1

| AIMCO Apartment Investment and Management Company Citi Global Property CEO Conference March 2011 |

| 2 This presentation contains forward-looking statements within the meaning of the federal securities laws, including statements regarding projected results and specifically forecasts of 2011 financial results. These forward-looking statements are based on management's judgment as of this date and include certain risks and uncertainties. Risks and uncertainties include, but are not limited to, Aimco's ability to maintain current or meet projected occupancy, rental rates and property operating results. Actual results may differ materially from those described in these forward-looking statements and, in addition, will be affected by a variety of risks and factors, some of which are beyond the control of Aimco, including, without limitation: financing risks, including the availability and cost of capital markets financing and the risk that our cash flows from operations may be insufficient to meet required payments of principal and interest; earnings may not be sufficient to maintain compliance with debt covenants; real estate risks, including fluctuations in real estate values and the general economic climate in the markets in which we operate and competition for residents in such markets; national and local economic conditions, including the pace of job growth and the level of unemployment; the terms of governmental regulations that affect Aimco and interpretations of those regulations; the competitive environment in which Aimco operates; the timing of acquisitions and dispositions; insurance risk, including the cost of insurance; natural disasters and severe weather such as hurricanes; litigation, including costs associated with prosecuting or defending claims and any adverse outcomes; energy costs; and possible environmental liabilities, including costs, fines or penalties that may be incurred due to necessary remediation of contamination of properties presently owned or previously owned by Aimco. In addition, our current and continuing qualification as a real estate investment trust involves the application of highly technical and complex provisions of the Internal Revenue Code and depends on our ability to meet the various requirements imposed by the Internal Revenue Code, through actual operating results, distribution levels and diversity of stock ownership. Readers should carefully review Aimco's financial statements and notes thereto, as well as the risk factors described in Aimco's Annual Report on Form 10-K for the year ended December 31, 2010, and the other documents Aimco files from time to time with the Securities and Exchange Commission. These forward-looking statements reflect management's judgment as of this date, and Aimco assumes no obligation to revise or update them to reflect future events or circumstances. This presentation and these forward-looking statements include Aimco's analysis and conclusions based in part on third party data (including information on market growth rates) and reflect management's judgment as of the date of these materials, which are subject to change based on macro-economic factors beyond Aimco's control. Aimco assumes no obligation to revise or update to reflect future events or circumstances. A change in cap rates, market growth rates, credit availability or other such items could affect the analysis and conclusions reached herein. In addition, this presentation includes certain non-GAAP measures, which Aimco defines and reconciles to GAAP in its supplemental schedules to its quarterly earnings releases - see in particular the Glossary to Aimco's 4Q 2010 earnings release. This presentation does not constitute an offer of securities for sale. Forward-looking Statements and Other Information |

| 3 Aimco Key Valuation Factors Aimco holds high quality assets concentrated in 20 target markets. Aimco is a reliable operator with clear operating objectives. Aimco has limited balance sheet risk, good liquidity and virtually no near-term refunding risk. Apartment supply and demand fundamentals are strong, and getting stronger. Aimco will benefit from apartment market strength just as others will; Aimco's safe leverage magnifies growth compared to peers. Aimco's shares are priced at a discount to the shares of apartment REIT peers. |

| 4 Aimco Has a Simple Business Strategy Own and operate B/B+ quality apartments Well located in 20 largest U.S. markets Opportunistic redevelopment Finance with lower risk, property-level, non-recourse, long- dated, fixed-rate and amortizing debt |

| 5 * Represents Aimco average 4Q 2010 rents for all conventional properties held at quarter-end, including same store properties, redevelopment properties and other conventional properties compared to REIS average for each market. Asset Quality in Aimco's Markets Aimco defines quality by comparing rents to local market averages: A-quality: rents greater than 125% of market average B-quality: rents 90% - 125% of market average C-quality: rents less than 90% of the market average Target B/B+ rents ~100% - 125% |

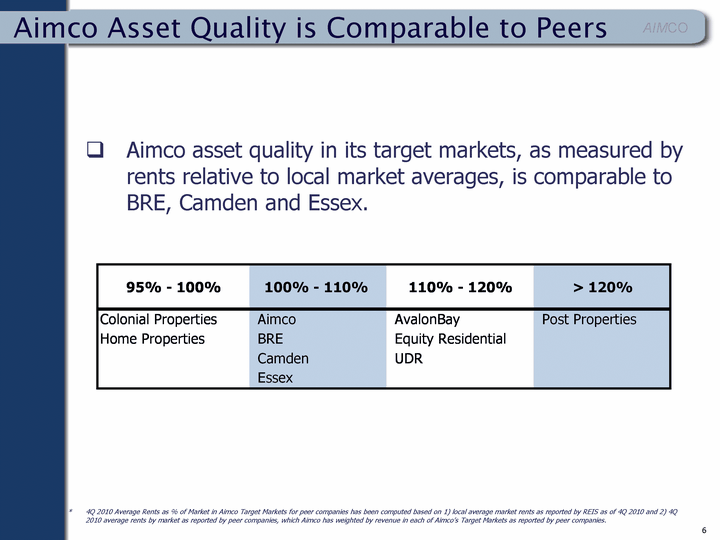
| 6 * 4Q 2010 Average Rents as % of Market in Aimco Target Markets for peer companies has been computed based on 1) local average market rents as reported by REIS as of 4Q 2010 and 2) 4Q 2010 average rents by market as reported by peer companies, which Aimco has weighted by revenue in each of Aimco's Target Markets as reported by peer companies. Aimco Asset Quality is Comparable to Peers Aimco asset quality in its target markets, as measured by rents relative to local market averages, is comparable to BRE, Camden and Essex. |

| 7 Excludes casualties and property management expenses. NOI less assumed capital replacement expenditures of $850 per unit. $8.5 billion of sales of lower-rated assets from 2004 through 2010 have improved overall portfolio quality. Average rents ? 42% NOI margin ? 8% Free Cash Flow margin ? 20% Capital Recycling Improves Portfolio |

| 8 Aimco is a Reliable Operator * Average of AvalonBay, Camden, Equity Residential, Essex, Home Properties and UDR results as reported individually by SNL Financial. Operating performance exceeds peer average over the last one, three and five years. |

| 9 2011 Property Operations Objectives Build on 2010 Success Revenue Growth: Total Same Store #2 of 10 apartment REITs* Conventional Same Store #3 of 10 NOI Growth: Total Same Store #2 of 10 Conventional Same Store #2 of 10 Total Portfolio: Revenue 1.0% Expenses -0.9% NOI 2.3% Average Daily Occupancy 96.1% Record high renewal rate 54% Resident quality: Bad debt 0.7% of Revenue * Aimco, AvalonBay, BRE, Camden, Colonial Properties, EQR, Essex, Home Properties, Post Properties and UDR. 2011 Objectives Increase rental rates with a focus on bottom line NOI. Maximize on-site productivity through variable cost model and technology improvements. Continue to maintain and improve asset quality. Focus on the customers we already have. Maintain high resident quality standards. |

| 10 * For purposes of this analysis, peer group is comprised of BRE, Camden, Equity Residential, Colonial Properties, Home Properties, Post Properties and UDR, companies that report weighted- average maturity. Data as of 12/31/2010 as reported by SNL Financial. Aimco Has Limited Balance Sheet Risk Aimco is leveraged primarily with long-term, fixed-rate, non- recourse, amortizing property debt with a weighted-average interest rate of 5.5%. Weighted-average maturity of debt of eight years is 30% longer than Aimco's apartment peer average*. Perpetual preferred stock and preferred partnership units carry a weighted-average dividend rate of 7.4%. No recourse debt. Limited repricing risk. Limited 2011 debt maturities ($26 million exposure). |

| Favorable Demographics Drive Demand 60% to 70% of people aged 20 to 34 opt for rental housing.* This age cohort is projected to increase by 2.5 million people in the next three years, and 3.5 million over the next five years. * Source: Green Street Advisors 11 Historically, people aged 60 and over have had a propensity to rent of approximately 18%.* Should propensity to rent in this age cohort remain at historical levels, the aging population alone could create additional demand for rental housing. Source: Moody's Economy.com Source: Moody's Economy.com |

| The Labor Market is Expanding Again Source: Moody's Economy.com. Source: BLS Current Population Survey, January 2011. Represents year-over-year change in the civilian labor force, as defined by the BLS and used in the computation of BLS's unemployment rate. Chart does not refer to nonfarm payroll data. Economist Tom Lawler study results as posted on his blog, CalculatedRisk.com, and quoted in several prominent news publications. 12 Source: Moody's Economy.com The number of employed 20-34 year-old people increased by more than 800,000 during 2010 and by 320,000 in January 2011. As younger people secure jobs, the 32 million people aged 25 to 34 that live with their parents(3) will be looking for housing, with a high propensity to rent. Job growth has been positive since October 2010. (1) Economists expect several years to pass before jobs lost during the recession are recovered. Source: Moody's Economy.com |

| Long-term average Limited Supply, Homeownership Unattractive Homeownership is at a 10-year low, but still 1.2% above the long-term average. Every 1% decline in the homeownership rate translates into more than 1 million rental households. 13 Source: U.S. Census Bureau, Housing and Household Economic Statistics Division New supply remains limited in the short term. By 2013, completions should return to levels consistent with the last 20 years.* Source: U.S. Census Bureau, Housing and Household Economic Statistics Division * Source: Green Street Advisors, Residential Sector Update, 3/2/2011. |

| 14 * Represents average revenue growth computed by Aimco based on 1) the average of revenue growth projections published by REIS, PPR and AXIOMetrics as of 4Q 2010, and 2) peer market allocation based on 4Q 2010 company reports. Aimco does not endorse or affirm the projected revenue growth published by third parties set forth on this page. These third party projections are provided for informational purposes only, do not represent Aimco's projections for, or estimates of, revenue growth, and are not guarantees of performance. Growth Projections Positive & Comparable to Peer Group Aimco's increasing portfolio quality and property management strength support future revenue growth consistent with peers. The financial leverage of Aimco's low risk non-recourse property debt and preferred stocks magnifies growth compared to peers. |

| 15 Aimco's Shares Are Priced at a Discount Measure* Average rents NOI margin Free cash flow margin Non-recurring revenue as % of total revenue Recourse debt G&A as a % of property revenues Discount to peer median EV / Revenue Discount to peer median Price / Consensus NAV 2005 $811 55% 47% 2.4% $617M 5.8% -25% -5% 2010 $1,052 60% 54% 0.8% None 4.8% -34% -8% Change + 30% + 8% + 15% - 67% - 100% - 17% - 36% - 60% * Operating statistics for Aimco's conventional portfolio. By all measures, Aimco is a stronger company today. However, when compared to peers and to historical valuations, Aimco shares traded at a greater discount during 2010 than they did during 2005. |

| 16 Measure(1) Average rents NOI margin G&A as a % of property revenues Aimco Change + 30% + 8% - 17% Peer Median(2) + 17% + 1% - 1% * Data Sources: Green Street Advisors, Apartment REITs: February '06 Update, 2/15/06; Company reports; SNL Financial Operating statistics for Aimco's conventional portfolio. Peer group comprised of AvalonBay, BRE, Camden, EQR, Home Properties, Post Properties and UDR. Colonial Properties has been excluded due to non-comparability of multi-family portfolio between periods. Essex has been excluded because the data for Same Store NOI for the full year 2005 is not available. Source: KeyBanc Capital Markets Aimco's Shares Are Priced at a Discount |

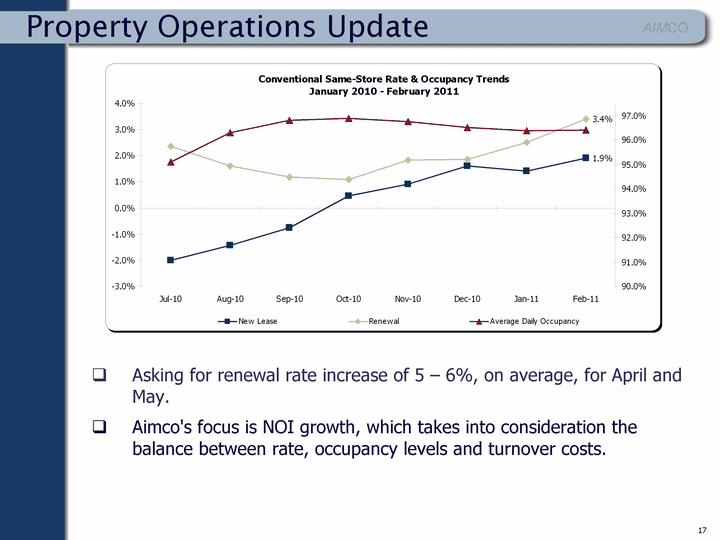
| 17 Property Operations Update Asking for renewal rate increase of 5 - 6%, on average, for April and May. Aimco's focus is NOI growth, which takes into consideration the balance between rate, occupancy levels and turnover costs. |
