Attached files
| file | filename |
|---|---|
| 8-K - 8-K - UTSTARCOM INC | a11-7721_28k.htm |
Exhibit 99.1
|
|
1 Full Year and Fourth Quarter 2010 Earnings Call Presentation Jack Lu, CEO Edmond Cheng, CFO NASDAQ: UTSI March 2011 |
|
|
2 Disclosure & Forward Looking Statements This investor presentation contains forward-looking statements, including statements regarding the Company's expectation regarding its new services business, ability to successfully compete to supply GEPON broadband products, expected benefits of a joint venture and anticipated or assumed future financial results in 2011. Forward-looking statements are based on current expectations, estimates, forecasts and projections about the Company, the Company’s future performance and the industries in which the Company operates as well as on the Company management's assumptions and beliefs. These forward-looking statements are only predictions and are subject to risks and uncertainties related to, among other things, the ability of the Company to realize anticipated results of operational improvements, increase bookings, and execute on its business plan, as well as risk factors identified in its latest Annual Report on Form 10-K, Quarterly Reports on Form 10-Q and Current Reports on Form 8-K, as filed with the Securities and Exchange Commission. Therefore, actual results could differ materially and adversely from the Company's current expectations. We undertake no obligation to update these forward-looking statements to reflect events or circumstances occurring after the date of this investor presentation. The Company is in a period of significant transition and in the conduct of its business is exposed to additional risks as a result. This investor presentation also includes financial guidance and information about the Company previously disclosed during the Company's 2009 and 2010 earnings conference calls, restructuring announcements on December 18, 2008 and November 9, 2009 and other filings with the Securities and Exchange Commission. Such guidance and information reflects the Company’s information and expectations as of those dates and this presentation is not intended to confirm or update that information and expectations. |
|
|
3 Agenda 2010 Full Year Highlights 1 Financial Overview Growth Strategy & Market Dynamics 2 3 Financial Outlook 4 |
|
|
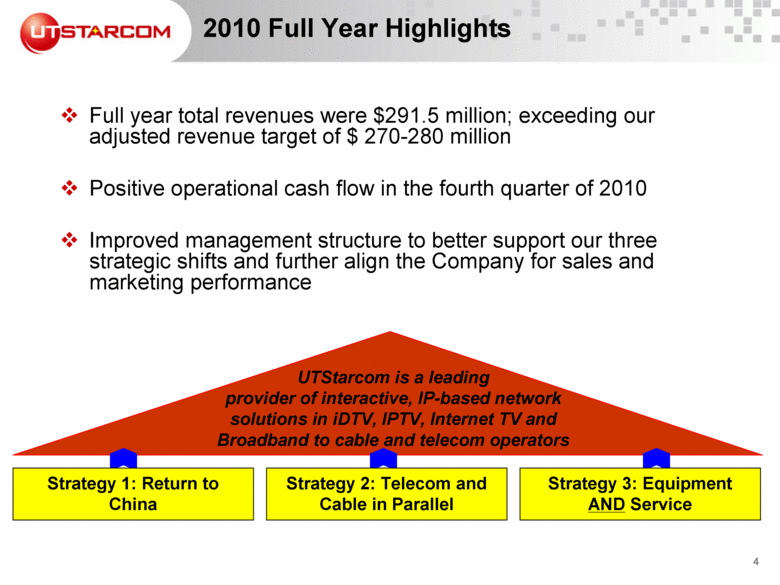
4 2010 Full Year Highlights Full year total revenues were $291.5 million; exceeding our adjusted revenue target of $ 270-280 million Positive operational cash flow in the fourth quarter of 2010 Improved management structure to better support our three strategic shifts and further align the Company for sales and marketing performance UTStarcom is a leading provider of interactive, IP-based network solutions in iDTV, IPTV, Internet TV and Broadband to cable and telecom operators Strategy 2: Telecom and Cable in Parallel Strategy 1: Return to China Strategy 3: Equipment AND Service |
|
|
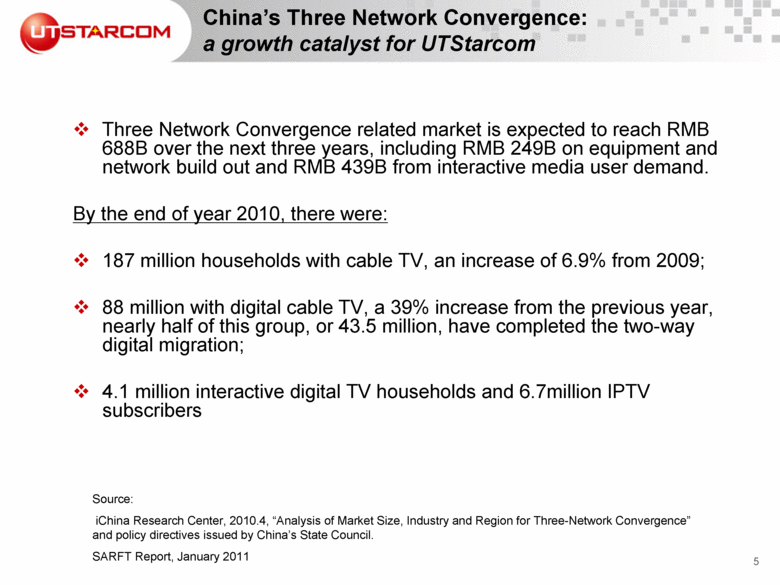
5 China’s Three Network Convergence: a growth catalyst for UTStarcom Three Network Convergence related market is expected to reach RMB 688B over the next three years, including RMB 249B on equipment and network build out and RMB 439B from interactive media user demand. By the end of year 2010, there were: 187 million households with cable TV, an increase of 6.9% from 2009; 88 million with digital cable TV, a 39% increase from the previous year, nearly half of this group, or 43.5 million, have completed the two-way digital migration; 4.1 million interactive digital TV households and 6.7million IPTV subscribers Source: iChina Research Center, 2010.4, “Analysis of Market Size, Industry and Region for Three-Network Convergence” and policy directives issued by China’s State Council. SARFT Report, January 2011 |
|
|
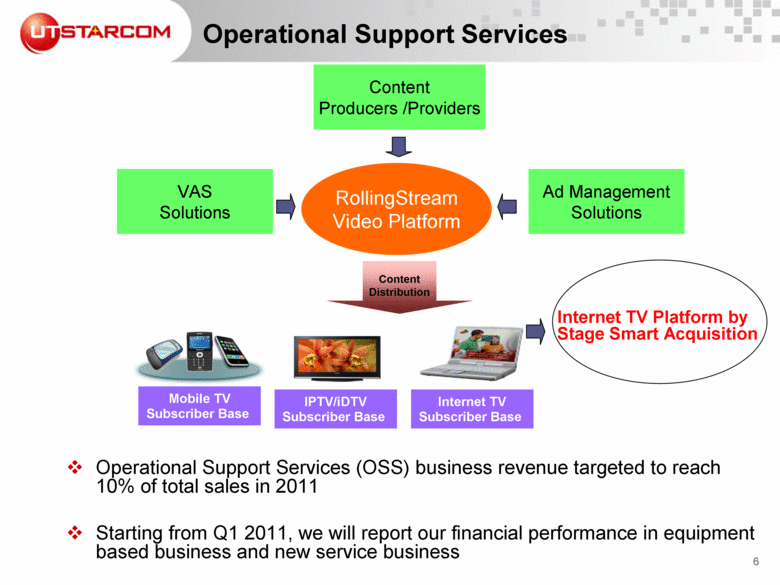
6 Operational Support Services Content Producers /Providers Ad Management Solutions VAS Solutions IPTV/iDTV Subscriber Base Content Distribution RollingStream Video Platform Internet TV Subscriber Base Mobile TV Subscriber Base Operational Support Services (OSS) business revenue targeted to reach 10% of total sales in 2011 Starting from Q1 2011, we will report our financial performance in equipment based business and new service business Internet TV Platform by Stage Smart Acquisition |
|
|
Fourth Quarter Achievement - China Contract won from Sichuan Province for a Packet Transit Network Contracts won from both cable and telecom operators in Zhejiang, Fujian, Anhui and Shenzhen to expand IPTV system The 6 IPTV broadcast control platforms successfully connected with the central-level platform EPON contract won from Ningxia Grid Company Participating in bidding to provide GEPON broadband products to China telecom operators Closed Stage Smart acquisition to launch internet TV platform in 2011 7 |
|
|
8 Fourth Quarter Achievement - Other Asian Markets First purchase order of IPTV system from TOT Thailand: Japan: Focused on Broadband Preferred PTN supplier of next generation IP transmission equipment for SBB Expect booking to be increased in 2011 India: Focused on IPTV and Broadband IPTV purchase order from Bharti BSNL phase III remains in negotiation Exploring a joint venture with local partner with better government relations and local market support to retain and extend leading position in IPTV sector |
|
|
9 Financial Highlights - Revenue Q4 2010,GAAP revenues: $76.1 million, compared to $116.3 million in Q4 2009 Net sales in 2010 exceeded the adjusted guidance; reached $291.5 million. Sales driver: increase in multimedia product related revenue as telecom operators strove to improve their infrastructure and completed large contracts earlier than expected |
|
|
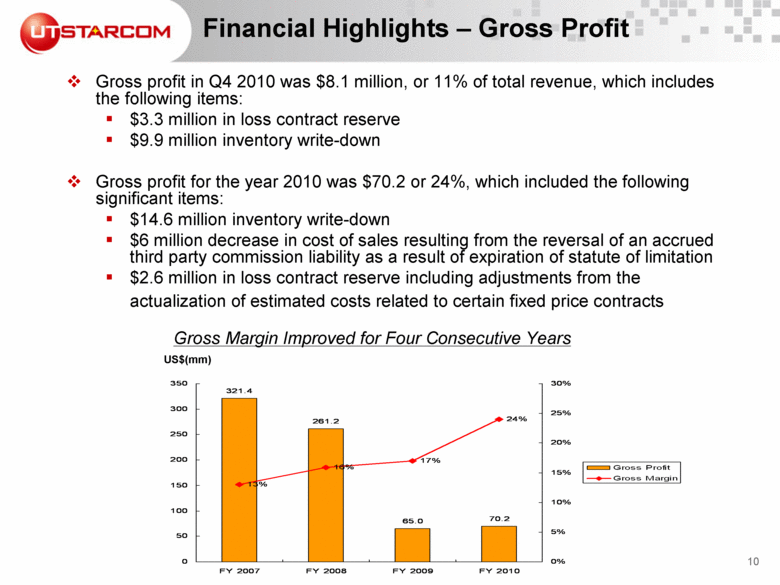
10 Financial Highlights – Gross Profit Gross profit in Q4 2010 was $8.1 million, or 11% of total revenue, which includes the following items: $3.3 million in loss contract reserve $9.9 million inventory write-down Gross profit for the year 2010 was $70.2 or 24%, which included the following significant items: $14.6 million inventory write-down $6 million decrease in cost of sales resulting from the reversal of an accrued third party commission liability as a result of expiration of statute of limitation $2.6 million in loss contract reserve including adjustments from the actualization of estimated costs related to certain fixed price contracts Gross Margin Improved for Four Consecutive Years US$(mm) 321.4 261.2 65.0 70.2 13% 16% 17% 24% 0 50 100 150 200 250 300 350 FY 2007 FY 2008 FY 2009 FY 2010 0% 5% 10% 15% 20% 25% 30% Gross Profit Gross Margin |
|
|
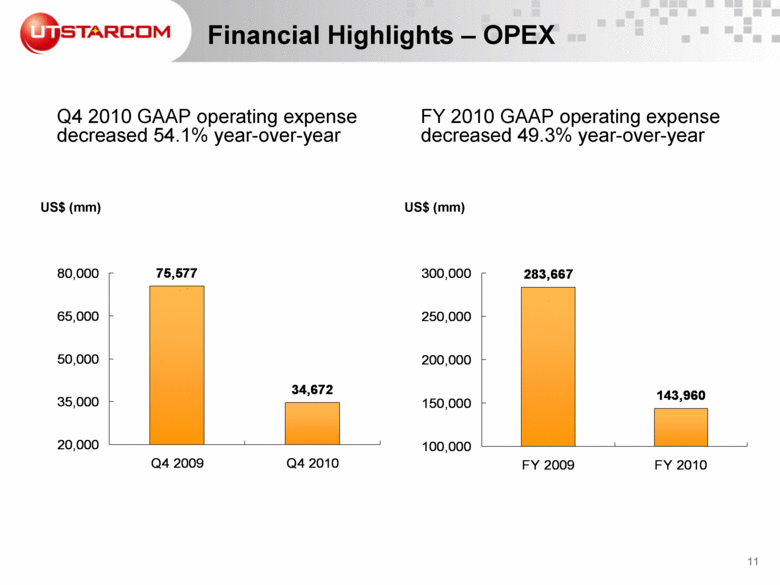
11 Financial Highlights – OPEX US$ (mm) US$ (mm) Q4 2010 GAAP operating expense decreased 54.1% year-over-year FY 2010 GAAP operating expense decreased 49.3% year-over-year 75,577 34,672 20,000 35,000 50,000 65,000 80,000 Q4 2009 Q4 2010 283,667 143,960 100,000 150,000 200,000 250,000 300,000 FY 2009 FY 2010 |
|
|
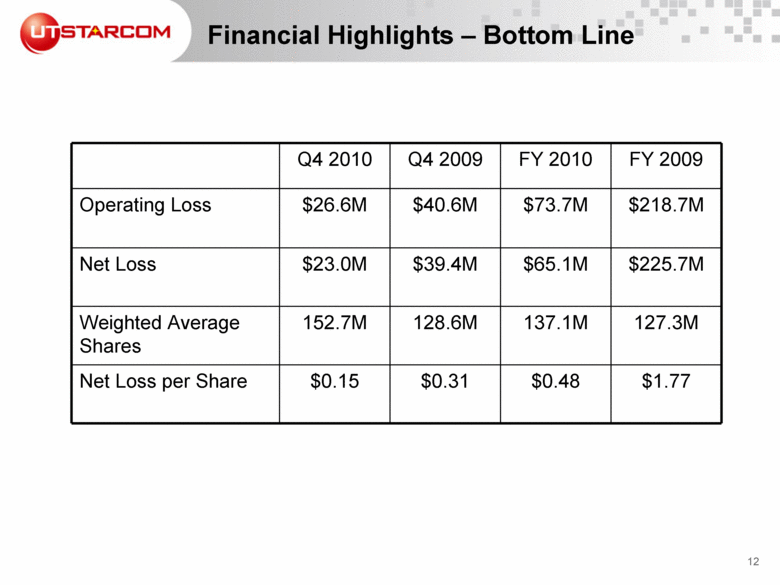
12 Financial Highlights – Bottom Line Q4 2010 Q4 2009 FY 2010 FY 2009 Operating Loss $26.6M $40.6M $73.7M $218.7M Net Loss $23.0M $39.4M $65.1M $225.7M Weighted Average Shares 152.7M 128.6M 137.1M 127.3M Net Loss per Share $0.15 $0.31 $0.48 $1.77 |
|
|
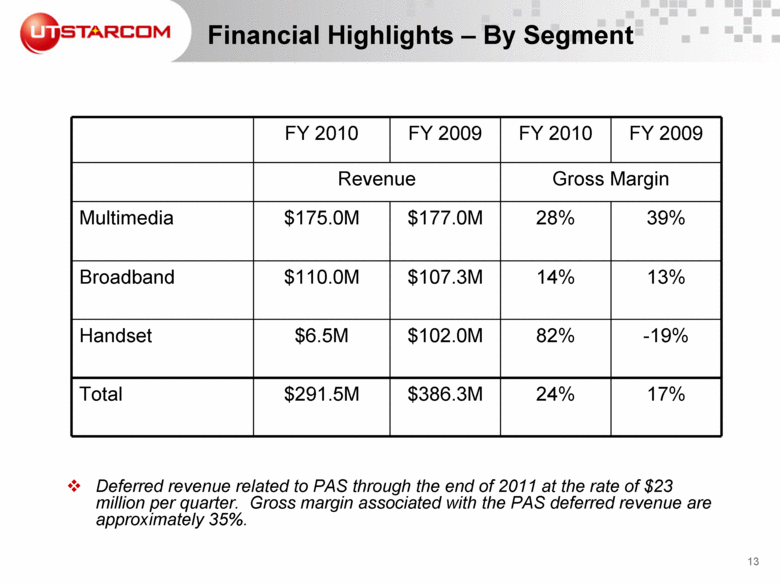
13 Financial Highlights – By Segment Deferred revenue related to PAS through the end of 2011 at the rate of $23 million per quarter. Gross margin associated with the PAS deferred revenue are approximately 35%. -19% 82% $102.0M $6.5M Handset FY 2010 FY 2009 FY 2010 FY 2009 Revenue Gross Margin Multimedia $175.0M $177.0M 28% 39% Broadband $110.0M $107.3M 14% 13% Total $291.5M $386.3M 24% 17% |
|
|
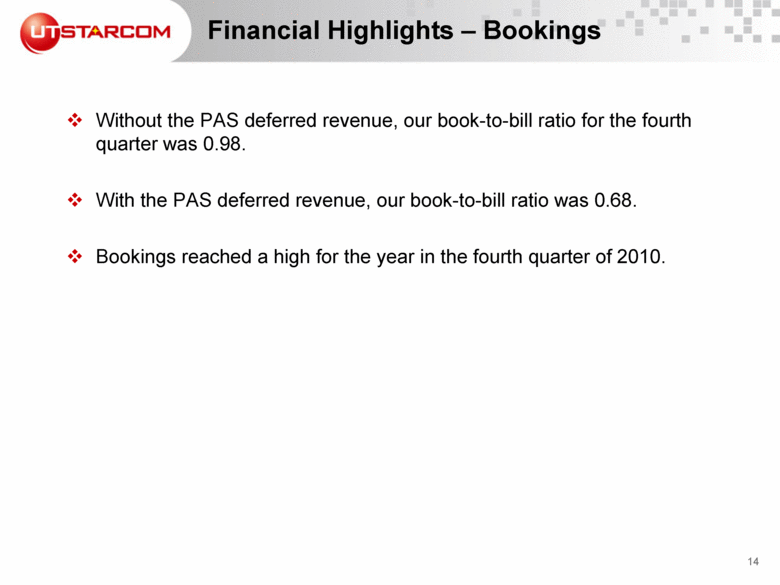
14 Without the PAS deferred revenue, our book-to-bill ratio for the fourth quarter was 0.98. With the PAS deferred revenue, our book-to-bill ratio was 0.68. Bookings reached a high for the year in the fourth quarter of 2010. Financial Highlights – Bookings |
|
|
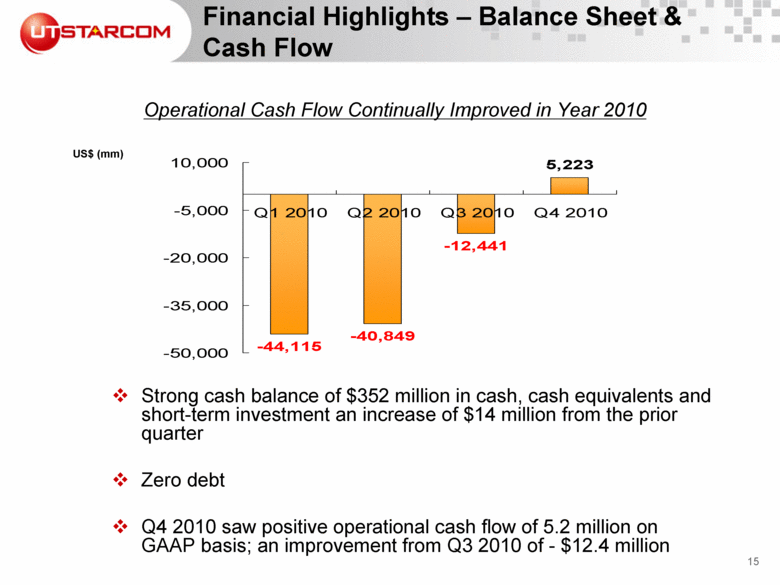
15 Strong cash balance of $352 million in cash, cash equivalents and short-term investment an increase of $14 million from the prior quarter Zero debt Q4 2010 saw positive operational cash flow of 5.2 million on GAAP basis; an improvement from Q3 2010 of - $12.4 million Financial Highlights – Balance Sheet & Cash Flow US$ (mm) Operational Cash Flow Continually Improved in Year 2010 -44,115 -40,849 -12,441 5,223 -50,000 -35,000 -20,000 -5,000 10,000 Q1 2010 Q2 2010 Q3 2010 Q4 2010 |
|
|
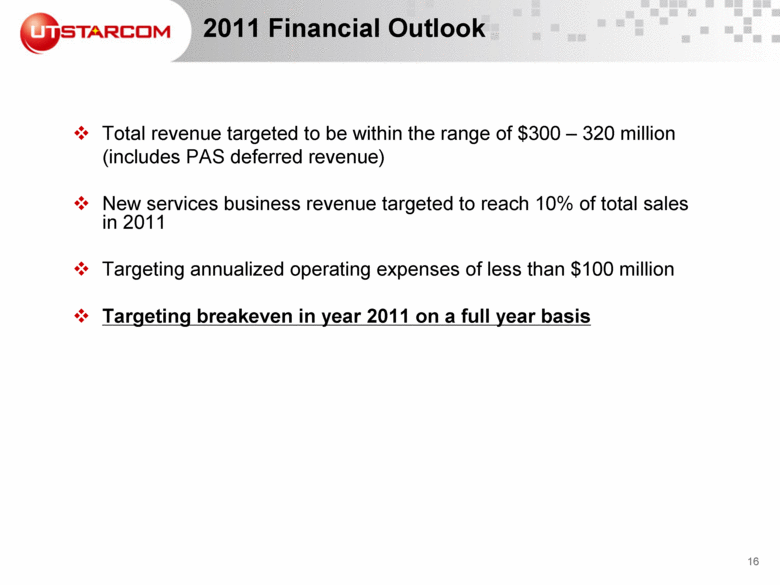
16 2011 Financial Outlook Total revenue targeted to be within the range of $300 – 320 million (includes PAS deferred revenue) New services business revenue targeted to reach 10% of total sales in 2011 Targeting annualized operating expenses of less than $100 million Targeting breakeven in year 2011 on a full year basis |
|
|
17 Investor Relations Contact UTStarcom, Investor Relations: Ms. Jing Ou-Yang T: + 8610 8520 5153 E: jouyang@utstar.com Kreab Gavin Anderson, external advisor: In Asia: In the US: Brion Tingler Judi Flynn Echeverria T: + 8610 6535 3567 T: + 1 212 515 1855 E: btingler@kreabgavinanderson.com E: jflynn@kreabgavinanderson.com |


