Attached files
| file | filename |
|---|---|
| EX-21.1 - EX-21.1 - UTSTARCOM INC | a2202701zex-21_1.htm |
| EX-31.1 - EX-31.1 - UTSTARCOM INC | a2202701zex-31_1.htm |
| EX-31.2 - EX-31.2 - UTSTARCOM INC | a2202701zex-31_2.htm |
| EX-23.1 - EX-23.1 - UTSTARCOM INC | a2202701zex-23_1.htm |
| EX-32.1 - EX-32.1 - UTSTARCOM INC | a2202701zex-32_1.htm |
Use these links to rapidly review the document
TABLE OF CONTENTS
ITEM 8—FINANCIAL STATEMENTS AND SUPPLEMENTARY DATA
UNITED STATES
SECURITIES AND EXCHANGE COMMISSION
Washington, D.C. 20549
FORM 10-K
ý |
ANNUAL REPORT PURSUANT TO SECTION 13 OR 15(d) OF THE SECURITIES EXCHANGE ACT OF 1934 |
|
For the Fiscal Year Ended December 31, 2010 |
||
o |
TRANSITION REPORT PURSUANT TO SECTION 13 OR 15(d) OF THE SECURITIES EXCHANGE ACT OF 1934 |
|
For the transition period from to |
||
Commission File Number: 000-29661
UTSTARCOM, INC.
(Exact name of registrant as specified in its charter)
| Delaware (State or other jurisdiction of incorporation or organization) |
52-1782500 (I.R.S. Employer Identification No.) |
|
20F, Tower E1, The Towers, Oriental Plaza No. 1 East Chang An Avenue Dong Cheng District, Beijing, P.R. China (Address of principal executive offices) |
100738 (Zip Code) |
+86(10) 8520-5588
(Registrant's telephone number, including area code)
Securities registered pursuant to Section 12(b) of the Act:
| Title of Each Class | Name of Exchange on which Registered | |
|---|---|---|
| Common Stock, $0.00125 par value | The NASDAQ Stock Market LLC |
Securities registered pursuant to Section 12(g) of the Act: None
Indicate by check mark if the registrant is a well-known seasoned issuer, as defined in Rule 405 of the Securities Act. Yes o No ý
Indicate by check mark if the registrant is not required to file reports pursuant to Section 13 or Section 15(d) of the Exchange Act. Yes o No ý
Indicate by check mark whether the registrant (1) has filed all reports required to be filed by Section 13 or 15(d) of the Securities Exchange Act of 1934 during the preceding 12 months (or for such shorter period that the registrant was required to file such reports), and (2) has been subject to such filing requirements for the past 90 days. Yes ý No o
Indicate by check mark whether the registrant has submitted electronically and posted on its corporate Web site, if any, every Interactive Data File required to be submitted and posted pursuant to Rule 405 of Regulation S-T (§232.405 of this chapter) during the preceding 12 months (or for such shorter period that the registrant was required to submit and post such files). Yes o No o
Indicate by check mark if disclosure of delinquent filers pursuant to Item 405 of Regulation S-K (§229.405 of this chapter) is not contained herein, and will not be contained, to the best of registrant's knowledge, in definitive proxy or information statements incorporated by reference in Part III of this Form 10-K or any amendment to this Form 10-K. o
Indicate by check mark whether the registrant is a large accelerated filer, an accelerated filer, a non-accelerated filer, or a smaller reporting company. See the definitions of "large accelerated filer," "accelerated filer" and "smaller reporting company" in Rule 12b-2 of the Exchange Act. (check one):
| Large accelerated filer o | Accelerated filer ý | Non-accelerated filer o (Do not check if a smaller reporting company) |
Smaller reporting company o |
Indicate by check mark whether the registrant is a shell company (as defined in Rule 12b-2 of the Exchange Act). Yes o No ý
The aggregate market value of the voting stock held by non-affiliates of the registrant as of the last business day of the registrant's most recently completed second fiscal quarter was approximately $209,790,492 based upon the closing price of $1.84 reported for such date on The NASDAQ Stock Market, LLC. For purposes of this disclosure, shares of Common Stock held by persons who hold more than 10% of the outstanding shares of Common Stock and shares held by officers and directors of the registrant, have been excluded in that such persons may be deemed to be affiliates. This determination is not necessarily conclusive for other purposes.
As of March 1, 2011, the registrant had 155,727,218 outstanding shares of Common Stock.
DOCUMENTS INCORPORATED BY REFERENCE
Portions of the registrant's definitive Proxy Statement to be delivered to the stockholders in connection with its Annual Meeting of Stockholders, which Proxy Statement will be filed with the SEC no later than April 30, 2011, are incorporated by reference into Part III hereof.
2
UTStarcom (which may be referred to as the Company, we, us, or our) means UTStarcom, Inc. or UTStarcom, Inc. and its subsidiaries, as the context requires. The name UTStarcom is a registered trademark of UTStarcom, Inc.
In this Annual Report on Form 10-K, references to and statements regarding China or PRC, refer to the People's Republic of China or mainland China, references to U.S. Dollars or $ are to United States Dollars, and references to Renminbi are to Renminbi, the legal currency of China.
Unless specifically stated, information in this Annual Report on Form 10-K assumes an exchange rate of 6.59 Renminbi for one U.S. Dollar, the exchange rate in effect as of December 31, 2010.
Throughout this Annual Report on Form 10-K we may incorporate by reference certain information from other documents filed with the Securities and Exchange Commission (the "SEC"). Please refer to such information at www.sec.gov.
UTStarcom's public filings, including our annual reports on Form 10-K, quarterly reports on Form 10-Q and current reports on Form 8-K, and any amendments to such reports, are available free of charge at our website, www.utstar.com. The information contained on our website is not being incorporated herein and all website addresses provided herein are intended to be inactive textual references only.
This Annual Report on Form 10-K contains forward-looking statements. Beginning on page 18 we discuss some of the risk factors that could cause our actual results to differ materially from those provided in the forward-looking statements.
OVERVIEW
We are a leading provider of interactive, Protocol ("IP")-based network solutions including the integration and support services in Internet Protocol TV ("IPTV"), Interactive ("iD")TV, Internet TV and Broadband for cable and telecom operators. Our focus is to design and sell IP-based telecommunications infrastructure products including our primary product suite of IPTV, and broadband solutions along with the ongoing services relating to the installation, operation and maintenance of these products. Collectively our range of solutions is designed to expand and modernize telecommunications networks through smooth network system integration, lower operating costs and increased broadband access. We also provide the telecommunications carriers and other customers with increased revenue opportunities by enhancing their subscribers' user experience. The majority of our sales have been to service providers in China, Japan and India. We also sell to service providers in selective markets in Asia Pacific, Latin America and Europe.
UTStarcom was incorporated in Delaware in 1991. Our headquarters were previously in Alameda, California, with our research and design and manufacturing operations primarily in China and sales offices in the key markets which we serve. In September 2010, we moved our operational headquarters to Beijing, China. Our primary mailing address is 20F, Tower E1, The Towers, Oriental Plaza, No.1 East Chang An Avenue, Dong Cheng District, Beijing, P.R. China. We can be reached by telephone at +86(10) 8520-5588 and our website address is www.utstar.com. All of our SEC filings can be found under the Investor Relations section of our website or at the SEC's website at www.sec.gov and are available free of charge. The information contained on our website is not being incorporated by reference herein.
3
OUR OBJECTIVE
Our objective is to be a leading provider of IP-based communications products and services in IPTV, iDTV, Internet TV and Broadband. We seek to differentiate ourselves by developing cost effective and reliable products that enable telecommunications operators to enhance the technological capacity of their networks, lower their operating expenses and provide new offerings to their customer base. Our products are designed to integrate multiple functionalities and deliver multiple revenue-generating services on a single technology platform, reduce network complexity and enable a migration to a new generation of network technologies. Our multimedia communication solutions enable operators to provide IPTV, iDTV, internet TV, mobile TV and other industrial applications to their end users. Our broadband solutions are designed to make carrier deployments, maintenance and upgrades both economical and efficient, allowing operators to earn a high return on their investment while reducing subscriber churn and increasing average revenue per subscriber.
OUR STRATEGY
Our objective is to enhance our position in IP-based services and key infrastructure products with attractive growth potential in selective geographic markets. To achieve this goal, we focused on our core strengths and aligned with favorable long-term market trends relating to IP products. In the third quarter of 2010, we announced and executed three shifts in our corporate strategy. First, we moved our operational headquarter to Beijing, China in order to better focus on the Asian market, especially in China, Japan and India. Second, because our technology has applications across different kinds of networks, we started to pursue both telecom and cable network customers. Third, in addition to the traditional pure equipment sales business, we are expanding our service-based revenue sources through mergers and acquisitions as well as by entering into long-term revenue sharing arrangements with cable operators. In 2009, we also announced our intention to outsource our manufacturing operation to improve cash flow and operational efficiency. In 2010, we outsourced a few production lines to our manufacturing outsource partner. As we execute our strategy, we believe we will be rewarded for our existing relationships with major operators and our well-developed products with increased contract awards that are expected to have a positive impact on our financial metrics. Our strategic priorities, and the related milestones achieved in 2010, are summarized as follows:
Focus primarily on providing a suite of IP-based solutions including our main product suite comprised of IPTV and broadband products and the related services.
Recent macro trends indicate that telecom carriers want solutions that solve complex network problems and help them attract subscribers through an enhanced user experience. IP-based products have given clear indication of meeting this market driven demand. Product development and deployment are our core competency which is indicated by our historic and recent experience in successfully introducing market-changing technologies for the telecommunications market.
We implemented our strategy by exiting a number of businesses which we identified as non-core to our IP-based product strategy.
In 2009, we disbanded our Custom Solutions Business Unit ("CSBU") and substantially completed the wind down of our worldwide handset operations. In 2010, we further streamlined our suite of product offerings and geographical focus through additional divestitures.
By simplifying our company, we can now better allocate our resources to the product areas with attractive financial returns as well as where we can differentiate ourselves from the competition. We intend to expand our market position in IP-based and broadband products through innovation and continued research and development efforts.
4
Maintain our leadership position in China and India while solidifying our presence in selective geographical markets in Asia Pacific. In addition, use reseller partners to manage selective markets in Latin America and Europe.
Markets in China and India are characterized as having large populations, a growing base of wealth, and high acceptance rates for new technology. Additionally, carriers in these regions are relatively unencumbered by established legacy networks leading them to invest high capital expenditure budgets in order to modernize and expand their networks. Over time these regions are expected to have higher rates of growth than the North American market.
In China and India we hold market leadership positions for certain key offerings. During 2010, we held a leadership position in IPTV market share in China and India, as well as a leading position in India's broadband market. While we continue to maintain dedicated direct sales teams in China and India, we started working with strategic partners to maintain our coverage in Latin America and Europe.
On February 1, 2010, we entered into agreements for a strategic relationship with Beijing E-town International Investment and Development Co., Ltd ("BEIID") which included a proposed investment in the Company's common stock by BEIID, and two unrelated investment funds, Elite Noble Limited and Shah Capital Opportunity Fund LP. The investment by BEIID gave us access to and a deeper understanding of the Chinese government agencies that make decisions about cable and telecom network spending which we expect will further strengthen our leadership and market position in China.
During 2009, we increased our effort in the Japanese market and won the first Transport Network (TN) commercial contract with Softbank Corp. ("Softbank"). In 2010, we were selected as the preferred Packet Transport Network ("PTN") supplier of next generation IP transmission equipment for Softbank. We also have an important presence across key markets in the rest of Asia.
In 2010, we completed a sale of our PDSN assets in China, North America, Caribbean, and Latin America regions. The divested assets were part of the Multimedia Communications segment. We also divested our Europe, Middle East and Africa ("EMEA") operations which were part of the Broadband segment.
Leverage our strong reputation with telecom carriers and our ability to solve complex network problems.
Telecom carriers generally select vendors with a proven innovation track record and also reliably provide network solutions. Historically we have deployed Next Generation Network ("NGN") and broadband solutions which enabled carriers to improve their network performance. Additionally, carriers are able to deploy, maintain and upgrade to optimize traffic management, lower operating costs and expedite network integration. Our IP-based telecommunication infrastructure products provide innovative features such as interactive media and digital signage that help carriers attract new subscribers and increase their revenue streams.
Over time, these deployments have enhanced our understanding of carrier needs and our ability to design appropriate solutions. The reputation that we have obtained for innovation, performance and reliability provide us a competitive advantage as we seek to expand our existing and new customer relationships.
Improve our financial position by executing announced restructuring initiatives and reducing operating expense levels.
We recognized the urgency for us to improve our financial model in order to return the company to profitability. We divested a number of non-core businesses to allow us to better concentrate our resources and management attention on our strategic priorities. In June 2009, we announced a series of
5
corporate initiatives targeted at returning the company to profitability. These actions included outsourcing our manufacturing operations, optimizing our research and development ("R&D") spending by focusing on selective IP products, and continued aggressive rationalization of our facility locations and general administrative costs. As a result we reduced our year-over-year selling, general and administrative and research and development operating expenses by approximately 35% in 2010 and 49% in 2009 and reduced our headcount by 500 from 2,400 to approximately 1,900 in 2010 and by 2,000 from 4,400 to approximately 2,400 in 2009.
We have also realigned our product focus, R&D and sales efforts to more effectively target the most desired customers in our selected regions. Externally, we seek to establish sales partnerships and sales channels that will improve our ability to obtain and execute contracts in certain geographic regions. Our ability to successfully implement the remainder of the restructuring actions in 2011 is a critical part of our plan to reduce operating expense levels and maintain liquidity.
We may encounter difficulties in implementing this significant change. If we are not successful, we may not achieve the expected benefits despite having expended significant capital and human effort. We will need to continue to manage the company's resources, particularly our cash position, to ensure our ability to execute our strategic plan with an emphasis on near term return on investments and profitability.
KEY STRENGTHS
Our key strengths in the implementation of our strategy include:
Demonstrated ability to introduce and deploy reliable IP-based technologies.
Since 2005 we have pioneered IPTV deployment in China and India. Today we are one of the leading IPTV providers across Asia that introduced the first IPTV-based video advertising network in China. In 2008, we proved our NGN expertise as we were one of the few companies to execute Class 5 switch replacements. Our mSwitch™ NGN solution carried more than 500 billion minutes of usage (MoU), representing a sizable share of global Voice over IP ("VoIP") transfer. We were among the very few pioneered the MPLS based Telecom transport technology, and as a result in 2009, we launched our TN Solution and secured two commercial contracts. Relative to the broadband market we have a leadership position in India and we launched the world's first all-IP based digital subscriber line access multiplexer ("DSLAM") and the first Gigabit Ethernet Passive Optical Network ("GEPON") solution. Our innovation is part of our heritage dating to the early 1990s when we helped create a new telecommunications market in China based on the development of our Personal Access System ("PAS") products, offering an alternative to traditional mobile telephony. In 2010, we launched GEPON+Ethernet over Cable ("EOC") products for high speed broadband access for the cable market and further expanded our IPTV Rollingstream platform with iDTV and internet TV solutions to fully support three network convergences.
Reputation for providing a unique customer-centric business model and solving complex problems to expand and modernize networks.
Our product portfolio includes interactive IPTV services that generate an additional revenue opportunity with a carrier's subscriber base. The NGN and broadband products significantly reduce operating costs through better network integration and management, improved broadband access and effective network management support. We have demonstrated our ability to customize the design of our solutions to match the economic needs of our customers. As such, the carriers are able to shorten the timeframe of return on investment timeframe for their network expenditures.
6
Important market positions in China and India with a significant presence in other selective key markets in Asia.
Our pioneering role is in the telecommunications industry and strong brand recognition in China and India position us favorably. The majority of our business is derived from the large and developing economies in China and India. These regions have historically had high acceptance rates for new technologies, fewer established competitors and have a lack of legacy infrastructure hurdles in their existing networks. Meanwhile, many third party sources indicate that these regions are expected to have continued strong gross domestic product growth and as a result management believes telecom capital expenditure budgets in these regions should be better able to withstand the current economic climate than the North American market.
MARKETS AND CUSTOMERS
Our products and services are being deployed and implemented in regions throughout the world in markets including Asia, Latin America and Europe. Prior to the divestiture of UTStarcom Personal Communications LLC, a wholly-owned subsidiary of UTStarcom ("PCD") operations in July 2008, the United States was our single largest market, which represented 61% of net sales in 2008. China is now our largest market, representing 57% and 46% of our net sales in 2010 and 2009, respectively. Additional markets and customer information is included in the discussion of business segments below.
In China, we are well positioned to capture the great business opportunity in the Three Network Convergence. The Three Network Convergence is the Chinese central government policy directed at improving the capabilities and effectiveness of voice, video and data communication services across all of the major communications networks: telecom, cable TV and broadband internet. It is targeted to be completed by 2015.
In July of 2010, 12 Chinese cities and regions were selected as pilots for the Three Network Convergence on a trial basis before a national rollout. UTStarcom has won several contracts for the trial and has already built 6 IPTV broadcast control platform projects, one in each of Sichuan, Shenzhen, Beijing, Hubei, Hunan and Shandong which demonstrated our technology capability.
Global Customers
Our customers, typically telecommunications and cable service providers, enable delivery of wireless, wire line and broadband access services including data, voice, and/or television to their subscribers. They include, but are not limited to, local, regional, national and international telecommunications carriers, including broadband, cable, internet, wire line and wireless providers. Telecommunications and cable service providers typically require extensive proposal review, product certification, test and evaluation and network design and, in most cases, are associated with long sales cycles. Our customers' networking requirements are influenced by numerous variables, including their size, the number and types of subscribers that they serve, the relative teledensity (the number of phone lines per 100 persons) of the geography served, their subscriber demand for IP communications and access services in the served geography.
Competition
We compete in the telecommunications equipment market, providing IP-based core infrastructure products, and services for transporting data, voice and television traffic across IP-based networks. The markets in which we compete are characterized by rapid change, converging technologies, and a migration to IP-based networking and communications solutions that offer relative advantages to our customers and their subscribers. These market factors represent a competitive threat to UTStarcom. We compete with numerous vendors in each product and market category. The overall number of our competitors providing new products and solutions may increase. Also, the composition of competitors
7
may change as we increase our activity in various technology markets. In particular, we have experienced price-focused competition from competitors in Asia, and we anticipate this will continue. For specific competitors, see the following discussion of our business segments in this Item 1.
We believe our competitive strengths are derived from three main factors: our ability to introduce and deploy well developed IP-based technologies and products; our reputation for providing a customer-centric business model and solving complex problems; and our market leadership position in China and India along with an important presence in selective key markets across Asia Pacific.
By contrast, our competitive disadvantages include our relatively smaller size in terms of revenues, working capital, and financial resources and number of employees as compared to many of our competitors, our lack of history and experience in selling to many of the largest carriers in well-established markets and our lack of consumer brand recognition in markets outside of China and India.
TECHNOLOGY AND PRODUCTS
Our product focus is in two core markets: Broadband Infrastructure and Multimedia Communications. These markets leverage the high growth that is driven by the shift to IP-based technologies, particularly in the world's developing economies. We plan to build on our demonstrated success in key regions across Asia Pacific.
Within these two core markets, we anticipate profitable growth driven by our suite of offerings including IPTV and broadband solutions.
Business Segments
Our core business is comprised of the Multimedia Communications business unit and Broadband Infrastructure business unit and the corresponding Services business that supports these two business units. To align the business units with our corporate strategy to focus on core businesses, on July 1, 2008 we sold PCD to PCD LLC (see Note 3 of Notes to our Consolidated Financial Statements included under Part II, Item 8 of this Annual Report on Form 10-K). Prior to July 1, 2008, PCD sold and supported handsets other than PAS handsets, mainly in the United States. Included in the Other segment were Mobile Solutions Business Unit ("MSBU") and Custom Solutions Business Unit ("CSBU"). In July 2008, we also sold MSBU which was responsible for the development, sales and service of the Company's wireless IPCDMA/IPGSM product line, which connects CDMA cellular network infrastructure equipment to the IP network. We sold all the assets and liabilities related to MSBU, including certain intellectual property and technology rights (with the exception of cash and accounts related to Canadian GST taxes) except for products and intellectual property rights relating to our core CDMA products, such as PDSN. In the first quarter of 2009, we completed the wind-down of CSBU and the consolidation of voice messaging technology into our Multimedia Communications segment. CSBU historically had been responsible for the development, sales and service of other non-core products. The consolidation of voice messaging technology into the Multimedia Communications segment did not have a significant impact on segment net sales or gross profit. In order to optimize our resources and improve efficiency, beginning on January 1, 2010, the Company integrated its Services Segment into its Multimedia Communications and Broadband Infrastructure segments based on products for which services are performed. In 2010, the Company completed a sale of its PDSN assets in China, North America, Caribbean, and Latin America regions. The divested assets were part of the Multimedia Communications segment. The Company also divested its EMEA operations which were part of the Broadband segment. As we substantially completed the wind-down of our handsets business in the fourth quarter of 2009, except for sales relating to inventory clearing, we did not have any significant revenue from our handset segment in 2010 and do not expect any in 2011 and beyond.
8
Effective January 1, 2010, the new reporting segments are as follows:
- •
- Multimedia Communications—Focused on development and market opportunities in IPTV solutions and Wireless
infrastructure technologies, including related services revenue.
- •
- Broadband Infrastructure—Focused on our world class portfolio of broadband products, including related
services revenue.
- •
- Handsets—Focused on mobile phone business including PAS and CDMA handset market, as well as data cards markets. Handset sales to PCD LLC, which commenced after the July 1, 2008 sale of PCD, are included in this segment.
For net sales, segment margin and assets for these segments, see Note 16 of Notes to our Consolidated Financial Statements included under Part II, Item 8 of this Annual Report on Form 10-K, which is incorporated herein by reference.
Our Multimedia Communications segment is responsible for the development and management of IPTV and related technologies (such as IP Signage) plus our core NGN software. Our PAS infrastructure and wireless systems teams are also a part of this segment.
Our Broadband Infrastructure segment is responsible for software and hardware products that enable end users to access high-speed, cost-effective wire line data, voice and media communication.
Our Handsets segment designs, builds and sells consumer handset devices that allow customers to access wireless services. The Handsets segment includes all handset revenues within China, including all PAS handsets. Following the disposition of PCD in July 2008, the Handsets segment also includes our Korea based handset operations, whose principal activity was supplying handsets to PCD LLC. In December 2008, we initiated action to wind down our Korea operations and in July 2009 completed the sale of our Korea operations. In the fourth quarter of 2009, we substantially completed the wind-down of our remaining China handset business.
We support the growth and operation of the installed base of our system solutions through our professional services business, UTStarcom Services. Our globally-deployed experts assist our customers with activities ranging from network planning, circuit-to-packet network migration planning, systems integration, program management, operations management and support, and knowledge transfer.
MULTIMEDIA COMMUNICATIONS BUSINESS UNIT
Product Offerings
Revenues from this segment accounted for approximately 60%, 46% and 19% of total sales in 2010, 2009 and 2008, respectively. Our Multimedia Communications segment includes our IPTV, mSwitch™ and PAS solutions. In addition to our product offerings, we provide a broad range of service offerings, including technical support services. Our service offerings complement our products with a range of consulting, technical, project, quality and maintenance support-level services including 24-hour support through technical assistance centers. Technical support services are designed to help ensure that our products operate efficiently, remain highly reliable, and benefit from the most up-to-date system software. These services enable customers to protect their network investments and minimize downtime for systems running mission-critical applications.
RollingStream™—IPTV Solution
Video content is increasingly being viewed by telecommunications providers as a new source of revenue. Our IPTV system, RollingStream™, includes both central office and customer premises equipment for delivering television and multimedia over carrier networks based on IP technology. Our RollingStream™ products and services enable a service provider to deliver broadcast television and
9
on-demand video services to residential and commercial premises over a switched network architecture. It is a carrier-class product that is designed to scale to support millions of users and hundreds of thousands of content hours. We believe RollingStream™ is one of the first solutions designed to enable carriers to deploy very large-scale streaming video content over a switched network.
The RollingStream™ product family includes a storage and streaming device, a device for combining different video signals onto a unified distribution system, a device residing at the user's home or place of business, and a network management system that enables system wide operation. RollingStream™ products have been designed to function over standard copper telephone lines as well as cable or optical transmission lines.
RollingStream™ is designed to allow carriers to offer new, revenue-generating television and multi-media services. The system is also designed to help providers attract customers of cable and satellite operators by offering a more comprehensive and interactive suite of services. We continue to see industry and customer enthusiasm with key customer deployments announced in China with China Telecom and China Unicom, in India with Bharti Airtel, BSNL/Aksh and MTNL/Aksh, in Sri Lanka with Sri Lanka Telecom, and in Thailand with Thaitronic Company Limited.
mSwitch™—NGN & Softswitch Solution
Our mSwitch is a flexible IP-based platform designed to provide voice communications over an IP network. The mSwitch product family supports three primary solutions:
- •
- IP-based Personal Access System ("iPAS") Wireless Local Service,
- •
- NGN VoIP, and
- •
- Fixed Mobile Convergence.
mSwitch enables service providers to migrate from existing circuit platforms to a next generation IP-based switch architecture, or to launch new applications in "Greenfield" or new deployment environments that have no legacy infrastructure. Our mSwitch portfolio is a carrier-class next generation switching product family that enables service providers to:
- •
- Deploy a converged core switching network that supports both wire line and wireless endpoints,
- •
- Enable application delivery across diverse access points,
- •
- Maintain consistent end user experience regardless of method of access to the applications,
- •
- Protect investment in their core infrastructure,
- •
- Deploy a scalable, modular system, and
- •
- Enjoy the benefits of an Operation Support System /Network Management System suite designed to integrate with the service provider's existing network.
PAS—Personal Access System
Our Personal Access System family of wireless core infrastructure equipment, based on the PHS standards developed by The Association of Radio Industries and Telecommunication Technology Committee in Japan, is designed to help our customers create new revenue opportunities with high quality wireless voice and data services. Approximately 58%, 41% and 68% of our Multimedia Communications revenue in 2010, 2009 and 2008, respectively, was derived from our PAS infrastructure products.
With the UTStarcom IP-Based PAS (iPAS) wireless access network, operators can migrate their current wire line network to an IP-based PHS wireless network that provides wireless voice and data
10
services within a city or community. With this new system, service providers can offer new wireless services, such as citywide mobility, same-number wireless extension, email, mobile Internet access, text messaging and location-based services. Due to the China telecommunication industry restructuring and launch of 3G services in China, the PAS services will be phased out by January 1, 2012.
Markets and Customers
In 2010, our largest market for Multimedia Communications products was China, which accounted for approximately 88% of revenues for the segment, primarily driven by the PAS business. In 2010, the sales of our next generation multimedia communications systems such as Rollingstream™ in China increased to $37.7 million or 13% of total sales, from $25.2 million or 7% of total sales in 2009. We believe that China continues to be one of the largest and most important markets in the world with gross domestic product (GDP) growth averaging more than 9% each year over the past several years, though the growth has slowed during the fourth quarter of 2008 through 2009 with the global downturn in economic activity, and has since returned to more than 9% in 2010. China is currently undergoing an evolution of telecommunications technology. As such, infrastructure spending is expected to transition over the next several years from traditional wireless and wire line technologies to new technologies such as 3G and broadband-based services. While this led to an overall decline in Multimedia Communications revenues by 1% and 45% in 2010 and 2009, respectively, we expect the sales of our next generation multimedia communications systems such as Rollingstream™ to increase in the future.
In 2010, 2009 and 2008, the Zhejiang Province in China accounted for approximately 11%, 10% and 27%, respectively, of net sales within the Multimedia Communications business segment.
Competition
The Multimedia Communications market is marked by intense competition worldwide from numerous global and regional competitors, including some of the world's largest companies. Pricing, payment terms and brand recognition are key considerations for our customers. Specific competitors in this segment include Alcatel-Lucent, Cisco Systems, Inc., Huawei Technologies Co., Ltd., Sonus Networks, Inc., and ZTE Corporation, Inc.
BROADBAND INFRASTRUCTURE BUSINESS UNIT
Product Offerings
Our Broadband Infrastructure products are designed to satisfy customer demand for high speed and cost-effective wireline-based data, voice and multimedia services. Revenues from this segment accounted for approximately 38%, 28%, and 8% of total sales in 2010, 2009 and 2008, respectively. Our wire line technology enables high-speed voice, video and data transmissions over broadband IP-based networks. Our Broadband Infrastructure segment includes digital subscriber line products, multi-service access node products and fiber optics products as well as corresponding service offerings, including technical support services.
Broadband Access Products
We have pioneered several broadband access technologies including IP-based DSLAM and GEPON. With continuous innovation, we have been able to extend our footprint across the globe with broadband access product lines.
11
Multi-Service Access Node
A Multi-Service Access Node ("MSAN") offers a wide range of services including IPTV, High-Speed Internet Access, POTS, ISDN, VoIP, over twisted pair copper and optical fiber. UTStarcom's iAN8K B1000 Multimedia Network Edge is a leading MSAN platform with over 40 million lines installed as of December 31, 2010. iAN8K B1000 offers access-gateway function for NGN Migration application by providing connectivity to existing legacy network and state-of-the-art IP-based voice network. NGN migration is the most important target market for MSAN, which is evolving into a very large global opportunity. iAN8K B1000 also offers IP-based DSLAM function based on ADSL2+ and VDSL2 standards for the still-growing broadband access market. iAN8K B1000 is based on next-generation Gigabit Ethernet architecture, in-line with our commitment to offer end-to-end IP connectivity. We continue to enrich our MSAN product by expanding the MSAN product line—including iAN B1200 which was introduced in 2008. We are continuing to expand this product to have xPON capability to support FTTC applications in 2010. This new product is available in compact form factors and extends the coverage of our iAN8K B1000 MSAN product. iAN B1200 is targeted on FTTB/FTTC applications. iAN B1205 is the first product from this series; it offers very high-density in a small form factor and is well suited for FTTC application. In 2009, we released iAN B1202; this product has smaller form factor and is designed to address FTTB applications.
Digital Subscriber Line Products
Digital subscriber line ("DSL") technology allows high-speed data and content transfer while providing simultaneous telephone communications over the same fixed copper line. Our IP-based DSL Access Multiplexers ("IP-DSLAMs") incorporate the latest DSL technologies combined with a range of form factors to enable high-speed access and to deliver services to residential and commercial subscribers using broadband networks.
Our DSL products include customer premise equipment ("CPE") such as various DSL modems, set-top boxes and voice over the internet devices that allow residential and business customers to access voice, data and video services. Our products are designed to be rich in functionality, simple to set up, easy to install and easy to manage. The diversity and flexibility of our CPE offerings allows them to work with both our own infrastructure equipment as well as with other vendors' infrastructure equipment.
Gigabit Ethernet Passive Optical Network ("GEPON")
In 2004, we introduced our GEPON product. A passive optical network is a system configuration that brings optical fiber all the way to the end user using unpowered optical splitters which enable a single optical fiber to serve multiple premises. Our GEPON platform is designed to provide high subscriber density and low cost of entry, making it a compelling alternative to traditional telephone or broadband solutions.
Our GEPON family includes both the telecommunications provider's central office and CPE which handle speeds of up to one Gigabit per second of bandwidth to residential and business customers. By integrating more functionality into the product, we have eliminated the need for carriers to deploy additional switching and routing equipment.
In 2010, with the introduction of GEPON+ EOC products, we can provide a high-speed broadband access solution for cable market. This allows cable operators to provide voice, data services to existing CATV subscribers by utilizing last mile cable access infrastructure.
12
Optical Transport Products
Our optical products include transport products based upon internationally defined optical transmission standards and access products. Our products convert and translate data, video, voice or other traffic into an optical signal that is transmitted over glass fiber. The product platform includes a multi-service management system that simultaneously processes multiple speeds ranging from 155 Megabits per second for traditional voice service to 40 Gigabits per second for data intensive services.
Packet Optical Transport Networks ("PTN")
In October 2009, we announced the debut of our expanded NetRing™ Transport Network product portfolio (NetRing™ TN), which includes new multiprotocol label switching—transport profile (MPLS-TP) solutions specifically designed to overhaul existing mobile backhaul networks, provide Ethernet services and deliver broadband aggregation applications in significantly improved efficiency, capacity, flexibility.
Our NetRing™ TN packet-based optical transport system is based on the latest MPLS-TP technology pre-standard being jointly defined by ITU-T and IETF. It is highly flexible, reliable, scalable and cost-effective and can be deployed for key applications such as carrier mobile backhaul, metro Ethernet services for enterprise and DSLAM and X-version of passive optical network aggregation. It is capable of carrying time division multiplexing (TDM), asynchronous transfer mode, synchronous digital hierarchy/synchronous optical network and Ethernet seamlessly over a reliable and scalable network, with resiliency at par with TDM networks. It also enables legacy enterprise services over Ethernet, providing 'wholesale' connectivity and an alternative for leased lines.
Multi-Service Transport Platform ("MSTP")
We introduced our NetRing™ MSTP optical product line in December 2003. While our GEPON product is designed to provide services to individual customers, our NetRing™ products are designed for the high bandwidth needs of a service area. Our NetRing™ 600 products provide voice and data services for multi- tenant buildings, office buildings and enterprise campus applications. Our mid-range NetRing™ 2500 products offer voice and data transport when more bandwidth and greater capacity is required. Our high-end NetRing™ 10000 products provide service for regional transport applications, when maximum bandwidth and capacity is required. In each application, the optical fiber is looped through the service area and connected back upon itself, providing full redundancy in the event that the fiber is severed. NetRing™ provides a broad range of functions for carriers to manage voice, data and video traffic with network management functions previously available only on multiple, independent platforms. In late 2008, we introduced our new state-of-art 40G product—NetRing™ 40K which has been successfully deployed to certain key customers.
Resilient Packet Ring ("RPR")
In late 2007, we introduced our first Metro Ethernet product, which is MEF certified and uses RPR as the core technology for transport. This product is targeted for metro aggregation function. It is widely deployed in Bharat Sanchar Nigam Ltd.'s ("BSNL") multi-play network, for which we are turn-key providers and also have large deployment of IP-based DSLAM.
Markets and Customers
Our key target markets for 2010 for the deployment of our Broadband Infrastructure products are China, India and other Asia Pacific regions. We believe these markets provide a significant amount of opportunity going forward given their relatively low broadband penetration rates and strong consumer demand for new broadband services. Data from China's State Administration of Radio, Film and Television, which is the key regulator of this industry in China, indicate that in China as of December
13
2010 there were187 million households with cable TV, an increase of 6.9% from 2009; 88 million with digital cable TV, a 39% increase from the previous year, while nearly half of this group, or 43.5 million, have completed the two-way digital migration. Also, there were 4.1 million interactive digital cable TV household subscribers and 6.7million IPTV subscribers.
According to the India Statistics' official report, India's current population is approximately 1.2 billion . And according to the Telecom Regulatory Authority of India, as of December 31, 2010, India's teledensity (the number of phone lines per 100 persons) is only at approximately 66% compared to more than 100% teledensity in the U.S.. We currently offer our MSAN, IPDSLAM, IPTV, MSTP and GEPON, as well as a host of products and services in India. With over one million access lines deployed today, we anticipate that we will continue to implement and deploy our products and conduct trials with several operators, including Reliance Infocomm Ltd. and Bharat Sanchar Nigam Ltd.
In 2010, we launched EPON fiber access projects in 10 regional cable markets in China. We also were approved as a qualified EPON supplier for China State Grid Company. In 2009, we won repeat business from our key broadband infrastructure customers, including in India with Bharti and BSNL, in Israel with Bezeq, in Japan with Softbank and in Taiwan with Chung-Hwa Telecom.
Competition
The Broadband Infrastructure market is subject to intense competition worldwide from numerous global and regional competitors, including some of the world's largest companies. These companies leverage pricing, payment terms and their pre-existing customer relationships. Specific competitors in this segment include Alcatel-Lucent, ECI Telecom, Huawei Technologies Co., Ltd., Nokia Siemens Networks, Inc. and ZTE Corporation, Inc.
HANDSETS BUSINESS UNIT
We previously designed, built and sold consumer handset devices that allowed customers to access wireless services. The Handsets segment included all handset revenues within China which was comprised mainly of PAS, CDMA and TD-SCDMA handsets. Prior to the disposition of PCD in July 2008, sales of our Korea based handset operations were accounted for as intercompany sales. Subsequent to the disposition of PCD, sales of our Korea based handset operations to PCD LLC were included in the Handsets business unit. In December 2008, we initiated actions to wind down our Korea based handset operations and accordingly substantially exited the business of sales to PCD LLC by the end of the fourth quarter of 2009. In October 2009, we decided to wind down and discontinue the remaining China handset business. Our Handsets business accounted for approximately 2%, 26% and 18% of revenues in 2010, 2009 and 2008, respectively. Revenue from our handset business will be derived from clearing of remaining handset inventory and is not expected to be significant in 2011.
PERSONAL COMMUNICATIONS DIVISION
We acquired the Personal Communications Division ("PCD") from Audiovox Corporation in November 2004. Revenues from this segment represented approximately 54% of our total net sales in 2008. Verizon Wireless and Sprint Spectrum L.P. accounted for approximately 20% and 12%, respectively, of total net sales in 2008. On July 1, 2008, we sold PCD to Personal Communications Devices, LLC ("PCD LLC"). Concurrent with the closing of the sale transaction, we entered into a three-year supply agreement with PCD LLC whereby we intended to supply handset products to PCD LLC. In connection with the wind-down of our Korea based handset operations, in December 2008, we furnished PCD LLC with 180-day's notice of termination of the supply agreement. Due to the continuing direct cash flows pursuant to the supply agreement beyond the one-year assessment period starting from the date of sale, the sale of the PCD assets did not meet the criteria for discontinued operations presentation. We also performed reassessment and concluded assessment period for
14
discontinued operations presentation was not required to extend beyond the one-year period following the disposition of PCD.
OTHER BUSINESS SEGMENT
Included in our Other segment were MSBU and CSBU. On July 31, 2008, we sold MSBU which was responsible for the development, sales and service of our wireless IPCDMA/IPGSM product line. CSBU was responsible for the development, sales and service of other non-core products such as IP messaging, transaction gateways, and Remote Access Server ("RAS") which enables users to access network data and services from remote locations and our Packet Data Services Node ("PDSN") product line which connects CDMA cellular network infrastructure equipment to IP networks. In the first quarter of 2009, we completed the wind-down of CSBU and the consolidation of voice messaging technology into our Multimedia Communications segment.
OPERATIONS
Employees
As of December 31, 2010, we had approximately 1,900 full-time employees worldwide including approximately 1,700 employees located in China. From time to time, we also employ part-time employees and hire contractors. Of the total number of full-time employees at December 31, 2010, approximately 1,000 were in research and development, approximately 300 were in manufacturing, approximately 400 were in marketing, sales and support, and approximately 200 were in administration. Our employees are not represented by any collective bargaining agreement and we have never experienced a work stoppage. We believe that we have good employee relations.
Sales, Marketing and Customer Support
We pursue a direct sales and marketing strategy in China, targeting sales to telecommunications operators and equipment distributors with closely associated customers. We maintain sales and customer support sites in all major cities in China. Our customer service operation in Hangzhou, China, serves as both a technical resource and liaison to our product development organization. In China, customer service technicians are distributed in the regional sales and customer support sites to provide a local presence.
Across the rest of Asia, Latin America and Europe, we have a combined approach that uses direct sales, original equipment manufacturers, distributors, resellers, agents and licensees.
We maintain sales and customer support offices in several countries covering the U.S., Europe, India and the Asia-Pacific regions.
Manufacturing, Assembly and Testing
The manufacturing operations consist of circuit board assembly, final system assembly, software installation and testing. We assembled circuit boards primarily using surface mount technology. Assembled boards were individually tested prior to final assembly and tested again at the system level prior to system shipment. We used internally developed functional and parametric tests for quality management and process control and have developed an internal system to track quality statistics at a serial number level. System final testing and packaging were conducted at our own facilities as well as contracted to third parties.
In June 2009, we announced our intention to outsource our manufacturing operations. In January 2010, we finalized the selection of an outsource partner and began the transition toward outsourcing our manufacturing operations. During 2010, we transferred the production and testing of mSwitch, MSAN and IPTV circuit boards to a contract manufacturer gradually shifting to a variable cost business
15
model, but we continued to manufacture, assemble and test our MSTP and PTN products as well as performing system integration testing at our ISO 9001-2000 and ISO 14000 certified manufacturing facility in the Chinese province of Zhejiang.
Research and Development
We believe it is essential to continue to develop and introduce new and enhanced products if we are to maintain our competitive position. While we use competitive analyses and technology trends as factors in our product development plans, the primary input for new products and product enhancements comes from soliciting and analyzing information about service providers' needs. Our relationships with China's Ministry of Industry and Information Technology and Telecommunications Administration ("MIIT") and individual telecommunications bureaus and our full-service post-sale customer support in China provide our research and development organization with insight into trends and developments in the marketplace. The insights provided from these relationships allow us to develop market-driven products such as MSAN, IPTV and TN. We have been able to cost-effectively hire highly skilled technical employees from a large pool of qualified candidates in China. We also have a development center in India to take advantage of the talent pool available there, and to support our operations in India. Our research and development centers are ISO 9001-2000 certified.
In the past we have made, and expect to continue to make, significant investments in research and development. Our research and development expenditures totaled $38.0 million in 2010, $63.2 million in 2009 and $143.3 million in 2008. The decrease in R&D expenditures is primarily due to reduced spending in non-core business units and cost reductions resulting from streamlined operations.
Intellectual Property
Our ability to compete depends in part on our proprietary technology. We rely on a combination of patent, copyright, trademark and trade secret laws, as well as confidentiality agreements and licensing arrangements, to establish and protect our proprietary rights. In addition, we have, from time to time, chosen to abandon previously filed applications. Patents may not be issued and any patents issued may not cover the scope of the claims sought in the applications. Additionally, issued patents may be found to be invalid or unenforceable in the courts of those countries where we hold or have filed for such patents or patent applications. Our U.S. patents do not afford any intellectual property protection in China or other international jurisdictions. Additionally, patents that we hold in countries other than the United States do not afford any intellectual property protection in the United States. Please refer to the discussion of risks associated with our intellectual property in "Item 1A—Risk Factors—Factors Affecting Future Operating Results."
Seasonality
Although we experience some seasonality typical of the telecommunications industry, such as seasonally weak first quarters, our revenues and earnings have not demonstrated consistent seasonal characteristics. In contrast, our results of operation are generally impacted more significantly by factors such as customer concentration and the timing of revenue recognition.
PROPOSED REORGANIZATION
On January 10, 2011, we announced a proposed reorganization to change our place of incorporation from Delaware to the Cayman Islands. The reorganization is expected to involve UTStarcom's merger with a newly formed subsidiary, as a result of which we will become a wholly owned subsidiary of a Cayman Islands holding company ("UTStarcom Cayman"). It is expected that each outstanding share of common stock of the Company will be converted into the right to receive one ordinary share of UTStarcom Cayman, which will be issued by UTStarcom Cayman in connection
16
with the merger pursuant to a registered offering. Following the merger, UTStarcom Cayman, together with its subsidiaries, is expected to own and continue to conduct UTStarcom's business in substantially the same manner as is currently being conducted by UTStarcom and its subsidiaries. While UTStarcom Cayman will be taxed as a United States corporation, it is expected to qualify as a foreign private issuer for purposes of its reporting obligations with the SEC, which we expect will reduce our compliance operating costs. The shares of UTStarcom Cayman are expected to be listed on the NASDAQ Stock Market.
EXECUTIVE OFFICERS OF THE REGISTRANT
Our current executive officers, and their ages as of December 31, 2010, are as follows:
Name
|
Age | Position | |||
|---|---|---|---|---|---|
| Ying (Jack) Lu | 47 | Chief Executive Officer and President | |||
| Edmond Cheng | 49 | Senior Vice President and Chief Financial Officer | |||
Our executive officers are appointed by, and serve at the discretion of, our board of directors. Each executive officer is a full-time employee. There is no family relationship between any of our executive officers or directors.
Ying (Jack) Lu has served as our Senior Vice President and Chief Operating Officer since March 2010. Mr. Lu was appointed our Chief Executive Officer and President effective September 7, 2010. From August 2008 until joining UTStarcom, Mr. Lu worked as an entrepreneur seeking to establish a Renminbi denominated investment fund to invest in high technology companies in southwest China. From July 2007 to July 2008, Mr. Lu served as Global Co-Chief Operating Officer and General Manager of China Operations for Source Photonics, Inc., an optoelectronics components company. From September 2001 until June 2007, he served in a number of senior management positions, including most recently as President and Chief Executive Officer from January 2007 to June 2007 and Chief Operating Officer from June 2006 to December 2006, with Fiberxon Inc., an optical telecom components company, which was acquired by MRV Communications Inc., a communications equipment and services company, in July 2007. From 2000 until 2001, Mr. Lu served as Director of Business Strategy Development for US Business Networks Inc. (MeetChina.com), a business-to-business portal provider. From 1988 to 1998, Mr. Lu served in a number of management positions with China National Technical Import and Export Corporation ("CNTIC"), an import/export, manufacturing and consulting firm. Mr. Lu received a B.S. in Electrical Engineering from Huazhong University of Science and Technology in China and holds an M.B.A. from the University of Southern California.
Edmond Cheng has served as our Senior Vice President and Chief Financial Officer since May 2010. Immediately prior to joining us, Mr. Cheng served as Chief Financial Officer of Changsha Zoomlion—Science & Technology Development Company, Ltd., a public company dual listed in the People's Republic China and Hong Kong, from January 2009 to April 2010. From January 2007 to August 2008, Mr. Cheng served as Group Chief Financial Officer at PSA International PTE LTD. From April 2005 to May 2006, Mr. Cheng served as Chief Financial Officer of Titan Petrochemicals Group Limited, a Hong Kong listed company. From November 2000 to March 2005, he served as Vice President and Chief Financial Officer at Ingram Micro, Inc., a NYSE listed company. Prior to joining Ingram Micro, Mr. Cheng served as Vice President, Finance and Administration at Mallinckrodt Medical, Inc., a NYSE listed company, from January 1999 to October 2000. From October 1994 to December 1998, he served as director of Finance, ASEAN and South Asia at Hewlett-Packard Company. Prior to moving to Singapore in 1994, he spent 10 years in the US and held various finance positions at several companies including GTE Corporation, Compaq Computer Corporation and Applied Materials. Mr. Cheng holds a master's degree in Accounting and a bachelor's degree in Business Administration from University of Hawaii at Manoa.
17
FACTORS AFFECTING FUTURE OPERATING RESULTS
RISKS RELATED TO OUR BUSINESS
We continue to experience operating losses and may not have sufficient liquidity to execute our business plan or to continue our operations without obtaining additional funding or selling additional securities. Our ability to obtain additional funding or obtain them under commercially reasonable terms is not assured and we may not be able to issue additional securities.
We reported net losses attributable to UTStarcom, Inc. of $65.1 million, $225.7 million and $150.3 million for the years ended December 31, 2010, 2009 and 2008, respectively. At December 31, 2010 we had an accumulated deficit of $1,132.3 million and used $92.2 million of cash in operations during the year ended December 31, 2010.
Management has partially implemented its liquidity plan through the payment in March 2008 of $289.5 million to retire our convertible subordinated notes and related accrued interest, the sale of UTStarcom Personal Communications LLC, or PCD, on July 1, 2008 and the sale of our facility in Hangzhou, China for approximately $138.8 million (see Notes 3, 6 and 7 of Notes to our Consolidated Financial Statements, included under Part II, Item 8 of this Annual Report on Form 10-K). In addition, in the second quarter of 2010, we entered into two credit facilities totaling $29.4 million. Both credit facilities can be used for the issuance of certain letters of credit and guarantees and both facilities expire in the second quarter of 2011. As a result, management believes we will have sufficient liquidity to finance our 2011 anticipated operations and capital expenditure requirements, as well as achieve projected cash collections from customers and contain expenses and cash used in operations. However, achievement of such operating performance is not assured and management expects to continue to implement its liquidity plans, which includes reducing operating expenses. If we cannot successfully implement our liquidity plans, it may be necessary for us to make significant changes to our business plan in order to maintain adequate liquidity. In addition, various other matters may impact our liquidity such as:
- •
- inability to achieve planned operating results that could increase liquidity requirements beyond those considered in our
business plan;
- •
- changes in financial market conditions or our business condition that could limit our access to existing credit facilities
or make new financings more costly or even unfeasible;
- •
- changes in China's currency exchange control regulations that could limit our ability to access cash in China to meet
liquidity requirements for our operations in China or elsewhere; and
- •
- difficulties in performing finance and other key functions, as a result of our elimination of functional duplication during 2010 through the consolidation of a number of such functions into our China operations, which could adversely affect cash collections and liquidity.
Although management has developed liquidity plans, we may have difficulty maintaining existing relationships, or developing new relationships, with suppliers or vendors as a result of our financial condition. Our suppliers or vendors could choose to provide supplies or services to us on more stringent payment terms than those currently in place, such as by requiring advance payment or payment upon delivery of such supplies or services, which would have an adverse impact on our short-term cash flows. As a result, our ability to retain current customers, attract new customers and maintain contracts that are critical to our operations may be adversely affected.
If we cannot meet our liquidity needs through improved operating results, we may need to obtain additional financing from financial institutions. However, we cannot be assured that we will be able to obtain loans or obtain them under commercially reasonable terms. We may also have to sell additional
18
securities to meet our liquidity needs, but our ability to sell our securities is not assured. In addition, any additional issuance of securities would dilute the ownership of our stockholders.
Our cost-reduction initiatives and restructuring plans may not result in anticipated savings or more efficient operations. Our restructuring may disrupt our operations and adversely affect our operations and financial results.
On June 11, 2009, we announced a restructuring of our worldwide operations in an effort to accelerate our return to profitability, strategically align our cost structure with expected revenues and reallocate resources into areas of our business that we believe have more growth potential. Throughout 2010, we continued to execute our restructuring strategies. We may not be able to successfully complete and realize the expected benefits of our restructuring plans. Our restructuring plans may involve higher costs or a longer timetable, or they may fail to improve our results of operations and cash flows as we anticipate. Our inability to realize these benefits may result in an ineffective business structure that could negatively impact our results of operations. In addition to costs related to severance and other employee-related costs, our restructuring plans may also subject us to litigation risks and expenses.
Our restructuring plans may have other adverse consequences, such as employee attrition beyond our planned reduction in workforce, the loss of employees with valuable knowledge or expertise, a negative impact on employee morale, or a gain in competitive advantage by our competitors over us. The restructuring may place increased demands on our personnel and could adversely affect our ability to attract and retain talent, to develop and enhance our products and services, to service existing customers, to achieve our sales and marketing objectives and to perform our accounting, finance and administrative functions.
We may undertake future cost-reduction initiatives and restructuring plans that may adversely impact our operations; and we may not realize all of the anticipated benefits of our prior or any future restructurings.
Market turmoil may negatively impact our business.
Disruptions in orderly financial markets, resulting from, among other factors, severely diminished liquidity and credit availability plus volatile and declining valuations of securities and other investments, have caused business and consumer confidence to ebb, business activities to slowdown, and unemployment to increase. These factors along with the interconnectivity and interdependency of international economies have created a global downturn in economic activity.
We are unable to predict how long the economic downturn will last. A continuing economic downturn may adversely impact our business in a number of ways, such as:
- •
- Reduced demand for our products and
services. In a period of economic uncertainty customers may adopt a strategy of deferring purchases to upgrade existing systems or to
deploy new systems until later periods when the recoverability of their investment becomes more assured. In addition, customers who must finance their capital expenditures by issuance of debt or
equity securities may find the securities markets unavailable to them.
- •
- Increased pricing pressure and lower margins. Our competitors include a number of global enterprises with relatively greater size in terms of revenues, working capital, financial resources and number of employees, and our customers are telecommunication service providers who typically are owned, controlled, or sponsored by governments. If the size of our potential markets contract due to the global economic downturn, competition for available contracts may become more intense which could require us to offer or accept pricing, payment, or local content terms which are less favorable to remain competitive. In some cases we might be
19
- •
- Greater difficulty in collecting accounts
receivable. Many of our telecommunication carrier customers are either owned or controlled by governments and any changes in such
governments' policies concerning the authorization or funding of payments for capital expenditures could lengthen our cash collection cycle and thereby cause our liquidity to deteriorate.
Additionally, while the vast majority of our net sales are to such large, well capitalized telecommunication carriers, some sales are made to distributors or other customers whose financial resources
may be more subject to rapid decline, which could expose us to losing sales, delaying revenue recognition or accepting greater collection risks due to credit quality issues.
- •
- Greater difficulty in obtaining purchased goods and
services. We expect that many of our suppliers will face the same or more challenging circumstances as we face in the current economic
downturn, which could result in an adverse effect on our cash flows and liquidity. Some suppliers or vendors could choose to provide supplies or services to us on more stringent payment terms than
those currently in place, such as by requiring advance payment or payment upon delivery of such supplies or services. Additionally, some suppliers might experience a worsening financial condition
causing them to either withdraw from the market or be unable to meet our expected timing for the receipt of goods ordered from them, either of which condition in turn could adversely affect our
ability to serve our customers and lengthen the cycle time for transforming customer orders into cash receipts. Additionally if it is necessary to seek alternative sources of supply, the effects on
our costs, cycle time for cash collections, and customer satisfaction with our Company are uncertain.
- •
- Additional restructuring and asset impairment charges. If we are unable to generate the level of new contract bookings, revenues, and cash flow contemplated by our business plan, management will be forced to take further action to focus our business activities and align our cost structure with anticipated revenues. These actions, if necessary, could result in additional restructuring charges and/or asset impairment charges being recognized in 2011 and beyond.
unwilling or unable to compete for business where competitive pressures make a potential opportunity unprofitable to us.
Changes in our management may cause uncertainty in, or be disruptive to, our business. Certain of our directors and management team members have been with us in those capacities for only a short time.
We experienced significant changes in our management and our Board of Directors in recent times. For example, our Chief Financial Officer was appointed as such in May 2010 and we appointed our Chief Operating Officer as our Chief Executive Officer and President in September 2010. Additionally, three directors resigned and five new directors were added to our Board of Directors since September 2010. Although we have endeavored to implement any director and management transition in as non-disruptive a manner as possible, any such transition might impact our business, and give rise to uncertainty among our customers, investors, vendors, employees and others concerning our future direction and performance. This could adversely affect our business, financial condition, results of operations and cash flows, and our ability to execute our business model could be impaired.
In addition, because we have members of management and our Board of Directors serving in their capacity as such for only a short duration, we face the additional risks that these persons:
- •
- have limited familiarity with our past practices;
- •
- lack experience in communicating effectively within the team and with other employees;
- •
- lack settled areas of responsibility; and
- •
- lack an established track record in managing our business strategy.
20
Our overall financial performance continues to depend in large part upon our China subsidiaries.
Approximately 57% of our sales were generated in China in 2010, as compared to approximately 46% and 27% of our sales in 2009 and 2008, respectively. Subsequent to the divestiture of PCD in July 2008, China now accounts for a larger portion of our overall sales. We have made substantial investments in China and, therefore, our business, financial condition and results of operations are to a significant degree subject to economic, political, legal and social developments and other events in China. If our business in China declines, our financial condition, results of operations and cash flows may be significantly harmed. See Part I, Item 1A entitled "Risk Factors—Risks Relating to Conducting Business in China" of this Annual Report on Form 10-K.
We may be unable or unwilling to accept additional purchase orders from existing clients, which could damage our relationships with such clients and lead to legal and financial consequences which could harm our business.
Due to liquidity constraints or other strategic factors, we may from time to time be unable or unwilling to accept additional purchase orders from existing clients. If an existing customer places a purchase order with us that we then refuse to accept, our relationship with such customer may be harmed. Moreover, any refusal or inability by us to accept additional purchase orders may result in legal claims by our customers, reduced collections from previous purchase orders and financial penalties, which could distract our management and harm our business. Certain of our contracts have significant performance bank guarantees that, subject to the terms in the contracts, may be paid to the customer in the event of a default by us in addition to any other remedies it may have.
Any failure by us to successfully transition certain functions to China may lead to increased costs and adversely affect our business.
We recently transitioned certain key functions, including headquarters and finance, to China in order to eliminate functional duplication and reduce operating expenses. The transition is a critical part of our plan to achieve profitability and maintain liquidity. We may experience a higher than typical rate of employee turnover as a result of this transition and a decrease in employee morale. If we fail to attract, hire, assimilate or retain qualified personnel in China, the transitioned functions may be negatively impacted. Cash collections and liquidity may be adversely affected if we have difficulties performing finance functions going forward after the transition. Information and data that we rely on may be subject to risk of loss in connection with the transition. If we are not successful in this initiative, we may not achieve the expected benefits despite having expended significant capital and human effort.
Adverse resolution of pending civil litigation may harm our operating results or financial condition.
We are a party to lawsuits in the normal course of our business. This litigation is, and any future additional litigation could be, time consuming and expensive, could divert our management's attention away from our regular business, and if any one of these lawsuits is adversely resolved against us, could have a material adverse effect on our financial condition and liquidity. Moreover, the results of complex legal proceedings are difficult to predict. For additional information regarding certain of the matters in which we are involved, see Part I, Item 3 entitled "Legal Proceedings" of this Annual Report on Form 10-K.
21
Our future product sales are unpredictable and, as a result, our operating results are likely to fluctuate from quarter to quarter.
Our quarterly and annual operating results have fluctuated in the past and are likely to fluctuate in the future due to a variety of factors, some of which are outside of our control. Factors that may affect our future operating results include:
- •
- the timing and size of the orders for our products;
- •
- consumer acceptance of new products we may introduce to market;
- •
- changes in the growth rate of customer purchases of communications services;
- •
- the lengthy and unpredictable sales cycles associated with sales of our products;
- •
- revenue recognition, which is based primarily on customer acceptance of delivered products, is unpredictable;
- •
- cancellation, deferment or delay in implementation of large contracts;
- •
- quality issues resulting from the design or manufacture of the products, or from the software used in the product;
- •
- cash collection cycles in China and other emerging markets;
- •
- reliance on product, software and component suppliers who may constitute a sole source of supply or may have going concern
issues;
- •
- the decline in business activity we typically experience during the Chinese Lunar New Year, which leads to decreased sales
and collections during our first fiscal quarter;
- •
- issues that might arise from divestiture of non-core assets or operations or the integration of acquired
entities and the inability to achieve expected results from such divestitures or acquisitions;
- •
- shifts in our product mix or market focus; and
- •
- availability of adequate liquidity to implement our business plan.
As a result of these and other factors, period-to-period comparisons of our operating results are not necessarily meaningful or indicative of future performance. In addition, the factors noted above may make it difficult for us to forecast our future financial performance. Furthermore, it is possible that in some future quarters our operating results will fall below our internal forecasts, public guidance or the expectations of securities analysts or investors. If this occurs, the trading price of our common stock could decline.
Competition in our markets may lead to reduced prices, revenues and market share.
We face intense competition, and will continue to face intense competition, from both domestic and international companies in our target markets, many of which may operate under lower cost structures and have much larger sales forces than we do. Additionally, other companies not presently offering competing products may also enter our target markets. Many of our competitors have significantly greater financial, technical, product development, sales, marketing and other resources than we do. As a result, our competitors may be able to respond more quickly to new or emerging technologies and changes in service provider requirements. Our competitors may also be able to devote greater resources than we can to the development, promotion and sale of new products. These competitors may be able to offer significant financing arrangements to service providers, which may give them a competitive advantage in selling systems to service providers with limited financial resources. In many of the developing markets in which we operate or intend to operate, relationships
22
with local governmental telecommunications agencies are important to establish and maintain through permissible means. In many such markets, our competitors may have or be able to establish better relationships with local governmental telecommunications agencies than we have, which could result in their ability to influence governmental policy formation and interpretation to their advantage. Additionally, our competitors might have better relationships with their third party suppliers and obtain component parts at reduced rates, allowing them to offer their end products at reduced prices. Moreover, the telecommunications and data transmission industries have experienced significant consolidation, and we expect this trend to continue. If we have fewer significant customers, we may be more reliant on such large customers and our bargaining position and profit margins may suffer.
Increased competition is likely to result in price reductions, reduced gross profit as a percentage of net sales and loss of market share, any one of which could materially harm our business, cash flows and financial condition if extended losses were incurred. In order to be competitive, we must continually reduce the cost of manufacturing our products through design and engineering changes and other cost control measures. We may not be successful in these efforts or in delivering our products to market in a timely manner. In addition, any redesign may not result in sufficient cost reductions to allow us to reduce the prices of our products to remain competitive or to improve or maintain our gross profit as a percentage of net sales, which would cause our financial results to suffer.
To meet competitive offerings we may accept contracts with low profitability or even enter into contracts with anticipated losses if we believe it is necessary to establish a relationship with a customer or a presence in a market that we consider important to our strategy. Accepting a contract with an anticipated loss requires us to recognize a provision for the entire loss in the period in which it becomes evident rather than in later periods in which contract performance occurs. Accepting contracts with low gross margins adversely affects our reported results when the revenues from such contracts are recognized; in some cases revenue recognition must be deferred until all revenue recognition criteria have been met, and this would result in recognizing the adverse effects of low gross margin contracts in periods subsequent to when contract performance occurred.
The average selling prices of our products may decrease, which may reduce our revenues and our gross profit.
The average selling prices for communications access and switching systems and handsets have historically declined as a result of a number of factors, including:
- •
- increased competition;
- •
- aggressive price reductions by competitors;
- •
- rapid technological change; and
- •
- constant change in customer buying behavior and market trends.
The average selling prices of our products may continue to decrease in the future in response to product introductions by us or our competitors or other factors, including price pressures from customers. Certain of our products, including wireless handsets, historically have had low gross profit margins, and any further deterioration of our profit margins on such products could result in losses with respect to such products. Therefore, we must continue to develop, source and introduce new products and enhancements to existing products that incorporate features that can be sold at higher average selling prices. Failure to do so, or the failure of consumers or our direct customers to accept such new products, could cause our revenues and gross profit to decline.
23
Our market is subject to rapid technological change, and to compete effectively, we must continually introduce new products and product enhancements that achieve market acceptance.
The market for communications equipment is characterized by rapid technological developments, frequent new product introductions, changes in consumer preferences and evolving industry and regulatory standards. Our success will depend in large part on our ability to enhance our technologies and develop and introduce new products and product enhancements that anticipate changing service provider requirements, technological developments and evolving consumer preferences. We may need to make substantial capital expenditures and incur significant research and development costs to develop and introduce new products and enhancements. If we fail to develop and introduce new products or enhancements to existing products that effectively respond to technological change on a timely basis, our business, financial condition and results of operations could be materially adversely affected. Certain of our products have a short product life. Moreover, from time to time, our competitors or we may announce new products or product enhancements, technologies or services that have the potential to replace or shorten the life cycles of our products and that may cause customers to defer purchasing our existing products, resulting in charges for inventory obsolescence reserves. Future technological advances in the communications industry may diminish or inhibit market acceptance of our existing or future products or render our products obsolete. Even if we are able to develop and introduce new products, they may not gain market acceptance. Market acceptance of our products will depend on various factors, including:
- •
- our ability to obtain necessary approvals from regulatory organizations within the countries in which we operate and for
any new technologies that we introduce;
- •
- the length of time it takes service providers to evaluate our products, causing the timing of purchases to be
unpredictable;
- •
- the compatibility of our products with legacy technologies and standards existing in previously deployed network
equipment;
- •
- our ability to attract customers who may have pre-existing relationships with our competitors;
- •
- product pricing relative to performance;
- •
- the level of customer service available to support new products; and
- •
- the timing of new product introductions meeting demand patterns.
If our products fail to obtain market acceptance in a timely manner, our business and results of operations could suffer.
We depend on a third party contract manufacturer for the manufacture and supply of our products. If we cannot secure from our contract manufacturer timely delivery of our products, high quality manufacture, or competitive prices, or if our contract manufacturer ceases to exist, then our competitive position, reputation and business could be harmed.
On January 23, 2010, we, through our wholly owned subsidiary, UTStarcom Telecom Co., Ltd. signed a Manufacturing Agreement with a contract manufacturer, effective as of December 31, 2009. The Manufacturing Agreement has an initial term of one year, with automatic renewals of one year terms unless notice is provided 90 days prior to the end of the then-current term. The Manufacturing Agreement may be terminated for cause and either party may terminate the agreement for convenience with prior notice of six months. Under the Manufacturing Agreement, the contract manufacturer provides full electronics manufacturing services, including manufacturing, assembly and support, for our broadband, IPTV and NGN solutions products previously manufactured through our Hangzhou, China facility. The contract manufacturer also provides new product introduction support, material sourcing and procurement, printed circuit board assembly, system integration and testing, final pack-out and
24
delivery of products under the Manufacturing Agreement. There is no minimum annual requirement under the terms of the Manufacturing Agreement; however, we are required to provide a four month rolling forecast and we are obligated to purchase one of the four month rolling forecast. For the remaining three months of the then-current four month rolling forecast, we are obligated to pay for any components on our bill of materials ordered, which are not passive components and are non-cancellable, and we may also be obligated to buy back excess inventory and obsolete inventory.
Our growth and ability to meet customer demands depends in part on our ability to obtain timely deliveries of quality products from our contract manufacturers. The fact that we do not own or operate the bulk of our manufacturing facilities and that we are reliant on our contract manufacturer could have an adverse impact on the supply of our products and on our business and operating results, and subjects us to the following risks:
- •
- failure to receive timely delivery of our products could cause delay in our ability to timely fulfill customer orders;
- •
- failure to receive good quality products from our contract manufacturer could affect our ability to fulfill customer
orders and damage our relationship with our customers;
- •
- failure to estimate customer demand and properly place product orders could result in excess inventory or insufficient
inventory;
- •
- any financial problems of either our contract manufacturer or their component suppliers could either limit the products we
receive or increase our costs;
- •
- reservation of manufacturing capacity at our contract manufacturer by other companies could either limit supply or
increase costs; and
- •
- we are otherwise unable to realize the efficiencies anticipated when we decided to outsource our manufacturing.
Supply chain issues, including financial problems of our contract manufacturer or their component suppliers, or a shortage of adequate component supply or manufacturing capacity could increase our costs or cause a delay in our ability to fulfill orders and have an impact on our customers, could have an adverse affect on our business and operating results and gross margins. A reduction or interruption in supply; a significant increase in the price of one or more components; a failure to adequately authorize procurement of inventory by our contract manufacturer; a failure to appropriately cancel, reschedule, or adjust our requirements based on our business needs; or a decrease in demand for our products could materially adversely affect our business, operating results, and financial condition and could materially damage customer relationships. If our contract manufacturer ceases to do business, our revenue and gross margins could suffer until another contract manufacturing source can be developed. Our operating results could also be adversely affected if, anticipating greater demand than actually develops, we commit to the purchase of more products than we need, or if we fail to estimate adequate customer demand, resulting in a lack of products to sell to customers, either of which is more likely to occur in a period of demand uncertainties such as we are currently experiencing. We may not be able to diversify sources in a timely manner, which could harm our ability to deliver products to customers and seriously impact present and future sales.
We purchase certain key components and materials used in our products from authorized distributors of sole source suppliers. If we cannot secure adequate supplies of high quality products at competitive prices or in a timely manner, our competitive position, reputation and business could be harmed.
We purchase certain key components and materials, such as chipsets, used in our products from authorized distributors of sole source suppliers. We do not have direct contractual arrangements with the sole source suppliers of chipsets used in our products. If we are unable to obtain high-quality
25
components and materials in the quantities required and at the costs specified by us, we may not be able to find alternative sources on favorable terms, in a timely manner, or at all. Our inability to obtain or to develop alternative sources if and as required could result in delays or reductions in manufacturing or product shipments. From time to time, there could be shortages of certain products or components. Moreover, the components and materials we purchase may be inferior quality products. If an inferior product supplied by a third party is embedded in our end product and causes a problem, it might be difficult to identify the source of the problem as being due to the component parts. If any of these events occur, our competitive position, reputation and business could suffer.
Our ability to source a sufficient quantity of high-quality, cost-effective components used in our products may also be limited by import restrictions and duties in the foreign countries in which we manufacture our products. We require a significant number of imported components to manufacture our products, and imported electronic components and other imported goods used in the operation of our business may be limited by a variety of permit requirements, approval procedures, patent infringement claims, import duties and licensing requirements. Moreover, import duties on such components increase the cost of our products and may make them less competitive.
Our multinational operations strain our resources and subject us to various economic, political, regulatory and legal risks.
We market and sell our products globally. Our existing multinational operations require significant management attention and financial resources. To continue to manage our global business, we will need to take various actions, including:
- •
- enhancing management information systems, including forecasting procedures;
- •
- further developing our operating, administrative, financial and accounting systems and controls;
- •
- managing our working capital and sources of financing;
- •
- maintaining close coordination among our engineering, accounting, finance, marketing, sales and operations organizations;
- •
- successfully consolidating a number of functions in China to eliminate functional duplication;
- •
- retaining, training and managing our employee base;
- •
- reorganizing our business structure to more effectively allocate and utilize our internal resources;
- •
- improving and sustaining our supply chain capability; and
- •
- managing both our direct and indirect sales channels in a cost-efficient and competitive manner.
If we fail to implement or improve systems or controls or to manage any future growth and transformation effectively, our business could suffer.
Furthermore, multinational operations are subject to a variety of risks, such as:
- •
- the complexity of complying with a variety of foreign laws and regulations in each of the jurisdictions in which we
operate;
- •
- the complexity of complying with anti-corruption laws in each of the jurisdictions in which we operate. These include United States regulations for foreign operations, such as the Foreign Corrupt Practices Act, as well as the anti-bribery and anti corruption laws of China and India where we conduct substantial operations. There is rigorous enforcement of anti corruption laws in the United States and in China, the violation of these laws may result in substantial monetary and even criminal sanctions;
26
- •
- difficulty complying with continually evolving and changing global product and communications standards and regulations
for both our end products and their component technology;
- •
- market acceptance of our new products, including longer product acceptance periods in new markets into which we enter;
- •
- reliance on local original equipment manufacturers, third party distributors, resellers and agents to effectively market
and sell our products;
- •
- unusual contract terms required by customers in developing markets;
- •
- changes to import and export regulations, including quotas, tariffs, licensing restrictions and other trade barriers;
- •
- the complexity of compliance with complex and varying taxation requirements of multiple jurisdictions;
- •
- evolving and unpredictable nature of the economic, regulatory, competitive and political environments;
- •
- reduced protection for intellectual property rights in some countries;
- •
- longer accounts receivable collection periods; and
- •
- difficulties and costs of staffing, monitoring and managing multinational operations, including but not limited to internal controls and compliance.
In addition, many of the global markets are less developed, presenting additional economic, political, regulatory and legal risks unique to developing economies, such as the following:
- •
- customers that may be unable to pay for our products in a timely manner or at all;
- •
- new and unproven markets for our products and the telecommunications services that our products enable;
- •
- lack of a large, highly trained workforce;
- •
- difficulty in controlling local operations from our headquarters;
- •
- variable ethical standards and an increased potential for fraud;
- •
- unstable political and economic environments; and
- •
- lack of a secure environment for our personnel, facilities and equipment.
In particular, these factors create the potential for physical loss of inventory and misappropriation of operating assets. We have in the past experienced cases of vandalism and armed theft of our equipment that had been or was being installed in the field. If disruptions for any of these reasons become too severe in any particular market, it may become necessary for us to terminate contracts and withdraw from that market and suffer the associated costs and lost revenue.
Our success depends on continuing to hire and retain qualified personnel, including senior managers. If we are not successful in attracting and retaining these personnel and in managing key employee turnover, our business will suffer.
The success of our business depends in significant part upon the continued contributions of key technical and senior management personnel, many of whom would be difficult to replace. The loss of a key employee, the failure of a key employee to perform satisfactorily in his or her current position or our failure to attract and retain other key technical and senior management employees could have a significant negative impact on our operations.
27
Notwithstanding our recent workforce restructurings, to effectively manage our operations, we will need to recruit, train, assimilate, motivate and retain qualified employees, especially in China. Competition for qualified employees is intense, and the process of recruiting personnel in all fields, including technology, research and development, sales and marketing, administration and management with the combination of skills and attributes required to execute our business strategy can be difficult, time-consuming and expensive. We must implement hiring and training processes that are capable of quickly deploying qualified local residents to knowledgeably support our products and services. Alternatively, if there are an insufficient number of qualified local residents available, we might incur substantial costs importing expatriates to service new global markets. For example, we have historically experienced and continue to experience difficulty finding qualified accounting personnel knowledgeable in both U.S. and Chinese accounting standards who are Chinese residents. In addition, we made changes within our senior management team in China. We have retained our key R&D talent, but may need to strengthen our China sales force through recruitment and training. If our current senior management in China cannot maintain and /or establish key relationships with customers, governmental entities and others in China, our business in China may decline significantly. If we fail to attract, hire, assimilate or retain qualified personnel, our business would be harmed. Our recent layoffs also have an adverse effect on our ability to attract and retain critical staff. Competitors and others have in the past, and may in the future, attempt to recruit our employees. In addition, companies in the telecommunications industry whose employees accept positions with competitors frequently claim that the competitors have engaged in unfair hiring practices. We may be the subject of these types of claims in the future as we seek to hire qualified personnel. Some of these claims may result in material litigation and disruption to our operations. We could incur substantial costs in defending ourselves against these claims, regardless of their merit.
Currency rate fluctuations may adversely affect our cash flow and operating results.
Our business is subject to risk from changing foreign exchange rates because we conduct a substantial part of our business in a variety of currencies other than the U.S. Dollar. Historically, a substantial portion of our sales have been made in China and denominated in Renminbi, or RMB. We also have made significant sales denominated in Japanese Yen, Euros, and Indian Rupees. Additionally, we have exposures to emerging market currencies, which can have extreme currency volatility. Adverse movements in currency exchange rates may negatively affect our cash flow and operating results. For example, during 2008, we incurred an approximately $9.9 million foreign currency loss attributed to adverse movements in currency exchange rates. Although we recorded a net foreign currency gain in 2009 and 2010, we could experience foreign currency losses in the future. Although we could attempt to manage foreign currency exposures using forward and option contracts to hedge against the risk of foreign currency rate fluctuation in the eventual net cash inflows and outflows resulting from foreign currency denominated transactions with customers, suppliers, and non-U.S. subsidiaries, we are not currently hedging such transactions. Furthermore, we would be limited in our ability to hedge our exposure to rate fluctuations in certain currencies, including the RMB, on account of governmental currency exchange control regulations that restrict currency conversion and remittance.
Thus, even if we engage in hedging activities in the future, there is no assurance that we would be successful in minimizing the impact of foreign currency fluctuations. As a result, fluctuations in foreign currencies may have a material impact on our business, results of operations and financial condition.
We may not be able to take advantage of acquisition opportunities or achieve the anticipated benefits of completed acquisitions.
We have in the past acquired certain businesses, products and technologies. We will continue to evaluate acquisition prospects that would complement our existing product offerings, augment our market coverage, enhance our technological capabilities, or that may otherwise offer growth
28
opportunities. To the extent we may desire to raise additional funds for purposes not currently included in our business plan, such as to take advantage of acquisition opportunities or otherwise develop new or enhanced products, respond to competitive pressures or raise capital for strategic purposes, there is no assurance that additional financing for these or other purposes would be available on acceptable terms or at all. If we raise additional funds through the issuance of equity securities, our stockholders will experience dilution of their ownership interest, and the newly issued securities may have rights superior to those of common stock. If we raise additional funds by issuing debt, our ability to meet our debt service obligations will be dependent upon our future performance, which will be subject to financial, business and other factors affecting our operations, many of which are beyond our control, we may be subject to limitations on our operations, and our leverage may increase. In addition, acquisitions involve numerous risks, including difficulties in the assimilation of operations, technologies, products and personnel of the acquired company, diversion of management's attention from other business concerns, risks of entering markets in which we have no direct or limited prior experience, the potential loss of key employees of the acquired company, unanticipated costs and, in the case of the acquisition of financially troubled businesses, challenges as to the validity of such acquisitions from third party creditors of such businesses.
We may be unable to adequately protect the loss or misappropriation of our intellectual property, which could substantially harm our business.
We rely on a combination of patents, copyrights, trademarks, trade secret laws and contractual obligations to protect our technology. We have patents issued in the United States and internationally and have pending patent applications internationally. Additional patents may not be issued from our pending patent applications, and our issued patents may not be upheld. In addition, we have, from time to time, chosen to abandon previously filed patent and trademark applications. Moreover, we may face difficulties in registering our existing trademarks in new jurisdictions in which we operate, and we may be forced to abandon or change product or service trademarks because of the unavailability of our existing trademarks or because of oppositions filed or legal challenges to our trademark filings. We cannot guarantee that the intellectual property protection measures that we have taken will be sufficient to prevent misappropriation of our technology or trademarks or that our competitors will not independently develop technologies that are substantially equivalent or superior to ours. In addition, the legal systems of many foreign countries do not protect or honor intellectual property rights to the same extent as the legal system of the United States. For example, in China, the legal system in general, and the intellectual property regime in particular, are still in the development stage. It may be very difficult, time-consuming and costly for us to attempt to enforce our intellectual property rights in these jurisdictions.
We may be subject to claims that we infringe the intellectual property rights of others, which could substantially harm our business.
The industry in which we compete is moving towards aggressive assertion, licensing, and litigation of patents and other intellectual property rights. From time to time, we have become aware of the possibility or have been notified that we may be infringing certain patents or other intellectual property rights of others. Regardless of their merit, responding to such claims could be time consuming, divert management's attention and resources and cause us to incur significant expenses. In addition, although some of our supplier contracts provide for indemnification from the supplier with respect to losses or expenses incurred in connection with any infringement claim, certain contracts with our key suppliers do not provide for such protection. Moreover, certain of our sales contracts provide that we must indemnify our customers against claims by third parties for intellectual property rights infringement related to our products. There are no limitations on the maximum potential future payments under these guarantees. Therefore, we may incur substantial costs related to any infringement claim, which may substantially harm our results of operations and financial condition.
29
We have been and may in the future become subject to litigation to defend against claimed infringements of the rights of others or to determine the scope and validity of the proprietary rights of others. Future litigation may also be necessary to enforce and protect our patents, trade secrets and other intellectual property rights. Any intellectual property litigation or threatened intellectual property litigation could be costly, and adverse determinations or settlements could result in the loss of our proprietary rights, subject us to significant liabilities, require us to seek licenses from or pay royalties to third parties which may not be available on commercially reasonable terms, if at all, and/or prevent us from manufacturing or selling our products, which could cause disruptions to our operations.
In the event that there is a successful claim of infringement against us and we fail to develop non-infringing technology or license the proprietary rights on commercially reasonable terms and conditions, our business, results of operations and financial condition could be materially and adversely impacted.
We are subject to risks related to our financial and strategic investments in third party businesses.
From time to time we make financial and/or strategic investments in third party businesses. We cannot be certain that such investments will be successful. In certain instances we have lost part or all of the value of such investments, resulting in a financial loss and/or the loss of potential strategic opportunities. If we have to write-down or write-off such investments, or if potential strategic opportunities do not develop as planned, our financial performance may suffer. Moreover, these investments are often illiquid, such that it may be difficult or impossible for us to monetize such investments.
In certain cases, we have invested in third party businesses that are outside of the United States. In such cases, even if we are able to successfully liquidate such investments, it may be difficult for us to repatriate the proceeds of such investments to the United States in a prompt manner due to restrictions imposed by the local laws of the jurisdictions in which we invest. If we are unable to repatriate the proceeds of our investments promptly as needed, our business could suffer.
We could incur asset impairment charges for goodwill, intangible assets or other long-lived assets, which could negatively affect our future operating results and financial condition.
We have goodwill, intangible assets and other long-lived assets, the value of which may decrease, or be impaired, over time. We are required to perform periodic assessments for any possible impairment of our goodwill, intangible assets and other long-lived assets for accounting purposes. We test goodwill for impairment during the fourth quarter of each fiscal year, or more frequently if an event occurs or circumstances change that would more likely than not reduce the fair value below its carrying amount. These events or circumstances include unfavorable variances from established business plans, significant changes in forecasted results or volatility inherent in external markets and industries. We review the recoverability of the carrying value of long-lived assets held and used and long-lived assets to be disposed of whenever events or changes in circumstances indicate that the carrying value of the assets or asset groups may not be recoverable.
When determining whether an asset impairment has occurred or calculating such impairment for goodwill, an intangible asset or other long-lived asset, fair value is determined using the present value of estimated cash flows or comparable market values. Our valuation methodology requires management to make judgments and assumptions based on projected future cash flows, the timing of such cash flows, discount rates reflecting the risk inherent in future cash flows, perpetual growth rates, the determination of appropriate comparable entities and the determination of whether a premium or discount should be applied to these comparable entities. Projections of future operating results and cash flows may vary significantly from actual results. Changes in estimates and/or revised assumptions impacting the present value of estimated future cash flows or comparable market values may result in a
30
decrease in fair value of a reporting unit, where goodwill is tested for impairment, or a decrease in fair value of intangible assets, long-lived assets or asset groups. We may face a risk of potential impairment of goodwill and intangible assets if we fail to achieve our financial forecasts with respect to our new Internet TV business. The decrease in fair value could result in a non-cash impairment charge. For example, in the fiscal year ended December 31, 2009, we recorded impairment charges of $33.3 million related to long-lived assets. Any such charge may adversely affect our operating results and financial condition.
Wireless handset products previously sold by us are subject to a wide range of environmental, health and safety laws, and may expose us to potential health and environmental liability claims.
Handset products previously sold by us are subject to a wide range of environmental, health and safety laws, including laws relating to the use, disposal and clean up of, and human exposure to, hazardous substances. There have been claims made alleging a link between the use of wireless handsets and the development or aggravation of certain cancers, including brain cancer. The scientific community is divided on whether there is a risk from wireless handset use, and if so, the magnitude of the risk. Even if there is no link established between wireless handset use and cancer, the negative publicity and possible litigation could have a material adverse effect on our business. In the past, several plaintiffs' groups have brought class actions against wireless handset manufacturers and distributors, alleging that wireless handsets have caused cancer. To date, we have not been named in any of these actions and none of these actions have been successful. In the future we could incur substantial costs in defending ourselves against similar claims, regardless of their merit. Also, claims may be successful in the future and may have a material adverse effect on our financial condition.
Furthermore, there have been claims made alleging a link between the use of Bluetooth enabled mobile phone handsets and noise-induced hearing loss. To date, we have not been named in any of these actions. In the future we could incur substantial costs in defending ourselves against similar claims, regardless of their merit. Also, claims may be successful in the future and may have a material adverse effect on our financial condition.
We are subject to a wide range of environmental, health and safety laws and efforts to comply with such laws may be costly and may adversely impact our financial performance.
Our operations and the products we manufacture and/or sell are subject to a wide range of global environmental, health and safety laws. Compliance with existing or future environmental, health and safety laws could subject us to future costs, liabilities, impact our production capabilities, constrict our ability to sell, expand or acquire facilities and generally impact our financial performance. Some of these laws relate to the use, disposal, clean up of, and exposure to, hazardous substances. Over the last several years, the European Union (the "EU") countries have enacted environmental laws regulating electronic products. For example, beginning July 1, 2006, our products have been subject to laws that mandate the recycling of waste in electronic products sold in the EU and that limit or prohibit the use of certain substances in electronic products. Other countries outside of Europe are expected to adopt similar laws. We may incur additional expenses to comply with these laws.
Product defect or quality issues may divert management's attention from our business and/or result in costs and expenses that could adversely affect our operating results.
Product defects or performance quality issues could cause us to lose customers and revenue or to incur unexpected expenses. Many of our products are highly complex and may have quality deficiencies resulting from the design or manufacture of such product, or from the software or components used in the product. Often these issues are identified prior to the shipment of the products and may cause delays in market acceptance of our products, delays in shipping products to customers, or the cancellation of orders. In other cases, we may identify the quality issues after the shipment of products.
31
In such cases, we may incur unexpected expenses and diversion of resources to replace defective products or correct problems. Such pre-shipment and post-shipment quality issues could result in delays in the recognition of revenue, loss of revenue or future orders, and damage to our reputation and customer relationships. In addition, we may be required to pay damages for failed performance under certain customer contracts, and may receive claims from customers related to the performance of our products.
Business interruptions could adversely affect our business.
Our operations are vulnerable to interruption by fire, earthquake, power loss, telecommunications failure, external interference with our information technology systems, incidents of terrorism and other events beyond our control that affect us, either directly or indirectly through one or more of our key suppliers. Also, our operations and markets in China and Japan are located in areas prone to earthquakes. We do not have a detailed disaster recovery plan, and the occurrence of any events like these that disrupt our business could harm our business and operating results.
We may suffer losses with respect to equipment held at customer sites, which could harm our business.
We face the risk of loss relating to our equipment held at customer sites. In some cases, our equipment held at customer sites is under contract, pending final acceptance by the customer. We generally do not hold title or risk of loss on such equipment, as title and risk of loss are typically transferred to the customer upon delivery of our equipment. However, we do not recognize revenue and accounts receivable with respect to the sale of such equipment until we obtain acceptance from the customer. If we do not obtain final acceptance, we may not be able to collect the contract price or recover this equipment or its associated costs. In other cases, particularly in China, where governmental approval is required to finalize certain contracts, inventory not under contract may be held at customer sites. We hold title and risk of loss on this inventory until the contracts are finalized and, as such, are subject to any losses incurred resulting from any damage to or loss of this inventory.
If our contract negotiations fail or if the government of China otherwise delays approving contracts, we may not recover or receive payment for this inventory. Moreover, our insurance may not cover all losses incurred if our inventory at customer sites not under contract is damaged or misappropriated prior to contract finalization. If we incur a loss relating to inventory for any of the above reasons, our financial condition, cash flows, and operating results could be harmed.
The failure of our enhanced version of our enterprise resource planning system to operate appropriately could result in material financial misstatements and/or cause delays in our filings.
During the first quarter of 2008, we implemented an enhanced version of our enterprise resource planning system. In 2009 and 2010, we continued to implement and enhance modules of this enterprise resource planning system. We depend on this system in order to timely and accurately process and report key components of our results of operations, financial position and cash flows. We and our stockholders are subject to the risks associated with late filings, material misstatements to the quarterly and annual consolidated financial statements and/or financial restatements, any of which could cause investors to lose confidence in our reported financial information and lead to a decline in our stock price, if the enterprise planning system fails to operate appropriately.
Failure to achieve and maintain effective internal controls in accordance with Section 404 of the Sarbanes-Oxley Act of 2002 could have a material adverse effect on our business and stock price.
Section 404 of the Sarbanes-Oxley Act of 2002 (the "Sarbanes-Oxley Act") requires that we establish and maintain an effective internal control structure and procedures for financial reporting and include a report of management on our internal control over financial reporting. Our Annual Report
32
on Form 10-K must contain an assessment by management of the effectiveness of our internal control over financial reporting and must include disclosure of any material weaknesses in internal control over financial reporting that we have identified. In addition, our independent registered public accounting firm must attest to the effectiveness of our internal control over financial reporting.
We have in the past and as of December 31, 2010 identified material weaknesses in our internal control over financial reporting and have concluded that our internal controls over financial reporting were not effective as of December 31, 2010. The requirements of Section 404 of the Sarbanes-Oxley Act are ongoing and also apply to future years. We expect that our internal control over financial reporting will continue to evolve as we continue in our efforts to transform our business. Although we are committed to continue to improve our internal control processes and we will continue to diligently and vigorously review our internal control over financial reporting in order to ensure compliance with the Section 404 requirements, any control system, regardless of how well designed, operated and evaluated, can provide only reasonable, not absolute, assurance that its objectives will be met. In addition, successful remediation of the noted control deficiencies is dependent on our ability to hire and retain qualified personnel. Therefore, we cannot be certain that we will be able to successfully remediate our existing material weaknesses or that in the future additional material weaknesses or significant deficiencies will not exist or otherwise be discovered.
RISKS RELATING TO CONDUCTING BUSINESS IN CHINA
China's governmental and regulatory reforms may impact our ability to do business in China.
Since 1978, the Chinese government has been in a state of evolution and reform. The reforms have resulted in and are expected to continue to result in significant economic and social development in China. Many of the reforms are unprecedented or experimental and may be subject to change or readjustment due to a variety of political, economic and social factors. Multiple government bodies are involved in regulating and administering affairs in the telecommunications and information technology industries, among which the MIIT, the former Ministry of Information Industry, the National Development and Reform Commission or NDRC, the State-owned Assets Supervision and Administration Commission or SASAC and the State Administration of Radio, Film and Television or SARFT play the leading roles. These government agencies have broad discretion and authority over all aspects of the telecommunications and information technology industry in China, including but not limited to, setting the telecommunications tariff structure, granting carrier licenses and frequencies, approving equipment and products, granting product licenses, approving of the form and content of transmitted data, specifying technological standards as well as appointing carrier executives, all of which may impact our ability to do business in China.
Any of the following changes in China's political and economic conditions and governmental policies could have a substantial impact on our business:
- •
- the promulgation of new laws and regulations and the interpretation of those laws and regulations;
- •
- inconsistent enforcement and application of the telecommunications industry's rules and regulations by the Chinese
government between foreign and domestic companies;
- •
- the restructuring of telecommunications carriers in China, including policy making governing next generation network
infrastructure and licensing;
- •
- restrictions on IPTV license grants, which could limit the potential market for our products;
- •
- the introduction of measures to control inflation or stimulate growth;
- •
- the introduction of new guidelines for tariffs and service rates, which affect our ability to competitively price our products and services;
33
- •
- changes in the rate or method of taxation;
- •
- the imposition of laws, rules or regulations affecting the direct or indirect nationalization of assets controlled by
non-governmental persons or entities;
- •
- the imposition of additional restrictions on currency conversion and remittances abroad; or
- •
- any actions that limit our ability to develop, manufacture, import or sell our products in China, or to finance and operate our business in China.
In addition to modifying the existing telecommunications regulatory framework, the Chinese government is currently preparing a draft of a standard, national telecommunications law, or Telecommunications Law, to provide a uniform regulatory framework for the telecommunications industry. Currently, Telecommunications Law has been included in the law legislation plan of the Standing Committee of the 11th National People's Congress. We do not yet know the final nature or scope of the regulations that would be created if the Telecommunications Law is passed. Accordingly, we cannot predict whether it will have a positive or negative effect on us or on some or all aspects of our business.
Under China's current regulatory structure, the communications products that we offer in China must meet government and industry standards. In addition, a network access license for the equipment must be obtained. Without a license, telecommunications equipment is not allowed to be connected to public telecommunications networks or sold in China. Moreover, we must ensure that the quality of the telecommunications equipment for which we have obtained a network access license is stable and reliable, and will not negatively affect the quality or performance of other installed licensed products.
China's currency exchange control and government restrictions on dividends may impact our ability to transfer funds outside of China.
A significant portion of our business is conducted in China where the currency is the RMB. Regulations in China permit foreign owned entities to freely convert the RMB into foreign currency for transactions that fall under the "current account," which includes trade related receipts and payments, interest and dividends. Accordingly, our Chinese subsidiaries may use RMB to purchase foreign exchange for settlement of such "current account" transactions without pre-approval. However, pursuant to applicable regulations, foreign-invested enterprises in China may pay dividends only out of their accumulated profits, if any, determined in accordance with Chinese accounting standards and regulations. In calculating accumulated profits, foreign investment enterprises in China are required to allocate at least 10% of their accumulated profits each year, if any, to fund certain reserve funds, including mandated employee benefits funds, unless these reserves have reached 50% of the registered capital of the enterprises.
Transactions other than those that fall under the "current account" and that involve conversion of RMB into foreign currency are classified as "capital account" transactions; examples of "capital account" transactions include repatriations of investment by or loans to foreign owners, or direct equity investments in a foreign entity by a China domiciled entity. "Capital account" transactions require prior approval from China's State Administration of Foreign Exchange, or SAFE, or its provincial branch to convert a remittance into a foreign currency, such as U.S. Dollars, and transmit the foreign currency outside of China.
This system could be changed at any time and any such change may affect the ability of us or our subsidiaries in China to repatriate capital or profits, if any, outside China. Furthermore, SAFE has a significant degree of administrative discretion in implementing the laws and has used this discretion to limit convertibility of current account payments out of China. Whether as a result of a deterioration in the Chinese balance of payments, a shift in the Chinese macroeconomic prospects or any number of other reasons, China could impose additional restrictions on capital remittances abroad. As a result of
34
these and other restrictions under the laws and regulations of the People's Republic of China, or the PRC, our China subsidiaries are restricted in their ability to transfer a portion of their net assets to the parent. We have no assurance that the relevant Chinese governmental authorities in the future will not limit further or eliminate the ability of our Chinese subsidiaries to purchase foreign currencies and transfer such funds to us to meet our liquidity or other business needs. Any inability to access funds in China, if and when needed for use by us outside of China, could have a material and adverse effect on our liquidity and our business.
Fluctuations in the value of the RMB relative to the U.S. Dollar could affect our operating results and may have a material adverse effect on your investment.
We prepare our financial statements in U.S. Dollars, while our underlying businesses operate in two currencies, U.S. Dollars and Chinese RMB. It is anticipated that we will conduct our operations in China primarily in RMB. The conversion of financial information using a functional currency of RMB will be subject to risks related to foreign currency exchange rate fluctuations. The value of RMB against the U.S. Dollar and other currencies may fluctuate and is affected by, among other things, changes in China's political and economic conditions and supply and demand in local markets. On July 21, 2005, the PRC government changed its decade-old policy of pegging the value of the RMB to the U.S. Dollar. Under the new policy, the RMB is permitted to fluctuate within a managed band based on market supply and demand and by reference to a basket of certain foreign currencies. This change in policy has resulted in a 20% appreciation of the RMB against the U.S. Dollar between July 21, 2005 and December 31, 2010. While the international reaction to the RMB revaluation has generally been positive, there remains significant international pressure on the PRC government to adopt an even more flexible currency policy, which may result in a further and more significant appreciation of the RMB against the U.S. Dollar. As we have significant operations in China, any significant revaluation of the RMB may materially and adversely affect our cash flows, revenue, earnings and financial position, and the value of, and any dividends payable on, our ordinary shares in U.S. Dollars. For example, to the extent that we need to convert U.S. Dollars into RMB for our operations, appreciation of the RMB against the U.S. Dollar would have an adverse effect on the RMB amount we receive from the conversion. Conversely, if we decide to convert our RMB into U.S. Dollars for the purpose of making payments for dividends on our ordinary shares or for other business purposes, appreciation of the U.S. Dollar against the RMB would have a negative effect on the U.S. Dollar amount available to us.
If China imposes economic restrictions to reduce inflation, future economic growth in China could be severely curtailed, reducing the profitability of our operations in China.
Rapid economic growth can lead to growth in the supply of money and rising inflation. If prices for any products or services in China are unable, for any reason, to increase at a rate that is sufficient to compensate for any increase in the costs of supplies, materials or labor, it may have an adverse effect on our operations in China. In order to control inflation in the past, China has imposed controls on bank credits, limits on loans for fixed assets and restrictions on state bank lending and could adopt additional measures to further combat inflation. Such measures could harm the economy generally and hurt our business by (i) limiting the income of our customers available to spend on our products and services, (ii) forcing us to lower our profit margins, and (iii) limiting our ability to obtain credit or other financing to pursue our expansion plans or maintain our business. We cannot predict with any certainty the degree to which our business will be adversely affected by slower economic growth in China.
35
China's changing economic environment may impact our ability to do business in China.
Since 1978, the Chinese government has been reforming the economic system in China to increase the emphasis placed on decentralization and the utilization of market forces in the development of China's economy. These reforms have resulted in significant economic growth. However, any economic reform policies or measures in China may from time to time be modified or revised by the Chinese government. While we may be able to benefit from the effects of some of these policies, these policies and other measures taken by the Chinese government to regulate the economy could also have a significant negative impact on economic conditions in China, which would result in a negative impact on our business.
China's entry into the World Trade Organization and relaxation of trade restrictions have led to increased foreign investment in China's telecommunications industry and may lead to increased competition in our markets which may have an adverse impact on our business.
China's economic environment has been changing as a result of China's entry, in December of 2001, into the World Trade Organization or WTO. Foreign investment in the telecommunications sector is regulated by the "Provisions on Administration of Foreign Invested Telecommunications Enterprises" promulgated by the State Council in December 2001 and effective as of January 1, 2002, which was amended on September 10, 2008. The provisions brought foreign equity limits into conformity with China's WTO commitments, allowing foreign investors to own equity generally up to 49% for basic telecom services enterprises and up to 50% for value-added telecom services enterprises.
As the existing international vendors increase their investment in China, and more vendors enter the China market, the competition in the telecommunication equipment market may increase, and as a result, our business may suffer. If China's entry into the WTO results in increased competition or has a negative impact on China's economy, our business could suffer. In addition, although China is increasingly according foreign companies and foreign investment enterprises established in China the same rights and privileges as Chinese domestic companies as a result of its admission into the WTO, special laws, administrative rules and regulations governing foreign companies and foreign investment enterprises in China may still place foreign companies at a disadvantage in relation to Chinese domestic companies and may adversely affect our competitive position.
Uncertainties with respect to the Chinese legal system may adversely affect us.
We conduct our business in China primarily through our wholly owned subsidiaries incorporated in China. Our subsidiaries are generally subject to laws and regulations applicable to foreign investment in China. Accordingly, our business might be affected by China's developing legal system. Since 1978, many new laws and regulations covering general economic matters have been promulgated in China, and the overall effect of legislation over the past 30 years has enhanced the protections afforded to various forms of foreign investment in China. However, foreign investors may be adversely affected by new laws, frequent changes to existing laws (or interpretations thereof) and preemption of provincial or local regulations by national laws or regulations. In addition, certain government policies and internal rules promulgated by governmental agencies may not be published in time, or at all. As a result, we may operate our business in violation of new rules and policies without having any knowledge of their existence. The Chinese legal system is based on written statutes, and prior court decisions have limited precedential value. Because many laws, rules and policies in China are relatively new and the Chinese legal system is still evolving, the interpretation and enforcement of laws, rules and policies in China are not always uniform and involve uncertainties. The Chinese government has broad discretion in dealing with violations of laws, rules and policies, including levying fines, revoking business and other licenses and requiring actions necessary for compliance, and enforcement of existing laws or contracts based on existing law may be sporadic; therefore, it may be difficult to predict the effect of existing or new Chinese laws, rules or policies on our businesses and it may be difficult to obtain swift and equitable
36
enforcement, or to obtain enforcement of a judgment by a court of another jurisdiction. Any litigation in China may be protracted and result in substantial costs and diversion of resources and management's attention.
A significant portion of our assets is located in the PRC, and all of our executive officers and a majority of our directors reside outside of the United States. As a result, investors may not be able to enforce federal securities laws or their other legal rights.
A substantial portion of our assets is located in the PRC and all of our executive officers and a majority of our directors reside outside of the United States. The PRC does not have treaties with the United States and many other countries providing for the reciprocal recognition and enforcement of judgments of courts. As a result, it may be difficult for investors in the U.S. to enforce their legal rights, to effect service of process upon certain of our directors or officers or to enforce judgments of U.S. courts predicated upon civil liabilities and criminal penalties against our directors and officers located outside of the U.S.
If tax benefits available to our subsidiaries located in China are reduced or repealed, our business could suffer.
On March 16, 2007, China's top legislature, the National People's Congress, passed the China Corporate Income Tax Law or the CIT Law. The CIT Law became effective on January 1, 2008. Under the CIT Law, China's dual tax system for domestic enterprises and foreign investment enterprises or FIEs are effectively replaced by a unified system. The new law establishes a tax rate of 25% for most enterprises and a reduced tax rate of 15% for certain qualified high technology enterprises.
Prior to this change in tax law, certain subsidiaries and joint ventures located in China enjoyed tax benefits in China which were generally available to FIEs. The tax holidays/incentives for FIEs were applicable or potentially applicable to UTStarcom ChongQing Telecom Co. Ltd. or CUTS, UTStarcom Telecom Co., Ltd. or HUTS, and UTStarcom China Co., Ltd. or UTSC, our active subsidiaries in China, because these entities may have qualified as accredited technologically advanced enterprises.
The CIT Law provides the reduced 15% enterprise income tax rate for qualified high and new technology enterprises. Two of UTStarcom's China subsidiaries, HUTS and UTSC, through which the majority of our business in China is conducted, obtained their High and New Technology Enterprise Certificates, or High-tech Certificates, from the relevant approval authorities on September 19, 2008 and December 30, 2008, respectively, and thereafter were approved to pay CIT at the reduced tax rate of 15%. The approval for the reduced 15% tax rate is valid for three years and applies retroactively from January 1, 2008, subject to possible re-assessment by the approval authorities. During the re-assessment, the tax authority may suspend the implementation of the reduced 15% rate. HUTS's High-tech Certificate will expire on September 19, 2011 and UTSC's High-tech Certificate will expire on December 30, 2011. HUTS and UTSC may apply for the extension of their respective High-tech Certificates prior to the expiration date of the respective certificates and, if approved, each extended term will be three years. If HUTS or UTSC fails to pass the re-assessment by the approval authorities or fails to renew its High-tech Certificate, the preferential tax rate of 15% will cease to apply and HUTS or UTSC would be subject to a tax rate of 25%. However, since both entities are currently in significant loss positions, the change in tax rate will not have a material adverse impact on the business or liquidity until the two PRC subsidiaries begin to generate profit and deplete all the net operating loss carry forwards.
The Chinese central government may review and audit tax benefits granted by local or provincial authorities and could determine to disallow such benefits. Certain of our subsidiaries and joint ventures located in China enjoy tax benefits in China that are generally available to foreign investment enterprises. If these tax benefits are reduced, disallowed or repealed due to changes in tax laws or determination by the Chinese government, our business could suffer.
37
Under the CIT Law, we may be classified as a "resident enterprise" of the PRC, which could result in unfavorable tax consequences to us and to non-PRC stockholders.
Under the CIT Law, an enterprise established outside of China with "de facto management bodies" within China is considered a "resident enterprise", meaning that it can be treated in a manner similar to a Chinese enterprise for enterprise income tax purposes. The implementing rules of the CIT Law define de facto management as "substantial and overall management and control over the production and operations, personnel, accounting, and properties" of the enterprise. The CIT Law and its implementing rules are relatively new and ambiguous in terms of some definitions, requirements and detailed procedures, and currently no official interpretation or application of this new "resident enterprise" classification, other than for enterprises established outside of China whose main holding investor/s is/are enterprise/s established in China, is available; therefore, it is unclear how tax authorities will determine tax residency based on the facts of each case.
If the PRC tax authorities determine that we are a "resident enterprise" for PRC enterprise income tax purposes, the PRC could impose a 10% PRC tax on dividends we pay to our non-PRC stockholders and gains derived by our non-PRC stockholders from transferring our shares, if such income is considered PRC-sourced income by the relevant PRC authorities. In addition, we could be subject to a number of unfavorable PRC tax consequences, including: (a) we could be subject to enterprise income tax at a rate of 25% on our worldwide taxable income, as well as PRC enterprise income tax reporting obligations; and (b) although under the CIT Law and its implementing rules, dividends paid to us from our PRC subsidiaries through our sub-holding companies may qualify as "tax-exempt income", we cannot guarantee that such dividends will not be subject to withholding tax. Any increase in the taxation of our PRC-based revenues could materially and adversely affect our business, operating results and financial condition.
We face uncertainty from PRC's Circular on Strengthening the Administration of Enterprise Income Tax on Non-Resident Enterprises' Equity Transfer, or Circular 698.
The Chinese State Administration of Taxation, or SAT, released a circular on December 10, 2009, applicable to transactions as of January 1, 2008 (Guoshuihan No. 698—Circular 698), that addresses the transfer of equity by non-PRC tax resident enterprises. Under Circular 698, foreign enterprises deriving gains from transfer of the equity of a PRC tax resident enterprise directly or indirectly might be subject to PRC withholding income tax, which may have a significant impact on many foreign enterprises that use overseas intermediate holding companies to invest in China. In certain circumstances where a foreign enterprise indirectly transfers equity interests in a PRC tax resident enterprise by selling the equity interests in an intermediate holding company, the foreign enterprise may be required to report the sale to PRC tax authorities and might be subject to PRC withholding income tax for the capital gain realized in the sale if such indirect transfer is conducted through the use of abusive arrangement of organizational structure and does not have reasonable commercial purpose.
There is still uncertainty as to the interpretation and application of Circular 698 by PRC tax authorities in practice. As a result, we may be subject to tax under Circular 698 with respect to indirect transfers of our PRC tax resident enterprises and we may be required to expend valuable resources to comply with Circular 698 or to establish that we should not be taxed under Circular 698, any of which could have an adverse effect on our financial condition and results of operations.
The Personal Access System market will decline rapidly over the next year.
We believe the Personal Access System, PAS, market has matured. PAS is available in most of the provinces throughout China and competition from mobile operators has increased in cities where PAS is deployed. Mobile operators offering special promotional pricing or incentives to customers, such as free incoming calls or free mobile-to-mobile calls, have reduced PAS subscription growth. The
38
expansion of mobile operators in China is likely to have a material adverse effect on our pricing and harm our business or results of operations.
MIIT has granted 3G mobile licenses to China Telecom, China Mobile and China Unicom and has significantly reduced capital expenditures relating to PAS networks that utilize our existing products. In addition, on January 9, 2009, in connection with the granting of 1900-1920 MHz frequency 3G licenses to the mobile communication companies in China, the MIIT officially issued a notice to unconditionally phase out the Personal Handy-phone System or PHS by the end of 2011 to guarantee the bandwidth for China's 3G services using time division synchronous code division multiple access, or TD-SCDMA technology, and requested China Telecom and China Netcom (both PAS service providers in China) to formulate a phase-out plan for their PHS services, and to cease the registration of new PHS users and expansion of the network. This may lead to the shutting down of PAS networks by such time.
Historically, China's telecommunications sector has been subject to a number of state-mandated restructurings. Any future restructurings in the telecommunications industry may result in delay or cancellation of telecommunications-related capital expenditures, which may have an adverse effect on our business.
Television over the internet is a new business in China and laws regulating the business have not been fully developed and may be unpredictable. Unfavorable regulation of the industry may adversely affect our IPTV operations in China and negatively impact our business.
Broadcasting television over the internet has only recently begun in China. SARFT, the central government's regulatory body, issued a measure in July 2004 to regulate the broadcasting of audio-visual programs through the information network, which includes our Internet Protocol television, or IPTV, business. SARFT categorized the information network into the mobile telecommunication network, fixed communications network, microwave communication network, cable television network, satellite or other metropolitan area network, wide area network, local area network and other information networks categories. The equipment that receives information from these networks includes computers, television sets, mobile phones and other electronic products. In December 2007, MIIT and SARFT jointly issued a measure to regulate the service of audio-visual programs on the internet, which also includes our IPTV business. This measure requires the entities engaged in the services of audio-visual program on the internet to be owned or controlled by the State owned entities. However, on February 3, 2008, SARFT and MIIT jointly held a press conference in response to inquiries related to such measure, during which SARFT and MIIT officials indicated that service providers of audio-video program established prior to the promulgation date of such measure that do not have any regulatory non-compliance records can apply for such permit to continue their business. After the conference, the two authorities published a press release that confirmed the above guidelines. While regulating the IPTV business, SARFT is encouraging development in China of the digital television business, a business that may be competitive with IPTV in the target market. Digital television and IPTV target complementary markets and the extent of support SARFT will provide for IPTV in setting regulations is not clear. On February 3, 2010, the SARFT agreed to allow China Telecom to apply to SARFT for approval of an IPTV license to expand its IPTV trial to more cities and industries. Because the IPTV industry relates to both television and telecom sectors, it may be subject to regulation by different governmental authorities, including MIIT. However, due to a lack of uniform regulation on the development of the IPTV industry, we cannot predict that our IPTV business will operate smoothly in China. Our business may suffer if the law or policy in China does not encourage the IPTV industry.
39
We currently do not have a license to engage in the IPTV operator service business in China and development of our IPTV business depends upon the cooperation of IPTV license holder(s) and network operators. If we are unable to work cooperatively with license holder(s) and network operators, our business may suffer.
Under the measures issued by SARFT in July 2004, entities intending to engage in the IPTV operator service business should obtain a license from SARFT and foreign investment enterprises are prohibited from engaging in the IPTV operator service business. The new measure jointly issued by MIIT and SARFT indicates that SARFT will only grant such licenses to state-owned companies. However, on February 3, 2008, SARFT and MIIT jointly held a press conference in response to inquiries related to such measure, during which SARFT and MIIT officials indicated that service providers of audio-video program established prior to the promulgation date of such measure that do not have any regulatory non-compliance records can apply for such permit to continue their business. After the conference, the two authorities published a press release that confirmed the above guidelines. We do not engage in the IPTV operator service business in the PRC. Rather, we are the technical service and equipment provider in this field. Accordingly, we do not need any licenses or permission to provide our technical services or equipment to licensed IPTV operators other than the network access licenses we currently hold; however, our business development will depend on the cooperation of license holders and network operators. Our business may suffer if we fail to cooperate with license holders or network operators, or if the license holder(s) we are cooperating with lose their licenses.
Recent PRC regulations relating to offshore investment activities by PRC residents and employee stock options granted by overseas-listed companies may increase our administrative burden. If our shareholders who are PRC residents, or our PRC employees who are granted or exercise stock options, fail to make any required registrations or filings, we may be unable to distribute profits and may become subject to liability under PRC laws.
The State Administration of Foreign Exchange, or SAFE, has promulgated regulations that require PRC residents and PRC corporate entities to register with local branches of SAFE in connection with their direct or indirect offshore investment activities. Under the SAFE regulations, PRC residents who make, or have previously made, direct or indirect investments in offshore companies will be required to register those investments. In addition, any PRC resident who is a direct or indirect shareholder of an offshore company is required to file or update the registration with the local branch of SAFE with respect to that offshore company any material change involving its round-trip investment, capital variation, such as an increase or decrease in capital, transfer or swap of shares, merger, division, long-term equity or debt investment or creation of any security interest. If any PRC shareholder fails to make the required SAFE registration or file or update the registration, the PRC subsidiaries of that offshore parent company may be prohibited from distributing their profits and the proceeds from any reduction in capital, share transfer or liquidation to their offshore parent company, and the offshore parent company may also be prohibited from injecting additional capital into its PRC subsidiaries. Moreover, failure to comply with the various SAFE registration requirements described above could result in liability under PRC laws for evasion of applicable foreign exchange restrictions.
We cannot provide any assurances that all of our shareholders who are PRC residents will make or obtain any applicable registrations or approvals required by these SAFE regulations. The failure or inability of our PRC resident shareholders to comply with the registration procedures set forth therein may subject us to fines and legal sanctions, restrict our cross-border investment activities, or limit our PRC subsidiaries' ability to distribute dividends or obtain foreign-exchange denominated loans to our company.
On March 28, 2007, SAFE promulgated the Application Procedure of Foreign Exchange Administration for Domestic Individuals Participating in Employee Stock Holding Plan or Stock Option Plan of Overseas Listed Company , or the or Stock Option Rule, to regulate foreign exchange procedures for PRC individuals participating in employee stock holding and stock option plans of
40
overseas companies. Under the Stock Option Rule, a PRC domestic individual must comply with various foreign exchange procedures through a domestic agent institution when participating in any employee stock holding plan or stock option plan of an overseas listed company. Certain domestic agent institutions, such as the PRC subsidiaries of an overseas listed company, a labor union of such company that is a legal person or a qualified financial institution, among others things, shall file with SAFE and be responsible for completing relevant foreign exchange procedures on behalf of PRC domestic individuals, such as applying to obtain SAFE approval for exchanging foreign currency in connection with owning stock or stock option exercises. Concurrent with the filing of such applications with SAFE, the PRC subsidiary, as a domestic agent, must obtain approval from SAFE to open a special foreign exchange account at a PRC domestic bank to hold the funds in connection with the stock purchase or option exercise, any returns based on stock sales, any stock dividends issued and any other income or expenditures approved by SAFE. The PRC subsidiary also is required to obtain approval from SAFE to open an overseas special foreign exchange account at an overseas trust bank to hold overseas funds used in connection with any stock purchase. The domestic agent institution is required to make a quarterly filing with SAFE to update SAFE with relevant information, including the exercise of options by employees, the holding of shares by employees and the funds in the special foreign exchange account and the overseas special foreign exchange account.
Under the Stock Option Rule, all proceeds obtained by PRC domestic individuals from sales of stock shall be fully remitted back to China after relevant overseas expenses are deducted. The foreign exchange proceeds from these sales can be converted into RMB or transferred to the individual's foreign exchange savings account after the proceeds have been remitted back to the special foreign exchange account opened at the PRC domestic bank. If the stock option is exercised in a cashless exercise, the PRC domestic individuals are required to remit the proceeds to the special foreign exchange account. The Stock Option Rule does not provide for specific forms of penalties for noncompliance but provides that SAFE may impose penalties in accordance with the Foreign Exchange Administration Regulation, Implementing Rules for Individual Foreign Exchange Regulation and other related PRC regulations under which the penalties for noncompliance with foreign exchange administration rules include fines against the both the company and its implicated employees.
We and our PRC employees who have been granted stock options are subject to the Stock Option Rule. In May 2008, UTSC, one of our PRC subsidiaries, made a filing with SAFE's Beijing branch as required by the Stock Option Rule for UTSC's PRC employees who participate in our employee stock option plans and UTSC obtained approval to open a special foreign exchange account at a PRC domestic bank. UTStarcom Telecom Co., Ltd. and UTStarcom (Chong Qing) Telcom Co., Ltd., two of our PRC subsidiaries, are in the process of preparing the necessary filings under the Stock Option Rule for its PRC employees who participate in our employee stock option plan.
Restrictions on direct foreign investments in certain business sectors, such as IPTV, iDTV and Internet TV service businesses, may require that we enter into contractual arrangements with our Chinese business partners, which are subject to potential risks and uncertainties.
We anticipate that providing value-added support services to businesses in the telecom, cable and/or media sectors, such as IPTV, interactive digital television, or iDTV, and Internet television, or Internet TV, services businesses, will be a significant component of our future business model. IPTV, iDTV and Internet TV are Internet protocol-based interactive television services provided via a set-top box. We will provide operators engaging in these businesses with services, including equipment installation, system installation and maintenance, technical services and other value-added services, in return for long term income. We anticipate that these value-added support services will play an important role in the growth of our business.
Direct foreign investments are subject to certain restrictions with respect to the operating of telecom, cable and media businesses. Under the "Telecommunications Regulations" issued by the State
41
Council on September 25, 2000 and the "Provisions on Administration of Foreign Invested Telecommunications Enterprises" issued by the State Council on December 11, 2001, amended on September 10, 2008, the shareholding of foreign investors is limited to up to 49% for basic telecom business and is limited to up to 50% for value-added telecom business. Under the "Measures on Administration of Publication of Audio-Visual Programs through Internet or Other Information Network" issued by SARFT on July 6, 2004, the "Administration Measures on Transmitting Business of Radio and Television Programs" issued by SARFT on July 6, 2004, the "Administration Measures on Wireless Transmitting Web of Radio and Television Programs" issued by SARFT on November 15, 2004, the "Administrative Provisions on Internet Audio-visual Program Service" jointly issued by SARFT and MIIT on December 20, 2007, and the related implementing rules of these regulations, foreign investors are prohibited from holding any equity interest in enterprises operating IPTV, iDTV and Internet TV business in the PRC.
Because of the regulatory restrictions on direct foreign investments in the telecom, cable and/or media sectors, we may conduct business through contractual relationships with Chinese business partners that are licensed or qualified to operate such businesses, or the Operating Companies. Our PRC subsidiaries may directly or indirectly provide certain technology services to the Operating Companies through an arrangement of technology service agreements and will receive service fees directly or indirectly form Operating Companies. To ensure the payment of the service fee by Operating Companies, the shareholders of Operating Companies may pledge their equity interests in Operating Companies to our PRC subsidiaries or affiliates. There may also be a call option arrangement so that our PRC subsidiaries may purchase the equity interests in Operating Companies if they are permitted by the laws of the PRC.
The contractual arrangements are subject to potential risks and uncertainties and may not be as effective in providing operational control and economic benefits as direct equity ownership. If the PRC authorities determine that the contractual arrangements are designed with a view to circumvent PRC foreign investment restrictions and do not comply with PRC regulations, the validity and enforceability of the contractual arrangements may be of question. Chinese tax authorities may scrutinize the contractual arrangements for whether the technology service fee paid by Operating Companies to our PRC subsidiaries or affiliates will substantially reduce the income tax and business tax payable by the Operating Companies. Additionally, there is uncertainty with respect to the attitude of judicial authorities on the enforceability of the contractual arrangements in the event Operating Companies or their shareholders breach the contracts. The inability to participate in the telecom, cable and/or media sectors as presently expected through the contractual arrangements or the inability to enforce our rights under such contractual arrangements could result in a negative impact on our business.
RISKS RELATING TO PERFORMANCE OF OUR SHARES
Our stock price is highly volatile.
The trading price of our common stock has fluctuated significantly since our initial public offering in March of 2000. Our stock price could be subject to wide fluctuations in the future in response to many events or factors, including those discussed in the preceding risk factors relating to our operations, as well as:
- •
- actual or anticipated fluctuations in operating results, actual or anticipated gross profit as a percentage of net sales,
levels of inventory, our actual or anticipated rate of growth and our actual or anticipated earnings per share;
- •
- changes in expectations as to future financial performance or changes in financial estimates or buy/sell recommendations of securities analysts;
42
- •
- changes in governmental regulations or policies in China and other developing countries in which we do business;
- •
- our, or a competitor's, announcement of new products, services or technological innovations;
- •
- the operating and stock price performance of other comparable companies; and
- •
- news and commentary emanating from the media, securities analysts or government bodies in China relating to us and to the industry in general.
General market conditions and domestic or international macroeconomic factors unrelated to our performance may also affect our stock price. For these reasons, investors should not rely on recent trends to predict future stock prices or financial results. Furthermore, following periods of volatility in a company's securities, securities class action litigation against a company is sometimes instituted. We have experienced substantial costs and the diversion of management's time and resources on this type of litigation and may do so in the future.
In addition, public announcements by China Telecom, China Mobile, and China Unicom each of which exert significant influence over many of our major customers in the PRC, may contribute to volatility in the price of our stock.
SOFTBANK CORP. with its related entities, including SOFTBANK America Inc., and E-Town International Holding (Hong Kong) Co. Limited have significant influence over our management and affairs, which they could exercise against the best interests of our stockholders.
SOFTBANK CORP. and its related entities, including SOFTBANK America Inc. (collectively, "SOFTBANK") and E-Town International Holding (Hong Kong) Co. Limited ("E-Town"), beneficially owned approximately 9.4% and 7.3%, respectively of our outstanding stock as of March 1, 2011. As a result, SOFTBANK and E-Town have the ability to influence all matters submitted to our stockholders for approval, as well as our management and affairs. Matters that could require stockholder approval include:
- •
- election and removal of directors;
- •
- our merger or consolidation with or into another entity; and
- •
- sale of all or substantially all of our assets.
This concentration of ownership may delay or prevent a change of control or discourage a potential acquirer from making a tender offer or otherwise attempting to obtain control of us, which could decrease the market price of our common stock.
Delaware law and our charter documents contain provisions that could discourage or prevent a potential takeover, even if the transaction would benefit our stockholders.
Other companies may seek to acquire or merge with us. Our acquisition or merger could result in benefits to our stockholders, including an increase in the value of our common stock. Some provisions of our Certificate of Incorporation and Bylaws, as well as provisions of Delaware law, may discourage, delay or prevent a merger or acquisition that a stockholder may consider favorable. These provisions include:
- •
- authorizing the board of directors to issue additional preferred stock;
- •
- prohibiting cumulative voting in the election of directors;
- •
- limiting the persons who may call special meetings of stockholders;
- •
- prohibiting stockholder action by written consent;
43
- •
- creating a classified board of directors pursuant to which our directors are elected for staggered three year terms;
- •
- establishing advance notice requirements for nominations for election to the board of directors and for proposing matters
that can be acted on by stockholders at stockholder meetings; and
- •
- requiring for-cause removal of directors.
Our failure to timely file periodic reports with the Securities and Exchange Commission, or SEC, could result in the delisting of our shares from NASDAQ, affect the liquidity of our shares and cause us to default on covenants contained in contractual arrangements.
If we are unable to maintain compliance with the conditions for continued listing required by NASDAQ, then our shares of common stock may be subject to delisting from NASDAQ. For example, as a result of our failure to timely file with the SEC our Quarterly Report on Form 10-Q for the quarters ended September 30, 2006, March 31, 2007, June 30, 2007 and March 31, 2008 and our Annual Report on Form 10-K for the fiscal years ended December 31, 2006 and 2007, we were not in full compliance with NASDAQ Marketplace Rule 5250(c)(1), which requires us to make, on a timely basis, all filings with the SEC required by the Securities Exchange Act of 1934. While we returned to full compliance with NASDAQ's listing requirements on May 15, 2008, we are required to comply with NASDAQ Marketplace Rule 5250(c)(1) as a condition for our common stock to continue to be listed on NASDAQ. If our shares of common stock are delisted from NASDAQ, our common stock may not be eligible to trade on any national securities exchange or the over-the counter market. If our common stock is no longer traded through a market system, its liquidity may be greatly reduced, which could negatively affect its price. In addition, we may be unable to obtain future equity financing, or use our common stock as consideration for mergers or other business combinations. A delisting from NASDAQ may also have other negative implications, including the potential loss of confidence by suppliers, customers and employees, the loss of institutional investor interest, and fewer business development opportunities and could lead to a default under certain of our contractual arrangements.
ITEM 1B—UNRESOLVED STAFF COMMENTS
None.
Our headquarters are currently located on a leased site in Beijing, China. Additionally, we operate facilities in the United States, other parts of China and globally consisting of office, research and development, warehousing and manufacturing sites primarily used jointly by our reporting segments.
The headquarters for our China operations are located in Hangzhou. In 2001, we purchased the rights to use 49 acres of land located in Zhejiang Science and Technology Industry Garden of Hangzhou Hi-tech Industry Development Zone and have built a 2.7 million square foot facility on this site. The facility was occupied in October 2004 and is used for manufacturing operations, research and development and administrative offices. In December 2009, we entered into a Property Transfer and Leaseback Agreement for the intended sale of our manufacturing, research and development, and administrative offices facility in Hangzhou, China to another party with leaseback of a portion of the facility. On February 1, 2010, we entered into a lease agreement with respect to the leaseback of approximately 83,027 square meters (approximately 0.9 million square feet) which represents approximately one-third of the facility. The original lease term expires in 2016. As of May 31, 2010, we had received all of the sales proceeds and met all criteria for consummation of sale of the Hangzhou facility. On May 31, 2010, the Company and the buyer agreed that all conditions precedent to the closing had been met and the leaseback commenced on June 1, 2010. The Company has decided to
44
terminate the lease of Hangzhou facility in June 2011 and notified the landlord on December 8, 2010, six months in advance, according to the termination clause in the Lease agreement.
We lease approximately 1.2 million square feet of property, of which 1.0 million square feet are properties in China and 0.1 million square feet are properties in North America. We maintain 10 sales and customer support offices in 7 countries covering the United States, Europe, India, and the Asia-Pacific region. We lease sales offices in 28 locations in China and leases for such offices expire at various dates beginning in the year 2011.
We believe our facilities are suitable and adequate to meet our current needs.
Securities Class Action Litigation
Beginning in October 2004, several shareholder class action lawsuits alleging federal securities violations were filed against us and various officers and directors of our company. The actions have been consolidated in United States District Court for the Northern District of California under the caption In re UTStarcom, Inc. Securities Litigation, Master File No. C-04-4908-JW (PVT). The lead plaintiffs in the case filed a First Amended Consolidated Complaint on July 26, 2005. The First Amended Complaint alleged violations of the Securities Exchange Act of 1934, and was brought on behalf of a putative class of shareholders who purchased our stock after April 16, 2003 and before September 20, 2004. On April 13, 2006, the lead plaintiffs filed a Second Amended Complaint adding new allegations and extending the end of the class period to October 6, 2005. In addition to the Company defendants, the plaintiffs are also suing Softbank. Plaintiffs' complaint seeks recovery of damages in an unspecified amount.
On June 2, 2006, we and the individual defendants filed a motion to dismiss the Second Amended Complaint. On March 21, 2007, the Court granted defendants' motion and dismissed plaintiffs' Second Amended Complaint. The Court granted plaintiffs leave to file a Third Amended Complaint, which plaintiffs filed on May 25, 2007. On July 13, 2007, we and the individual defendants filed a motion to dismiss and a motion to strike the Third Amended Complaint. On March 14, 2008, the Court granted defendants' motion and dismissed plaintiffs' Third Amended Complaint. The Court granted plaintiffs leave to file a Fourth Amended Complaint, which plaintiffs filed on May 14, 2008. On June 13, 2008, consistent with the Court's March 14, 2008 dismissal order, we and the individual defendants filed objections to the form and content of the Fourth Amended Complaint. On July 24, 2008, the Court overruled the objections. On September 8, 2008, we and the individual defendants filed a motion to dismiss and a motion to strike certain allegations from the Fourth Amended Complaint. On March 27, 2009, the Court denied defendants' motion to dismiss and granted defendants' motion to strike.
Plaintiffs, the individual defendants and we have signed and filed a stipulation of settlement providing for the settlement of the case. Defendant Softbank is not a party to the settlement. Under the terms of the settlement, the individual defendants' and our insurers would pay the full amount of the settlement. On May 13, 2010, the Court granted preliminary approval of the settlement, and on August 31, 2010, the Court granted final approval of the settlement. On October 8, 2010, plaintiffs and Defendant Softbank filed a motion for preliminary approval of a separate settlement between plaintiffs and Defendant Softbank. On November 17, 2010, the Court granted preliminary approval of the settlement, and on February 9, 2011, the Court granted final approval of the settlement. The Court's decision is subject to appeal. If it is appealed, we may continue to incur costs with regard to discovery in connection with the litigation between plaintiffs and Defendant Softbank. Accordingly, we are unable at this time to estimate the effects of this lawsuit on our financial position, results of operations, or cash flows.
45
Governmental Investigations
In December 2005, the U.S. Embassy in Mongolia informed us that it had forwarded to the Department of Justice (the "DOJ") allegations that an agent of our Mongolia joint venture had offered payments to a Mongolian government official in possible violation of the Foreign Corrupt Practices Act (the "FCPA"). We, through our Audit Committee, authorized an independent investigation into possible violations of the FCPA, and we have been in contact with the DOJ and U.S. Securities and Exchange Commission (the "SEC") regarding the investigation. The investigation identified possible FCPA violations in Mongolia, Southeast Asia, India, and China, as well as possible violations of U.S. immigration laws. The DOJ requested that we voluntarily produce documents related to the investigation, the SEC subpoenaed us for documents, and we received a Grand Jury Subpoena requiring the production of documents related to one aspect of the DOJ investigation, that is, travel we had sponsored. We have resolved the investigations with the DOJ and the SEC. On December 21, 2009, as part of the resolution of these investigations, we executed a consent pursuant to which, without admitting or denying the SEC's allegations, we agreed to a judgment in favor of the SEC of $1.5 million, and agreed to certain reporting obligations for up to four years. The SEC approved that resolution. On April 14, 2010, the United States District Court for the Northern District of California entered a judgment incorporating the terms of that consent. On December 31, 2009, we entered into a non-prosecution agreement with the DOJ, pursuant to which we have paid an additional $1.5 million and agreed to undertake a three-year reporting obligation and to review and, where appropriate, strengthen our compliance, bookkeeping and internal controls standards and procedures. Under the non-prosecution agreement, subject to compliance with its terms, the DOJ has agreed not to criminally prosecute us for crimes (other than criminal tax violations) relating to certain travel arrangements we provided to customers in China. We submitted our first reports to the DOJ and SEC on May 1, 2010.
Shareholder Derivative Litigation
On November 17, 2006, a shareholder derivative complaint captioned Ernesto Espinoza v. Ying Wu et al., Case No. RG06298775, was filed against certain of our former officers and current and former directors in the Superior Court of the County of Alameda, California. The complaint alleges that the individual defendants, among other things, breached their duties, were unjustly enriched, and violated the California Corporations Code in connection with the timing of stock option grants. The complaint names us as a nominal defendant and seeks unspecified monetary damages against the individual defendants and various forms of injunctive relief. On February 2, 2007, we and the individual defendants filed demurrers against the complaint. On April 11, 2007, the Court sustained the individual defendants' demurrer, overruled our demurrer, ordered the plaintiff to file an amended complaint, and ordered us to answer the original complaint. The plaintiff filed an amended complaint and we have filed an answer to the amended complaint. On August 21, 2007, the individual defendants filed demurrers against the amended complaint. The Court sustained the individual defendants' demurrers and ordered the plaintiff to file a second amended complaint. On September 26, 2008, plaintiff filed his second amended complaint. On November 21, 2008, we and the individual defendants filed demurrers against the second amended complaint. On February 27, 2009, the Court sustained our demurrer and ordered the plaintiff to file a third amended complaint. On March 20, 2009, plaintiff filed his third amended complaint. On May 5, 2009, we and the individual defendants filed demurrers against the third amended complaint. On August 11, 2009, the Court sustained our demurrer without leave to amend. On October 13, 2009, plaintiffs filed a notice of appeal.
The parties have signed a final stipulation of settlement providing for the settlement of the case. The settlement is contingent on approval by the court. Under the terms of the settlement, the individual defendants' insurer would pay the full amount of the monetary portion of the settlement. On April 15, 2010, plaintiff filed a Request for Dismissal without prejudice with the Court of Appeals. On January 12, 2011, the Court of Appeals dismissed the appeal. Pursuant to the Request, the appeal may
46
be reinstated if the Superior Court does not grant preliminary or final approval of the settlement. There is no assurance that the settlement will receive court approval. Accordingly, we are unable at this time to estimate the effects of this lawsuit on our financial position, results of operations, or cash flows.
IPO Allocation
On October 31, 2001, a complaint was filed in United States District Court for the Southern District of New York against us, some of our directors and officers and various underwriters for our initial public offering. Substantially similar actions were filed concerning the initial public offerings for more than 300 different issuers, and the cases were coordinated as In re Initial Public Offerings Securities Litigation, Civil Action No. 01-CV-9604. Plaintiffs allege violations of the Securities Act of 1933 and the Securities Exchange Act of 1934 through undisclosed improper underwriting practices concerning the allocation of IPO shares in exchange for excessive brokerage commissions, agreements to purchase shares at higher prices in the aftermarket and misleading analyst reports. Plaintiffs seek unspecified damages on behalf of a purported class of purchasers of our common stock between March 2, 2000 and December 6, 2000. On February 19, 2003, the Court granted in part and denied in part a motion to dismiss the claims brought by defendants, including us. The order dismissed all claims against us except for a claim brought under Section 11 of the Securities Act of 1933, which alleges that the registration statement filed in accordance with the IPO was misleading.
The parties have reached a global settlement of the litigation. Under the settlement the insurers will pay the full amount of the settlement share allocated to us, and we will bear no financial liability. We, and other defendants will receive complete dismissals from the case. On October 5, 2009, the Court entered an Opinion and Order granting final approval of the settlement. Certain objectors have filed appeals; plaintiffs have filed motions to dismiss the appeals. No hearing date has been set. If for any reason the settlement does not become effective, we believe we have meritorious defenses to the claims and intend to defend the action vigorously. Accordingly, we are unable at this time to estimate the effects of this lawsuit on our financial position, results of operations, or cash flows.
Other Litigation
We are a party to other litigation matters and claims that are normal in the course of operations, and while the results of such litigation matters and claims cannot be predicted with certainty, we believe that the final outcome of such matters will not have a material adverse impact on our financial position, results of operations or cash flows.
47
ITEM 5—MARKET FOR UTSTARCOM, INC.'S COMMON EQUITY, RELATED STOCKHOLDER MATTERS, AND ISSUER PURCHASES OF EQUITY SECURITIES
| |
High | Low | ||||||
|---|---|---|---|---|---|---|---|---|
Fiscal 2010 |
||||||||
First Quarter |
$ | 2.98 | $ | 1.85 | ||||
Second Quarter |
$ | 3.26 | $ | 1.65 | ||||
Third Quarter |
$ | 2.31 | $ | 1.80 | ||||
Fourth Quarter |
$ | 2.58 | $ | 1.90 | ||||
Fiscal 2009 |
||||||||
First Quarter |
$ | 2.18 | $ | 0.63 | ||||
Second Quarter |
$ | 2.43 | $ | 0.74 | ||||
Third Quarter |
$ | 2.54 | $ | 1.39 | ||||
Fourth Quarter |
$ | 2.38 | $ | 1.65 | ||||
Our common stock has been traded on The NASDAQ Stock Market, LLC ("NASDAQ") under the symbol UTSI since our initial public offering on March 2, 2000. The preceding table sets forth the high and low sales prices per share of our common stock as reported on NASDAQ for the periods indicated. As of February 28, 2011, we had approximately 115 stockholders of record.
To date, we have not paid any cash dividends on our common stock. We currently anticipate that we will retain any available funds to finance the growth and operation of our business and we do not anticipate paying any cash dividends in the foreseeable future. Certain present or future agreements may limit or prevent the payment of dividends on our common stock. Additionally, our cash held in foreign countries may be subject to certain control limitations or repatriation requirements, limiting our ability to use this cash to pay dividends. See further discussion in the "Liquidity" section of Item 7, Management's Discussion and Analysis of Financial Condition and Results of Operation.
48
COMPANY'S STOCK PERFORMANCE
The graph below compares the cumulative 5-year total return of holders of UTStarcom, Inc.'s common stock with the cumulative total returns of the NASDAQ Composite index and the NASDAQ Telecommunications index. The graph tracks the performance of a $100 investment in our common stock and in each of the indexes (with the reinvestment of all dividends) from December 31, 2005 to December 31, 2010.
COMPARISON OF 5 YEAR CUMULATIVE TOTAL RETURN*
Among UTStarcom, Inc., the NASDAQ Composite Index
and the NASDAQ Telecommunications Index
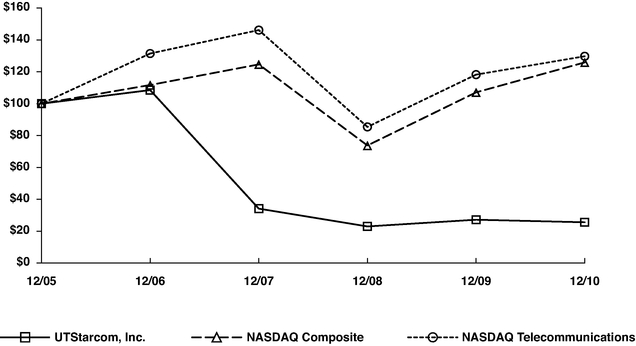
- *
- $100
invested on 12/31/05 in stock or index, including reinvestment of dividends.
Fiscal year ending December 31.
| |
12/05 | 12/06 | 12/07 | 12/08 | 12/09 | 12/10 | |||||||||||||
|---|---|---|---|---|---|---|---|---|---|---|---|---|---|---|---|---|---|---|---|
UTStarcom, Inc. |
100.00 | 108.56 | 34.12 | 22.95 | 27.17 | 25.56 | |||||||||||||
NASDAQ Composite |
100.00 | 111.74 | 124.67 | 73.77 | 107.12 | 125.93 | |||||||||||||
NASDAQ Telecommunications |
100.00 | 131.50 | 146.22 | 85.43 | 118.25 | 129.78 | |||||||||||||
The stock price performance included in this graph is not necessarily indicative of future stock price performance.
The information required by Item 5 with respect to securities authorized for issuance under equity compensation plans is incorporated by reference in Part III, Item 12 of this Form 10-K.
49
ITEM 6—SELECTED FINANCIAL DATA
The information set forth below is not necessarily indicative of results of future operations and should be read in conjunction with Item 7, "Management's Discussion and Analysis of Financial Condition and Results of Operations," and the Consolidated Financial Statements and notes thereto included in Item 8, "Financial Statements and Supplementary Data," of this Form 10-K, which are incorporated herein by reference, in order to understand further the factors that may affect the comparability of the financial data presented below.
| |
Years Ended December 31, | |||||||||||||||
|---|---|---|---|---|---|---|---|---|---|---|---|---|---|---|---|---|
| |
2010 | 2009 | 2008 | 2007 | 2006 | |||||||||||
| |
(in thousands, except per share amounts) |
|||||||||||||||
Consolidated Statement of Operations Data: |
||||||||||||||||
Net sales(1) |
$ | 291,535 | $ | 386,344 | $ | 1,640,449 | $ | 2,466,970 | $ | 2,458,861 | ||||||
Gross profit |
$ | 70,238 | $ | 64,979 | $ | 261,242 | $ | 321,451 | $ | 385,744 | ||||||
Operating loss(2) |
$ | (73,722 | ) | $ | (218,688 | ) | $ | (176,216 | ) | $ | (212,045 | ) | $ | (138,160 | ) | |
Net loss attributable to UTStarcom, Inc.(3) |
$ | (65,129 | ) | $ | (225,688 | ) | $ | (150,316 | ) | $ | (195,575 | ) | $ | (117,345 | ) | |
Net loss per share attributable to UTStarcom, Inc.—Basic and Diluted |
$ | (0.48 | ) | $ | (1.77 | ) | $ | (1.22 | ) | $ | (1.62 | ) | $ | (0.97 | ) | |
| |
Years Ended December 31, | |||||||||||||||
|---|---|---|---|---|---|---|---|---|---|---|---|---|---|---|---|---|
| |
2010 | 2009 | 2008 | 2007 | 2006 | |||||||||||
| |
(in thousands) |
|||||||||||||||
Consolidated Balance Sheet Data: |
||||||||||||||||
Cash and cash equivalents |
$ | 351,507 | $ | 265,843 | $ | 309,603 | $ | 437,449 | $ | 661,623 | ||||||
Working capital |
$ | 213,736 | $ | 94,591 | $ | 312,072 | $ | 389,750 | $ | 800,356 | ||||||
Total assets |
$ | 784,283 | $ | 929,111 | $ | 1,310,806 | $ | 1,984,588 | $ | 2,383,305 | ||||||
Total short-term debt |
$ | — | $ | — | $ | — | $ | 322,829 | $ | 102,758 | ||||||
Long-term debt |
$ | — | $ | — | $ | — | $ | 333 | $ | 275,161 | ||||||
Total UTStarcom, Inc. stockholders' equity |
$ | 240,929 | $ | 255,359 | $ | 466,834 | $ | 617,976 | $ | 774,360 | ||||||
- (1)
- On
July 1, 2008, we completed our divestiture of PCD. Revenue for the years ended December 31, 2008, 2007, and 2006 related to PCD was
$880 million, $1,664 million, and $1,339 million, respectively. In July 2009, we sold our Korea operations and at December 31, 2009, we have substantially completed the
wind-down of our worldwide handset operations.
- (2)
- The operating loss includes the following items:
| |
Years Ended December 31, | |||||||||||||||
|---|---|---|---|---|---|---|---|---|---|---|---|---|---|---|---|---|
| |
2010 | 2009 | 2008 | 2007 | 2006 | |||||||||||
| |
(in thousands) |
|||||||||||||||
Impairment of goodwill and other long-lived assets |
$ | — | $ | 33,287 | $ | 27,220 | $ | 19,912 | $ | — | ||||||
Restructuring |
$ | 16,018 | $ | 46,495 | $ | 13,059 | $ | 14,474 | $ | — | ||||||
Net gain on divestitures |
$ | (5,548 | ) | $ | (100 | ) | $ | (7,782 | ) | $ | (4,271 | ) | $ | (12,291 | ) | |
- (3)
- Net loss attributable to UTStarcom, Inc. for the years ended December 31, 2010 and 2009 included no significant non-operating income or expense items. In addition to the items included in the operating losses discussed above, net loss attributable to UTStarcom, Inc. for the year ended December 31, 2008 included $47.9 million gain from sale of certain investments and liquidation of investment in a variable interest entity. Net loss attributable to UTStarcom, Inc. for the year ended December 31, 2007 included $53.7 million gain from sale of certain investments. Net loss attributable to UTStarcom, Inc. for the year ended December 31, 2006 included a $13.5 million charge associated with the other-than-temporary impairment of a long-term investment.
50
ITEM 7—MANAGEMENT'S DISCUSSION AND ANALYSIS OF FINANCIAL CONDITION AND RESULTS OF OPERATIONS
This Annual Report on Form 10-K contains forward-looking statements regarding future events and our future results that are subject to the safe harbors created under the Securities Act of 1933 and the Securities Exchange Act of 1934. Forward-looking statements are based on current expectations, estimates, forecasts and projections about us, our future performance and the industries in which we operate as well as on our management's assumptions and beliefs. Such statements relate to, among other things, our business expectations regarding contract awards and telecom carriers, our plan to expand our market position in Internet Protocol-based and broadband products, our expectations regarding the growth rates and telecom capital expenditure budgets of certain geographic regions, our plan to grow in certain geographic regions, our expectations regarding growth in certain segments, uncertainties in obtaining future contracts in India, our intention to make significant investment in research and development, our expectations regarding our relationship with the Beijing Development Authority, our expectations regarding the PAS and IPTV markets, our plans, our expected financial results, our expectations about our efforts to streamline our operations, new accounting pronouncements, liquidity and access to credit facilities and cash in our China subsidiary, the terms and completion of our proposed reorganization, the change in our place of incorporation, the manner of conduct of our business following completion of the reorganization, UTStarcom Cayman's qualification as a foreign private issuer and the reduction in operating expenses resulting therefrom and the listing of UTStarcom Cayman's ordinary shares on The NASDAQ Stock Market. Statements that contain words like "expects," "anticipates," "may," "will," "targets," "projects," "intends," "plans," "believes," "seeks," "estimates," or variations of such words and similar expressions are also forward-looking statements.
Readers are cautioned that these forward-looking statements are only predictions and are subject to risks and uncertainties related to, among other things, our ability to execute on our business plan and implement certain restructuring actions, China's control of currency exchanges, the decline in the PAS market, ongoing litigation, our ability to introduce and deploy Internet Protocol-based technologies and products, our ability to satisfy certain security and supply chain standards in India, impact of economic and/or political risks in Asia on our customers' investment decisions, the number of competitors and the composition of competitors, additional warranty expense and inventory reserves, availability of future financing, the ability of the parties to the reorganization to consummate the proposed transaction, the satisfaction of closing conditions to consummate the transaction and obtaining requisite approvals, including from the Company's stockholders, the ability of UTStarcom Cayman to qualify and maintain its status as a foreign private issuer, the Company's ability to realize the anticipated reduction in operating expenses and other items discussed in "Part I, Item 1A-Risk Factors" of this Form 10-K. Therefore, actual results may differ materially and adversely from those expressed in any forward-looking statements. We do not guarantee future results, and actual results, developments and business decisions may differ from those contemplated by the forward-looking statements. We undertake no obligation to update these forward-looking statements to reflect events or circumstances occurring after the date of this Form 10-K.
OVERVIEW
We are one of the leading provider of IP-based network solutions including the integration and support services in IPTV, Interactive ("iD") TV, Internet TV and Broadband for cable and telecom operators. Our focus is to design and sell IP-based telecommunications infrastructure products including our primary product suite of IPTV, and broadband solutions along with the ongoing services relating to the installation, operation and maintenance of these products. Collectively our range of solutions is designed to expand and modernize telecommunications networks through smooth network system
51
integration, lower operating costs and increased broadband access. We also provide the carriers with increased revenue opportunities by enhancing their subscribers' user experience. The majority of our business is based in China, Japan, India and other Asia markets. We also continue to maintain a presence in selective markets in Latin America and Europe.
We differentiate ourselves with products designed to reduce network complexity, integrate high performance capabilities and allow a simple transition to next generation networks. We design our products to facilitate cost-effective and efficient deployment, maintenance and upgrades.
Because our products are IP-based, our customers can more easily integrate our products with other industry standard hardware and software. Additionally, we believe we can introduce new features and enhancements that can be cost-effectively added to our customers' existing networks. IP-based devices can be changed or upgraded in modules, saving our customers the expense of replacing their entire system installation. Our strategic priorities are summarized as follows:
- •
- Focus primarily on providing a suite of IP-based solutions including our main product suite comprised of IPTV
and broadband products and related services.
- •
- Maintain our leadership position in China and India while solidifying our presence in selective geographical markets in
Asia.
- •
- Leverage our strong reputation with telecom carriers and our ability to solve complex network problems.
- •
- Improve our financial position by executing announced restructuring initiatives and reducing operating expense levels.
In October 2010, we announced several critical shifts in our business strategy, including an increased focus on the Chinese and Asian markets, the pursuit of telecom and cable network customers in parallel and using our expertise in building and operating technology and service platforms for IPTV and Internet TV to sell more end-to-end solutions to service providers.
Sale Leaseback Transaction and Early Termination of Hangzhou Building
In December 2009, we entered into a Property Transfer and Leaseback Agreement (the "Sale Leaseback Agreement") for the sale of our manufacturing, research and development and administrative office facility in Hangzhou, China (the "Hangzhou facility") to a third party for proceeds of approximately $138.8 million and the leaseback of approximately one-third of the property through 2016. As of May 31, 2010, we had received all of the sales proceeds and met all criteria for consummation of sale of the Hangzhou facility. On May 31, 2010, the buyer and us agreed that all conditions precedent to the closing had been met and the leaseback commenced on June 1, 2010. On December 8, we formally notified the landlord of our decision to early terminate the lease in June 2011.The termination clause requires the Company to pay total penalties of $9.5 million. A termination penalty charge of $1.3 million was recorded in December 2010 as a result of the full termination penalty off set by the release of the deferred gain and deferred rental liabilities other than the portion that would have been normally amortized in the next six month period to June 8, 2011 if there were no early termination. As of December 31, 2010, the Company has a net balance of $4.0 million related to the early termination penalty recorded in Other Liabilities which consists of the $9.5 million total penalty less the prepaid rent and security deposit paid in the second quarter of 2010. See Note 6 of Notes to our Consolidated Financial Statements included under Part II, Item 8 of this Annual Report on Form 10-K.
52
Divestitures
On July 1, 2008, we sold UTStarcom Personal Communications LLC, a wholly-owned subsidiary of the Company ("PCD"), to an entity controlled by AIG Global Investment Group and certain other investors for a total sale consideration of approximately $237.7 million. Additionally, on July 31, 2008, we completed the divestiture of our Mobile Solutions Business Unit ("MSBU") to a global private equity firm. On July 31, 2009, we completed a sale of its Korea operations to an entity founded by a former employee and received total consideration of approximately $2.0 million. In January 2010, we completed a sale of certain assets and liabilities related to our Remote Access Server ("RAS") product line and received total consideration of approximately $1.5 million. In June 2010, we completed a sale of our IP Messaging and US PDSN Assets which were located in North America, Caribbean, and Latin America regions and were part of the Multimedia Communications segment. We received consideration of approximately $0.9 million as of December 31, 2010. In September 2010, we entered into an agreement to transfer our EMEA ("Europe, Middle East and Africa") operations for no consideration. In the third quarter of 2010, we recognized expenses of approximately $0.9 million as a divestiture loss for our obligations primarily arising out of local statutory requirements such as severance fund for transferred employees and other miscellaneous operational costs. In the third quarter of 2010, we completed a sale of our China PDSN assets and recorded a gain of $1.6 million. See Note 3 of Notes to our Consolidated Financial Statements included under Part II, Item 8 of this Annual Report on Form 10-K.
Restructuring Programs
On June 9, 2009, our Board of Directors approved a restructuring plan (the "2009 Restructuring Plan") designed to reduce our operating costs. The 2009 Restructuring Plan includes a worldwide reduction in force of approximately 50% of our headcount, or approximately 2,300 employees located primarily in China and the United States and, to a lesser degree, other international locations. During 2010, we recorded restructuring costs of approximately $15.7 million related to the 2009 Restructuring Plan and prior year restructuring plans. We will continue our efforts to evaluate certain operations and will consider opportunities to divest additional non-core assets and may incur additional costs associated with future actions to further align our business operations and streamline our business processes.
Investments
During the first quarter of 2008, we sold our remaining investment in Gemdale Co., Ltd ("Gemdale") for approximately $32.9 million and recognized a gain of $32.4 million in other income, net. We also sold our investment in Infinera Corporation ("Infinera") for approximately $9.2 million and recognized a gain of $7.3 million in other income, net. During 2009, we recorded approximately $5.5 million of other-than-temporary impairment charges related to our investments in MRV Communications ("MRV") and Xalted Networks ("Xalted"). During the fourth quarter of 2009, we sold our investment in MRV for approximately $1.0 million and recognized a gain of approximately $0.4 million. See Note 4 of Notes to our Consolidated Financial Statements included under Part II, Item 8 of this Annual Report on Form 10-K.
In December 2010, we invested $2.1 million into ACELAND Investments Limited ("ACELAND"). ACELAND was formed by ZTE H.K Limited and us, and the investment objective is to participate in the investment in Wireless City Planning operated by Softbank to develop XGP business. We own approximately 35% interest of ACELAND at December 31, 2010 and accounts for the investment in ACELAND using the equity method.
53
Acquisition
On October 16, 2010, we entered into an Ordinary Shares Purchase Agreement with Stage Smart Limited ("Stage Smart") and Smart Frontier Holdings Limited ("Smart Frontier"), the sole shareholder of Stage Smart, to enable us to launch an internet TV platform to generate revenue through subscription, advertising and value-added service in the coming years. Pursuant to the Ordinary Shares Purchase Agreement, we agreed to purchase from Smart Frontier 5,100,000 ordinary shares of Stage Smart held by Smart Frontier (the "Purchase Shares") for an aggregate purchase price of $10.0 million paid in the form of the number of shares of our common stock calculated by dividing $10.0 million by the average closing price per share of our common stock quoted on the NASDAQ stock market for the thirty day period immediately preceding the date of closing of the transaction which closely approximates the market value on the day of issuance. Pursuant to the Ordinary Shares Purchase Agreement, the Company has the right to repurchase the Company's shares issued as part of the consideration to Stage Smart Shareholders if by the one year anniversary of the closing date regulatory approvals have not been obtained as outlined in the post-closing covenants. Concurrent with entering into the Ordinary Shares Purchase Agreement, we also entered into a Series A Preference Shares Purchase Agreement with Stage Smart and its affiliated entity, its wholly owned subsidiaries, and Smart Frontier. Pursuant to the Series A Preference Shares Purchase Agreement, we agreed to purchase from Stage Smart 9,600,000 Series A Preference Shares of Stage Smart at a price of $2.08333 per share, for an aggregate consideration of $20.0 million payable in cash. The Purchase Shares and the Series A Preference Shares together constitute 75% of the total shares of Stage Smart which gives the Company control over Stage Smart. From the date of acquisition of November 8, 2010, Stage Smart and its affiliated entity and its wholly owned subsidiary will be consolidated into our results. We recorded intangible assets and goodwill of $5.0 million and $13.8 million, respectively. See Note 11 of Notes to our Consolidated Financial Statements included under Part II, Item 8 of this Annual Report on Form 10-K.
Decline in PAS Business and Wind-down of Handset Segment
We expect PAS networks will be phased out by January 1, 2012. MIIT has granted 3G mobile licenses to China Telecom, China Mobile and China Unicom. On January 9, 2009, the MIIT officially issued a notice to unconditionally phase out the Personal Handy-phone System ("PHS") by the end of 2011 to guarantee the bandwidth for China's 3G services. Consequently, in the fourth quarter of 2009, we have determined the remaining expected period of support for our PAS infrastructure products sold in prior years as 2 years and hence the remaining deferred revenue associated with PAS infrastructure will be recognized ratably through the fourth quarter of 2011. For additional discussion see "Results of Operations-Net Sales" section of this Item 7.
We have completed the wind-down of our worldwide handset operations and thus have not had significant revenue and gross margin in 2010, except for sales related to inventory clearing, and do not expect any in 2011 and beyond.
Strategic Investment and Changes in Management and the Board of Directors
On February 1, 2010, we entered into agreements for a strategic relationship with Beijing E-town International Investment and Development Co., Ltd ("BEIID"), an investment company established by the Beijing Municipality which includes a proposed investment in the common stock of the Company by BEIID and two unrelated investment funds, Elite Noble Limited and Shah Capital Opportunity Fund LP. The stock purchase agreements were subsequently amended on May 4, 2010, June 4, 2010 and July 7, 2010, respectively. These investment transactions closed in September 2010. Under the terms of agreements, as revised, we received cash of $34.6 million and issued approximately 18.1 million shares of common stock and an option to purchase up to an additional 4.0 million shares
54
of common stock for approximately $8.1 million through November 8, 2010. The option had expired unexercised as of December 31, 2010.
In connection with the transaction and in furtherance of our strategic goals in China, Ying (Jack) Lu was appointed our new Chief Executive Officer and President effective upon the closing of the investment. From March 1, 2010, until he assumed the CEO position, he served as the Company's Chief Operating Officer. On September 7, 2010, Peter Blackmore resigned as our CEO and President upon Ying (Jack) Lu's assumption of the CEO position. Upon the closing of the transaction, three new members were appointed as directors to our board of directors, and two then current board members resigned at that time. The total number of directors on the board was increased from six to seven in connection with the transaction.
We also moved our operational headquarters from Alameda, California to Beijing, China as part of an agreement with Beijing Development Authority, which is related to the Beijing Municipality. That agreement was effective upon closing of the BEIID investment. As part of the agreement, we will be able to apply to Beijing Development Area for tax incentives and other financial and non-financial assistance to the Company. We have retained all of our operations in Hangzhou and Shenzhen, China.
Management believes these strategic changes are consistent with our growth strategy of focusing on selective IP-based infrastructure products and services in high growth regions of Asia, particularly China. Management believes our growth strategy is in good alignment with the series of guidelines recently issued by China's State Council to push forward network convergence among telecom, cable television, and internet companies. We believe this relationship will contribute significant financial and strategic value, including strengthening our relationships and presence in China, and better positioning us to achieve profitable growth in the future.
RESULTS OF OPERATIONS
To align the business units with our corporate strategy to focus on core businesses, on July 1, 2008 we sold our Personal Communications Division ("PCD") to PCD LLC (see Note 3 of Notes to our Consolidated Financial Statements included under Part II, Item 8 of this Annual Report on Form 10-K). Prior to July 1, 2008, PCD sold and supported handsets other than PAS handsets, mainly in the United States.
Included in the Other Segment were Mobile Solutions Business Unit ("MSBU") and Custom Solutions Business Unit ("CSBU"). On July 31, 2008, we sold MSBU which was responsible for the development, sales and service of our wireless IPCDMA/IPGSM product line. In the first quarter of 2009, we completed the wind-down of CSBU and the consolidation of voice messaging technology into our Multimedia Communications segment. CSBU historically had been responsible for the development, sales and service of other non-core products. The consolidation of voice messaging technology into the Multimedia Communications segment did not have a significant impact on segment net sales or gross profit.
In order to optimize our resources and improve efficiency, beginning on January 1, 2010 we integrated our Services Segment into our Multimedia Communications and Broadband Infrastructure segments based on products for which services are performed. As we substantially completed the wind-down of our handsets business in the fourth quarter of 2009, except for sales relating to inventory clearing, we did not have any significant revenue from our handset segment in 2010 and do not expect any in 2011 and beyond. Effective January 1, 2010, the new reporting segments are as follows:
- •
- Multimedia Communications—Focused on development and market opportunities in IPTV solutions and Wireless
infrastructure technologies, including related services revenue.
- •
- Broadband Infrastructure—Focused on our world class portfolio of broadband products, including related services revenue.
55
- •
- Handsets—Focused on mobile phone business including PAS and CDMA handset market, as well as data cards markets. Handset sales to PCD LLC, which commenced after the July 1, 2008 sale of PCD, are included in this segment.
We have reclassified our previously reported segment information for the year ended December 31, 2009 and 2008 to conform to the current segment presentation.
NET SALES
| |
Years Ended December 31, | ||||||||||||||||||
|---|---|---|---|---|---|---|---|---|---|---|---|---|---|---|---|---|---|---|---|
| |
2010 | % of net sales |
2009 | % of net sales |
2008 | % of net sales |
|||||||||||||
| |
(in thousands, except percentages) |
||||||||||||||||||
Net Sales by Segment |
|||||||||||||||||||
Multimedia Communication |
$ | 175,047 | 60 | % | $ | 177,080 | 46 | % | $ | 319,792 | 19 | % | |||||||
Broadband Infrastructure |
109,966 | 38 | % | 107,264 | 28 | % | 129,372 | 8 | % | ||||||||||
Handsets |
6,522 | 2 | % | 102,000 | 26 | % | 287,607 | 18 | % | ||||||||||
PCD |
— | — | — | — | 879,588 | 54 | % | ||||||||||||
Others |
— | — | — | — | $ | 24,090 | 1 | % | |||||||||||
|
$ | 291,535 | 100 | % | $ | 386,344 | 100 | % | $ | 1,640,449 | 100 | % | |||||||
Net Sales by Region |
|||||||||||||||||||
United States |
$ | 5,903 | 2 | % | $ | 78,806 | 21 | % | $ | 1,003,072 | 61 | % | |||||||
China |
166,621 | 57 | % | 177,147 | 46 | % | $ | 435,846 | 27 | % | |||||||||
India |
31,426 | 11 | % | 62,859 | 16 | % | $ | 28,166 | 2 | % | |||||||||
Japan |
48,217 | 17 | % | 29,361 | 7 | % | $ | 40,644 | 2 | % | |||||||||
Other |
39,368 | 13 | % | 38,171 | 10 | % | $ | 132,721 | 8 | % | |||||||||
|
$ | 291,535 | 100 | % | $ | 386,344 | 100 | % | $ | 1,640,449 | 100 | % | |||||||
Fiscal 2010 vs. 2009
Net sales decreased by 25% to $291.5 million for 2010 compared to $386.3 million for 2009. The decrease was primarily due to the wind-down of our handset business which resulted in a decrease of $95.5 million in revenue. This decrease was partially offset by the $2.7 million increase in sales of Broadband Infrastructure segment mainly due to more TN product sales to international customers. Multimedia Communications net sales were $175.0 million for the year ended December 31, 2010 as compared to $177.1 million for 2009, mainly due to the decrease in revenue of all the Multimedia Communications product lines except STB and IP Signage product and partially offset by the accelerated amortization of PAS deferred product revenue.
For additional discussion, see the "Segment Reporting" section of this Item 7.
In 2010 and beyond, we do not expect significant new contracts for our PAS handsets and infrastructure equipment. As of December 31, 2010, we have approximately $93.4 million of deferred revenue associated with PAS infrastructure sales to be recognized ratably over the expected period of support through December 2011. We review assumptions regarding the estimated post contract support periods on a regular basis. Due to the China telecommunication industry restructuring and launching of 3G services in China, the Ministry of Industry and Information Technology of China announced that PAS services in China will be phased out by January 1, 2012. In the fourth quarter of 2009, we determined the remaining expected period of support for PAS infrastructure products as 2 years and hence deferred revenue associated with PAS infrastructure is being recognized ratably beginning in the fourth quarter of 2009 through the fourth quarter of 2011. As a result of this change, net sales and gross profit in the year ended December 31, 2010 were increased by approximately $44.7 million and
56
$15.7 million respectively, compared to the same periods in 2009. As in 2010, we expect 2011 total net sales and gross profit associated with the amortization of all PAS-related deferred revenue to approximate $93.0 million and $33.0 million, respectively.
The economic uncertainty that we are operating in today could adversely impact our business. However, the majority of our business is based in China and India—two countries that are still projected to have economic growth in 2011. We currently offer and have initial market acceptance of our IPTV products in China, India, Taiwan and other geographic regions. We believe that the IPTV market presents a meaningful growth opportunity in these regions as well as other regions where we have targeted to expand our IPTV offerings. Also in India, our sales cycle related to infrastructure expansion has been extended which will result in uncertainty in obtaining future contracts. Our growth in India, however, may be adversely impacted by recent changes in India requiring all manufacturers to satisfy certain security and supply chain standards to the satisfaction of Indian authorities. We are pursuing alternative long-term solutions and working with the carriers who purchase our products to ensure we can satisfy these new requirements.
Fiscal 2009 vs. 2008
Net sales decreased by 76%, or $1,254.1 million for 2009 compared to 2008. The decrease was primarily due to disposal of PCD and MSBU in 2008 and disbandment of the operations formerly included in the Other segment in the first quarter of 2009. The PCD and Other segments accounted for $903.7 million of the decrease. Net sales for the segments other than the PCD and Other decreased by $350.4 million or 48%. Multimedia Communications net sales decreased by $142.7 million, or 45% for 2009 compared to 2008, mainly due to continued weakening demand for our PAS Infrastructure products, decrease in NGN and TD-SCDMA sales partially offset by increase in IPTV related products and IP messaging product sales, as well as recognition of additional revenue related to our PAS Infrastructure product due to the acceleration of deferred revenue amortization beginning in November 2009. Broadband Infrastructure segment net sales decreased by $22.1 million or 17% for 2009 compared to 2008, mainly due to decrease in sales of all major product lines except of MSAN, GEPON and service. Handsets segment net sales decreased by $185.6 million, or 65% primarily due to the declines of our PAS handsets sales, GSM handsets sales and CDMA handsets sales to PCD LLC, partially offset by the increase of CDMA handsets sales in China.
GROSS PROFIT
| |
Years Ended December 31, | ||||||||||||||||||
|---|---|---|---|---|---|---|---|---|---|---|---|---|---|---|---|---|---|---|---|
| |
2010 | Gross Profit % |
2009 | Gross Profit % |
2008 | Gross Profit % |
|||||||||||||
| |
(in thousands, except percentages) |
||||||||||||||||||
Gross profit (loss) by Segment |
|||||||||||||||||||
Multimedia Communication |
$ | 49,849 | 28 | % | $ | 69,691 | 39 | % | $ | 139,662 | 44 | % | |||||||
Broadband Infrastructure |
15,063 | 14 | % | 14,270 | 13 | % | 1,341 | 1 | % | ||||||||||
Handsets |
5,326 | 82 | % | (18,982 | ) | (19 | )% | 39,015 | 14 | % | |||||||||
PCD |
— | — | — | — | 69,005 | 8 | % | ||||||||||||
Others |
— | — | — | — | 12,219 | 51 | % | ||||||||||||
|
$ | 70,238 | 24 | % | $ | 64,979 | 17 | % | $ | 261,242 | 16 | % | |||||||
Cost of sales consists primarily of material and labor costs associated with manufacturing, assembly and testing of products, costs associated with installation and customer training, warranty costs, fees to agents, inventory and contract loss provisions and overhead. Cost of sales also includes import taxes and tariffs on components and assemblies. Some components and materials used in our products are purchased from a single supplier or a limited group of suppliers and, in some cases, are subject to our
57
obtaining Chinese import permits and approvals. We also relied on third party manufacturers to manufacture and assemble most of our CDMA handsets.
Our gross profit has been affected by average selling prices, material costs, product mix, the impact of warranty charges and contract loss provisions, as well as inventory write-downs and release of deferred revenues and related costs pertaining to prior years. Our gross profit, as a percentage of net sales, varies among our product families. We expect that our overall gross profit, as a percentage of net sales, will fluctuate in the future as a result of shifts in product mix, stage of product life cycle, decreases in average selling prices and our ability to reduce cost of sales.
Fiscal 2010 vs. 2009
Gross profit was $70.2 million, or 24% of net sales for 2010 compared to $65.0 million, or 17% of net sales for 2009. There was $24.3 million gross profit increase in Handset segment for 2010 compared to 2009. Gross profit in Handset segment of $5.3 million for 2010 related primarily to clearing of remaining handsets inventory, compared with negative gross profit of $19.0 million for 2009 which was impacted by additional inventory write-down of $26.0 million and claim settlements with PCD LLC of $11.1 million, partially offset by an $8.5 million decrease to cost of sales in the Handsets segment resulting from the amortization of the Marvell Technology Group Ltd. ("Marvell") supply agreement during the first quarter of 2009. Compared to 2009, Broadband Infrastructure segment contributed $0.8 million increase in gross profit in 2010, primarily due to increased sales of higher margin TN products, partially offset by a $14.6 million in inventory write-down in 2010 for MSAN and MSTP products for two international customer contracts due to reductions in demand. The gross margin from Multimedia Communications decreased by $19.8 million, primarily due to decreased sales in all the major product lines and service revenue, partially offset by a $6.0 million benefit in 2010 from the release of accrued third party commissions as a result of expiration of statute of limitations, and a benefit from the acceleration of PAS deferred product revenue amortization which contributed an increase in gross profit of $15.7 million.
For additional discussion, see "Segment Reporting" section of this Item 7.
Fiscal 2009 vs. 2008
Gross profit was $65.0 million, or 17% of net sales for 2009, compared to $261.2 million, or 16% of net sales for 2008. The overall gross profit decrease in absolute dollars was primarily due to overall decrease in sales and the disposal of PCD and MSBU in 2008 and disbandment of the operations formerly included in the Other segment in the first quarter of 2009. PCD and Other segments in aggregate accounted for $81.2 million decrease in gross profit for 2009. Gross profit for the segments other than PCD and Other decreased by $115.0 million for 2009 as compared to 2008. This decrease was primarily due to decrease in sales, additional inventory write-downs and claim settlement related to certain handsets sold to PCD LLC for the Handsets segments, and decrease in sales of higher margin Multimedia Communications products during 2009, partially offset by an $8.5 million decrease to cost of sales in the Handsets segment resulting from the amortization of the Marvell supply agreement during the first quarter of 2009 (See Note 3 of Notes to our Consolidated Financial Statements included under Part II, Item 8 of this Annual Report on Form 10-K.)
58
OPERATING EXPENSES
The following table summarizes our operating expenses:
| |
Years Ended December 31, | ||||||||||||||||||
|---|---|---|---|---|---|---|---|---|---|---|---|---|---|---|---|---|---|---|---|
| |
2010 | % of net sales |
2009 | % of net sales |
2008 | % of net sales |
|||||||||||||
| |
(in thousands, except percentages) |
||||||||||||||||||
Selling, general and administrative |
$ | 95,240 | 33 | % | $ | 140,742 | 36 | % | $ | 257,559 | 16 | % | |||||||
Research and development |
38,044 | 13 | % | 63,243 | 16 | % | 143,291 | 9 | % | ||||||||||
Amortizization of intangible assets |
206 | — | — | — | 4,111 | 0 | % | ||||||||||||
Impairment of goodwill and other long-lived assets |
— | — | 33,287 | 9 | % | 27,220 | 2 | % | |||||||||||
Restructuring |
16,018 | 5 | % | 46,495 | 12 | % | 13,059 | 1 | % | ||||||||||
Net gain on divestitures |
(5,548 | ) | (2 | )% | (100 | ) | 0 | % | (7,782 | ) | (1 | )% | |||||||
Total operating expenses |
$ | 143,960 | 49 | % | $ | 283,667 | 73 | % | $ | 437,458 | 27 | % | |||||||
Selling, general and administrative expenses ("SG&A") include compensation and benefits, professional fees, sales commissions, provision for doubtful accounts receivable and travel and entertainment costs. Research and development expenses consist primarily of compensation and benefits of employees engaged in research, design and development activities, costs of parts for prototypes, equipment depreciation and third party development expenses. We believe that continued and prudent investment in research and development is critical to our long-term success, and we will aggressively evaluate appropriate investment levels. A portion of our costs are fixed and are difficult to quickly reduce in periods of lower sales.
SELLING, GENERAL AND ADMINISTRATIVE
Fiscal 2010 vs. 2009
SG&A expenses were $95.2 million for 2010, a decrease of $45.5 million as compared to $140.7 million for 2009. The decrease in SG&A expense was primarily due to a $35.6 million decrease in personnel related expenses as a result of our restructuring actions and recent cost reduction measures, a $8.7 million reduction in legal and accounting fees as a result of reduced activity in investigations and litigation, a $2.6 million reduction in advertising and marketing, sales promotions, as well as shows and exhibits expenses due to reduced sales activities, a $6.9 million decrease in facilities and facilities-related expenses, and a $1.0 million reduction in insurance as a result of reduced business operations worldwide. These cost savings were partially offset by a $5.5 million provision for doubtful accounts related to aging receivables compared to $6.6 million recovery of doubtful accounts in the same period of 2009 resulting primarily from collection of long-aged receivables.
Fiscal 2009 vs. 2008
SG&A expenses were $140.7 million for 2009, a decrease of $116.8 million as compared to $257.6 million for 2008. The decrease in SG&A expense was primarily due to a $14.4 million decrease in SG&A expenses related to divested operations, primarily PCD and MSBU, a $41.8 million decrease in personnel related expenses due to continuous streamlining of operations and cost reduction measures, a $14.7 million reduction in legal and accounting fees as a result of a $3.5 million receipt related to a legal settlement of the Starent patent litigation during the fourth quarter of 2009 as well as reduced activity in investigations and litigation, a $9.7 million decrease in depreciation expense due to assets impairment write-offs in 2008, a $10.4 million savings from reduction in the use of outside services, a $7.9 million decrease in travel related expenses due to reduced travel activity and cost containment efforts, a $7.3 million reduction in advertising and marketing, sales promotions, as well as
59
shows and exhibits expenses due to reduced sales activities, a $2.9 million decrease in facility related expense, a $1.0 million increase in recovery of doubtful account as a result of continued effort in collection, a $1.2 million increase in net gain on disposed assets, a $2.1 million reduction in other taxes, fees, licenses, a $1.2 million reduction in insurance premium and a $1.2 million decrease in equipment expense as we continued to streamline our operations.
RESEARCH AND DEVELOPMENT
Fiscal 2010 vs. 2009
R&D expenses decreased by $25.2 million for 2010 compared to 2009. The decrease was mainly due to a $19.3 million decrease in personnel and personnel related expense as a result of our restructuring actions, $2.0 million savings from reduction in the use of outside services, and a total of $5.0 million decrease in depreciation, software license, parts and facilities related expenses as we continued to streamline our operations.
Fiscal 2009 vs. 2008
R&D expenses decreased by $80.0 million during 2009 compared to 2008. In July 2008, we sold PCD and MSBU which resulted in aggregated R&D savings of $10.4 million for 2009. In addition, the decrease was also due to a $41.4 million decrease in personnel related expenses as we continued to streamline our R&D operations and reduced spending in non-core business units, a $12.0 million savings from reduction in use of outside services primarily due to wind-down of the Korea operation, a $3.7 million decrease in travel related expenses due to reduced travel activity, a $3.8 million decrease in facility related expense, a $3.4 million decrease in depreciation and a $4.8 million decrease in software license and parts expenses as we continued to streamline our operations.
STOCK-BASED COMPENSATION EXPENSE
At December 31, 2010, there was approximately $2.8 million of total unrecognized compensation cost, as measured, related to non-vested stock options and restricted stock and restricted stock units, which is expected to be recognized over a weighted-average period of 2.25 years. The following table summarizes the stock-based compensation expense in our consolidated statement of operations:
| |
Years Ended December 31, | ||||||||||
|---|---|---|---|---|---|---|---|---|---|---|---|
| |
2010 | 2009 | 2008 | ||||||||
| |
(in thousands) |
||||||||||
Cost of net sales |
$ | 166 | $ | 662 | $ | 1,306 | |||||
Selling, general and administrative |
4,600 | 7,146 | 15,652 | ||||||||
Research and development |
784 | 1,509 | 3,607 | ||||||||
Restructuring |
2,052 | 2,777 | — | ||||||||
Total |
$ | 7,602 | $ | 12,094 | $ | 20,565 | |||||
Fiscal 2010 vs. 2009
The decrease in stock-based compensation expense in 2010 compared to 2009 was primarily due to the reduced headcount as a result of workforce reductions that continued in 2010, and the decrease in equity awards granted in 2010. Based on the foregoing factors, we do not expect stock-based compensation expense to increase for fiscal year 2011.
60
Fiscal 2009 vs. 2008
The decrease in stock-based compensation expense in 2009 compared to 2008 was primarily due to the reduced headcount as a result of workforce reductions in the second half of 2008 and throughout 2009, higher valued equity awards becoming fully vested in 2009, and the decrease in equity awards granted in 2009.
AMORTIZATION OF INTANGIBLE ASSETS
Fiscal 2010 vs. 2009
The amortization of intangible assets acquired in the Stage Smart investment in 2010 was $0.2 million. There was no amortization of intangible assets in 2009.
Fiscal 2009 vs. 2008
There was no amortization of intangible assets in 2009 compared to $4.1 million in 2008. An impairment charge of $4.9 million was recorded in the fourth quarter of 2008 to fully write-off the remaining carrying value of intangible assets at December 31, 2008.
ASSET IMPAIRMENT
Fiscal 2010
Following our annual impairment review, we concluded no assets were impaired as of December 31, 2010.
Fiscal 2009
In June 2009, we announced our intention to consider a potential sale of our manufacturing, research and development, and administrative offices facility in Hangzhou, China. In December 2009, we entered into a Sale Leaseback Agreement for the intended sale of the property to another party for approximately $138.8 million and the leaseback of a portion of the property through 2016. As of May 31, 2010, we had received all of the sales proceeds and met all criteria for consummation of sale of the Hangzhou facility. On May 31, 2010, the buyer and we agreed that all conditions precedent to the closing had been met and the leaseback commenced on June 1, 2010.
During the third quarter of 2009, we contracted with a commercial real estate agent to assist in evaluating a potential sale of the facility. Furthermore, in October 2009, we initiated actions to consolidate our use of the facility to reduce our operating costs that revised our projected occupancy needs. In light of these developments, we performed a recoverability assessment of the facility as of September 30, 2009. Impairment testing performed by us for the third quarter of 2009, utilizing an income approach, indicated that the fair value approximated the carrying value of the Hangzhou facility as of September 30, 2009 of $160.5 million, and no impairment was recorded with respect to this property. The income approach was used as a result of the lack of preliminary offers and available comparable market transaction activity to place reliance on the market valuation approach. However, during the fourth quarter of 2009, the Sale Leaseback Agreement received from the buyer gave us a better indication of the property's fair value, and revealed that the value of the property to an interested third party was lower than the fair value we had previously estimated using the income approach. The building is approximately 2.7 million square feet and unique in its design. Based on the uniqueness of the building and the fact that only a single offer for the building had been received after having it on the market for several months management determined that a third party offer was a better indication of the fair value than other methods because the offer was specific to the property representing direct evidence of the fair value. Based on this offer, we determined that the property had a net book value in excess of its fair value. Due to the apparent decline in value, we conducted a
61
recoverability test for this entity-wide asset and determined the carrying value of our net assets exceeded the undiscounted cash flows expected to result from the use and eventual disposition of the asset group. In our assessment of fair value, management had placed primary reliance on the market approach (the third party offer). The result of this analysis reduced our overall assessment of fair value of the property by $33.3 million. Accordingly, we recorded a non-cash impairment charge of $33.3 million during the fourth quarter of 2009. The adjusted carrying value of $125.7 million of the property was lower than the pending sales price because the valuation performed factored in the above-market rental rates to be paid by the Company as stipulated in the leaseback agreement accompanying the sale. Our overall assessment of fair value of the property was based on Level 2 inputs, defined as inputs other than quoted market prices in active markets that are observable either directly or indirectly.
Fiscal 2008
We performed a recoverability test on our property, plant and equipment assets as of December 31, 2008 due to recurring operating losses, the continuing challenging business environment, a sustained decline in the Company's stock price, and because our estimates of future cash flows developed during the 2009 budgeting process indicated that each of our business segments had an inability to recover the carrying value of each segment's assets. We made various estimates, which management believes to be both reasonable and appropriate, in determining the estimated fair values of the property, plant and equipment at December 31, 2008. In concluding on fair values we also considered, in part, the results of appraisals made as of December 31, 2008 by valuation firms of the fair value of our facility in Hangzhou, China and of certain of our equipment and furniture, software, automobiles and leasehold improvements, which we obtained to confirm the reasonableness of its estimates.
Our most significant long-lived asset in terms of carrying value is our manufacturing, research and development, and administrative offices facility in Hangzhou, China. Using the income capitalization approach, we determined the estimated fair value of the facility and related improvements at December 31, 2008 to be approximately $183.2 million, which exceeded its net book value by approximately $15.8 million. As a result, we concluded the headquarters for our China operations was not impaired.
We tested individually significant equipment and furniture, software, automobiles, and leasehold improvement assets located in China, India, Japan, Korea, and the United States for impairment, primarily using the cost approach to estimate related fair values. Adjustment factors were applied to the original cost of each tested asset first to estimate current replacement cost and then to account for deterioration and obsolescence from all causes as well as de-installation costs to determine each item's estimated fair value at December 31, 2008. As a result of this analysis, we recorded an impairment charge of approximately $22.3 million in operating expenses, which consisted of $11.9 million for our ERP system, $6.7 million for equipment and furniture and $3.7 million primarily for capitalized software.
In addition, in the fourth quarter of 2008, we decided to disband our Custom Solutions Business Unit which provided customized telecommunications solutions and recorded a charge of approximately $4.9 million to write-off the unamortized balance of a customer relationships intangible asset arising from our previous acquisition of Commworks. As a result, our consolidated balance sheet at December 31, 2008 contains no balances for finite-lived purchased intangible assets subject to amortization.
62
RESTRUCTURING
Fiscal 2010
During 2010, we recorded restructuring costs of approximately $15.7 million related to the 2009 Restructuring Plan, net of approximately $2.1 million of reversal of charges due to changes in estimates recorded in prior periods. The restructuring costs for 2010 consisted primarily of severance and benefits related to additional employees included in the 2009 Restructuring Plan, adjusted for changes in estimates of timing of employee terminations, and approximately $1.1 million of lease exit costs primarily related to a lease expiring in 2013. Total restructuring costs recorded through December 31, 2010 related to the 2009 Restructuring Plan approximated $55.7 million.
Fiscal 2009
On June 9, 2009, our Board of Directors approved a restructuring plan (the "2009 Restructuring Plan") designed to reduce our operating costs. The 2009 Restructuring Plan includes a worldwide reduction in force of approximately 50% of our headcount, or approximately 2,300 employees located primarily in China and the United States and, to a lesser degree, other international locations. During the year ended December 31, 2009, we recorded total restructuring costs of approximately $46.5 million of which $40.0 million related to the 2009 Restructuring Plan and $6.5 million related to prior year plans. The $40.0 million charge related to the 2009 Restructuring Plan was comprised primarily of approximately $38.1 million of severance and benefits and $1.9 million of lease costs. The $6.5 million charge in 2009 related to prior year plans consisted primarily of severance and benefits related to the transition of certain key functions, including finance, to China and the divestiture of the Company's Korea operations and additional lease costs, net of approximately $0.5 million of reversal of charges recorded in fiscal year 2008.
Fiscal 2008
On December 16, 2008, our Board of Directors approved a restructuring plan (the "2008 Plan") designed to reduce operating costs. The plan included, among other things, winding down certain non-core operations and implementing a worldwide reduction in force of approximately 10% of our headcount. The reduction in force affected approximately 750 employees in China, Korea and other locations including the United States. In connection with the 2008 Plan, during the fourth quarter of 2008 we incurred a restructuring charge of $13.1 million comprised largely of one-time severance benefits.
NET GAIN ON DIVESTITURES
Fiscal 2010
Gain on divestitures for 2010 of $5.5 million was comprised of the $1.6 million gain on sale of China PDSN Assets, the $0.9 million loss on transfer of EMEA operations, $3.0 million gain on sale of IP Messaging and US PDSN Assets and $1.8 million gain on sale of the RAS product line in the first quarter of 2010. See Note 3 of Notes to our Consolidated Financial Statements contained in Part II, Item 8 of this Annual Report on Form 10-K for additional information regarding gain on divestitures.
Fiscal 2009
Net gain on divestiture in 2009 of $0.1 million is comprised of a $1.4 million gain on sale of PCD assets resulting from an adjustment to reflect actual transaction-related costs, partially offset by a $1.3 million loss from the divestiture of our Korea operations.
63
Fiscal 2008
The $7.8 million net gain on divestitures in 2008 consisted primarily of a $3.8 million gain on the sale of PCD and a $3.9 million gain on the sale of MSBU. For further discussion of divestitures, see Note 3 of Notes to our Consolidated Financial Statements contained in Part II, Item 8 of this Annual Report on Form 10-K.
OTHER INCOME (EXPENSE)
INTEREST INCOME
Fiscal 2010 vs. 2009
Interest income was $2.0 million and $2.1 million for 2010 and 2009, respectively. Interest income decreased for 2010 compared to 2009, primarily due to fluctuations in the average cash balances throughout 2010.
Fiscal 2009 vs. 2008
Interest income was $2.1 million and $7.5 million for 2009 and 2008, respectively. The decrease in interest income was primarily due to the effect of lower average cash balances in 2009 and also a decline in the average interest rate.
INTEREST EXPENSE
Fiscal 2010 vs. 2009
Interest expense was $0.3 million and $0.6 million for 2010 and 2009, respectively. The decrease in interest expense for 2010 compared to 2009 was primarily attributable to the decreased use of credit facilities in 2010.
Fiscal 2009 vs. 2008
Interest expense was $0.6 million and $10.4 million for 2009 and 2008, respectively. The decrease in interest expense for 2009 compared to 2008 was primarily attributable to the repayment of $274.6 million of convertible subordinated notes due March 1, 2008 and $48.0 million of other bank loan repayments during 2008.
OTHER INCOME, NET
Fiscal 2010 vs. 2009
Other income, net for 2010 was $9.8 million as compared to $2.3 million for 2009. Other income, net for 2010 consisted primarily of $8.0 million of foreign currency gains primarily resulting from intercompany receivables denominated in Indian Rupee and Chinese RMB, $0.5 million settlement proceeds with MRV Communications ("MRV") related to our investment in MRV which was sold in 2009, and $1.3 million of other individually insignificant items. Other income, net of $2.3 million for 2009 consisted of $6.3 million foreign currency gain, $0.4 million gain on sale of MRV and $1.2 million of other miscellaneous income, partially offset by $5.5 million other-than-temporary impairment of two equity investments, MRV and Xalted.
Fiscal 2009 vs. 2008
Other income, net was $2.3 million in 2009 as compared to $35.4 million in 2008. Other income, net of $2.3 million for 2009 consisted of $6.3 million foreign currency gain, $0.4 million gain on sale of MRV and $1.2 million of other miscellaneous income, partially offset by $5.5 million
64
other-than-temporary impairment of two equity investments, MRV and Xalted. Other income, net for 2008 consisted primarily of a $32.4 million gain on the sale of the investment in Gemdale, a $7.3 million gain on the sale of the investment in Infinera, and an $8.2 million gain on the liquidation of an investment in a variable interest entity, offset partially by a $9.9 million foreign currency loss and $4.3 million in write-downs of long-term investments.
INCOME TAX EXPENSE (BENEFIT)
FASB ASC 740-10 establishes criteria for recognizing or continuing to recognize only more-likely-than-not tax positions, which may result in income tax expense volatility in future periods. While we believe that we have adequately provided for all tax positions, amounts asserted by taxing authorities could be greater than our accrued position. Accordingly, additional provisions on income tax related matters could be recorded in the future as revised estimates are made or the underlying matters are settled or otherwise resolved.
For a full reconciliation of our effective tax rate to the U.S. federal statutory rate of 35% and further explanation of our provision for taxes, see Note 9 to the consolidated financial statements in Item 8, which is incorporated herein by reference.
In 2010, we reversed a $9.9 million of deferred tax liabilities related to the unremitted earnings of our subsidiaries.
Fiscal 2010 vs. 2009
Income tax expense was $3.1 million for 2010 compared to $10.9 million for 2009. The decrease in income tax expense in 2010 compared with 2009 was primarily due to the decreased ordinary income in jurisdictions where the Company has been profitable and a discrete charge of $1.4 million in the three months ended June 30, 2009 related to establishing of valuation allowance on net deferred tax assets in Korea.
Fiscal 2009 vs. 2008
Income tax expense was $10.9 million in 2009 compared to tax expense of $7.1 million in 2008.
The Company made an assessment of the realizability of its deferred tax assets in Korea, which are included in the Handsets segment, and believe that it will not generate sufficient income to realize its deferred tax assets in Korea. The income tax associated with establishing the valuation allowance is $1.4 million.
During the first quarter of 2009, the Company recorded a tax benefit of $2.8 million related to the recognition of previously unrecognized tax benefits and the reversal of interest and penalties due to the statute of limitations expirations and income tax audit settlements.
Without the $1.4 million of tax expense related to establishing the Korea valuation allowance, and the $2.8 million tax benefit related to the statute of limitation expiration and income tax audit settlements mentioned above, we have tax expense of $12.3 million in 2009. There are two primary reasons why we have tax expense despite incurring pretax losses. First we have not provided any tax benefit on the current year losses incurred and tax credits generated in the United States and other countries, because we believe it is more likely than not that the tax benefit associated with these losses will not be realized. Second, we continue to accrue tax expense in jurisdictions where we have been historically profitable.
In 2008, we recorded a $11.7 million income tax benefit related to the reversal of deferred tax liabilities related to the unremitted earnings of our subsidiaries, and $1.8 million tax expense associated with establishing a valuation allowance in Canada.
65
SEGMENT REPORTING
We make financial decisions based on information we receive from our internal management system and currently evaluate the operating performance of and allocate resources to the segments based on segment revenue and gross profit. Cost of sales and direct expenses in relation to production are assigned to the segments. The accounting policies used in measuring segment assets and operating performance are the same as those used at the consolidated level.
Multimedia Communications
| |
Years Ended December 31, | |||||||||
|---|---|---|---|---|---|---|---|---|---|---|
| |
2010 | 2009 | 2008 | |||||||
| |
(in thousands, except percentages) |
|||||||||
Net sales |
$ | 175,047 | $ | 177,080 | $ | 319,792 | ||||
Gross profit |
$ | 49,849 | $ | 69,691 | $ | 139,662 | ||||
Gross profit as a percentage of net sales |
28 | % | 39 | % | 44 | % | ||||
Fiscal 2010 vs. 2009
During 2010, sales of Multimedia Communications segment were $175.0 million as compared to $177.1 million for 2009 due to accelerated PAS deferred product revenue amortization and the increase in sales of STB product offset the decrease in revenue of all other major Multimedia Communications products. Amortization of PAS deferred product revenue accounted for $93.0 million or 53% of Multimedia Communications sales for 2010, compared to $48.3 million or 27% for 2009.
The gross profit as a percentage of net sales decreased to 28% for 2010 from 39% for 2009. The decrease in gross profit percentage was mainly due to increase in inventory provision for IPTV products, and lower gross margin STB sales which were partially offset by an increase in PAS product related third party commission reversal and accelerated amortization of PAS deferred product revenue in 2010. During 2010, gross profit benefited $6.0 million from the impact of the release of accrued third party commissions as a result of expiration of statute of limitations, compared with $0.8 million in 2009.
In 2011, we do not expect significant new contracts for our PAS handsets and infrastructure equipment and none beyond 2011. We plan to aggressively pursue opportunities for our IPTV product portfolios in multiple markets. We believe that the IPTV market presents a meaningful growth opportunity. We expect to continue to strengthen our IPTV products' market share in China, India, Taiwan and other geographic regions.
Fiscal 2009 vs. 2008
Net sales for 2009 decreased by 45% or $142.7 million. The decrease was mainly due to the declines of our PAS equipment sales by 86%, as well as decrease in sales of NGN product by 54% partially offset by increase in sales of IPTV related products, IP messaging product and accelerated amortization of deferred revenue related to PAS equipment during 2009. PAS equipment sales including the amortization of deferred revenue comprised approximately 41% and 68% of our Multimedia Communications sales for 2009 and 2008, respectively.
The gross profit percentage decreased to 39% for 2009 from 44% for 2008. During 2009, gross profit benefited $6.1 million from sales of product that was previously written down to zero carrying value. During 2008, gross profit benefited $4.5 million from the impact of the release of accrued third party commissions, compared with $0.8 million for 2009. The decrease in gross profit percentage was also due to decreased sales of our higher margin PAS infrastructure equipment and NGN products as well as increase in lower margin revenue related to the accelerated amortization of PAS deferred revenue.
66
Broadband Infrastructure
| |
Years Ended December 31, | |||||||||
|---|---|---|---|---|---|---|---|---|---|---|
| |
2010 | 2009 | 2008 | |||||||
| |
(in thousands, except percentages) |
|||||||||
Net sales |
$ | 109,966 | $ | 107,264 | $ | 129,372 | ||||
Gross profit (loss) |
$ | 15,063 | $ | 14,270 | $ | 1,341 | ||||
Gross profit (loss) as a percentage of net sales |
14 | % | 13 | % | 1 | % | ||||
Fiscal 2010 vs. 2009
Broadband Infrastructure sales increased by 3%, from $107.3 million in 2009 to $110.0 million in 2010. The increase in 2010 was mainly due to the increase in sales of most major product lines especially from TN product, offset partially by a decrease in sales of MSTP, MSAN and service. TN product revenue comprised approximately 15% and 0% of Broadband Infrastructure sales for 2010 and 2009, respectively. Softbank in Japan, one of our largest infrastructure customers, represented approximately 42% and 22% of total Broadband sales during 2010 and 2009, respectively.
During the fourth quarter of 2009, we began recognizing revenue ratably on a significant customer contract over the seven year post contract support period and in the third quarter of 2010 we began recognizing revenue ratably on the second phase of this contract, also over the seven year post contract support period. For the year ended December 31, 2010, we recognized revenue of $16.2 million, and immaterial gross profit on both phases of the contracts.
Gross profit percentage increased to 14% for 2010 from 13% for 2009. The increase in gross profit percentage was primarily due to the contribution from TN product sales with high margins.
We may incur additional warranty expense and inventory write-down as we introduce new products and may be required to accrue additional contract losses for certain fixed price contracts as these contracts progress. These factors will result in negative impacts on our future gross margins, results of operations and financial position.
Fiscal 2009 vs. 2008
Broadband Infrastructure sales decreased by 17%, or $22.1 million for 2009 as compared to 2008. The decrease was mainly due to decrease in sales of most of the major product lines in 2009. Softbank in Japan, one of our largest infrastructure customers, represented approximately 22% and 30% of total Broadband Infrastructure sales in 2009 and 2008, respectively. During 2009, we began recognizing revenue ratably on a significant customer contract over a seven year period. Broadband Infrastructure included $14.5 million of revenue and insignificant gross profit related to this contract during 2009.
During 2009, gross profit benefited $1.4 million from sales of product that was previously written down to zero carrying value. Gross profit percentage increased to 13% for 2009 from 1% for 2008. The increase in gross profit percentage was primarily due to lower provision for anticipated contract losses in 2009 compared to 2008.
Handsets
| |
Years Ended December 31, | |||||||||
|---|---|---|---|---|---|---|---|---|---|---|
| |
2010 | 2009 | 2008 | |||||||
| |
(in thousands, except percentages) |
|||||||||
Net sales |
$ | 6,522 | $ | 102,000 | $ | 287,607 | ||||
Gross profit (loss) |
$ | 5,326 | $ | (18,982 | ) | $ | 39,015 | |||
Gross profit (loss) as a percentage of net sales |
82 | % | (19 | )% | 14 | % | ||||
67
Fiscal 2010 vs. 2009
Net sales decreased by 94% for 2010 compared to 2009. The decrease was primarily due to the completion of the wind-down of our worldwide handset business. Except for sales related to inventory clearing, we do not expect any significant handset revenues in 2011.
Gross profit as a percentage of net sales increased from negative 19% for 2009 to 82% for 2010. The increase was mainly due to inventory clearing sales of PAS and CDMA handsets which were previously fully written down. We incurred additional warranty reserve recorded during the first quarter of 2009 due to additional repairs for one of our handset products, and additional inventory write-down for our PAS handsets as we anticipated decrease in demand after China launched its 3G networks. In addition, gross profit in 2009 was also reduced by approximately $24.6 million as a result of certain transactions with PCD LLC consisting of a claim settlement of $11.1 million for product-related liability disputes and product returns, and $26.0 million in inventory write-downs to net realizable value, write-downs of excess inventory and warranty reserves in 2009, partially offset by $12.5 million benefit related to sales of CDMA handsets to PCD LLC during 2009 that were previously written down to zero carrying value in the fourth quarter of 2008.
Fiscal 2009 vs. 2008
Net sales decreased by 65%, or $185.6 million for 2009 compared to 2008. The decrease was primarily due to the declines of PAS handsets sales, GSM handsets sales and CDMA handsets sales to PCD LLC, partially offset by the increase of CDMA handsets sales in China. The sale of PAS handsets accounted for 23% and 50% of total handset sales for 2009 and 2008, respectively. Our PAS handset sales declined significantly since the first quarter of 2009 as China moved toward the 3G network deployment.
Gross profit as a percentage of net sales decreased from 14% in 2008 to negative 19% in 2009. The decrease was mainly due to inventory clearing sales of PAS and CDMA handsets at very low margins, additional inventory write-downs of PAS, CDMA and TDSCDMA handsets in China. In addition, gross profit was also reduced by approximately $24.6 million as a result of certain transactions with PCD LLC consisting of a claim settlement of $11.1 million for product-related liability disputes and product returns, and $26.0 million in inventory write-downs to net realizable value, write-downs of excess inventory and warranty reserves in 2009, partially offset by $12.5 million benefit related to sales of CDMA handsets to PCD LLC during 2009 that were previously written down to zero carrying value in the fourth quarter of 2008.
Personal Communication Devices (PCD)
| |
Years Ended December 31, | |||||||||
|---|---|---|---|---|---|---|---|---|---|---|
| |
2010 | 2009 | 2008 | |||||||
| |
(in thousands, except percentages) |
|||||||||
Net sales |
$ | — | $ | — | $ | 879,588 | ||||
Gross profit (loss) |
$ | — | $ | — | $ | 69,005 | ||||
Gross profit (loss) as a percentage of net sales |
— | — | 8 | % | ||||||
On July 1, 2008, we sold our PCD operations (See Note 3 of Notes to our Consolidated Financial Statements included under Part II, Item 8 of this Annual Report on Form 10-K).
68
Other
| |
Years Ended December 31, | |||||||||
|---|---|---|---|---|---|---|---|---|---|---|
| |
2010 | 2009 | 2008 | |||||||
| |
(in thousands, except percentages) |
|||||||||
Net sales |
$ | — | $ | — | $ | 24,090 | ||||
Gross profit (loss) |
$ | — | $ | — | $ | 12,219 | ||||
Gross profit (loss) as a percentage of net sales |
— | — | 51 | % | ||||||
Our Other segment consists of Mobile Solutions ("MSBU") and Custom Solutions ("CSBU") business units. We disposed of our MSBU unit in July 2008 and completed the disbandment of the CSBU unit in the first quarter of 2009. The remaining IP Messaging product line has been integrated into the Multimedia Communication segment and remaining services related contracts have been integrated into the Service segment.
RELATED PARTY TRANSACTIONS
Softbank and affiliates
We recognize revenue with respect to sales of telecommunications equipment to affiliates of Softbank, a significant stockholder of our company. Softbank offers ADSL coverage throughout Japan, which is marketed under the name "YAHOO! BB". We support Softbank's fiber-to-the-home service through sales of our carrier class GEPON product as well as our NetRing™ product. In addition, we support Softbank's new internet protocol television ("IPTV"), through sales of our RollingStream™ product. During 2010 and 2009, we recognized revenue and related cost of net sales for sales of telecommunications equipment and services to affiliates of Softbank as follows:
| |
Years Ended December 31, | |||||||||
|---|---|---|---|---|---|---|---|---|---|---|
| |
2010 | 2009 | 2008 | |||||||
| |
(in thousands) |
|||||||||
Net sales |
$ | 46,267 | $ | 23,063 | $ | 38,283 | ||||
Cost of net sales |
19,147 | 12,873 | 22,518 | |||||||
Gross profit |
$ | 27,120 | $ | 10,190 | $ | 15,765 | ||||
Gross profit as a percentage of net sales fluctuations are expected and generally result from changes in product mix. In the year ended December 31, 2010, gross profit as a percentage of net sales also benefited approximately $2.4 million from the release of previously deferred revenue carve-out for potential penalty and cancellation penalties as a result of completing these obligations. Included in accounts receivable at December 31, 2010 and 2009 were $9.7 million and $5.5 million, respectively, related to these transactions. Amounts due to Softbank included in accounts payable was $1.3 million at December 31, 2010, and none as at December 31, 2009.
Sales to Softbank include a three-year service period and a penalty clause if product failure rates exceed a certain level over a seven year period. As of December 31, 2010 and 2009, the customer advance balance related to Softbank agreements was $0.2 million and $0.2 million, respectively. The current deferred revenue balance related to Softbank was $2.3 million and $1.4 million as of December 31, 2010 and December 31, 2009, respectively. As of December 31, 2010, the noncurrent deferred revenue balance related to Softbank was $6.6 million compared to $8.8 million as of December 31, 2009.
As discussed in Note 4 to our consolidated financial statements included under Part II, Item 8 of this Annual Report on Form 10-K, we have a $1.2 million investment in SBI. Affiliates of Softbank have a controlling interest in SBI.
69
As of December 31, 2010 and 2009, Softbank beneficially owned approximately 9.4% and 11%, respectively, of our outstanding stock.
Yellowstone
Subsequent to the completion of BEIID investment on September 7, 2010, one of our new directors also served as a director for Yellowstone Investment Advisory Ltd ("Yellowstone"). During 2010, we paid approximately $0.2 million for consulting services provided by Yellowstone. We also incurred approximately $0.9 million in expenses for a success fee for acquisition support services provided by Yellowstone.
Audiovox
Prior to the sale of PCD on July 1, 2008, Phillip Christopher, one of our former officers, served as a director for Audiovox Corporation ("Audiovox"). During 2008, we paid approximately $0.8 million for IT services provided by Audiovox.
Liquidity and Capital Resources
The following sections discuss the effects of changes in our balance sheet and cash flows, contractual obligations and other commitments on our liquidity and capital resources.
Balance Sheet and Cash Flows
Cash and Cash Equivalents and Short-term Investments
| |
December 31, 2010 |
December 31, 2009 |
Change | ||||||||
|---|---|---|---|---|---|---|---|---|---|---|---|
| |
(in thousands) |
||||||||||
Cash and cash equivalents |
$ | 351,507 | $ | 265,843 | $ | 85,664 | |||||
Bank notes |
546 | 1,038 | (492 | ) | |||||||
Total |
$ | 352,053 | $ | 266,881 | $ | 85,172 | |||||
| |
Years Ended December 31, | |||||||||
|---|---|---|---|---|---|---|---|---|---|---|
| |
2010 | 2009 | 2008 | |||||||
| |
(in thousands) |
|||||||||
Cash used in operating activities |
$ | (92,182 | ) | $ | (67,448 | ) | $ | (55,164 | ) | |
Cash provided by investing activities |
133,493 | 21,318 | 246,046 | |||||||
Cash provided by financing activities |
34,527 | (388 | ) | (332,612 | ) | |||||
Effect of exchange rate changes on cash and cash equivalents |
9,826 | 2,758 | 13,884 | |||||||
Net decrease in cash and cash equivalents |
$ | 85,664 | $ | (43,760 | ) | $ | (127,846 | ) | ||
Cash and cash equivalents, consisting primarily of bank deposits and money market funds, are recorded at cost which approximates fair value because of the short-term nature of these instruments. At December 31, 2010, cash and cash equivalents approximating $213.7 million was held by our subsidiaries in China.
The Chinese government imposes currency exchange controls on all cash transfers out of China. Regulations in China permit foreign owned entities to freely convert the RMB into foreign currency for transactions that fall under the "current account," which includes trade related receipts and payments, interest and dividends. Accordingly, our Chinese subsidiaries may use RMB to purchase foreign exchange for settlement of such "current account" transactions without pre-approval. However,
70
pursuant to applicable regulations, foreign-invested enterprises in China may pay dividends only out of their accumulated profits, if any, determined in accordance with Chinese accounting standards and regulations. In calculating accumulated profits, foreign investment enterprises in China are required to allocate at least 10% of their accumulated profits each year, if any, to fund certain reserve funds, including mandated employee benefits funds, unless these reserves have reached 50% of the registered capital of the enterprises.
Other transactions that involve conversion of RMB into foreign currency are classified as "capital account" transactions; examples of "capital account" transactions include repatriations of investments by or loans to foreign owners, or direct equity investments in a foreign entity by a China domiciled entity. "Capital account" transactions require prior approval from China's State Administration of Foreign Exchange (SAFE) or its provincial branch to convert a remittance into a foreign currency, such as U.S. Dollars, and transmit the foreign currency outside of China. As a result of these and other restrictions under PRC laws and regulations, our China subsidiaries are restricted in their ability to transfer a portion of their net assets to the parent.
2010 Cash flows
Net cash used in operating activities for 2010 was $92.2 million. During the year ended December 31, 2010, our operating activities were significantly impacted by the following:
- •
- Net loss of $65.3 million adjusted for $5.5 million gains from divestitures, and by changes in net operating
assets and liabilities using net cash of $40.8 million, partially offset by non-cash charges including $5.4 million of depreciation and amortization, $7.6 million
stock-based compensation and $5.5 million provision for doubtful accounts.
- •
- Changes in operating assets and liabilities using net cash of $40.8 million. The increase included $28.0 million for settlement of accounts payable and $50.8 million for settlement of other liabilities as the Company continues to streamline operations, offset by the cash inflows from inventories and deferred cost.
Cash provided by investing activities during 2010 of $133.5 million included net proceeds from divestitures of $3.4 million, $124.0 million of proceeds from sale of building, and changes in restricted cash of $13.3 million, offset partially by cash outflows including a $1.8 million net purchases of short-term investments related to a non-qualified deferred compensation plan established in fiscal 2010 which allows a six-month deferral of compensation for certain employees, $3.4 million for purchases of property, plant and equipment and $2.7 million for purchase of an investment interest.
Cash provided by financing activities during 2010 consist primarily of net cash proceeds of $34.6 million from the issuance of 18.1 million shares of common stock related to the BEIID investment. See Note 10 of Notes to our Consolidated Financial Statements included under Part II, Item 8 of this Annual Report on Form 10-K for additional discussion.
2009 Cash flows
Net cash used in operating activities for 2009 was $67.4 million. During the year ended December 31, 2009, our operating activities were significantly impacted by the following:
- •
- Net loss of $225.7 million offset by non-cash charges of approximately $58.0 million which resulted in a net use of cash of $167.7 million. The non-cash charges included $33.3 million impairment of Hangzhou facility, $13.1 million of depreciation and amortization, $12.1 million stock-based compensation, $5.5 million other-than-temporary impairment of two equity investments, and $0.9 impairment of variable interest entity, partially offset by recovery for doubtful accounts of $6.8 million.
71
- •
- Changes in operating assets and liabilities providing net cash of $100.2 million. The decrease in sales activity in 2009 was the primary driver of the changes in operating assets and liabilities. Cash from operations benefited by $123.3 million from a decrease in accounts receivable, $72.8 million from a decrease in inventory and deferred costs, $83.1 million from a decrease in other assets consisting primarily of working capital items, and $4.2 million from an increase in deferred revenue, offset partially by a decrease in accounts payable using cash of $127.7 million, a decrease in customer advances of $29.2 million and a decrease in other liabilities of $24.6 million.
Cash provided by investing activities during 2009 was $21.3 million. Cash provided from investing activities in 2009 included $10.0 million of cash proceeds released from escrow in July 2009 related to sale of PCD, $1.5 million cash proceeds from the divestiture of our Korea operations, $7.3 million deposit received on pending sale of our China headquarters, $2.6 million from the sale of our investment interests in PCD LLC and MRV, net proceeds of $3.2 million from the sale of other short-term investments, offset partially by $2.0 million cash used to purchase property, plant and equipment and $2.0 million change in restricted cash.
Cash used in financing was immaterial during 2009.
2008 Cash flows
Net cash used in operating activities for 2008 was $55.2 million. During the year ended December 31, 2008, our operating activities were significantly impacted by the following:
- •
- Net loss of $150.8 million adjusted for gains on sale of investments of $40.2 million, the
$8.2 million gain on liquidation of ownership interest in a variable interest entity, the $7.8 million gain on divestitures and non-cash charges of $78.4 million,
which resulted in a net use of cash of $128.5 million. The non-cash charges of $78.4 million included $38.0 million in depreciation and amortization,
$20.6 million in stock- based compensation expense, $27.2 million impairment of long-lived assets and $4.3 million impairment of long-term investments,
partially offset by recovery for doubtful accounts of $5.2 million and deferred tax benefit of $6.4 million. The deferred tax benefit is primarily due to an $11.7 million benefit
resulting from a change in the China Corporate Income Tax Law, offset partially by tax expense including $1.8 million of expense related to placing a valuation allowance on our Canadian
deferred tax assets.
- •
- Changes in net operating assets and liabilities providing net cash of $73.4 million, which was primarily the result of management of working capital, in part necessitated by the repayment of the convertible subordinated notes due March 1, 2008. Cash from operations benefited $58.9 million from a decrease in accounts receivable during 2008 which primarily occurred in the PCD business segment during the first quarter of 2008 due to strong collection efforts and from a $128.9 million increase in accounts payable primarily due to timing of payments to vendors. Partially offsetting this was a $64.9 million use of cash resulting from a decrease in customer advances due to timing of bookings and related revenue recognition. Customer advances represent cash deposits we have received from our customers for orders that have not yet received final acceptance.
Net cash provided by investing activities during the year ended December 31, 2008 of $246.0 million included approximately $214.1 million in net proceeds from the sale of PCD and MSBU, $12.9 million net proceeds from the sale of short-term investments, net of purchases, $33.4 million proceeds from the sale of investment interests, net of purchases of long term investment interests and $7.7 million from the repayment of a loan by a variable interest entity, partially offset by $14.2 million used to purchase property, plant and equipment, and a $8.2 million change in restricted cash. The $33.4 million proceeds from the sale of investment interests, net of purchases of long term investment
72
interests was comprised of $42.1 million proceeds from the sale of Gemdale offset by $8.7 million used to purchase long term investment interests.
Net cash used in financing activities during year ended December 31, 2008 of $332.6 million related primarily to the repayment of the convertible subordinated notes of $274.6 million on March 1, 2008 and the net repayment of $48.0 million of other bank loans during 2008.
Accounts Receivable, Net
Accounts receivable decreased $12.2 million from $42.3 million at December 31, 2009 to $30.1 million at December 31, 2010. At December 31, 2010, our allowance for doubtful accounts was $32.2 million on gross receivables of $62.3 million. We recorded provision for doubtful accounts of $5.5 million in 2010 related to aging receivables resulting from a slowdown in customer payments. We assess collectability of receivables based on a number of factors including analysis of creditworthiness, our customer's historical payment history and current economic conditions, our ability to collect payment and on the length of time an individual receivable balance is outstanding. We have certain accounts receivable in China that have been outstanding for a significant period of time. We provide allowances for these receivables based on the criteria discussed above. While we believe we have sufficient experience and knowledge of the China market and customer payment patterns to reasonably estimate such allowances, actual payment patterns and customer behavior could differ from our expectations.
Inventories and Deferred Costs
The following table summarizes our inventories and deferred costs:
| |
December 31, 2010 |
December 31, 2009 |
(Decrease) | ||||||||
|---|---|---|---|---|---|---|---|---|---|---|---|
| |
(in thousands) |
||||||||||
Inventories: |
|||||||||||
Raw materials |
$ | 6,718 | $ | 18,863 | $ | (12,145 | ) | ||||
Work in process |
6,836 | 12,881 | (6,045 | ) | |||||||
Finished goods |
34,850 | 40,556 | (5,706 | ) | |||||||
Total inventories |
$ | 48,404 | $ | 72,300 | $ | (23,896 | ) | ||||
Short-term deferred costs |
$ | 111,179 | $ | 130,453 | $ | (19,274 | ) | ||||
Long-term deferred costs |
$ | 132,587 | $ | 184,978 | $ | (52,391 | ) | ||||
Inventories consist of product held at our manufacturing facility and warehouses, as well as finished goods at customer sites for which the customer has taken possession, but based on specific contractual terms, title has not yet passed to the customer. Finished goods at customer sites were approximately $23.5 million and $33.8 million at December 31, 2010 and 2009, respectively.
Inventories of approximately $0.6 million held by our manufacturing outsource partner are recorded in Prepaids and Other Current Assets in the consolidated balance sheet at December 31, 2010. No inventories were held by our manufacturing outsource partner at December 31, 2009. The Company recorded a $14.6 million inventory write-down in 2010 for MSAN and MSTP for two international customer contracts due to the reduction in product demands.
Deferred costs consist of product shipped to the customer where the rights and obligations of ownership have passed to the customer, but revenue has not yet been recognized due to prolonged acceptance periods for tests and the existence of undelivered elements, such as post-contract support including software update rights for which the Company does not have a vendor specific objective evidence of fair value. Given that there is uncertainty about customer acceptance until the customer completes its internal testing and procedures, the Company waits until the issuance of the final
73
acceptance certificate to support its assertion that the delivery of products and services has occurred. For significant customer contracts involving larger and complex projects where there is on-site testing at multiple locations and the taking over of product warranty and product title occurs after the acceptance of the products and services, acceptance is substantive to the transaction. For certain significant contracts that required the Company to provide post-contract customer support over a long period of time (for example, seven years) for which the Company has been unable to establish vendor specific objective of fair value upon delivery of all elements except for post-contract support, the Company amortizes the deferred revenue and related deferred costs of goods sold over the post-contract support period.
Liquidity
We have incurred net losses attributable to UTStarcom, Inc. of $65.1 million, $225.7 million and $150.3 million during the years ended December 31, 2010, 2009 and 2008, respectively. We have recorded operating losses in 23 of the 24 consecutive quarters in the period ended December 31, 2010. At December 31, 2010, we have an accumulated deficit of $1,132.3 million. We incurred net cash outflows from operations of $92.2 million, $67.4 million and $55.2 million in 2010, 2009 and 2008, respectively. As operating results are expected to improve in 2011 compared with prior years, we expect to break-even on a full year basis in 2011.
At December 31, 2010, we had cash and cash equivalents of $351.5 million, of which $213.7 million was held by our subsidiaries in China. China imposes currency exchange controls on certain transfers of funds to and from China. The amount of cash available for transfer from the China subsidiaries for use by our non-China subsidiaries is limited both by the liquidity needs of the subsidiaries in China and by Chinese-government mandated limitations including currency exchange controls on transfers of funds outside of China.
Our China subsidiaries have an accumulated profit of $84.7 million, as of December 31, 2010 determined in accordance with Chinese accounting standards that could be paid as dividends. We believe our accumulated profits will provide us with the ability to declare dividends sufficient to meet our liquidity needs in the future. Our China subsidiaries paid an aggregate $150 million in dividends to our U.S. parent company during the year ended December 31, 2007 and another $100 million in February 2008. While these cash transfers are offset and eliminated in preparing our consolidated cash flow statements, they have been a principal source of funding of our non-China operations during the periods in which they were made. In February 2009, our China subsidiaries paid an additional $50 million in dividends to our U.S. parent company. However, going forward, the amount of cash available for transfer from the China subsidiaries will be limited both by the liquidity needs of the subsidiaries in China and the restriction on currency exchange by Chinese-government mandated requirements including currency exchange controls on certain transfers of funds outside of China.
At December 31, 2010, we had approximately $28.7 million of available credit facilities. In the second quarter of 2010, we entered into two credit facilities totaling $29.4 million. Both credit facilities can be used for the issuance of certain letters of credit and guarantees and both facilities expire in the second quarter of 2011.
Global economies have experienced a significant downturn driven by a financial and credit crisis that will continue to challenge such economies for some period of time. Under the current macroeconomic environment there are significant risks and uncertainties inherent in management's ability to forecast future results. The operating environment confronting us, both internally and externally, raises significant uncertainties.
In the past years, we took a number of actions to improve our liquidity. In March 2008, we paid $289.5 million to retire our convertible subordinated notes and related accrued interest. On July 1, 2008, we completed the sale of PCD. In addition, we divested our Mobile Solutions Business Unit in
74
July 2008. In the fourth quarter of 2008, management initiated actions to disband our Customs Solutions Business Unit, to wind down our Korea based handset operations, and announced initiatives including efforts to eliminate functional duplications by consolidation of a number of functions into our China operations. In June 2009, management expanded the initiatives to include a worldwide reduction in workforce, outsourcing of manufacturing operations and optimizing research and development spending with a focus on selected products. Our year-over-year from 2008 to 2009 and 2010 selling, general and administrative and research and development operating expenses decreased significantly in 2009 compared with 2008 and management believes the continuing efforts to stream-line operations will enable our fixed cost base to be better aligned with operations, market demand and projected sales levels. If projected sales do not materialize, we will need to take further actions to reduce costs and expenses or explore other cost reduction options.
In December 2009, we entered into a Sales Leaseback Agreement for the intended sale of our manufacturing, research and development, and administrative offices facility in Hangzhou, China to another third party for approximately $138.8 million with leaseback of a portion of the facility. As of May 31, 2010, we had received all of the sales proceeds and met all criteria for consummation of sale of the Hangzhou facility. On May 31, 2010, the buyer and we agreed that all conditions precedent to the closing had been met and the leaseback commenced on June 1, 2010. On December 8, the Company formally notified the landlord of our decision to early terminate the lease in June 2011, six months in advance, according to the termination clause in the Lease agreement.
On February 1, 2010, we entered into agreements for a strategic relationship with Beijing E-town International Investment and Development Co., Ltd ("BEIID") which included a proposed investment of $48.5 million in our common stock by BEIID, and two unrelated investment funds, Elite Noble Limited and Shah Capital Opportunity Fund LP. The stock purchase agreements were subsequently amended on May 4, 2010, June 4, 2010 and July 7, 2010, respectively. These investments closed in September 2010. Under the terms of agreements, as revised, we received a cash of $34.6 million, net of issuance costs, and issued approximately 18.1 million shares of common stock and an option to purchase up to an additional 4.0 million shares of common stock for approximately $8.1 million through November 8, 2010. The option expired unexercised as of December 31, 2010.
Management believes that the continuing efforts to stream-line our operations will enable our fixed cost base to be better aligned with operations, market demand and projected sales level. Management believes that both our China and non-China operations will have sufficient liquidity to finance working capital and capital expenditure needs in excess of 12 months. However, the Company has concentrated its business in Asia, particularly China, India and Japan. Any unforeseen prolonged economic and /or political risk in these markets could impact the Company's customers in making their respective investment decisions and could have a material impact on the foregoing assessment. There can be no assurance that additional financing, if required, will be available on terms satisfactory to us or at all, and if funds are raised in the future through issuance of preferred stock or debt, these securities could have rights, privileges or preference senior to those of our common stock and newly issued debt could contain debt covenants that impose restrictions on our operations. Further, any sale of newly issued debt or equity securities could result in additional dilution to our current shareholders.
Income taxes
The China Corporate Income Tax Law ("CIT Law") became effective on January 1, 2008. Under the CIT Law, China's dual tax system for domestic enterprises and foreign investment enterprises ("FIEs") was effectively replaced by a unified system. The new law establishes a tax rate of 25% for most enterprises and a reduced tax rate of 15% for certain qualified high technology enterprises.
Prior to this change in tax law, certain subsidiaries and joint ventures located in China enjoyed tax benefits in China which were generally available to FIEs. The tax holidays/incentives for FIEs were
75
applicable or potentially applicable to UTStarcom ChongQing Telecom Co. Ltd. ("CUTS"), UTStarcom Telecom Co., Ltd. ("HUTS") and UTStarcom China Co., Ltd. ("UTSC"), our active subsidiaries in China, as those entities may qualify as accredited technologically advanced enterprises.
The CIT Law provides the reduced 15% enterprise income tax rate for qualified high and new technology enterprises. Two of the Company's China subsidiaries, HUTS and UTSC, through which the majority of our business in China is conducted, obtained their High and New Technology Enterprise Certificates, or High-tech Certificates, from the relevant approval authorities on September 19, 2008 and December 30, 2008, respectively, and thereafter were approved to pay CIT at the reduced tax rate of 15%. The approval for the reduced 15% tax rate is valid for three years and applies retroactively from January 1, 2008, subject to possible re-assessment by the approval authorities. During the re-assessment, the tax authority may suspend the implementation of the reduced 15% rate. HUTS's High-tech Certificate will expire on September 19, 2011 and UTSC's High-tech Certificate will expire on December 30, 2011. HUTS and UTSC may apply for the extension of their respective High-tech Certificates prior to the expiration date of the respective certificates and, if approved, each extended term will be three years. If HUTS or UTSC fails to pass the re-assessment by the approval authorities or fails to renew its High-tech Certificate, the preferential tax rate of 15% will cease to apply and HUTS or UTSC would be subject to a tax rate of 25%. However, since both entities are currently in significant loss positions, the change in tax rate will not have a material adverse impact on the business or liquidity until the two China subsidiaries begin to generate profit and deplete all the net operating loss carry forwards.
Proposed Reorganization
On January 10, 2011, we announced a proposed reorganization to change our place of incorporation from Delaware to the Cayman Islands. The reorganization is expected to involve UTStarcom's merger with a newly formed subsidiary, as a result of which we will become a wholly owned subsidiary of a Cayman Islands holding company ("UTStarcom Cayman"). It is expected that each outstanding share of common stock of the Company will be converted into the right to receive one ordinary share of UTStarcom Cayman, which will be issued by UTStarcom Cayman in connection with the merger pursuant to a registered offering. Following the merger, UTStarcom Cayman, together with its subsidiaries, is expected to own and continue to conduct UTStarcom's business in substantially the same manner as is currently being conducted by UTStarcom and its subsidiaries. While UTStarcom Cayman will be taxed as a United States corporation, it is expected to qualify as a foreign private issuer for purposes of its reporting obligations with the SEC, which we expect will reduce our compliance operating costs. The shares of UTStarcom Cayman are expected to be listed on the NASDAQ Stock Market. We expect that neither UTStarcom nor UTStarcom Caymans will incur U.S. income tax as a result of completion of the merger.
Off balance sheet arrangements
At December 31, 2010 and 2009, we had no off balance sheet arrangements.
76
Contractual obligations and other commercial commitments
The following table summarizes our significant contractual obligations as of December 31, 2010:
| |
Payments Due by Period | ||||||||||||||||
|---|---|---|---|---|---|---|---|---|---|---|---|---|---|---|---|---|---|
| |
Total | Less than 1 year |
1-3 years |
3-5 years |
More than 5 years |
||||||||||||
| |
(in thousands) |
||||||||||||||||
Operating leases |
$ | 15,718 | $ | 10,429 | $ | 4,199 | $ | 1,090 | $ | — | |||||||
Letters of credit |
17,425 | 9,648 | 5,147 | 2,630 | — | ||||||||||||
Purchase commitments |
45,887 | 42,055 | 3,832 | — | — | ||||||||||||
Total |
$ | 79,030 | $ | 62,132 | $ | 13,178 | $ | 3,720 | $ | — | |||||||
Operating leases
We lease certain facilities under non-cancelable operating leases that expire at various dates through "2013" to "2015". In connection with the Sale Leaseback Agreement, on February 1, 2010, we entered into a Lease Contract (the "Lease") with respect to the leaseback of a portion of the Hangzhou facility. The Lease became effective on June 1, 2010 and will be early terminated in June 2011. The contractual obligations related to the Hangzhou facility Lease through June 2011 are included in the table above.
Letters of credit
We issue standby letters of credit primarily to support international sales activities outside of China and in support of purchase commitments. When we submit a bid for a sale, often the potential customer will require that we issue a bid bond or a standby letter of credit to demonstrate our commitment through the bid process. In addition, we may be required to issue standby letters of credit as guarantees for advance customer payments upon contract signing or performance guarantees. The standby letters of credit usually expire six to twelve months from date of issuance without being drawn by the beneficiary thereof.
Purchase commitments
We are obligated to purchase raw materials and work-in-process inventory under various orders from various suppliers, all of which should be fulfilled without adverse consequences material to our operations or financial condition. Purchase commitments in the table above include agreements that are non-cancelable and cancelable without penalty.
Intellectual property
Certain sales contracts include provisions under which customers would be indemnified by us in the event of, among other things, a third-party claim against the customer for intellectual property rights infringement related to our products. There are no limitations on the maximum potential future payments under these guarantees. We have not accrued any amounts in relation to these provisions as no such claims have been made and we believe we have valid enforceable rights to the intellectual property embedded in our products.
Uncertain tax positions
As December 31, 2010, we had $56.5 million of gross unrecognized tax benefits, of which $14.4 million related to tax benefits that, if recognized, would impact the annual effective tax rate. The remaining $42.1 million gross unrecognized tax benefits, if recognized, would impact certain deferred tax assets.
77
Third party commissions
We record accruals for commissions payable to third parties in the normal course of business. Such commissions are recorded based on the terms of the contracts between us and the third parties and paid pursuant to such contracts. Consistent with our accounting policies, these commissions are recorded as cost of net sales in the period in which the liability is incurred. As of December 31, 2010, we had approximately $0.4 million of such accrued commissions. Management has performed, and continues to perform, follow-up procedures with respect to these accrued commissions. Upon completion of such follow-up procedures, if the accrued commissions have not been claimed and the statute of limitations, if any, has expired, we will reverse such accruals. Such reversals are recorded in the consolidated statement of operations during the period management determines that the accruals are no longer necessary. With the assistance of our China counsel, we concluded that for certain of these accrued commissions the statute of limitations had expired in August 2010, two years after formal communication was sent to these agents. During the year ended December 31, 2010, approximately $6.0 million was released to cost of net sales as a result of expiration of statute of limitations. No significant reversals of accruals for third party commissions are expected in 2011. During the years ended December 31, 2009 and 2008, respectively, we reversed approximately $0.8 million and $4.5 million of accrued commissions payable and such reversals were recorded in cost of net sales.
India Department of Telecommunication Security and Supply Chain Standards
Recent changes in India require equipment manufacturers to satisfy certain security and supply chain standards to the satisfaction of Indian authorities. Management entered into such agreements with several customers in India which establish detailed security and supply chain standards covering products supplied to these telecommunication customers. These agreements contain significant penalty clauses in the event a security breach is detected related to product supplied by the Company. Management is unable to estimate the likelihood or the financial impact of any such potential security breach on our financial position, results of operations, or cash flows as the regulation is still under further review by DOT and new interpretation is expected later in 2011. As of December 31, 2010, the Company has not been subject to any penalty liability related to these agreements. The Company continues to assess the potential impact these agreements may have on the timing of revenue recognition.
CRITICAL ACCOUNTING POLICIES AND ESTIMATES
Our financial condition and results of operations are based on certain critical accounting policies and estimates, which include judgments, estimates and assumptions on the part of management. Estimates are based on historical experience, knowledge of economic and market factors and various other assumptions that management believes to be reasonable under the circumstances. Actual results may differ from those estimates. The following summary of critical accounting policies and estimates highlights those areas of significant judgment in the application of our accounting policies that affect our financial condition and results of operations.
Revenue Recognition
Revenues from sales of telecommunications equipment and handsets are recognized when persuasive evidence of an arrangement exists, delivery has occurred, the fee is fixed or determinable and collectability is probable. If the payment due from the customer is not fixed or determinable due to extended payment terms, revenue is recognized as payments become due and payable by the customer, assuming all other criteria for revenue recognition are met. Any payments received prior to revenue recognition are recorded as customer advances. Normal payment terms differ for various reasons amongst different customer regions, depending upon common business practices for customers within a region. Billing to customers for shipping and handling are recorded as revenues and the associated
78
costs are recorded as costs of revenues. Any expected losses on contracts are recognized when identified on an individual basis in accordance with the prevailing accounting guidance for the respective contract.
Sales may be generated from complex contractual arrangements that require significant revenue recognition judgments, particularly in the area of contracts with multiple deliverable elements (multiple element arrangements). Where multiple elements exist in an arrangement, the contract price is allocated to the different elements based upon and in proportion to verifiable objective evidence of the fair value of the various elements. Multiple element arrangements primarily involve the sale of equipment, installation, training and post-contract support. Revenue is recognized as each element is earned, namely upon installation and acceptance of equipment or delivery of handsets, provided that the fair value of the undelivered element(s) has been determined, the delivered element(s) has stand-alone value, there is no right of return on delivered element(s), and we are in control of the undelivered element(s). For arrangements that include service elements, including promotional support and installation, for which verifiable objective evidence of the fair value does not exist, revenue is deferred until such services are deemed complete, or until the time we can establish verifiable objective evidence of the fair value.
Final acceptance is required for revenue recognition when installation services are not considered perfunctory. Final acceptance indicates that the customer has fully accepted delivery and installation, if any, of equipment and we are entitled to full payment. We do not recognize revenue before final acceptance is granted by the customer if acceptance is considered substantive to the transaction. The sales contracts we enter into typically include customer acceptance provisions and require the customer to issue a final acceptance certificate to evidence the customer's acceptance of the products and services. In those circumstances, we are unable to enforce payment terms until after the receipt of the final acceptance certificate because the payment conditions are dependent on the issuance of the final acceptance certificate. Our products are generally deployed within the core network of its telecommunications customers. The acceptance terms for the products and services include initial test, on-site testing and trial running. Based on our past experience, the customer's acceptance process for larger and complex projects may take longer than twelve months. As a result, the customers run prolonged and rigorous tests to ensure our products work seamlessly with the customer's existing network. Each telecommunication customer runs its unique tests, as the equipment performance can vary based on how the equipment works in combination with the customer's other equipment, software and other conditions. Given that there is uncertainty about customer acceptance until the customer completes its internal testing and procedures, we wait until the issuance of the final acceptance certificate to support its assertion that the delivery of products and services has occurred. For significant customer contracts involving larger and complex projects where there is on-site testing at multiple locations and the taking over of product warranty and product title occurs after the acceptance of the products and services, acceptance is substantive to the transaction.
Where multiple elements exist in an arrangement that includes software, and the software is considered more than incidental to the equipment or services in the arrangement, software and software related elements are recognized in accordance with the specific guidance for recognizing software revenue. We allocate revenues to each element of software arrangements based on vendor specific objective evidence ("VSOE") of fair value. VSOE of fair value of each element is based on the price charged when the same element is sold separately. We use the residual method to recognize revenue when an arrangement includes one or more elements to be delivered at a future date and VSOE of the fair value of all the undelivered elements exists. Under the residual method, the fair value of the undelivered elements is deferred and the remaining portion of the contract price is recognized as revenue when all other revenue recognition criteria are met. If VSOE of fair value of one or more undelivered elements does not exist, all revenue for delivered and undelivered elements is deferred until delivery of all elements occurs or when VSOE of fair value of the undelivered elements
79
can be established. In some cases we have agreed to give software upgrade rights on a "when and if made available" basis for equipment sold for no additional consideration and for an unspecified period which could extend over the term of the contract. This additional contract obligation is an element of "post-contract support." We have not established VSOE for such contract element. Accordingly, the revenues from such contracts are recognized ratably over the period during which the post contract support is expected to be provided. The expected period of support is generally the term of the contract. In some cases where there is no stated contractual term, revenue is recognized ratably over the estimated period of support. We review assumptions regarding the estimated post-contract support periods on a regular basis. If we determine that it is necessary to revise our estimates of the support periods, the amount of revenue recognized over the life of the contract would not be affected. However, to the extent the new assumptions regarding the post-contract support periods were different from the original assumptions, the contract revenues would be recognized over the remaining expected period of support. As discussed in "Results of Operations-Net Sales" in this Item 7, due to the China telecommunication industry restructuring and launch of 3G services in China, we have determined the remaining expected period of support for PAS infrastructure as 2 years and hence deferred revenue associated with PAS infrastructure is being recognized ratably beginning in the fourth quarter of 2009 through the fourth quarter of 2011.
Revenue from fixed priced contracts that include a requirement for significant software modification or customization is recognized using the completed contract method of accounting, whereby no revenue is recognized prior to the completion of the project, because for contracts involving unique requirements we are unable to make reasonably dependable estimates of progress towards meeting contractual requirements. In the event estimated total project costs exceed estimated total project revenues, the entire estimated loss is charged to operations in the period in which the loss becomes probable and can be reasonably estimated. The complexity of the estimation process and judgments about internal and external factors including labor utilization, changes to specifications and testing requirements, time required for performance and resulting incurrence of contract penalties, and the performance of subcontractors affect the estimation process. During the years ended December 31, 2010, 2009 and 2008, we recorded $2.6 million, $4.9 million and $18.4 million contract loss on a fixed price contract, respectively.
We recognize revenue for system integration, installation and training upon completion of performance and if all other revenue recognition criteria are met. Other service revenue, principally related to maintenance and support contracts, is recognized ratably over the maintenance term.
We also sell products through resellers. Revenue is generally recognized when the standard price protection period, which ranges from 30 to 90 days, has lapsed. If collectability cannot be reasonably assured in a reseller arrangement, revenue is recognized upon sell-through to the end customer and receipt of cash. There may be additional obligations in reseller arrangements such as inventory rotation, or stock exchange rights on the product. In most cases, we have developed reasonable estimates for stock exchanges based on historical experience with similar types of sales of similar products.
We have sales agreements with certain wireless customers that provide for a rebate of the selling price to such customers if the particular product is subsequently sold at a lower price to such customers or to a different customer. The rebate period extends for a relatively short period of time. Historically, the amounts of such rebates paid to customers have not been material. We estimate the amount of the rebate based upon the terms of each individual arrangement, historical experience and future expectations of price reductions and then record our estimate of the rebate amount at the time of the sale. We also enter into sales incentive programs, such as co-marketing arrangements, with certain wireless and handset customers. We record the incurred incentive as a reduction of revenue when the sales revenue is recognized.
80
The assessment of collectability is also a factor in determining whether revenue should be recognized. We assess collectability based on a number of factors, including payment history and the credit-worthiness of the customer. We do not request collateral from our customers. In international sales, we may require letters of credit from our customers that can be drawn on demand if the customer defaults on its payment. If we determine that collection of a payment is not reasonably assured, we defer revenue recognition until collection becomes reasonably assured, which is generally upon receipt of cash.
Occasionally, we enter into revenue sharing arrangements. Under these arrangements, we collect payment only after our customer, the telecommunications service provider, collects service revenues. When we enter into a revenue sharing arrangement, we do not recognize revenue until collection is reasonably assured.
Because of the nature of doing business in China and other emerging markets, our billings and/or customer payments may not correlate with the contractual payment terms and we generally do not enforce contractual payment terms prior to final acceptance. Accordingly, accounts receivable are not recorded until we recognize the related customer revenue. Advances from customers are recognized when we have collected cash from the customer, prior to recognizing revenue. Deferred revenue is recorded if there are undelivered elements after final acceptance has been obtained.
Restructuring Liabilities, Litigation and Other Contingencies
We account for the Company's restructuring plans using the guidance provided in Accounting Standard Codifications ("ASC") 420 "Exit or Disposal Cost Obligations" and ASC 712 "Compensation—Nonretirement Postemployment Benefits". We account for litigation and contingencies in accordance with ASC 450, "Contingencies", which requires that we record an estimated loss from a loss contingency when information available prior to issuance of our financial statements indicates that it is probable that an asset has been impaired or a liability has been incurred at the date of the financial statements and the amount of loss can be reasonably estimated.
Stock-Based Compensation
Stock-based compensation expense for all share-based payment awards granted is determined based on the grant-date fair value. Stock-based compensation expense for restricted stock awards is measured based on the closing fair market value of our common stock on the date of grant. Stock-based compensation expense for stock options is estimated at the grant date based on each option's fair value as calculated by the Black-Scholes option pricing model ("Black-Scholes model"). Stock-based compensation is expensed ratably on a straight-line basis over the requisite service period, which is generally the vesting term of the share-based payment awards.
Determining the appropriate fair value model and calculating the fair value of share-based payment awards require the input of subjective assumptions, including the expected term of the share-based payment awards and stock volatility. We estimate an expected term of options granted based on our historical exercise and cancellation data for vested options. We use historical volatility as management believes it is more representative of future stock price trends than implied volatility due to the relatively small number of actively traded options on our common stock available to determine implied volatility. The assumptions used in calculating the fair value of share-based payment awards represent management's best estimates, but these estimates involve inherent uncertainties and compensation expense could be materially different in the future. Because changes in the subjective assumptions can materially affect the estimated value, in management's opinion, the existing valuation models may not provide an accurate measure of the fair value of our employee stock options. In addition, we are required to estimate the expected forfeiture rate and recognize expense only for those shares expected to vest. If our actual forfeiture rate is materially different from our estimate, the
81
stock-based compensation expense could be significantly different from what we have recorded in the current period.
Product Warranty
We provide a warranty on our equipment and handset sales for a period generally ranging from one to two years from the time of final acceptance. Very rarely, we have entered into arrangements to provide limited warranty services for periods longer than two years. We provide for the expected cost of product warranties at the time that revenue is recognized based on an assessment of past warranty experience and when specific circumstances dictate. From time to time, we may be subject to additional costs related to non-standard warranty claims from our customers. If and when this occurs, we estimate additional accruals based on historical experience, communication with our customers and various assumptions that we believe to be reasonable under the circumstances. Such additional warranty accruals are recorded in the period in which the additional costs are identified.
Variable Interest Entities
The accounting guidance requires that if an entity is the primary beneficiary of a variable interest entity, ("VIE"), the assets, liabilities, and results of operations of the VIE should be included in the consolidated financial statements of the entity. We evaluate our investments periodically or when "triggering" events occur.
Receivables
Although we evaluate customer credit worthiness prior to a sale, we provide an allowance for doubtful accounts for the estimated loss on trade and notes receivable when collection may no longer be reasonably assured. We assess collectability of receivables based on a number of factors including analysis of creditworthiness, our customer's historical payment history and current economic conditions, our ability to collect payment and on the length of time an individual receivable balance is outstanding. Our policy for determining the allowance for doubtful accounts includes both specific allowances for balances known to be uncollectible and a formula-based portfolio approach, based on aging of the accounts receivable, as a precursor to a management review of the overall allowance for doubtful accounts. This formula-based approach involves aging of our accounts receivable and applying a percentage based on our historical experience; this approach results in the allowance being computed based on the aging of the receivables. We evaluate the percentages applied to each category of aged accounts receivable periodically based on actual history of write-offs and collections and refine this formula-based approach accordingly for use in future periods.
We have certain accounts receivable in China that have been outstanding for a significant period of time. We provide allowances for these receivables based on the criteria discussed above. While we believe we have sufficient experience and knowledge of the China market and customer payment patterns to reasonably estimate such allowances, actual payment patterns and customer behavior could differ from our expectations. We use actual collection experience to periodically adjust the percentages used in applying the formula-based portfolio approach as discussed above.
Inventories
Inventories consist of product held at our manufacturing facility and warehouses, as well as finished goods at customer sites for which the customer has taken possession, but based on specific contractual terms, title has not yet passed to the customer. We may ship inventory to existing customers that require additional equipment to expand their existing networks prior to the signing of an expansion contract. Our inventories are stated at the lower of cost or market value, based on the FIFO method of accounting. Write-downs are based on our assumptions about future market conditions and
82
customer demand, including projected changes in average selling prices resulting from competitive pricing pressures. We continually monitor inventory valuation for potential losses and obsolete inventory at our manufacturing facilities as well as at customer sites. If actual market conditions are less favorable than those projected by management, additional write-downs may be required. If actual market conditions are more favorable than anticipated, inventory previously written down may be sold to customers, resulting in lower cost of sales and higher income from operations than expected in that period.
Deferred costs
Deferred costs consist of product shipped to the customer for which the rights and obligations of ownership have passed to the customer but revenue has not yet been recognized due to prolonged acceptance periods for tests and the existence of undelivered elements, such as post-contract support including software update rights for which the Company does not have a vendor specific objective evidence of fair value. All deferred costs are stated at cost. Management periodically assesses the recoverability of deferred costs and provides reserves against deferred cost balances when recovery of deferred costs is not probable. Recoverability is evaluated based on various factors including the length of time the product has been held at the customer site, the viability of payment, including assessment of product demand if a revenue sharing arrangement exists and/or the evaluation if a related transaction will result in a gross margin loss. In a loss situation for a transaction, the deferred cost balance is adjusted for impairment equal to the value of the excess of cost over the amount of revenue that will be eventually recognized for the transaction. Revenue and cost of sales are recorded when final acceptance is received from the customer. With greater concentration of product at customer sites under contract with specific or individual customers, the financial conditions of such specific or individual customers may result in increased concentration risk exposure for the Company's inventory. For any post contract support services where the revenue is deferred, the entire related deferred direct costs are classified as a noncurrent asset, consistent with the definition of a current asset.
Research and Development and Capitalized Software Development Costs
Our research and development costs are charged to expense as incurred. We capitalize software development costs, incurred in the development of software that will ultimately be sold, between the time technological feasibility has been attained and the related product is ready for general release. Management judgment is required in assessing technological feasibility, expected future revenues, estimated product lives and changes in product technologies, and the ultimate recoverability of our capitalized software development costs.
Income Taxes
We are subject to income taxes in both the United States and numerous foreign jurisdictions. Significant judgment is required in evaluating our tax positions and determining the provision for income taxes. During the ordinary course of business, there are many transactions and calculations for which the ultimate tax determination is uncertain. We recognize the tax benefit (expense) from an uncertain tax position only if it is more likely than not the tax position will be sustained on examination by the taxing authorities, based on the technical merits of the position. We recognize interest expense and penalties related to income tax matters as part of the provision for income taxes.
We recognize deferred income taxes as the difference between the tax bases of assets and liabilities and their financial statement amounts based on enacted tax rates. Management judgment is required in the assessment of the recoverability of our deferred tax assets based on its assessment of projected taxable income. Numerous factors could affect our results of operations in the future. If there is a significant decline in our future operating results, management's assessment of the recoverability of our deferred tax assets would need to be revised, and any such adjustment to its deferred tax assets would
83
be charged to income in that period. If necessary, we record a valuation allowance to reduce deferred tax assets to an amount management believes is more likely than not to be realized.
We provide U.S. taxes on foreign undistributed earnings that are not considered to be permanently reinvested outside the United States.
Goodwill and Long-Lived Assets Including Finite-Lived Purchased Intangible Assets
Goodwill represents the excess of the purchase price over the fair value of the net tangible and identifiable intangible assets acquired in a business combination. Intangible assets resulting from the acquisitions of entities accounted for using the acquisition method of accounting are estimated by management based on the fair value of assets received. Identifiable intangible assets are comprised of developed technologies and non-compete agreements. Goodwill is not amortized and is tested annually for impairment and between annual tests if an event occurs or circumstances change in accordance with ASC350 that would more likely than not reduce the fair value below its carrying amount and when the fair value of the goodwill is below its carrying amount, an impairment of the goodwill is recorded. Purchased intangibles with finite lives are carried at cost and amortized on a straight-line basis over their respective estimated useful lives.
We perform our annual goodwill impairment analysis as of November 1st of each year using a two-step process. The first step of the goodwill impairment test is used to identify potential impairment, compares the fair value of a reporting unit with its carrying amount, including goodwill. Reporting units are our operating segments or one level below the operating segments. If the fair value of a reporting unit exceeds its carrying amount, goodwill of the reporting unit is considered not impaired, thus the second step of the impairment test is unnecessary. If the carrying amount of a reporting unit exceeds its fair value, the second step of the goodwill impairment test is performed to measure the amount of impairment loss, if any. The second step of the goodwill impairment test compares the implied fair value of the reporting unit's goodwill with the carrying amount of that goodwill. If the carrying amount of the reporting unit's goodwill exceeds the implied fair value of that goodwill, an impairment loss is recognized in an amount equal to that excess. The loss recognized cannot exceed the carrying amount of goodwill. The implied fair value of goodwill is determined in the same manner as the amount of goodwill recognized in a business combination. That is, the fair value of the reporting unit is allocated to all of the assets and liabilities of that unit (including any unrecognized intangible assets) as if the reporting unit had been acquired in a business combination and the fair value of the reporting unit was the purchase price paid to acquire the reporting unit.
Determining the fair value of a reporting unit under the first step of the goodwill impairment test and determining the fair value of individual assets and liabilities of a reporting unit (including unrecognized intangible assets) under the second step of the goodwill impairment test is judgmental in nature and often involves the use of significant estimates and assumptions. These estimates and assumptions could significantly impact whether or not an impairment charge is recognized as well as the magnitude of any such charge. In its impairment review, we perform internal valuation analyses or utilize third-party valuations when management believes it to be appropriate, and considers other market information that is publicly available. Estimates of fair value are primarily determined using a discounted cash flow analysis. This approach uses significant estimates and assumptions including projected future cash flows, the timing of such cash flows, discount rates reflecting the risk inherent in future cash flows, perpetual growth rates applied to determine terminal values, determination of appropriate market comparables and the determination of whether a premium or discount should be applied to comparables. In addition to the estimates of future cash flows, two of the most significant assumptions applied to estimated cash flows involved in the determination of fair value of the reporting units were the discount rates and perpetual growth rates applied to determine terminal values used in the discounted cash flow analysis. The discount rates used in the cash flow models for the goodwill impairment testing considered market and industry data as well as specific risk factors for each
84
reporting unit. The perpetual growth rates for the individual reporting units, for purposes of the terminal value determination, were generally set after an initial five-year forecasted period, although certain reporting units utilized longer forecasted periods, and were based on historical experience, market and industry data.
Our annual impairment review disclosed no impartment in 2010 while our consolidated balance sheets at December 31, 2009 contained no balances for goodwill.
We assess the recoverability of our long-lived assets other than goodwill by determining whether the carrying value of such assets will be recovered through undiscounted future cash flows. Asset impairments primarily consist of intangible assets with finite lives and property, plant and equipment and are based on an estimate of the amounts and timing of future cash flows related to the expected future remaining use and ultimate sale or disposal of property, plant and equipment net of costs to sell. Following our annual impairment review, we concluded no assets were impaired as of December 31, 2010. During 2009, we incurred $33.3 million of plant and equipment impairment charges. During 2008, we incurred $4.9 million and $22.3 million of intangible assets and property, plant and equipment impairment charges, respectively. See Note 6 of Notes to our Consolidated Financial Statements included under Part II, Item 8 of this Annual Report on Form 10-K for additional discussion.
The process of evaluating the potential impairment of long-lived assets other than goodwill is also highly subjective and requires significant judgment. In order to estimate the fair value of long-lived assets, we typically make various assumptions about the future prospects for the business that the asset relates to, consider market factors specific to that business and estimate future cash flows to be generated by that business. Based on these assumptions and estimates, we determine whether we need to recognize an impairment charge to reduce the value of the asset stated on our balance sheet to reflect its estimated fair value. Assumptions and estimates about future values and remaining useful lives are complex and often subjective. They can be affected by a variety of factors, including external factors such as the real estate market, industry and economic trends, and internal factors such as changes in our business strategy and our internal forecasts. Although we believe the assumptions and estimates we have made in the past have been reasonable and appropriate, changes in assumptions and estimates could materially impact our reported financial results.
Investments
Our investments consist principally of bank notes and equity securities of publicly traded and privately held companies. Our investments in publicly traded equity securities are accounted for under ASC 320, "Investment, Debt and Equity Securities." and are classified as available-for-sale. These investments are recorded at fair value with the unrealized gains and losses included as a separate component of accumulated other comprehensive income, net of tax. During 2009, we sold our remaining investment in publicly traded equity securities. The investments in equity securities of privately held companies in which we hold less than 20% voting interest and on which we do not have the ability to exercise significant influence are accounted for under ASC 325, "Investments—Other" using the cost method. Under the cost method, these investments are carried at the lower of cost or fair market value. The investments in equity securities of privately held companies in which we hold less than 50% voting interest and on which we have the ability to exercise significant influence are accounted for under ASC 323, "Investments—Equity Method and Joint Ventures" using the equity method .
We recognize an impairment charge when the decline in the fair value of our publicly traded equity securities and our cost-method investments below their cost basis are judged to be other-than-temporary. Significant judgment is used to identify events or circumstances that would likely have a significant adverse effect on the future use of the investment. We consider various factors in determining whether an impairment is other-than-temporary, including the severity and duration of the
85
impairment, forecasted recovery, the financial condition and near-term prospects of the investee, and our ability and intent to hold the investment for a period of time sufficient to allow for any anticipated recovery in market value.
RECENT ACCOUNTING PRONOUNCEMENTS
See Note 2 of Notes to our Consolidated Financial Statements contained in Item 8 of this Annual Report on Form 10-K for a full description of recent accounting pronouncements, including the expected dates of adoption and estimated effects on results of operations and financial condition, which is incorporated herein by reference.
ITEM 7A—QUANTITATIVE AND QUALITATIVE DISCLOSURES ABOUT MARKET RISK
We are exposed to the impact of interest rate changes, changes in foreign currency exchange rates and changes in the stock market.
Interest Rate Risk:
Our exposure to market risk for changes in interest rates relates primarily to our investment portfolio. The fair value of our investment portfolio would not be significantly affected by either a 10% increase or decrease in interest rates due mainly to the short term nature of most of our investment portfolio. However, our interest income can be sensitive to changes in the general level of U.S and China interest rates since the majority of our funds are invested in instruments with maturities of less than one year. In a declining interest rate environment, as short term investments mature, reinvestment occurs at less favorable market rates. Given the short term nature of certain investments, anticipated declining interest rates will negatively impact our investment income.
We maintain an investment portfolio of various holdings, types and maturities. We do not use derivative financial instruments. We place our cash investments in instruments that meet high credit quality standards, as specified in our investment policy guidelines. Our policy is to limit the risk of principal loss and to ensure the safety of invested funds by generally attempting to limit market risk. Funds in excess of current operating requirements are mostly invested in money market funds which are rated AAA. Our cash and cash equivalents are not subject to significant interest rate risk due to the short maturities of these instruments. As of December 31, 2010, the carrying value of our cash and cash equivalents approximated fair value.
The table below represents carrying amounts and related weighted-average interest rates of our investment portfolio at December 31, 2010 and 2009:
| |
December 31, | |||||||
|---|---|---|---|---|---|---|---|---|
| |
2010 | 2009 | ||||||
| |
(in thousands) |
|||||||
Cash and cash equivalents |
$ | 351,507 | $ | 265,843 | ||||
Average interest rate |
0.66 | % | 0.55 | % | ||||
Restricted cash—short term |
$ | 15,955 | $ | 26,448 | ||||
Average interest rate |
0.12 | % | 0.05 | % | ||||
Short-term investments |
$ | 546 | $ | 1,038 | ||||
Average interest rate |
0.00 | % | 0.36 | % | ||||
Restricted cash long-term |
$ | 8,385 | $ | 10,550 | ||||
Average interest rate |
0.01 | % | 0.03 | % | ||||
Total investment securities |
$ | 376,393 | $ | 303,879 | ||||
Average interest rate |
0.62 | % | 0.49 | % | ||||
86
Equity Investment Risk:
We have invested in several privately-held companies as well as investment funds which invest primarily in privately held companies, many of which can still be considered in the start-up or development stages. These investments are inherently risky, as the market for the technologies or products they have under development is typically in the early stages and may never materialize.
Foreign Exchange Rate Risk:
As a multinational company, we conduct our business in a wide variety of currencies and are therefore subject to market risk for changes in foreign exchange rates. We expect to continue to expand our business globally and, as such, expect that an increasing proportion of our business may be denominated in currencies other than U.S. Dollars. As a result, fluctuations in foreign currencies may have a material impact on our business, results of operations and financial condition.
Historically, the majority of our foreign-currency denominated sales have been made in China, denominated in Renminbi or RMB. Additionally, since 2006, we made significant sales in Japanese Yen, Euros, Indian Rupees and Canadian Dollars. Due to China's currency exchange control regulations, we are limited in our ability to convert and repatriate RMB, as well as in our ability to engage in foreign currency hedging activities in China. The balance of our cash and cash equivalents held in China was $213.7 million at December 31, 2010. Since China un-pegged the RMB from the U.S. Dollar in July 2005 through December 31, 2010, the RMB has strengthened by approximately 20% versus the U.S. Dollar. However, it is uncertain what further adjustments may be made in the future.
We may manage foreign currency exposures using forward and option contracts to hedge and thus minimize exposure to the risk of the eventual net cash inflows and outflows resulting from foreign currency denominated transactions with customers, suppliers, and non-U.S. subsidiaries; however, we are not currently hedging any such transactions. As our foreign currency balances are not currently hedged, any significant revaluation of our foreign currency exposures may materially and adversely affect our business, results of operation and financial condition. We do not enter into foreign exchange forward or option contracts for trading purposes.
Given our exposure to international markets, we regularly monitor all of our material foreign currency exposures. We use sensitivity analysis to measure our foreign currency risk by computing the potential decrease in cash flows that may result from adverse or beneficial changes in foreign exchange rates, relative to the functional currency with all other variables held constant. The analysis covers all of our underlying exposures for foreign currency denominated financial instruments. The foreign currency exchange rates used were based on market rates in effect at December 31, 2010. The sensitivity analysis indicated that a hypothetical 10% adverse or beneficial movement in exchange rates would have resulted in a loss or gain in the fair values of our foreign currency denominated financial instruments of $19.9 million at December 31, 2010.
87
ITEM 8—FINANCIAL STATEMENTS AND SUPPLEMENTARY DATA
INDEX TO CONSOLIDATED FINANCIAL STATEMENTS AND
FINANCIAL STATEMENT SCHEDULES
All other schedules are omitted because they are not applicable or the required information is shown in the consolidated financial statements or notes thereto.
88
Report of Independent Registered Public Accounting Firm
To
the Board of Directors and Stockholders of
UTStarcom, Inc.:
In our opinion, the consolidated financial statements listed in the accompanying index present fairly, in all material respects, the financial position of UTStarcom, Inc. and its subsidiaries at December 31, 2010 and 2009, and the results of their operations and their cash flows for each of the three years in the period ended December 31, 2010 in conformity with accounting principles generally accepted in the United States of America. In addition, in our opinion, the financial statement schedules listed in the accompanying index present fairly, in all material respects, the information set forth therein when read in conjunction with the related consolidated financial statements. Also, in our opinion, the Company did not maintain, in all material respects, effective internal control over financial reporting as of December 31, 2010, based on criteria established in Internal Control—Integrated Framework issued by the Committee of Sponsoring Organizations of the Treadway Commission ("COSO") because material weaknesses in internal control over financial reporting related to 1) the lack of effective controls over the appropriate and timely analysis and monitoring of the underlying information related to period-end financial reporting process and preparation of consolidated financial statements, and 2) the lack of adequate segregation of duties and appropriate approval requirements for non-routine transactions relating to cash management, existed as of that date. A material weakness is a deficiency, or a combination of deficiencies, in internal control over financial reporting, such that there is a reasonable possibility that a material misstatement of the annual or interim financial statements will not be prevented or detected on a timely basis. The material weaknesses referred to above are described in Management's Annual Report on Internal Control over Financial Reporting appearing under Item 9A. We considered these material weaknesses in determining the nature, timing, and extent of audit tests applied in our audit of the 2010 consolidated financial statements, and our opinion regarding the effectiveness of the Company's internal control over financial reporting does not affect our opinion on those consolidated financial statements. The Company's management is responsible for these financial statements and financial statement schedules, for maintaining effective internal control over financial reporting and for its assessment of the effectiveness of internal control over financial reporting included in management's report referred to above. Our responsibility is to express opinions on these financial statements, on the financial statement schedules, and on the Company's internal control over financial reporting based on our integrated audits. We conducted our audits in accordance with the standards of the Public Company Accounting Oversight Board (United States). Those standards require that we plan and perform the audits to obtain reasonable assurance about whether the financial statements are free of material misstatement and whether effective internal control over financial reporting was maintained in all material respects. Our audits of the financial statements included examining, on a test basis, evidence supporting the amounts and disclosures in the financial statements, assessing the accounting principles used and significant estimates made by management, and evaluating the overall financial statement presentation. Our audit of internal control over financial reporting included obtaining an understanding of internal control over financial reporting, assessing the risk that a material weakness exists, and testing and evaluating the design and operating effectiveness of internal control based on the assessed risk. Our audits also included performing such other procedures as we considered necessary in the circumstances. We believe that our audits provide a reasonable basis for our opinions.
As discussed in Note 1 to the consolidated financial statements, the Company changed the manner in which it accounts for noncontrolling interests in 2009.
A company's internal control over financial reporting is a process designed to provide reasonable assurance regarding the reliability of financial reporting and the preparation of financial statements for external purposes in accordance with generally accepted accounting principles. A company's internal control over financial reporting includes those policies and procedures that (i) pertain to the
89
maintenance of records that, in reasonable detail, accurately and fairly reflect the transactions and dispositions of the assets of the company; (ii) provide reasonable assurance that transactions are recorded as necessary to permit preparation of financial statements in accordance with generally accepted accounting principles, and that receipts and expenditures of the company are being made only in accordance with authorizations of management and directors of the company; and (iii) provide reasonable assurance regarding prevention or timely detection of unauthorized acquisition, use, or disposition of the company's assets that could have a material effect on the financial statements.
Because of its inherent limitations, internal control over financial reporting may not prevent or detect misstatements. Also, projections of any evaluation of effectiveness to future periods are subject to the risk that controls may become inadequate because of changes in conditions, or that the degree of compliance with the policies or procedures may deteriorate.
/s/ PricewaterhouseCoopers Zhong Tian CPAs Limited Company
Shanghai,
the People's Republic of China
March 16, 2011
90
UTSTARCOM, INC.
CONSOLIDATED BALANCE SHEETS
| |
December 31, 2010 |
December 31, 2009 |
||||||
|---|---|---|---|---|---|---|---|---|
| |
(in thousands, except par value) |
|||||||
ASSETS |
||||||||
Current assets: |
||||||||
Cash and cash equivalents |
$ | 351,507 | $ | 265,843 | ||||
Short-term investments |
546 | 1,038 | ||||||
Accounts receivable, net of allowances for doubtful accounts of $32,176 and $26,065, respectively |
30,051 | 42,346 | ||||||
Inventories |
48,404 | 72,300 | ||||||
Deferred costs |
111,179 | 130,453 | ||||||
Prepaids and other current assets |
46,943 | 49,333 | ||||||
Short-term restricted cash |
15,955 | 26,448 | ||||||
Total current assets |
604,585 | 587,761 | ||||||
Property, plant and equipment, net |
4,819 | 130,612 | ||||||
Goodwill |
13,820 | — | ||||||
Intangible assets, net |
4,858 | — | ||||||
Long-term investments |
11,273 | 8,402 | ||||||
Long-term deferred costs |
132,587 | 184,978 | ||||||
Long-term deferred tax assets |
1,742 | 4,822 | ||||||
Other long-term assets |
10,599 | 12,536 | ||||||
Total assets |
$ | 784,283 | $ | 929,111 | ||||
LIABILITIES AND EQUITY |
||||||||
Current liabilities: |
||||||||
Accounts payable |
$ | 36,356 | $ | 54,115 | ||||
Income taxes payable |
— | 1,130 | ||||||
Customer advances |
82,607 | 120,364 | ||||||
Deferred revenue |
182,963 | 170,777 | ||||||
Deferred tax liabilities |
1,436 | 3,890 | ||||||
Other current liabilities |
87,487 | 142,894 | ||||||
Total current liabilities |
390,849 | 493,170 | ||||||
Long-term deferred revenue |
122,241 | 160,932 | ||||||
Other long-term liabilities |
22,253 | 18,858 | ||||||
Total liabilities |
535,343 | 672,960 | ||||||
Commitments and contingencies (Note 14) |
||||||||
UTStarcom, Inc. stockholders' equity: |
||||||||
Common stock: $0.00125 par value; 750,000 authorized shares; 155,327 and 130,095 shares issued and outstanding at December 31, 2010 and December 31, 2009, respectively |
182 | 153 | ||||||
Additional paid-in capital |
1,303,627 | 1,251,532 | ||||||
Accumulated deficit |
(1,132,303 | ) | (1,067,174 | ) | ||||
Accumulated other comprehensive income |
69,423 | 70,848 | ||||||
Total UTStarcom, Inc. stockholders' equity |
240,929 | 255,359 | ||||||
Noncontrolling interests |
8,011 | 792 | ||||||
Total equity |
248,940 | 256,151 | ||||||
Total liabilities and equity |
$ | 784,283 | $ | 929,111 | ||||
See accompanying notes to consolidated financial statements.
91
UTSTARCOM, INC.
CONSOLIDATED STATEMENTS OF OPERATIONS
| |
Years Ended December 31, | ||||||||||
|---|---|---|---|---|---|---|---|---|---|---|---|
| |
2010 | 2009 | 2008 | ||||||||
| |
(in thousands, except per share amounts) |
||||||||||
Net sales |
|||||||||||
Products |
$ | 251,134 | $ | 323,387 | $ | 1,582,538 | |||||
Services |
40,401 | 62,957 | 57,911 | ||||||||
|
291,535 | 386,344 | 1,640,449 | ||||||||
Cost of net sales |
|||||||||||
Products |
193,567 | 284,238 | 1,338,703 | ||||||||
Services |
27,730 | 37,127 | 40,504 | ||||||||
Gross profit |
70,238 | 64,979 | 261,242 | ||||||||
Operating expenses: |
|||||||||||
Selling, general and administrative |
95,240 | 140,742 | 257,559 | ||||||||
Research and development |
38,044 | 63,243 | 143,291 | ||||||||
Amortization of intangible assets |
206 | — | 4,111 | ||||||||
Impairment of goodwill and other long-lived assets |
— | 33,287 | 27,220 | ||||||||
Restructuring |
16,018 | 46,495 | 13,059 | ||||||||
Net gain on divestitures |
(5,548 | ) | (100 | ) | (7,782 | ) | |||||
Total operating expenses |
143,960 | 283,667 | 437,458 | ||||||||
Operating loss |
(73,722 | ) | (218,688 | ) | (176,216 | ) | |||||
Interest income |
2,018 | 2,093 | 7,491 | ||||||||
Interest expense |
(279 | ) | (552 | ) | (10,439 | ) | |||||
Other income, net |
9,808 | 2,303 | 35,427 | ||||||||
Loss before income taxes |
(62,175 | ) | (214,844 | ) | (143,737 | ) | |||||
Income tax expense |
(3,115 | ) | (10,860 | ) | (7,087 | ) | |||||
Net loss |
(65,290 | ) | (225,704 | ) | (150,824 | ) | |||||
Net loss attributable to noncontrolling interests |
161 | 16 | 508 | ||||||||
Net loss attributable to UTStarcom, Inc. |
$ | (65,129 | ) | $ | (225,688 | ) | $ | (150,316 | ) | ||
Net loss per share attributable to UTStarcom, Inc.—Basic and Diluted |
$ | (0.48 | ) | $ | (1.77 | ) | $ | (1.22 | ) | ||
Weighted average shares outstanding—Basic and Diluted |
137,057 | 127,346 | 123,490 | ||||||||
(See Note 17 for net sales, cost of net sales and operating expenses to related parties included above) |
|||||||||||
See accompanying notes to consolidated financial statements.
92
CONSOLIDATED STATEMENTS OF STOCKHOLDERS' EQUITY
| |
Common Stock | |
|
Accumulated Other Comprehensive Income |
|
|
|
|||||||||||||||||||
|---|---|---|---|---|---|---|---|---|---|---|---|---|---|---|---|---|---|---|---|---|---|---|---|---|---|---|
| |
Additional Paid-in-Capital |
(Accumulated Deficit) |
Non-controlling interest |
Comprehensive Income |
Total Stockholders' Equity |
|||||||||||||||||||||
| |
Shares | Amount | ||||||||||||||||||||||||
| |
(in thousands, except number of shares) |
|||||||||||||||||||||||||
Balance at December 31, 2007 |
123,467,204 | $ | 152 | $ | 1,216,691 | $ | (691,170 | ) | $ | 92,303 | $ | 3,705 | $ | 621,681 | ||||||||||||
Common stock issued upon ESPP purchases and option exercises |
796,596 | — | 1,741 | — | — | — | 1,741 | |||||||||||||||||||
Restricted stock issued and restricted stock units released |
3,125,094 | — | — | — | — | — | — | |||||||||||||||||||
Restricted stock cancellation |
(822,500 | ) | — | — | — | — | — | — | ||||||||||||||||||
Stock-based compensation |
— | — | 20,642 | — | — | — | 20,642 | |||||||||||||||||||
Liquidation of ownership interest in a variable interest entity |
— | — | — | — | — | (2,389 | ) | (2,389 | ) | |||||||||||||||||
Net loss |
— | — | — | (150,316 | ) | — | (508 | ) | $ | (150,824 | ) | (150,824 | ) | |||||||||||||
Other comprehensive income: |
||||||||||||||||||||||||||
Unrealized (loss) on available-for-sale securities (net of tax benefit of $217) |
— | — | — | — | (2,353 | ) | — | (2,353 | ) | (2,353 | ) | |||||||||||||||
Realization of previously unrealized gains (net of tax of $3,243) |
— | — | — | — | (36,909 | ) | — | (36,909 | ) | (36,909 | ) | |||||||||||||||
Realization of previously unrealized foreign currency translation (net of tax of $0) |
— | — | — | — | (3,670 | ) | — | (3,670 | ) | (3,670 | ) | |||||||||||||||
Foreign currency translation (net of tax benefit of $140) |
— | — | — | — | 19,723 | — | 19,723 | 19,723 | ||||||||||||||||||
Total comprehensive loss |
— | — | — | — | — | — | $ | (174,033 | ) | (174,033 | ) | |||||||||||||||
Balance at December 31, 2008 |
126,566,394 | $ | 152 | $ | 1,239,074 | $ | (841,486 | ) | $ | 69,094 | $ | 808 | $ | 467,642 | ||||||||||||
Common stock issued upon ESPP purchases and option exercises |
280,609 | 1 | 364 | — | — | 365 | ||||||||||||||||||||
Restricted stock issued and restricted stock units released |
3,463,240 | — | — | — | — | — | ||||||||||||||||||||
Restricted stock cancellation |
(215,254 | ) | — | — | — | — | — | |||||||||||||||||||
Stock-based compensation |
— | — | 12,094 | — | — | 12,094 | ||||||||||||||||||||
Net loss |
— | — | — | (225,688 | ) | — | (16 | ) | $ | (225,704 | ) | (225,704 | ) | |||||||||||||
Other comprehensive income: |
||||||||||||||||||||||||||
Realization of previously unrealized losses (net of tax of $0) |
— | — | — | — | 3,313 | 3,313 | 3,313 | |||||||||||||||||||
Realization of previously unrealized foreign currency translation (net of tax of $0) |
— | — | — | — | 2,164 | 2,164 | 2,164 | |||||||||||||||||||
Foreign currency translation (net of tax expense of $11) |
— | — | — | — | (3,723 | ) | (3,723 | ) | (3,723 | ) | ||||||||||||||||
Total comprehensive loss |
— | — | — | — | — | $ | (223,950 | ) | (223,950 | ) | ||||||||||||||||
Balance at December 31, 2009 |
130,094,989 | $ | 153 | $ | 1,251,532 | $ | (1,067,174 | ) | $ | 70,848 | $ | 792 | $ | 256,151 | ||||||||||||
Common stock issued |
22,546,474 | 29 | 44,559 | — | — | $ | 44,588 | |||||||||||||||||||
Common stock issued upon option exercises |
2,054 | — | 6 | — | — | 6 | ||||||||||||||||||||
Restricted stock issued and restricted stock units released |
3,068,332 | — | — | — | — | |||||||||||||||||||||
Stock-based compensation |
— | — | 7,602 | — | — | 7,602 | ||||||||||||||||||||
Acquisition of ownership of controlling interests |
7,380 | 7,380 | ||||||||||||||||||||||||
Repurchases of vested restricted stock/units and cancellation |
(384,631 | ) | — | (72 | ) | — | — | (72 | ) | |||||||||||||||||
Net loss |
— | — | — | (65,129 | ) | — | (161 | ) | $ | (65,290 | ) | $ | (65,290 | ) | ||||||||||||
Other comprehensive income: |
||||||||||||||||||||||||||
Foreign currency translation |
— | — | — | — | (1,425 | ) | (1,425 | ) | (1,425 | ) | ||||||||||||||||
Total comprehensive loss |
— | — | — | — | — | $ | (66,715 | ) | (66,715 | ) | ||||||||||||||||
Balance at December 31, 2010 |
155,327,218 | $ | 182 | $ | 1,303,627 | $ | (1,132,303 | ) | $ | 69,423 | $ | 8,011 | $ | 248,940 | ||||||||||||
See accompanying notes to consolidated financial statements.
93
UTSTARCOM, INC.
CONSOLIDATED STATEMENTS OF CASH FLOWS
| |
Years Ended December 31, | |||||||||||
|---|---|---|---|---|---|---|---|---|---|---|---|---|
| |
2010 | 2009 | 2008 | |||||||||
| |
(in thousands) |
|||||||||||
CASH FLOWS FROM OPERATING ACTIVITIES: |
||||||||||||
Net loss |
$ | (65,290 | ) | $ | (225,704 | ) | $ | (150,824 | ) | |||
Adjustments to reconcile net loss to net cash provided by (used in) operating activities: |
||||||||||||
Depreciation and amortization |
5,427 | 13,135 | 38,018 | |||||||||
Amortization of deferred gain on sale-leaseback |
(755 | ) | — | — | ||||||||
Gain on sale of investments and liquidation of ownership interest in a variable interest entity |
— | (355 | ) | (48,375 | ) | |||||||
Net gain on divestitures |
(5,548 | ) | (100 | ) | (7,782 | ) | ||||||
Net loss (gain) on disposal of assets |
123 | (686 | ) | — | ||||||||
Gain on settlement of an investment interest |
(481 | ) | — | — | ||||||||
Impairment of goodwill and other long-lived assets |
— | 33,325 | 27,220 | |||||||||
Impairment of equity investments and variable interest entity |
— | 6,456 | 4,307 | |||||||||
Stock-based compensation expense |
7,602 | 12,094 | 20,565 | |||||||||
Provision for (recovery of) doubtful accounts |
5,513 | (6,757 | ) | (5,227 | ) | |||||||
Deferred income taxes |
2,008 | 904 | (6,440 | ) | ||||||||
Changes in operating assets and liabilities, excluding impact of divestitures: |
||||||||||||
Accounts receivable |
3,793 | 123,314 | 58,869 | |||||||||
Inventories and deferred costs |
103,574 | 72,816 | 15,825 | |||||||||
Other assets |
2,366 | 83,050 | (2,697 | ) | ||||||||
Accounts payable |
(28,036 | ) | (127,702 | ) | 128,921 | |||||||
Income taxes payable |
(2,933 | ) | (1,665 | ) | 4,558 | |||||||
Customer advances |
(40,910 | ) | (29,154 | ) | (64,941 | ) | ||||||
Deferred revenue |
(27,792 | ) | 4,177 | (13,796 | ) | |||||||
Other liabilities |
(50,843 | ) | (24,596 | ) | (53,365 | ) | ||||||
Net cash used in operating activities |
(92,182 | ) | (67,448 | ) | (55,164 | ) | ||||||
CASH FLOWS FROM INVESTING ACTIVITIES: |
||||||||||||
Additions to property, plant and equipment |
(3,449 | ) | (2,012 | ) | (14,214 | ) | ||||||
Proceeds from sale of building, net of tax payments |
123,955 | — | — | |||||||||
Deposit received on sale of building |
— | 7,307 | — | |||||||||
Net proceeds from divestitures |
3,381 | 11,508 | 214,051 | |||||||||
Proceeds from settlement of an investment interest, net |
481 | 2,639 | 33,429 | |||||||||
Proceeds from repayment of loan by a variable interest entity |
— | — | 7,728 | |||||||||
Change in restricted cash |
13,260 | (1,973 | ) | (8,216 | ) | |||||||
Purchase of investment interests |
(2,702 | ) | — | — | ||||||||
Purchase of short-term investments |
(12,583 | ) | (6,945 | ) | (13,816 | ) | ||||||
Proceeds from sale of short-term investments |
10,815 | 10,159 | 26,723 | |||||||||
Other |
335 | 635 | 361 | |||||||||
Net cash provided by investing activities |
133,493 | 21,318 | 246,046 | |||||||||
CASH FLOWS FROM FINANCING ACTIVITIES: |
||||||||||||
Issuance of common stock and option per stock purchase agreement , net of expense |
34,594 | — | — | |||||||||
Issuance of common stock upon exercise of options and ESPP |
— | 367 | 1,741 | |||||||||
Change in bank overdrafts |
— | (755 | ) | (6,248 | ) | |||||||
Proceeds from borrowings |
— | — | 50,000 | |||||||||
Payments on borrowings |
— | — | (375,317 | ) | ||||||||
Repurchase of common stock |
(67 | ) | — | — | ||||||||
Other |
— | — | (2,788 | ) | ||||||||
Net cash provided by (used in) financing activities |
34,527 | (388 | ) | (332,612 | ) | |||||||
Effect of exchange rate changes on cash and cash equivalents |
9,826 | 2,758 | 13,884 | |||||||||
Net increase (decrease) in cash and cash equivalents |
85,664 | (43,760 | ) | (127,846 | ) | |||||||
Cash and cash equivalents at beginning of year |
265,843 | 309,603 | 437,449 | |||||||||
Cash and cash equivalents at end of year |
$ | 351,507 | $ | 265,843 | $ | 309,603 | ||||||
Supplemental disclosure of cash flow information: |
||||||||||||
Cash paid: |
||||||||||||
Interest |
$ | 279 | $ | 552 | $ | 20,552 | ||||||
Income taxes |
$ | 6,395 | $ | 9,243 | $ | 7,547 | ||||||
Non-cash operating activities Accounts receivable transferred to notes receivable |
$ | 580 | $ | 2,867 | $ | 22,742 | ||||||
Non-cash investing activities |
||||||||||||
Issuance of common stock for acquisition of Stage Smart |
$ | 9,841 | $ | — | $ | — | ||||||
Net assets acquired, other than cash, from acquisition of Stage Smart |
$ | 17,380 | $ | — | $ | — | ||||||
See accompanying notes to the consolidated financial statements.
94
NOTES TO CONSOLIDATED FINANCIAL STATEMENTS
NOTE 1—BASIS OF PRESENTATION AND LIQUIDITY
UTStarcom Inc. ("Company"), a Delaware corporation incorporated in 1991 with headquarters currently in Beijing, China, designs and sells Internet Protocol ("IP")-based telecommunications infrastructure products to telecommunications service providers or operators throughout the world. It also provides telecommunications infrastructure installation, operations and maintenance services. The Company enables its customers to rapidly deploy revenue-generating access services using their existing infrastructure, while providing a migration path to cost-efficient end-to-end IP networks.
The accompanying consolidated financial statements include the accounts of the Company and its wholly-and majority-owned subsidiaries and Variable Interest Entities. All significant intercompany accounts and transactions have been eliminated in the preparation of the consolidated financial statements. The noncontrolling interests in consolidated subsidiaries are shown separately in the consolidated financial statements.
The accompanying consolidated balance sheets as of December 31, 2010 and 2009, and consolidated statements of operations for each of the three years in the period ended December 31, 2010 have been prepared by the Company pursuant to the rules and regulations of the Securities and Exchange Commission ("SEC") and in conformity with generally accepted accounting principles in the United States of America ("GAAP").
The accompanying consolidated financial statements are presented on the basis that the Company is a going concern. The going concern assumption contemplates the realization of assets and the satisfaction of liabilities in the normal course of business.
The Company has incurred net losses attributable to UTStarcom, Inc. of $65.1 million, $225.7 million and $150.3 million during the years ended December 31, 2010, 2009 and 2008, respectively. The Company has recorded operating losses in 23 of the 24 consecutive quarters in the period ended December 31, 2010. At December 31, 2010, the Company had an accumulated deficit of $1,132.3 million. The Company incurred net cash outflows from operations of $92.2 million, $67.4 million and $55.2 million in 2010, 2009 and 2008 respectively.
At December 31, 2010, the Company had cash and cash equivalents of $351.5 million, of which $213.7 million was held by subsidiaries in China. China imposes currency exchange controls on certain transfers of funds to and from China. The amount of cash available for transfer from the China subsidiaries for use by the Company's non-China subsidiaries is limited both by the liquidity needs of the subsidiaries in China and the restriction on currency exchange by Chinese-government mandated limitations including currency exchange controls on certain transfers of funds outside of China.
Our China subsidiaries have an accumulated profit of $84.7 million as of December 31, 2010 determined in accordance with Chinese accounting standards that could be paid as dividends. Our China subsidiaries paid an aggregate $150 million in dividends to our U.S. parent company during the year ended December 31, 2007 and another $100 million in February 2008. While these cash transfers are offset and eliminated in preparing our consolidated cash flow statements, they have been a principal source of funding of our non-China operations during the periods in which they were made. In February 2009, our China subsidiaries paid an additional $50 million in dividends to our U.S. parent company. However, going forward, the amount of cash available for transfer from the China subsidiaries will be limited both by the liquidity needs of the subsidiaries in China and the restriction on currency exchange by Chinese government mandated requirements including currency exchange controls on certain transfers of funds outside of China.
At December 31, 2010, we had approximately $28.7 million of available credit facilities. In the second quarter of 2010, we entered into two credit facilities totaling $29.4 million. Both credit facilities
95
NOTES TO CONSOLIDATED FINANCIAL STATEMENTS (Continued)
NOTE 1—BASIS OF PRESENTATION AND LIQUIDITY (Continued)
can be used for the issuance of certain letters of credit and guarantees and both facilities expire in the second quarter of 2011.
Global economies have experienced a significant downturn driven by a financial and credit crisis that will continue to challenge such economies for some period of time. Under the current macroeconomic environment, there are significant risks and uncertainties inherent in management's ability to forecast future results. The operating environment confronting the Company, both internally and externally, raises significant uncertainties.
In the past years, the Company took a number of actions to improve its liquidity. In March 2008, the Company paid $289.5 million to retire the Company's convertible subordinated notes and related accrued interest. On July 1, 2008, the Company completed the sale of PCD, see Note 3. In addition, the Company divested its Mobile Solutions Business Unit in July 2008. In the fourth quarter of 2008, management initiated actions to disband its Customs Solutions Business Unit, to wind down the Company's Korea based handset operations, and announced initiatives including efforts to eliminate functional duplications by consolidation of a number of functions into the Company's China operations. In June 2009, management expanded the initiatives to include a worldwide reduction in workforce, outsourcing of manufacturing operations and optimizing research and development spending with a focus on selected products. The Company's year-over-year from 2008 to 2009 and 2010 selling, general and administrative and research and development operating expenses decreased significantly from year to year and management believes the continuing efforts to stream-line operations will enable the Company's fixed cost base to be better aligned with operations, market demand and projected sales levels. If projected sales do not materialize, the Company will need to take further actions to reduce costs and expenses or explore other cost reduction options.
In December 2009, the Company entered into a Sale Leaseback Agreement for the sale of its manufacturing, research and development, and administrative offices facility in Hangzhou, China to another third party for approximately $138.8 million and leaseback of a portion of the facility. As of May 31, 2010, the Company had received all of the sales proceeds and met all criteria for consummation of sale of the Hangzhou facility. See Note 6 for additional information on sale-leaseback transaction. On May 31, 2010, the Company and the buyer agreed that all conditions precedent to the closing had been met and the leaseback commenced on June 1, 2010. The Company has decided to terminate the lease of Hangzhou facility in June 2011 and notified the landlord on December 8, 2010, six months in advance, according to the termination clause in the Lease agreement.
On February 1, 2010, the Company entered into agreements for a strategic relationship with Beijing E-town International Investment and Development Co., Ltd ("BEIID") which included a proposed investment of $48.5 million in the Company's common stock by BEIID, and two unrelated investment funds, Elite Noble Limited and Shah Capital Opportunity Fund LP. The stock purchase agreements were subsequently amended on May 4, 2010, June 4, 2010 and July 7, 2010, respectively. These investment transactions closed in September 2010. Under the terms of agreements, as revised, UTStarcom received cash of $34.6 million, net of issuance costs, and issued approximately 18.1 million shares of common stock and an option to purchase up to an additional 4.0 million shares of common stock for approximately $8.1 million through November 8, 2010. The option expired unexercised as of December 31, 2010. See Note 10 for additional information.
Management believes that the continuing efforts to stream-line its operations will enable its fixed cost base to be better aligned with operations, market demand and projected sales level. Management believes both the Company's China and non-China operations will have sufficient liquidity to finance working capital and capital expenditure needs in excess of 12 months. Furthermore, the Company has
96
NOTES TO CONSOLIDATED FINANCIAL STATEMENTS (Continued)
NOTE 1—BASIS OF PRESENTATION AND LIQUIDITY (Continued)
concentrated its business in Asia, particularly China, India and Japan. Any unforeseen prolonged economic and /or political risks in these markets could impact the Company's customers in making their respective investment decisions could have a material impact on the foregoing assessment. There can be no assurance that additional financing, if required, will be available on terms satisfactory to the Company or at all, and if funds are raised in the future through issuance of preferred stock or debt, these securities could have rights, privileges or preference senior to those of the Company's common stock and newly issued debt could contain debt covenants that impose restrictions on the Company's operations. Further, any sale of newly issued debt or equity securities could result in additional dilution to the Company's current shareholders.
NOTE 2—SUMMARY OF SIGNIFICANT ACCOUNTING POLICIES
Use of Estimates:
The preparation of consolidated financial statements in conformity with generally accepted accounting principles in the United States of America requires management to make estimates and assumptions that affect the reported amounts of assets and liabilities and disclosure of contingent assets and liabilities at the date of the consolidated financial statements and the reported amounts of revenues and expenses during the reporting period. Significant judgment and estimates are used for revenue recognition, allowance for doubtful accounts and sales returns, tax valuation allowances, inventory write-down, deferred costs, accrued product warranty costs, provisions for contract losses, recoverability of goodwill and intangible assets, other long-lived asset impairments, stock-based compensation expense, loss contingencies and restructuring expenses among others. Actual results could differ materially from those estimates.
Cash and Cash Equivalents:
Cash and cash equivalents consist of highly liquid instruments with original maturities of three months or less. Approximately 18% , $64.5 million of cash and cash equivalents is held in the U.S. as of December 31, 2010. The remainder is held by the other UTStarcom entities throughout the world. At December 31, 2010, approximately 61%, $213.7 million of the Company's cash and cash equivalents were held by its subsidiaries in China and China imposes currency exchange controls on transfers of funds outside of China. Cash and cash equivalents are invested in institutional money market funds, short-term bank deposits and similar short duration instruments with fixed maturities from overnight to three months.
Restricted Cash:
At December 31, 2010, the Company had short-term restricted cash of $16.0 million, and had long-term restricted cash of $8.4 million included in other long-term assets. At December 31, 2009, the Company had short-term restricted cash of $26.4 million, and had long-term restricted cash of $10.6 million included in other long-term assets. These amounts primarily collateralize the Company's issuances of standby and commercial letters of credit.
Investments:
The Company's investments consist principally of bank notes and equity securities of publicly traded and privately held companies. The Company's investments in publicly traded equity securities are accounted for under ASC 320, "Investment, Debt and Equity Securities" and are classified as available-for-sale. These investments are recorded at fair value with the unrealized gains and losses
97
NOTES TO CONSOLIDATED FINANCIAL STATEMENTS (Continued)
NOTE 2—SUMMARY OF SIGNIFICANT ACCOUNTING POLICIES (Continued)
included as a separate component of accumulated other comprehensive income, net of tax. During 2009, the Company sold its remaining investment in publicly traded equity securities. The investments in equity securities of privately held companies in which the Company holds less than 20% voting interest and on which the Company does not have the ability to exercise significant influence are accounted for under ASC 325, "Investments—Other" using the cost method. Under the cost method, these investments are carried at the lower of cost or fair market value. The investments in equity securities of privately held companies in which we hold less than 50% voting interest and on which we have the ability to exercise significant influence are accounted for under ASC 323, "Investments—Equity Method and Joint Ventures" using the equity method .
The Company recognizes an impairment charge when a decline in the fair value of its investments below the cost basis is judged to be other-than-temporary. In making this determination, the Company reviews several factors to determine whether the losses are other-than-temporary, including but not limited to: (i) the length of time the investment was in an unrealized loss position, (ii) the extent to which fair value was less than cost, (iii) the financial condition and near term prospects of the issuer and (iv) the Company's intent and ability to hold the investment for a period of time sufficient to allow for any anticipated recovery in fair value.
Revenue Recognition:
Revenues from sales of telecommunications equipment and handsets are recognized when persuasive evidence of an arrangement exists, delivery has occurred, the fee is fixed or determinable and collectability is probable. If the payment due from the customer is not fixed or determinable due to extended payment terms, revenue is recognized as payments become due and payable by the customer, assuming all other criteria for revenue recognition are met. Any payments received prior to revenue recognition are recorded as customer advances. Normal payment terms differ for various reasons amongst different customer regions, depending upon common business practices for customers within a region. Billing to customers for shipping and handling are recorded as revenues and the associated costs are recorded as costs of revenues. Any expected losses on contracts are recognized when identified on an individual basis in accordance with the prevailing accounting guidance for the respective contract.
Sales may be generated from complex contractual arrangements that require significant revenue recognition judgments, particularly in the area of contracts with multiple deliverable elements (multiple element arrangements). Where multiple elements exist in an arrangement, the contract price is allocated to the different elements based upon and in proportion to verifiable objective evidence of the fair value of the various elements. Multiple element arrangements primarily involve the sale of equipment, installation, training and post-contract support. Revenue is recognized as each element is earned, namely upon installation and acceptance of equipment or delivery of handsets, provided that the fair value of the undelivered element(s) has been determined, the delivered element(s) has stand-alone value, there is no right of return on delivered element(s), and the Company is in control of the undelivered element(s). For arrangements that include service elements, including promotional support and installation, for which verifiable objective evidence of the fair value does not exist, revenue is deferred until such services are deemed complete, or until the time the Company can establish verifiable objective evidence of the fair value.
Final acceptance is required for revenue recognition when installation services are not considered perfunctory. Final acceptance indicates that the customer has fully accepted delivery and installation, if any, of equipment and the Company is entitled to full payment. The Company does not recognize
98
NOTES TO CONSOLIDATED FINANCIAL STATEMENTS (Continued)
NOTE 2—SUMMARY OF SIGNIFICANT ACCOUNTING POLICIES (Continued)
revenue before final acceptance is granted by the customer if acceptance is considered substantive to the transaction. The sales contracts the Company enters into typically include customer acceptance provisions and require the customer to issue a final acceptance certificate to evidence the customer's acceptance of the products and services. In those circumstances, the Company is unable to enforce payment terms until after the receipt of the final acceptance certificate because the payment conditions are dependent on the issuance of the final acceptance certificate. The Company's products are generally deployed within the core network of its telecommunications customers. The acceptance terms for the products and services include initial test, on-site testing and trial running. Based on the Company's past experience, the customer's acceptance process for larger and complex projects may take longer than twelve months. As a result, the customer run prolonged and rigorous tests to ensure the Company's products work seamlessly with the customer's existing network. Each telecommunication customer runs its unique tests, as the equipment performance can vary based on how the equipment works in combination with the customer's other equipment, software and other conditions. Given that there is uncertainty about customer acceptance until the customer completes its internal testing and procedures, the Company waits until the issuance of the final acceptance certificate to support its assertion that the delivery of products and services has occurred. For significant customer contracts involving larger and complex projects where there is on-site testing at multiple locations and the taking over of product warranty and product title occurs after the acceptance of the products and services, acceptance is substantive to the transaction.
Where multiple elements exist in an arrangement that includes software, and the software is considered more than incidental to the equipment or services in the arrangement, software and software related elements are recognized in accordance with the specific guidance for recognizing software revenue. The Company allocates revenues to each element of software arrangements based on vendor specific objective evidence ("VSOE") of fair value. VSOE of fair value of each element is based on the price charged when the same element is sold separately. The Company uses the residual method to recognize revenue when an arrangement includes one or more elements to be delivered at a future date and VSOE of the fair value of all the undelivered elements exists. Under the residual method, the fair value of the undelivered elements is deferred and the remaining portion of the contract price is recognized as revenue when all other revenue recognition criteria are met. If VSOE of fair value of one or more undelivered elements does not exist, all revenue for delivered and undelivered elements is deferred until delivery of all elements occurs or when VSOE of fair value of the undelivered elements can be established. In some cases the Company has agreed to give software upgrade rights on a "when and if made available" basis for equipment sold for no additional consideration and for an unspecified period which could extend over the term of the contract. This additional contract obligation is an element of "post-contract support." The Company has not established VSOE for such contract element. Accordingly, the revenues from such contracts are recognized ratably over the period during which the post-contract support is expected to be provided. The expected period of support is generally the term of the contract. In some cases where there is no stated contractual term, revenue is recognized ratably over the estimated period of support. The Company reviews assumptions regarding the estimated post contract support periods on a regular basis. If the Company determines that it is necessary to revise the Company's estimates of the support periods, the amount of revenue recognized over the life of the contract would not be affected. However, to the extent the new assumptions regarding the post-contract support periods were different from the original assumptions, the contract revenues would be recognized over the remaining expected period of support. Due to the China telecommunication industry restructuring and launch of 3G services in China, the Ministry of Industry and Information Technology of China announced that PAS services in China will be phased out by
99
NOTES TO CONSOLIDATED FINANCIAL STATEMENTS (Continued)
NOTE 2—SUMMARY OF SIGNIFICANT ACCOUNTING POLICIES (Continued)
January 1, 2012. In the second and third quarter of 2009, the Company streamlined its sales, service and research and development operations for PAS handsets and infrastructure equipment. The Company does not perform any new research and development of PAS products and it maintains a small support team to assist its customers with warranty matters. In the later part of the third quarter of 2009 and the early part of the fourth quarter of 2009, the Company contacted its PAS infrastructure customers and held discussions with them on the PAS products future. In October 2009, the Company notified its PAS infrastructure customers in China that it will no longer provide upgrades or support of PAS products beyond December 31, 2011. Consequently, the Company determined the remaining expected period of support as 2 years from the fourth quarter of 2009 and hence deferred revenue associated with PAS infrastructure is being recognized ratably beginning in the fourth quarter of 2009 through the fourth quarter of 2011. As of December 31, 2010, we have approximately $93.4 million of deferred revenue associated with PAS infrastructure sales for which we accelerated the amortization period of support.
Revenue from fixed priced contracts that include a requirement for significant software modification or customization is recognized using the completed contract method of accounting, whereby no revenue is recognized prior to the completion of the project, because for contracts involving unique requirements the Company is unable to make reasonably dependable estimates of progress towards meeting contractual requirements. In the event estimated total project costs exceed estimated total project revenues, the entire estimated loss is charged to operations in the period in which the loss becomes probable and can be reasonably estimated. The complexity of the estimation process and judgments about internal and external factors including labor utilization, changes to specifications and testing requirements, time required for performance and resulting incurrence of contract penalties, and the performance of subcontractors affect the estimation process. During the years ended December 31, 2010, 2009 and 2008, the Company recorded approximately $2.6 million, $4.9 million and $18.4 million contract loss on a fixed price contract, respectively. Contract loss recorded during 2008 includes $3.4 million relating to costs that should have been recorded in prior periods. The impact of recording these prior period costs on the period prior to 2008 and on 2008 is not material.
The Company recognizes revenue for system integration, installation and training upon completion of performance and if all other revenue recognition criteria are met. Other service revenue, principally related to maintenance and support contracts, is recognized ratably over the maintenance term.
The Company also sells products through resellers. Revenue is generally recognized when the standard price protection period, which ranges from 30 to 90 days, has lapsed. If collectability cannot be reasonably assured in a reseller arrangement, revenue is recognized upon sell-through to the end customer and receipt of cash. There may be additional obligations in reseller arrangements such as inventory rotation, or stock exchange rights on the product. In most cases, the Company has developed reasonable estimates for stock exchanges based on historical experience with similar types of sales of similar products.
The Company has sales agreements with certain wireless customers that provide for a rebate of the selling price to such customers if the particular product is subsequently sold at a lower price to such customers or to a different customer. The rebate period extends for a relatively short period of time. Historically, the amounts of such rebates paid to customers have not been material. The Company estimates the amount of the rebate based upon the terms of each individual arrangement, historical experience and future expectations of price reductions and then records its estimate of the rebate amount at the time of the sale. The Company also enters into sales incentive programs, such as
100
NOTES TO CONSOLIDATED FINANCIAL STATEMENTS (Continued)
NOTE 2—SUMMARY OF SIGNIFICANT ACCOUNTING POLICIES (Continued)
co-marketing arrangements, with certain wireless and handset customers. The Company records the incurred incentive as a reduction of revenue when the sales revenue is recognized. In the fourth quarter of 2009, the Company substantially completed the wind-down of its handset business therefore such arrangements are not significant in 2010 and will not be significant in the future.
The assessment of collectability is also a factor in determining whether revenue should be recognized. The Company assesses collectability based on a number of factors, including payment history and the credit-worthiness of the customer. The Company does not request collateral from its customers. In international sales, the Company may require letters of credit from its customers that can be drawn on demand if the customer defaults on its payment. If the Company determines that collection of a payment is not reasonably assured, the Company defers revenue recognition until collection becomes reasonably assured, which is generally upon receipt of cash.
Occasionally, the Company enters into revenue sharing arrangements. Under these arrangements, the Company collects payment only after its customer, the telecommunications service provider, collects service revenues. When the Company enters into a revenue sharing arrangement, the Company does not recognize revenue until collection is reasonably assured.
Because of the nature of doing business in China and other emerging markets, the Company's billings and/or customer payments may not correlate with the contractual payment terms and the Company generally does not enforce contractual payment terms prior to final acceptance. Accordingly, accounts receivable are not recorded until the Company recognizes the related customer revenue. Advances from customers are recognized when the Company has collected cash from the customer, prior to recognizing revenue. Deferred revenue is recorded if there are undelivered elements after final acceptance has been obtained. The Company had current deferred revenue of $183.0 million and $170.8 million, and long-term deferred revenue of $122.2 million and $160.9 million at December 31, 2010 and 2009, respectively. Costs related to deferred revenue are also deferred until revenue is recognized. See "Deferred Costs" below.
Product Warranty:
The Company provides a warranty on its equipment and handset sales for a period generally ranging from one to two years from the time of final acceptance. At times, the Company has entered into arrangements to provide limited warranty services for periods longer than two years. The Company provides for the expected cost of product warranties at the time that revenue is recognized based on an assessment of past warranty experience and when specific circumstances dictate. The Company assesses the adequacy of its recorded warranty liability every quarter and makes adjustments to the liabilities if necessary. Specific warranty accruals are reversed upon the expiration of the warranty period and are recorded as reduction of cost of sales. From time to time, the Company may be subject to additional costs related to non-standard warranty claims from its customers. If and when this occurs, the Company estimates additional accruals based on historical experience, communication with its customers and various assumptions that the Company believes to be reasonable under the circumstances. Such additional warranty accruals are recorded in the period in which the additional costs are identified.
Receivables:
Although the Company evaluates customer credit worthiness prior to a sale, the Company provides an allowance for doubtful accounts for the estimated loss on trade and notes receivable when collection may no longer be reasonably assured. The Company assesses collectability of receivables based on a number of factors including analysis of creditworthiness, the Company's historical collection history and
101
NOTES TO CONSOLIDATED FINANCIAL STATEMENTS (Continued)
NOTE 2—SUMMARY OF SIGNIFICANT ACCOUNTING POLICIES (Continued)
current economic conditions, its ability to collect payment and on the length of time an individual receivable balance is outstanding. The Company's policy for determining the allowance for doubtful accounts includes both specific allowances for balances known to be uncollectible and a formula-based portfolio approach, based on aging of the accounts receivable, as a precursor to a management review of the overall allowance for doubtful accounts. This formula-based approach involves aging of the Company's accounts receivable and applying a percentage based on the Company's historical experience; this approach results in the allowance being computed based on the aging of the receivables. The Company evaluates the percentages applied to each category of aged accounts receivable periodically based on actual history of write-offs and collections and refines this formula-based approach accordingly for use in future periods.
The Company has certain accounts receivable in China that have been outstanding for a significant period of time. The Company provides allowances for these receivables based on the criteria discussed above. While the Company believes it has sufficient experience and knowledge of the China market and customer payment patterns to reasonably estimate such allowances, actual payment patterns and customer behavior could differ from its expectations. The Company uses actual collection experience to periodically adjust the percentages used in applying the formula-based portfolio approach as discussed above.
Inventories:
Inventories consist of product held at the Company's manufacturing facility and warehouses, as well as finished goods at customer sites for which the customer has taken possession, but based on specific contractual terms, title has not yet passed to the customer. The Company may ship inventory to existing customers that require additional equipment to expand their existing networks prior to the signing of an expansion contract. Inventories are stated at the lower of cost or market value, based on the FIFO method of accounting. Write-downs are based on the assumptions about future market conditions and customer demand, including projected changes in average selling prices resulting from competitive pricing pressures. The Company continually monitors inventory valuation for potential losses and obsolete inventory at its manufacturing facilities as well as at customer sites. If actual market conditions are less favorable than those projected by management, additional write-downs may be required. If actual market conditions are more favorable than anticipated, inventory previously written down may be sold to customers, resulting in lower cost of sales and higher income from operations than expected in that period.
Deferred costs:
Deferred costs consist of product shipped to the customer for which the rights and obligations of ownership have passed to the customer but revenue has not yet been recognized due to prolonged acceptance periods for tests and the existence of undelivered elements, such as post-contract support including software update rights for which the Company does not have a vendor specific objective evidence of fair value. All deferred costs are stated at cost. Management periodically assesses the recoverability of deferred costs and provides reserves against deferred cost balances when recovery of deferred costs is not probable. Recoverability is evaluated based on various factors including the length of time the product has been held at the customer site, the viability of payment, including assessment of product demand if a revenue sharing arrangement exists and/or the evaluation if a related transaction will result in a gross margin loss. In a loss situation for a transaction, the deferred cost balance is adjusted for impairment equal to the value of the excess of cost over the amount of revenue that will be eventually recognized for the transaction. Revenue and cost of sales are recorded when
102
NOTES TO CONSOLIDATED FINANCIAL STATEMENTS (Continued)
NOTE 2—SUMMARY OF SIGNIFICANT ACCOUNTING POLICIES (Continued)
final acceptance is received from the customer. With greater concentration of product at customer sites under contract with specific or individual customers, the financial conditions of such specific or individual customers may result in increased concentration risk exposure for the Company's inventory. For any post contract support services where the revenue is deferred, the entire related deferred direct costs are classified as a noncurrent asset, consistent with the definition of a current asset.
Research and Development and Capitalized Software Development Costs:
Research and development costs are charged to expense as incurred. The Company capitalizes software development costs incurred in the development of software that will ultimately be sold, between the time technological feasibility has been attained and the related product is ready for general release. Management judgment is required in assessing technological feasibility, expected future revenues, estimated product lives and changes in product technologies, and the ultimate recoverability of the Company's capitalized software development costs.
During 2010, 2009 and 2008, the Company capitalized immaterial software development costs. Amortization of capitalized software development costs was $0.1 million, $0.2 million and $0.6 million in 2010, 2009 and 2008, respectively. Direct costs of software developed for internal use are expensed during the preliminary project stage and capitalized during the application development stage.
Property, Plant and Equipment:
Property, plant and equipment are recorded at cost and are stated net of accumulated depreciation. Depreciation is provided for on a straight-line basis over the estimated useful lives of the related assets. Leasehold improvements are amortized on a straight-line basis over the shorter of the useful life of the improvements or the term of the lease. When assets are disposed of, the cost and related accumulated depreciation are removed from the accounts and the resulting gains or losses are included in results of operations. The Company capitalizes interest incurred related to construction of property, plant or equipment until it is ready for use. No capitalized interest was recorded during the years ended December 31, 2010, 2009 and 2008.
The Company generally depreciates its assets over the following periods:
| |
Years | |||
|---|---|---|---|---|
Furniture, test or manufacturing equipment |
5 | |||
Computers and software |
2 - 3 | |||
Buildings |
38 | |||
Automobiles |
5 | |||
Leasehold improvements |
Lesser of 5 years or remaining lease life | |||
Depreciation expense was $5.6 million, $12.8 million and $30.4 million for the years ended December 31, 2010, 2009 and 2008, respectively.
Goodwill and Intangible Assets:
Goodwill represents the excess of the purchase price over the fair value of the net tangible and identifiable intangible assets acquired in a business combination. Goodwill is not amortized and is tested annually for impairment during the fourth quarter of the fiscal year and between annual tests if an event occurs or circumstances change in accordance with ASC 350 that would more likely than not
103
NOTES TO CONSOLIDATED FINANCIAL STATEMENTS (Continued)
NOTE 2—SUMMARY OF SIGNIFICANT ACCOUNTING POLICIES (Continued)
reduce the fair value below its carrying amount. Impairment testing of goodwill is performed at a reporting unit level. Fair value of reporting units is generally determined using a discounted cash flow analysis. This approach uses significant estimates and assumptions including projected future cash flows, the timing of such cash flows, discount rates reflecting the risk inherent in future cash flows, perpetual growth rates, determination of appropriate comparable entities and the determination of whether a premium or discount should be applied to comparables. In addition to the estimates of future cash flows, two of the most significant estimates involved in the determination of fair value of the reporting units are the discount rates and perpetual growth rate applied to terminal values used in the discounted cash flow analysis. The discount rates used in the cash flow models for the goodwill impairment testing considers market and industry data as well as specific risk factors for each reporting unit. The perpetual growth rates for the individual reporting units, for purposes of the terminal value determination, are generally set after an initial three-year forecasted period, although certain reporting units utilized longer forecasted periods, and are based on historical experience, market and industry data.
Intangible assets resulting from the acquisitions of entities accounted for using the acquisition method of accounting are estimated by management based on the fair value of assets received. Intangible assets with finite useful lives mainly consist of technologies and non-compete agreement and are amortized on a straight-line basis, generally, over four years.
For the years ended December 31, 2010 and 2008, the amortization, asset sales, and impairment charges were approximately $0.2 million and $4.9 million, respectively. The Company's consolidated balance sheet as of December 31, 2009 had zero balances for purchased intangible assets. The consolidated balance sheet as of December 31, 2010 has $13.8 million of goodwill and $5.0 million of intangible assets, see Note 11.
Impairment of Long-Lived Assets:
Long-lived assets are reviewed for impairment whenever events or changes in circumstances indicate that the carrying amount may not be recoverable. If undiscounted expected future cash flows are less than the carrying value of the assets, an impairment loss is recognized based on the excess of the carrying amount over the fair value of the assets. See Note 6. Long-lived assets that are to be disposed of by sale are measured at the lower of book value or fair value less cost to sell.
Advertising Costs:
The Company expenses all advertising costs as incurred. Payment to customers for marketing development costs are accounted for as a reduction of the revenue associated with customers as incurred. For the years ended December 31, 2010, 2009 and 2008, advertising costs totaled $0.7 million, $0.8 million and $4.3 million, respectively.
104
NOTES TO CONSOLIDATED FINANCIAL STATEMENTS (Continued)
NOTE 2—SUMMARY OF SIGNIFICANT ACCOUNTING POLICIES (Continued)
Restructuring Liabilities, Litigation and Other Contingencies:
The Company accounts for its restructuring plans using the guidance provided in ASC 420 "Exit or Disposal Cost Obligations" and ASC 712 "Compensation—Nonretirement Postemployment Benefits". The Company accounts for litigation and contingencies in accordance with ASC 450, "Contingencies", which requires that the Company record an estimated loss from a loss contingency when information available prior to issuance of the Company's financial statements indicates that it is probable that an asset has been impaired or a liability has been incurred at the date of the financial statements and the amount of loss can be reasonably estimated.
Third Party Commissions:
The Company records accruals for commissions payable to third parties in the normal course of business. Such commissions are recorded based on the terms of the contracts between the Company and the third parties and paid pursuant to such contracts. Consistent with the Company's accounting policies, these commissions are recorded as cost of net sales in the period in which the liability is incurred. Management has performed, and continues to perform, follow-up procedures with respect to these accrued commissions. Upon completion of such follow-up procedures, if the accrued commissions have not been claimed and the statute of limitations, if any, has expired, the Company reverses such accruals. Such reversals are recorded in the Statement of Operations during the period management determines that the accruals are no longer necessary. With the assistance of its China counsel, the Company concluded that for certain of these accrued commissions the statute of limitations had expired in August and November 2010, two years after formal communication was sent to these agents. During the year ended December 31, 2010, approximately $6.0 million was released to cost of net sales as a result of expiration of statute of limitations. During the years ended December 31, 2009 and 2008, respectively, the Company reversed approximately $0.8 million and $4.5 million of accrued commissions payable and such reversals were recorded in cost of net sales.
Stock-Based Compensation:
Stock-based compensation expense for all share-based payment awards granted is determined based on the grant-date fair value. Stock-based compensation expense for restricted stock awards is measured based on the closing fair market value of the Company's common stock on the date of grant. Stock-based compensation expense for stock options is estimated at the grant date based on each option's fair value as calculated by the Black-Scholes option pricing model ("Black-Scholes model"). Stock-based compensation is expensed ratably on a straight-line basis over the requisite service period, which is generally the vesting term of the share-based payment awards.
Accumulated Other Comprehensive Income:
Comprehensive income includes all changes in equity (net assets) during a period from non-owner sources. Other comprehensive income or loss for 2010, 2009 and 2008 is shown in the consolidated statement of stockholders' equity. As of December 31 of each of the two years indicated below, the
105
NOTES TO CONSOLIDATED FINANCIAL STATEMENTS (Continued)
NOTE 2—SUMMARY OF SIGNIFICANT ACCOUNTING POLICIES (Continued)
components of accumulated other comprehensive income reported in the consolidated balance sheets were as follows:
| |
December 31 | ||||||
|---|---|---|---|---|---|---|---|
| |
2010 | 2009 | |||||
| |
(in thousands) |
||||||
Unrealized gain (loss) on available-for-sale securities, net of tax |
$ | — | $ | — | |||
Foreign currency translation, net of tax |
69,423 | 70,848 | |||||
Accumulated other comprehensive income |
$ | 69,423 | $ | 70,848 | |||
Accumulated other comprehensive income includes no material amounts related to noncontrolling interests.
Income Taxes:
The Company is subject to income taxes in both the United States and numerous foreign jurisdictions. Significant judgment is required in evaluating the Company's tax positions and determining its provision for income taxes. During the ordinary course of business, there are many transactions and calculations for which the ultimate tax determination is uncertain. The Company recognizes the tax benefit (expense) from an uncertain tax position only if it is more likely than not the tax position will be sustained on examination by the taxing authorities, based on the technical merits of the position. The Company recognizes interest expense and penalties related to income tax matters as part of the provision for income taxes.
The Company recognizes deferred income taxes as the difference between the tax bases of assets and liabilities and their financial statement amounts based on enacted tax rates. Management judgment is required in the assessment of the recoverability of the Company's deferred tax assets based on its assessment of projected taxable income. Numerous factors could affect the Company's results of operations in the future. If there was a significant decline in the Company's future operating results, its assessment of the recoverability of its deferred tax assets would need to be revised, and any such adjustment to its deferred tax assets would be charged to income in that period. If necessary, the Company records a valuation allowance to reduce deferred tax assets to an amount management believes is more likely than not to be realized.
The Company provides U.S. taxes on foreign undistributed earnings that are not considered to be permanently reinvested outside the United States.
Financial Instruments and Derivatives:
Financial instruments consist of cash and cash equivalents, short and long-term investments, notes receivable, accounts receivable and payable and accrued liabilities. In the first quarter of 2008, the Company adopted new accounting guidance related to fair value measurements. This new accounting guidance did not have a material impact on the financial statements of the Company. The new disclosures required by the accounting guidance are included in Note 4. The carrying amounts of cash and cash equivalents, bank notes, accounts receivable and payable, notes receivable, and accrued liabilities approximate their fair values because of the short-term nature of those instruments. The fair value of long term investments in equity securities is determined based on quoted market prices or available information about investees.
106
NOTES TO CONSOLIDATED FINANCIAL STATEMENTS (Continued)
NOTE 2—SUMMARY OF SIGNIFICANT ACCOUNTING POLICIES (Continued)
The Company may use derivative financial instruments to manage its exposures to foreign currency exchange rate changes. The objectives for holding derivatives include reducing, eliminating, and efficiently managing the economic impact of these exposures as effectively as possible. Derivative instruments are recognized as either assets or liabilities on the balance sheet. The Company measures those instruments at fair value and recognizes changes in the fair value of derivatives in earnings in the period of change unless the derivative qualifies as an effective hedge that offsets certain exposures. Such contracts are designated at inception to the related foreign currency exposures being hedged. The Company has not hedged any such transactions in 2010, 2009 and 2008.
Foreign Currency Translation:
The Company's operations are conducted through international subsidiaries where the local currency is the functional currency and the financial statements of those subsidiaries are translated from their respective functional currencies into U.S. Dollars. All foreign currency assets and liabilities are translated at the period-end exchange rate and all revenues and expenses are translated at the average exchange rate for the period. The effects of translating the financial statements of foreign subsidiaries into U.S. Dollars are reported as a cumulative translation adjustment, a separate component of comprehensive income in stockholders' equity. The foreign currency translation gain/loss for transactions denominated in other than the functional currency is included in other income, net on the Company's consolidated statements of operations. In connection with this remeasurement process the Company recorded a gain of $8.0 million in 2010, a gain of $6.3 million in 2009 and a loss of $9.9 million in 2008.
Earnings Per Share:
Basic earnings per share ("EPS") is computed by dividing net income (loss) available to common stockholders by the weighted average number of shares of the Company's common stock outstanding during the period, which excludes nonvested restricted stock. Diluted EPS presents the amount of net income (loss) available to each share of common stock outstanding during the period plus each share of common stock that would have been outstanding assuming the Company had issued shares of common stock for all dilutive potential common shares outstanding during the period. The Company's potentially dilutive common shares include outstanding stock options, non-vested restricted stock, restricted stock units, convertible subordinated notes prior to their maturity on March 1, 2008, and Employee Stock Purchase Plan ("ESPP") shares prior to termination of the ESPP effective May 15, 2009. For the years ended December 31, 2010, 2009 and 2008, no potential common shares were dilutive because of the net loss in each of these years, therefore basic and dilutive EPS are the same. The following table summarizes the total potential shares of common stock that were excluded from the diluted per share calculation, because to include them would have been anti-dilutive for the period.
| |
Years Ended December 31, | |||||||||
|---|---|---|---|---|---|---|---|---|---|---|
| |
2010 | 2009 | 2008 | |||||||
| |
(in thousands) |
|||||||||
Weighted average stock options and awards outstanding |
7,903 | 12,412 | 22,439 | |||||||
Conversion of convertible subordinated notes |
— | — | 1,897 | |||||||
Other |
— | 109 | 931 | |||||||
|
7,903 | 12,521 | 25,267 | |||||||
107
NOTES TO CONSOLIDATED FINANCIAL STATEMENTS (Continued)
NOTE 2—SUMMARY OF SIGNIFICANT ACCOUNTING POLICIES (Continued)
Variable Interest Entities:
The accounting guidance requires that if an entity is the primary beneficiary of a variable interest entity, ("VIE"), the assets, liabilities, and results of operations of the VIE should be included in the consolidated financial statements of the entity. The Company evaluates its investments periodically or when "triggering" events occur.
Recent Accounting Pronouncements:
In June 2009, the FASB issued authoritative guidance requiring an enterprise to perform an analysis to determine whether the enterprise's variable interest or interests give it a controlling financial interest in a variable interest entity. This analysis identifies the primary beneficiary of a variable interest entity as one with the power to direct the activities of a variable interest entity that most significantly impact the entity's economic performance and the obligation to absorb losses of the entity that could potentially be significant to the variable interest. The guidance was effective as of the beginning of the annual reporting period commencing after November 15, 2009 and was adopted by the Company in the first quarter of fiscal year 2010. The adoption did not have any substantive impact on the Company's consolidated financial statements.
In September 2009, the FASB issued new standards for revenue recognition with multiple deliverables. These new standards impact the determination of when the individual deliverables included in a multiple-element arrangement may be treated as separate units of accounting. Additionally, these new standards modify the manner in which the transaction consideration is allocated across the separately identified deliverables by no longer permitting the residual method of allocating arrangement consideration. These new standards are effective for the Company beginning in the first quarter of fiscal year 2011, however early adoption is permitted. The Company has adopted these standards in January 2011 and is currently assessing the potential impact of the guidance on the Company's consolidated financial statements.
In September 2009, the FASB issued new standards for the accounting for certain revenue arrangements that include software elements. These new standards amend the scope of pre-existing software revenue guidance by removing from the guidance non-software components of tangible products and certain software components of tangible products. These new standards are effective for the Company beginning in the first quarter of fiscal year 2011, however early adoption is permitted. The Company has adopted these standards in January 2011 and is currently assessing the potential impact of the guidance on the Company's consolidated financial statements.
In January 2010, the FASB issued amended standards that require additional fair value disclosures. These disclosure requirements are effective in two phases. In the first quarter of 2010, the Company adopted the requirements for disclosures about inputs and valuation techniques used to measure fair value as well as disclosures about significant transfers between hierarchy levels. Beginning in the first quarter of 2011, these amended standards required presentation of disaggregated activity within the reconciliation for fair value measurements using significant unobservable inputs (Level 3). The Company has adopted these standards in January 2011 and is currently assessing the potential impact of the guidance on the Company's consolidated financial statements.
In December 2010, the FASB issued amended standards requiring an enterprise to perform a Step 2 of the goodwill impairment test for the reporting units that have carrying amounts that are zero or negative and is more likely than not that the goodwill of those reporting units is impaired. The
108
NOTES TO CONSOLIDATED FINANCIAL STATEMENTS (Continued)
NOTE 2—SUMMARY OF SIGNIFICANT ACCOUNTING POLICIES (Continued)
amendments were effective for fiscal years, and interim periods within those years beginning after December 15, 2010. Early adoption is not permitted. The Company will adopt these standards in the first quarter of fiscal year 2011 and is currently assessing the potential impact, if any, of the guidance on its consolidated financial statements.
In December 2010, the FASB issued amended standards that require supplementary pro forma disclosures for business combinations. The amendments were effective prospectively for business combinations for which the acquisition date is on or after the beginning of the first annual reporting period beginning on or after December 15, 2010. Early adoption is permitted. The Company will adopt these standards in the first quarter of fiscal year 2011 and is currently assessing the potential impact, if any, of the guidance on the Company's consolidated financial statements.
NOTE 3—DIVESTITURES
Beginning in the fourth quarter of 2007, the Company launched a number of initiatives, including potential divestitures of non-core assets, to focus on its core growth technologies, including IPTV, IP-based softswitch and broadband devices. During the third quarter of 2008, the Company completed its divestitures of UTStarcom Personal Communications LLC and Mobile Solutions Business Unit. During the third quarter of 2009, the Company completed a sale of its Korea operations. During the year ended 2010, the Company completed its divestitures of China Packet Data Services Node Assets, EMEA operations, IP Messaging and US PDSN Assets, and Remote Access Server Product Line.
2010
China Packet Data Services Node ("PDSN") Assets
In the third quarter of 2010, the Company completed a sale of its China PDSN assets. The divested assets were part of the Multimedia Communications segment. After the close of the transactions, the Company remained the primary obligor for certain sales contracts that were in place prior to the close of the transaction. The Company allocated proceeds to each component of the sales agreement based on relative fair values and recorded a gain of $1.6 million upon closing of the transaction in September 2010. The Company will record sales and related cost of net sales in future periods related to the completion of existing contracts. The Company determined that the sale of this product line did not meet the criteria for presentation as a discontinued operation because of the Company's continuing involvement.
EMEA Operations
In September 2010, the Company entered into an agreement to transfer its EMEA ("Europe, Middle East and Africa") operations for no consideration. However as of December 31, 2010, the transaction was not completed because the Company did not transfer all of its obligations under the existing sales contracts to the buyer. In 2010, the Company recognized expenses of approximately $0.9 million as a divestiture loss for its obligations primarily arising out of local statutory requirements such as severance fund for transferred employees and other miscellaneous operational costs. In 2010, the Company paid approximately $0.7 million to the buyer, the remaining accrued balance of $0.2 million is expected to be paid in the first quarter of 2011 once the buyer has agreed to take over these obligations. The Company determined that the sale of its EMEA operations did not meet the criteria for presentation as a discontinued operation because EMEA did not meet the definition of a component of an entity and the Company has continued involvement with EMEA operations.
109
NOTES TO CONSOLIDATED FINANCIAL STATEMENTS (Continued)
NOTE 3—DIVESTITURES (Continued)
IP Messaging and US PDSN Assets
In June 2010, the Company completed a sale of its IP Messaging and US PDSN Assets as part of its strategy to focus on core IP-based product offerings. The divested assets were located in North America, Caribbean, and Latin America regions and were part of the Multimedia Communications segment. Consideration for the approximately $1.7 million of net liabilities transferred included approximately $0.4 million cash proceeds plus potential additional contingent consideration of up to $1.6 million based on future cash collection of transferred receivables. A gain of $2.1 million, net of taxes, was recognized in June 2010 as a reduction to operating expenses. In the third and fourth quarter of 2010, the Company received $0.9 million of contingent consideration and recognized an additional gain on divestiture. The Company determined that the sale of these product lines did not meet the criteria for presentation as a discontinued operation as these product lines did not meet the definition of a component of an entity.
Sale of Remote Access Server product line
In January 2010, the Company completed a sale of certain assets and liabilities related to its Remote Access Server ("RAS") product line and received total consideration of approximately $1.5 million. The primary RAS product was the Total Control 1000 Transaction Gateway, which offers the market a proven processing platform for carrier-class transaction network service providers and enterprises for dial-up connectivity. In the first quarter of 2010, the Company transferred net liabilities of approximately $0.3 million in connection with this transaction and recorded a net gain of $1.8 million as a reduction of operating expenses. The Company determined that the divestiture of the RAS product line did not meet the criteria for presentation as a discontinued operation as the RAS product line did not meet the definition of component of an entity.
2009
Korea operations
On July 31, 2009, the Company completed a sale of its Korea operations to an entity founded by a former employee and received total consideration of approximately $2.0 million. In connection with this transaction, the Company recorded a net loss of $1.3 million during 2009. Included in this amount was $2.2 million of foreign currency losses previously carried in accumulated other comprehensive income that were realized upon completion of sale and liquidation of the subsidiary. The Company determined that the divestiture of Korea operations did not meet the criteria for presentation as a discontinued operation as the Korea operations did not meet the definition of component of an entity.
2008
UTStarcom Personal Communications LLC (PCD)
On July 1, 2008, the Company completed the sale of UTStarcom Personal Communications LLC, a wholly-owned subsidiary of the Company ("PCD"), to Personal Communications Devices, LLC ("PCD LLC"), an entity controlled by AIG Global Investment Group and certain other investors. The Company divested substantially all of the assets and liabilities of PCD. The total sale consideration to the Company was based primarily on the working capital of PCD as of the closing of the transaction, subject to certain adjustments. Upon final settlement of the working capital adjustments in the fourth quarter of 2008, the total sale consideration to the Company was $237.7 million. During 2008, the
110
NOTES TO CONSOLIDATED FINANCIAL STATEMENTS (Continued)
NOTE 3—DIVESTITURES (Continued)
Company recorded net cash proceeds of $219.1 million from the sale of PCD, which was represented by the total sale consideration of $237.7 million, less $8.6 million of transaction costs and $10.0 million held in escrow. At December 31, 2008, the Company recorded an additional $1.3 million of transaction costs which had been incurred but not yet paid. The Company also invested $1.6 million in equity securities of PCD LLC representing approximately a 2.6% interest in PCD LLC. The Company recorded a $3.8 million gain on sale of PCD net assets during 2008. The following table summarizes the components of the gain on sale (in thousands):
Purchase price |
$ | 237,669 | |||
Less: |
|||||
Accounts receivable, net |
(121,979 | ) | |||
Inventories |
(205,367 | ) | |||
Prepaids and other assets |
(8,885 | ) | |||
Property, plant and equipment, net |
(1,539 | ) | |||
Intangible assets, net |
(15,783 | ) | |||
Accounts payable |
89,628 | ||||
Other liabilities |
39,999 | ||||
Estimated transaction related costs |
(9,980 | ) | |||
Gain on sale, net of tax |
$ | 3,763 | |||
In the second quarter of 2009, the Company recorded an additional $1.4 million gain resulting from an adjustment to reflect actual transaction related costs. The total gain on sale of PCD net assets includes proceeds of $10.0 million held in escrow which were disbursed to the Company in July 2009. Pursuant to the original terms of the divestiture agreement, the Company was potentially entitled to receive up to a $50.0 million earnout payment in 2011 based on the achievement of cumulative earnings levels of PCD LLC through December 31, 2010.
Prior to June 30, 2008, PCD was a reportable segment of the Company. Concurrent with the closing of the divestiture transaction, the Company entered into a three-year supply agreement with PCD LLC whereby the Company indicated its intent to supply handset products to PCD LLC. In connection with the wind-down of our Korea operations, in December 2008, we furnished PCD LLC with 180-day's notice of termination of the supply agreement. Due to the continuing direct cash flows pursuant to the supply agreement beyond the one-year assessment period starting from the date of sale, the sale of the PCD assets did not meet the criteria for presentation as a discontinued operation.
On June 30, 2009, the Company entered into a Settlement Agreement and Release (the "Settlement Agreement") with PCD LLC to resolve certain product quality issues. Under the Settlement Agreement, the Company waived its right to any earnout payments and granted a call option to PCD LLC for the Company's $1.6 million investment in the equity securities of PCD LLC. The Company also agreed to pay PCD LLC a total of $11.1 million which was recorded as warranty costs of approximately $8.4 million (see Note 8) and a reduction of revenue of approximately $2.7 million. In the third quarter of 2009, PCD LLC elected to exercise the call option to repurchase all 2,199,214 Class A Units owned by the Company. The Company received cash of $1.6 million in September 2009 and transferred all equity holdings in Class A Units to PCD LLC. No gain or loss was recorded on this transfer as the carrying value of the equity holdings was equal to the proceeds received. During 2009, gross profit was reduced by approximately $24.6 million as a result of certain transactions with PCD LLC consisting of the $11.1 million claim settlement, approximately
111
NOTES TO CONSOLIDATED FINANCIAL STATEMENTS (Continued)
NOTE 3—DIVESTITURES (Continued)
$26.0 million of costs for inventory write-downs to net realizable value, write-downs of excess inventory and warranty reserves related to transactions with PCD LLC, offset partially by $12.5 million benefit related to sales of handsets to PCD LLC during 2009 that were previously written down to zero carrying value in the fourth quarter of 2008.
Upon entering into the Settlement Agreement, the Company performed reassessment and concluded that the assessment period for discontinued operations presentation was not required to extend beyond the one-year period following the disposition of PCD in accordance with ASC 205-20-55-23. As a result, and given that the cash flows generated from the disposed component were significant throughout the assessment period and beyond, it would not be appropriate to reclassify PCD to discontinued operation presentation.
Mobile Solutions Business Unit (MSBU)
On July 31, 2008, the Company completed the divestiture of its Mobile Solutions Business Unit ("MSBU") to a global private equity firm. The Company sold all the assets and liabilities related to MSBU, including certain intellectual property and technology rights (with the exception of cash and accounts related to Canadian GST taxes) except for products and intellectual property rights relating to the Company's core CDMA product, such as PDSN. During the third quarter of 2008, the Company recorded a net gain on divestiture of $3.9 million. This gain resulted from transferring net liabilities of approximately $9.0 million, netted against cash payments made by the Company of approximately $5.1 million, including transaction related costs of $0.3 million. The net liability primarily consisted of deferred revenue and other liabilities totaling $27.8 million offset by deferred costs and other assets of approximately $18.8 million. Previously, MSBU was reported as part of the Company's Other segment and was responsible for the development, sales and services of the Company's wireless IPCDMA/IPGSM product line and PDSN product line. Concurrent with the closing of the transaction, the Company entered into a manufacturing agreement whereby the Company will continue to develop and manufacture wireless IP-based products for sale to the divested entity. Due to the ongoing direct cash flows pursuant to the manufacturing agreement, the sale of the MSBU assets did not meet the criteria for presentation as a discontinued operation.
NOTE 4—CASH, CASH EQUIVALENTS AND INVESTMENTS
Cash and cash equivalents, consisting primarily of bank deposits and money market funds, are recorded at cost which approximates fair value because of the short-term nature of these instruments. There were no available-for-sale securities included in cash and cash equivalents at December 31, 2010 or December 31, 2009.
Short-term investments consist of bank notes of $0.5 million and $1.0 million at December 31, 2010 and December 31, 2009, respectively. The Company accepts bank notes receivable with maturity dates of between three and six months from its customers in China in the normal course of business. The Company may discount these bank notes with banking institutions in China. During the year ended December 31, 2010, no bank notes were sold. The Company sold $9.9 million and $30.5 million of bank notes, and recorded costs of less than $0.1 million and $0.4 million as a result of discounting the notes, during 2009 and 2008, respectively. All long-term investments are in privately-held companies and are accounted for under the cost method. The Company recognizes an impairment charge when a decline in the fair value of its investments below the cost basis is judged to be other-than-temporary. In making this determination, the Company reviews several factors to determine whether the losses are
112
NOTES TO CONSOLIDATED FINANCIAL STATEMENTS (Continued)
NOTE 4—CASH, CASH EQUIVALENTS AND INVESTMENTS (Continued)
other-than-temporary, including but not limited to: (i) the length of time the investment was in an unrealized loss position, (ii) the extent to which fair value was less than cost, (iii) the financial condition and near term prospects of the issuer and (iv) the Company's intent and ability to hold the investment for a period of time sufficient to allow for any anticipated recovery in fair value.
There were no available-for-sale securities subject to fair value accounting at December 31, 2010 and 2009. All long-term investments at December 31, 2010 and 2009 are in privately-held companies and are accounted for under the cost and equity method.
The following table shows the break-down of the Company's total investments as of December 31, 2010 and December 31, 2009:
| |
December 31, 2010 |
December 31, 2009 |
|||||
|---|---|---|---|---|---|---|---|
| |
(in thousands) |
||||||
Cortina |
$ | 3,348 | $ | 3,348 | |||
GCT SemiConductor, Inc. |
3,000 | 3,000 | |||||
Xalted Networks |
1,583 | 1,583 | |||||
SBI |
1,233 | 471 | |||||
ACELAND |
2,109 | — | |||||
Total equity securities |
$ | 11,273 | $ | 8,402 | |||
Cortina
In September 2004, the Company invested $2.0 million in Series A preferred stock of ImmenStar, Inc. ("ImmenStar"). ImmenStar was a development stage company that designed a chip that was used in the Company's product. This investment was accounted for under the cost method. In February 2007, ImmenStar was acquired by Cortina Systems, Inc. ("Cortina"). In exchange for the Company's investment in ImmenStar, the Company received 3.6 million shares of Series D Preferred Stock of Cortina at $0.837 per share, $1.8 million cash in March 2007 and received an additional 0.4 million shares of Series D Preferred Stock at $0.837 per share and $0.2 million cash from escrow during 2008. As a result of the acquisition, the Company recorded a gain on investment of $2.8 million, in other income, net in 2007 and $0.5 million in 2008. The Company owns approximately 1% interest of Cortina at both December 31, 2010 and 2009 and accounts for the investment in Cortina using the cost method.
GCT Semiconductor
In October 2004, the Company invested $3.0 million in Series D preferred stock of GCT Semiconductor, Inc. ("GCT") . This investment represents approximately a 2% interest in GCT Semiconductor, Inc., which designs, develops and markets integrated circuit products for the wireless communications industry. This investment is accounted for under the cost method.
Xalted Networks
In May 2005 and August 2005, the Company invested $2.0 million and $1.0 million, respectively, in Xalted Networks ("Xalted"). In March 2006, the Company invested an additional $0.3 million in Xalted. Xalted is a development stage company providing telecommunication operator customers with a comprehensive set of network systems, software solutions and service offerings. The Company had less
113
NOTES TO CONSOLIDATED FINANCIAL STATEMENTS (Continued)
NOTE 4—CASH, CASH EQUIVALENTS AND INVESTMENTS (Continued)
than a 10% ownership interest at December 31, 2010 and 2009, on a fully diluted basis, in Xalted and accounts for the investment using the cost method. During the third quarter of 2009, management re-evaluated the carrying value of this investment, including reviewing Xalted's cash position, recent financing activities, financing needs, earnings/revenue outlook, operational performance, and competition. Based on this review, the Company determined that the decline in Xalted's fair value was other-than-temporary and recorded a $1.7 million impairment charge for this investment in other income, net in the third quarter of 2009.
SBI NEO Technology A Investment LPS ("SBI")
In 2008, the Company invested $0.5 million into SBI in exchange for approximately 2% of the Partnership interest. The Partnership's investment objective is to invest in unlisted or listed companies in Japan and overseas that are engaged in high growth businesses, including businesses focused on information technology and the environment. In the first quarter of 2010, the Company contributed an additional $0.7 million into SBI, and at December 31, 2010 maintains an approximately 2% Partnership interest. The Company has concluded that it does not have a controlling interest in SBI as it does not have the power to direct the activities of SBI that most significantly impact the entity's economic performance. Affiliates of a related party have a controlling interest in SBI, see Note 17. The Company accounts for the investment in SBI using the cost method.
ACELAND Investment Limited
In December 2010, we invested $2.1 million into ACELAND Investments Limited ("ACELAND"). ACELAND was formed by ZTE H.K Limited and us, and the investment objective is to participate in the investment in Wireless City Planning operated by Softbank to develop XGP business. We own approximately 35% interest of ACELAND at December 31, 2010 and accounts for the investment in ACELAND using the equity method.
Fair Value Measurements
Pursuant to the accounting guidance for fair value measurements and its subsequent updates, fair value is defined as the price that would be received from selling an asset or paid to transfer a liability in an orderly transaction between market participants at the measurement date. As such, fair value is a market-based measurement that should be determined based on assumptions that market participants would use in pricing an asset or liability. The accounting guidance also establishes a three-tier fair value hierarchy which requires the Company to use observable market data, when available, and to minimize the use of unobservable inputs when determining fair value. The fair value hierarchy prioritizes the inputs into three levels that may be used in measuring fair value as follows:
Level 1—observable inputs such as quoted prices in active markets for identical assets or liabilities.
Level 2—inputs other than the quoted prices in active markets for identical assets or liabilities that are observable either directly or indirectly.
Level 3—unobservable inputs based on the Company's assumptions.
In January 2010, the FASB issued amended standards that require additional fair value disclosures. These disclosure requirements are effective in two phases. In the first quarter of 2010, the Company adopted the requirements for disclosures about inputs and valuation techniques used to measure fair value as well as disclosures about significant transfers between hierarchy levels. Beginning in the first
114
NOTES TO CONSOLIDATED FINANCIAL STATEMENTS (Continued)
NOTE 4—CASH, CASH EQUIVALENTS AND INVESTMENTS (Continued)
quarter of 2011, these amended standards will require presentation of disaggregated activity within the reconciliation for fair value measurements using significant unobservable inputs (Level 3). These amended standards do not significantly impact the Company's consolidated financial statements.
At December 31, 2010, the Company had no assets and liabilities measured at fair value on a recurring basis. The Company's money market funds, which are included in cash and cash equivalents, are recorded at cost which approximates fair value, classified within Level 1 of the fair value hierarchy. The fair value of certain of the Company's financial instruments that are not measured at fair value, including accounts receivable, accounts payable, and other current liabilities, approximates the carrying amount because of their short maturities.
At December 31, 2009, the Company determined as a result of the sale leaseback transaction entered into in December 2009 (see Note 6) that the net book value of its Hangzhou facility was in excess of its fair value. Due to the apparent decline in value, the Company conducted a recoverability test for this entity-wide asset and determined the carrying value of the net assets of the Company exceeded the undiscounted cash flows expected to result from the use and eventual disposition of the asset group. In the Company's assessment of fair value, management placed primary reliance on the market approach (the third party offer). The result of this analysis reduced the Company's overall assessment of fair value of the property by $33.3 million. Accordingly, the Company recorded a non-cash impairment charge of $33.3 million during the fourth quarter of 2009. The Company's overall assessment of fair value of the property at December 31, 2009 was based on Level 2 inputs. During the year ended December 31, 2010, the Company had no assets and liabilities measured at fair value on a non-recurring basis.
NOTE 5—BALANCE SHEET DETAILS
The following tables provide details of selected balance sheet items:
| |
December 31, 2010 |
December 31, 2009 |
|||||||
|---|---|---|---|---|---|---|---|---|---|
| |
(in thousands) |
||||||||
Inventories: |
|||||||||
Raw materials |
$ | 6,718 | $ | 18,863 | |||||
Work in process |
6,836 | 12,881 | |||||||
Finished goods(1) |
34,850 | 40,556 | |||||||
Total |
$ | 48,404 | $ | 72,300 | |||||
- (1)
- Includes finished goods at customer sites of approximately $23.5 million and $33.8 million at December 31, 2010 and 2009, respectively, for which the customer has taken possession, but based on specific contractual terms, title has not yet passed to the customer.
115
NOTES TO CONSOLIDATED FINANCIAL STATEMENTS (Continued)
NOTE 5—BALANCE SHEET DETAILS (Continued)
Inventories of approximately $0.6 million held by the Company's manufacturing outsource partner are recorded in prepaids and other current assets in the consolidated balance sheet at December 31, 2010. No inventories were held by our manufacturing outsource partner at December 31, 2009. The Company recorded a $14.6 million inventory write-down in 2010 for MSAN and MSTP for two international customer contracts due to the reduction in product demands.
| |
December 31, 2010 |
December 31, 2009 |
|||||||
|---|---|---|---|---|---|---|---|---|---|
| |
(in thousands) |
||||||||
Property, plant and equipment, net: |
|||||||||
Buildings |
$ | 264 | $ | 184,436 | |||||
Leasehold improvements |
11,752 | 15,422 | |||||||
Automobiles |
4,337 | 4,243 | |||||||
Software |
30,471 | 37,240 | |||||||
Equipment and Furniture |
119,057 | 172,214 | |||||||
Others |
585 | 1,690 | |||||||
Total |
166,466 | 415,245 | |||||||
Less: accumulated depreciation and impairment |
(161,647 | ) | (284,633 | ) | |||||
Total (see Note 6) |
$ | 4,819 | $ | 130,612 | |||||
| |
December 31, 2010 |
December 31, 2009 |
|||||||
|---|---|---|---|---|---|---|---|---|---|
| |
(in thousands) |
||||||||
Other current liabilities: |
|||||||||
Accrued contract costs |
$ | 14,438 | $ | 27,657 | |||||
Accrued payroll and compensation |
20,198 | 35,871 | |||||||
Warranty costs |
7,734 | 16,150 | |||||||
Accrued other taxes |
17,157 | 15,863 | |||||||
Restructuring costs |
11,417 | 21,707 | |||||||
Deposit received for sale of building |
— | 7,323 | |||||||
Other |
16,543 | 18,323 | |||||||
Total |
$ | 87,487 | $ | 142,894 | |||||
NOTE 6—LONG-LIVED ASSETS
2010
In December 2009, the Company entered into a Property Transfer and Leaseback Agreement (the "Sale Leaseback Agreement") for the sale of its manufacturing, research and development and administrative office facility in Hangzhou, China (the "Hangzhou facility") to a third party for proceeds of approximately $138.8 million and the leaseback of approximately one-third of the property through 2016. On March 15, 2010, the Company received proceeds of approximately $13.9 million on the transaction. On March 8, 2010, the Company obtained an irrevocable bank guarantee letter from the buyer for the remaining amount of the cash proceeds from the Sale Leaseback Agreement. On May 31, 2010, the Company and the buyer agreed that all conditions precedent to the closing had been met and
116
NOTES TO CONSOLIDATED FINANCIAL STATEMENTS (Continued)
NOTE 6—LONG-LIVED ASSETS (Continued)
the leaseback commenced on June 1, 2010. As of May 31, 2010, the Company had received all of the sales proceeds and met all criteria for consummation of sale of the Hangzhou facility.
Management concluded that the transaction qualified for sale-leaseback accounting as all of the risks and rewards of ownership were transferred to the buyer upon closing of the transaction and the leaseback arrangement did not include any form of continuing involvement, other than a normal leaseback. In the second quarter of 2010, the Company recorded the sale of the Hangzhou facility and recorded a deferred gain of $7.7 million at the time of sale. The deferred gain represented the excess of the gross sales proceeds of $138.8 million over $7.5 million of transaction related taxes and other fees, and the net book value of the Hangzhou facility of $123.6 million. The gain on sale was deferred in accordance with the accounting guidance for sale-leaseback transactions, as the Company has retained more than a minor portion of the use of the property through the six-year leaseback. The deferred gain on the sale-leaseback is being amortized in proportion to the related gross rental charged to expense over the leaseback term. During 2010, amortization of the deferred gain of $0.8 million was recorded as a reduction of operating expenses.
In connection with the Sale Leaseback Agreement, on February 1, 2010, the Company entered into a Lease Contract (the "Lease") with respect to the leaseback of a portion of the Hangzhou facility. Under the terms of the Lease, the Company will lease back 71,027 square meters of gross floor area ("GFA") aboveground and 12,000 sqm GFA underground of the building for a period of 6 years at a rate of approximately $0.37, $0.44 and $0.47, respectively, per sqm per day for years 1-2, 3-4 and 5-6, respectively, of the lease period for the aboveground space; and approximately $3.66 per sqm per month for the underground space for the full lease period. The Company was also required to pay a security deposit in the amount of approximately $1.8 million and prepay part of the rent and fees for the last six months of the lease term in the amount of approximately $3.4 million upon lease inception on June 1, 2010. The Company may terminate all or part of the Lease by giving six months advance notice; however, the Company would be required to pay penalties and additional compensation in the event of early termination. The Company has concluded that the Lease qualifies as an operating lease.
The Company has decided to terminate the lease of Hangzhou facility in June 2011 and notified the landlord on December 8, 2010, six months in advance, according to the termination clause in the Lease agreement. The termination clause requires the Company to pay total penalties of $9.5 million. A termination penalty charge of $1.3 million was recorded in December 2010 as a result of the full termination penalty off set by the release of the deferred gain and deferred rental liabilities other than the portion that would have been normally amortized in the next six month period to June 8, 2011 if there were no early termination. As of December 31, 2010, the Company has a net balance of $4.0 million related to the early termination penalty recorded in Other Liabilities which consists of the $9.5 million total penalty less the prepaid rent and security deposit paid in the second quarter of 2010. At December 31, 2010, $0.6 million of deferred gain is included in other current liabilities in the consolidated balance sheet. See Note 14 for future minimum lease payments under all noncancelable operating leases.
2009
Prior to the sale and leaseback of the Hangzhou facility in 2010 as discussed above, the Company had announced its consideration to sell the facility in June 2009. In view of its intentions, in the third quarter of 2009, the Company contracted with a commercial real estate agent to assist in evaluating a potential sale of the facility. Furthermore, in October 2009, the Company initiated actions to
117
NOTES TO CONSOLIDATED FINANCIAL STATEMENTS (Continued)
NOTE 6—LONG-LIVED ASSETS (Continued)
consolidate the Company's use of the facility to reduce its operating costs that revised its projected occupancy needs. In light of these developments, the Company performed a recoverability assessment of the facility as of September 30, 2009. Impairment testing performed by the Company in the third quarter of 2009, utilizing an income approach, indicated that the fair value approximated the carrying value of the Hangzhou facility as of September 30, 2009 of $160.5 million, and no impairment was recorded with respect to this property. The income approach was used as a result of the lack of preliminary offers and available comparable market transaction activity to place reliance on the market valuation approach. However, during the fourth quarter of 2009, a binding offer received from the buyer gave the Company a better indication of the property's fair value, and revealed that the value of the property to an interested third party was lower than the fair value the Company had previously estimated using the income approach. The building is approximately 2.7 million square feet and unique in its design. Based on the uniqueness of the building and the fact that only a single offer for the building had been received after having it on the market for several months management determined that a third party offer was a better indication of the fair value than other methods because the offer was specific to the property representing direct evidence of the fair value. Based on this offer, the Company determined that the property had a net book value in excess of its fair value. Due to the apparent decline in value, the Company conducted a recoverability test for this entity-wide asset and determined the carrying value of the net assets of the Company exceeded the undiscounted cash flows expected to result from the use and eventual disposition of the asset group. In the Company's assessment of fair value, management has placed primary reliance on the market approach (the third party offer). The result of this analysis reduced the Company's overall assessment of fair value of the property by $33.3 million. Accordingly, the Company recorded a non-cash impairment charge of $33.3 million during the fourth quarter of 2009. The adjusted carrying value of $125.7 million of the property was lower than the pending sales price because the valuation performed factored in the above-market rental rates to be paid by the Company as stipulated in the leaseback agreement accompanying the sale. The Company's overall assessment of fair value of the property was based on Level 2 inputs, defined as inputs other than quoted market prices in active markets that are observable either directly or indirectly.
At December 31, 2009, the long-lived asset to be sold was classified as held for use as the Company expects to retain more than a minor portion of the use of the property through a six-year leaseback.
2008
During the third quarter of 2008, the Company divested intangible assets with a net carrying amount of approximately $15.8 million in connection with the sale of PCD, see Note 3. In the fourth quarter of 2008, the Company decided to exit the CSBU market and recorded a charge of approximately $4.9 million to write-off the remaining unamortized balance of a customer relationships intangible asset arising from the Company's previous acquisition of Commworks. As a result the Company's consolidated balance sheet at December 31, 2008 contains no balances for finite-lived intangible assets subject to amortization.
During the fourth quarter of 2008, the Company's internal forecasts were revised downwards as to take account of the rapidly deteriorating business environment. In addition, the combined effect of recurring operating losses and a sustained decline in the Company's stock price were determined, in the aggregate, to be a "significant adverse change in the business climate," which is a triggering event for long-lived assets impairment analysis.
118
NOTES TO CONSOLIDATED FINANCIAL STATEMENTS (Continued)
NOTE 6—LONG-LIVED ASSETS (Continued)
The Company determined its long-lived asset groups, which the Company considers to be "held and used" in its operations, based upon certain factors including assessing the lowest level for which identifiable cash flows are largely independent of the cash flows of other groups of assets and liabilities. The asset groups consist of the Company's operating segments and entity-wide assets such as the Company's China headquarters building. Estimates of future cash flows developed during the 2009 budgeting process indicated that each of the Company's business segments had an inability to fully recover the carrying value of each segment's assets and on an entity-wide level had an inability to fully recover the carrying value of the asset group. Accordingly, the Company tested the carrying values at December 31, 2008 of all of its property, plant and equipment for impairment. For all asset groups except the Company's China headquarters building, the testing involved estimating the fair value in an exchange transaction of each asset group, comparing such fair value to the carrying value of the asset grouping, and recording impairment charges to reduce the carrying value to estimated fair value in those cases where the pre-impairment carrying value of an asset group was above its estimated fair value.
The Company made various estimates as discussed below, which management believes to be both reasonable and appropriate, in determining the estimated fair values of the Company's asset groups at December 31, 2008. In concluding on fair values management also considered, in part, the results of appraisals made as of December 31, 2008 by valuation firms of the fair value of the Company's facility in Hangzhou, China and certain of the Company's equipment and furniture, software, automobiles and leasehold improvements which the Company obtained to confirm the reasonableness of its estimates.
The Company's manufacturing, research and development, and administrative offices facility in Hangzhou, China, which had a carrying value of approximately $167.4 million at December 31, 2008, was the largest single asset subject to impairment testing. Management initially considered whether using comparable market transaction activity (market comparison approach) to estimate the current fair value of the Hangzhou facility would be both feasible and sufficiently objective in the circumstances but discovered the secondary market for similar industrial properties from which to derive sales data was not sufficiently robust to place primary reliance on this valuation approach. Therefore, management primarily used the income capitalization approach to estimate fair value; this valuation approach involves estimating a current market rental for the facility through an analysis of rents of similar facilities, either in the locality or in comparable districts, and then using an applicable capitalization rate to estimate fair value. This resulted in determining the estimated fair value for the Hangzhou facility to be approximately $183.2 million at December 31, 2008, or approximately $15.8 million greater than the carrying value at December 31, 2008. No impairment charge was recorded in 2008 as the estimated fair value of the Hangzhou facility exceeded its carrying value.
The Company also tested individually significant equipment and furniture, software, automobiles and leasehold improvements located in China, India, Japan, Korea, and the United States for impairment, primarily using the cost approach to estimate related fair values. To determine each tested asset's estimated fair value at December 31, 2008, adjustment factors were applied to the asset's original cost first to estimate current replacement cost and then to estimate deductions from the estimated current replacement costs to recognize the effects of deterioration and obsolescence from all causes as well as de-installation costs. This effort resulted in an impairment charge of approximately $22.3 million, which consisted of $11.9 million for the Company's enterprise resource planning ("ERP") system, $6.7 million for equipment and furniture and $3.7 million primarily for capitalized software.
119
NOTES TO CONSOLIDATED FINANCIAL STATEMENTS (Continued)
NOTE 7—DEBT
At December 31, 2010 and 2009, the Company had no bank loans outstanding and the Company had not guaranteed any debt not included in the consolidated balance sheet.
In the second quarter of 2010, the Company entered into two credit facilities totaling $29.4 million. Both credit facilities can be used for the issuance of certain letters of credit and guarantees and both facilities expire in the second quarter of 2011.
During 2009, approximately $322.1 million in credit facilities in China expired and were not renewed. At December 31, 2009, the Company had no available credit facilities. On March 21, 2008, the Company entered into a credit agreement providing for a $75.0 million secured revolving credit facility that was subject to accounts receivable and inventory borrowing base formula and was used during the second quarter of 2008 to fund the Company's general working capital requirements. During the second quarter of 2008, the Company repaid all outstanding borrowings under this credit agreement. On June 30, 2008, in connection with the entry into an agreement for the sale of PCD (see Note 3), the Company terminated the commitments under the credit agreement. Upon termination of the credit agreement in 2008, the Company expensed the remaining unamortized debt issuance costs of approximately $1.1 million.
On March 3, 2008, the Company repaid the remaining outstanding convertible subordinated notes of $289.5 million which included a principal payment of $274.6 million and the accrued interest of $14.9 million.
NOTE 8—WARRANTY OBLIGATIONS AND OTHER GUARANTEES
The Company provides a standard warranty on its equipment and handset sales for a period generally ranging from one to two years from the time of final acceptance. At times, the Company has entered into arrangements to provide limited warranty services for periods longer than two years. The Company provides for the expected cost of product warranties at the time that revenue is recognized based on an assessment of past warranty experience and when specific circumstances dictate. The Company assesses the adequacy of its recorded warranty liability every quarter and makes adjustments to the liabilities if necessary. Specific warranty accruals are reversed upon the expiration of the warranty period and are recorded as a reduction of cost of net sales. From time to time, the Company may be subject to additional costs related to non-standard warranty claims from its customers. If and when this occurs, the Company estimates additional accruals based on historical experience, communication with its customers and various assumptions that the Company believes to be reasonable under the circumstances. Such additional warranty accruals are recorded in the period in which the additional costs are identified.
Expirations recorded as a reduction of cost of net sales approximated $3.5 million and $4.3 million for the years ended December 31, 2010 and 2009, respectively, and are included in the table below as benefit from expirations. The following table summarizes the activity related to warranty obligations during the years ended December 31, 2010, 2009 and 2008.
120
NOTES TO CONSOLIDATED FINANCIAL STATEMENTS (Continued)
NOTE 8—WARRANTY OBLIGATIONS AND OTHER GUARANTEES (Continued)
The Company's warranty obligations, included in other current liabilities and related activity for the years ended December 31, 2010, 2009 and 2008 are as follows (in thousands):
Balance at December 31, 2007 |
$ | 52,734 | |||
Accruals for warranties issued during the period |
16,665 | ||||
Settlements made during the period |
(29,435 | ) | |||
Warranty obligations divested upon the sale of PCD |
(10,124 | ) | |||
Balance at December 31, 2008 |
$ | 29,840 | |||
Accruals for warranties issued during the period, net of expirations |
6,706 | ||||
Settlements made during the period |
(20,396 | ) | |||
Balance at December 31, 2009 |
$ | 16,150 | |||
Accruals for warranties issued during the period (benefit from expirations), net |
(3,103 | ) | |||
Settlements made during the period |
(5,313 | ) | |||
Balance at December 31, 2010 |
$ | 7,734 | |||
During the second quarter of 2009, the Company recorded a special warranty charge related to certain handsets sold to PCD LLC. Under the Settlement Agreement with PCD LLC (see Note 3), the Company agreed to pay PCD LLC $8.4 million to settle certain PCD LLC customers' warranty claims arising from the handsets sold to PCD LLC. The $8.4 million claim settlement was paid in the third quarter of 2009 and is included in accruals for warranties issued and settlements made during 2009 in the table above.
Certain of the Company's sales contracts include provisions under which customers would be indemnified by the Company in the event of, among other things, a third-party claim against the customer for intellectual property rights infringement related to the Company's products. There are no limitations on the maximum potential future payments under these guarantees. Historically, the Company has not incurred material costs as a result of obligations under these agreements. It is not possible to determine the aggregate maximum potential loss under these indemnification agreements due to the limited history of prior indemnification claims and the unique facts and circumstances involved in each particular agreement.
NOTE 9—INCOME TAXES
United States and foreign income (loss) before income taxes and minority interest were as follows:
| |
Years Ended December 31, | |||||||||
|---|---|---|---|---|---|---|---|---|---|---|
| |
2010 | 2009 | 2008 | |||||||
| |
(in thousands) |
|||||||||
United States |
$ | (44,144 | ) | $ | (129,438 | ) | $ | (38,100 | ) | |
Foreign |
(18,031 | ) | (85,406 | ) | (105,637 | ) | ||||
|
$ | (62,175 | ) | $ | (214,844 | ) | $ | (143,737 | ) | |
121
NOTES TO CONSOLIDATED FINANCIAL STATEMENTS (Continued)
NOTE 9—INCOME TAXES (Continued)
The components of the provision (benefit) for income taxes are as follows:
| |
Years Ended December 31, | ||||||||||
|---|---|---|---|---|---|---|---|---|---|---|---|
| |
2010 | 2009 | 2008 | ||||||||
| |
(in thousands) |
||||||||||
Current |
|||||||||||
Federal |
$ | 335 | $ | (2,816 | ) | $ | (26 | ) | |||
State |
(9 | ) | — | (8 | ) | ||||||
Foreign |
3,554 | 12,772 | 13,561 | ||||||||
Total Current |
$ | 3,880 | $ | 9,956 | $ | 13,527 | |||||
Deferred |
|||||||||||
Federal |
— | — | — | ||||||||
State |
— | — | — | ||||||||
Foreign |
(765 | ) | 904 | (6,440 | ) | ||||||
Total Deferred |
(765 | ) | 904 | (6,440 | ) | ||||||
Total |
$ | 3,115 | $ | 10,860 | $ | 7,087 | |||||
As of December 31, 2010, the Company had gross unrecognized tax benefits of approximately $56.5 million and had certain deferred tax assets and the federal tax benefit of state income tax items totaling $42.1 million. Of the total $56.5 million gross unrecognized tax benefits, $14.4 million related to tax benefits that, if recognized, would impact the annual effective tax rate. The Company has reduced its total unrecognized tax benefits by approximately $32.6 million during the fourth quarter of 2010. Of the total $32.6 million reduction in gross unrecognized tax benefits, $1.4 million was mainly due to statute of limitations expirations and settlements of income tax audits. The remaining $31.2 million was primarily due to settlement of timing differences. Approximately $0.4 million of the $32.6 million reduction in gross unrecognized tax benefits impacted effective tax rate of 2010.
The Company's policy is to recognize interest expense and penalties related to the above unrecognized tax benefits as a component of income tax expense. During 2010, the total amount of interest and penalties recognized in the statement of income was $0.5 million. The Company had accrued interest and penalties of approximately $3.4 million as of December 31, 2010 and approximately $3.1 million as of December 31, 2009.
The Company is subject to taxation in the U.S. federal jurisdiction and various U.S. state and foreign jurisdictions. The Company is also under audit by the taxing authorities in China on a recurring basis. The material jurisdictions that the Company is subject to examination are in the United States and China. The Company's tax years for 2000 through 2010 are still open for examination in China. The Company's tax years for 2003 through 2010 are still open for examination in the United States.
FASB ASC 740-10 establishes criteria for recognizing or continuing to recognize only more-likely-than-not tax positions, which may result in income tax expense volatility in future periods. While the Company believes that it has adequately provided for all tax positions, amounts asserted by taxing authorities could be greater than the Company's accrued position. Accordingly, additional provisions on income tax related matters could be recorded in the future as revised estimates are made or the underlying matters are settled or otherwise resolved.
122
NOTES TO CONSOLIDATED FINANCIAL STATEMENTS (Continued)
NOTE 9—INCOME TAXES (Continued)
A summary of the Company's unrecognized tax benefits is as follows:
| |
Years Ended December 31, | |||||||||
|---|---|---|---|---|---|---|---|---|---|---|
| |
2010 | 2009 | 2008 | |||||||
| |
(in thousands) |
|||||||||
Beginning balance-gross unrecognized tax benefits (UTB's) |
$ | 90,597 | $ | 92,773 | $ | 79,678 | ||||
Additions based on tax positions related to the current year |
2,063 | 22,790 | 11,916 | |||||||
Reductions based on tax positions related to the current year |
(31,222 | ) | — | — | ||||||
Additions for tax positions related to prior years |
352 | 4,702 | 1,962 | |||||||
Reductions for tax positions related to prior years |
(3,877 | ) | (2,895 | ) | (783 | ) | ||||
Settlements |
— | (92 | ) | — | ||||||
Lapse of statute of limitations |
(1,400 | ) | (26,681 | ) | — | |||||
Ending balance—gross unrecognized tax benefits (UTB's) |
56,513 | 90,597 | 92,773 | |||||||
UTB's as a credit in deferred taxes |
(39,758 | ) | (75,071 | ) | (78,344 | ) | ||||
Federal benefit of state taxes |
(2,338 | ) | (2,720 | ) | (3,767 | ) | ||||
UTB's that would impact the effective tax rate |
$ | 14,417 | $ | 12,806 | $ | 10,662 | ||||
In establishing its deferred income tax assets and liabilities, the Company makes judgments and interpretations based on the enacted tax laws and published tax guidance applicable to its operations. The Company records deferred tax assets and liabilities and evaluates the need for valuation allowances to reduce the deferred tax assets to realizable amounts. The likelihood of a material change in the Company's expected realization of these assets is dependent on future taxable income and its ability to use foreign tax credit carryforwards and carrybacks.
123
NOTES TO CONSOLIDATED FINANCIAL STATEMENTS (Continued)
NOTE 9—INCOME TAXES (Continued)
A summary of the components of net deferred tax assets is as follows:
| |
December 31, 2010 |
December 31, 2009 |
|||||
|---|---|---|---|---|---|---|---|
| |
(in thousands) |
||||||
Deferred Tax Assets |
|||||||
Allowances and reserves |
$ | 41,292 | $ | 71,686 | |||
Deferred revenue and customer advances, net |
20,535 | 21,329 | |||||
Net operating loss carryforward |
226,592 | 218,584 | |||||
Tax credit carryforwards |
105,587 | 93,884 | |||||
Capital loss carryforwards |
21,487 | 21,297 | |||||
Writedown/amortization of intangible assets and goodwill |
27,572 | 30,486 | |||||
Fixed assets |
10,370 | 19,439 | |||||
Demo equipment income |
7,825 | 4,477 | |||||
Accrued warranties |
1,242 | 2,056 | |||||
Other |
14,229 | 20,998 | |||||
Total Deferred Tax Assets |
$ | 476,731 | $ | 504,236 | |||
Deferred Tax Liabilities |
|||||||
Prepaid expense |
(246 | ) | (5,780 | ) | |||
Deferred taxes on unremitted earnings of subsidiaries |
(223 | ) | (10,137 | ) | |||
Intangibles |
(1,187 | ) | — | ||||
Other |
(217 | ) | (5,397 | ) | |||
Total Deferred Tax Liabilities |
(1,873 | ) | $ | (21,314 | ) | ||
Total Deferred Tax Assets (Liabilities) |
$ | 474,858 | $ | 482,922 | |||
Less: Valuation Allowance |
$ | (473,914 | ) | $ | (481,742 | ) | |
Total Deferred Tax Assets (Liabilities) |
$ | 944 | $ | 1,180 | |||
The Company provides for deferred income taxes on the unremitted earnings of foreign subsidiaries unless such earnings are deemed to be permanently reinvested outside the United States. In 2010, the Company has a gross U.S. deferred income tax liability of $0.2 million on foreign earnings of $87.7 million that it considers not permanently reinvested outside the United States.
As of December 31, 2010, the Company still has undistributed earnings of approximately $18.2 million from investments in foreign subsidiaries that are considered permanently reinvested. The determination of the amount of deferred taxes on these earnings is not practicable since the computation would depend on a number of factors that cannot be known until a decision to repatriate the earnings is made.
As of December 31, 2010, the Company's U.S. federal net operating loss carryforwards were $356.9 million and expire in varying amounts between 2026 and 2031. As of December 31, 2010, state net operating loss carryforwards were $247.0 million and expire in varying amounts between 2011 and 2031. The Company has concluded that these federal and state net operating losses did not meet the more likely than not standard contained in FASB ASC 740-10 and has therefore placed a $137.3 million valuation allowance against the related deferred tax assets. In the event the tax benefits related to the valuation allowance are realized, an immaterial amount would be credited to paid-in capital. As of December 31, 2010, the Company also had net operating loss carryforwards ("NOLs") in China of
124
NOTES TO CONSOLIDATED FINANCIAL STATEMENTS (Continued)
NOTE 9—INCOME TAXES (Continued)
approximately $483.0 million. The China net operating loss carryforwards will expire in varying amounts between 2012 and 2016. The Company has also concluded that these China net operating losses did not meet the more likely than not standard and has therefore placed a $74.2 million valuation allowance against the related deferred tax assets. As of December 31, 2010, the Company had NOLs in countries other than the U.S. and China. These NOLs are approximately $96.5 million. The majority of the NOLs do not expire and can be carried forward indefinitely. However, the Company concluded these losses did not meet the more likely than not standard and has therefore placed a valuation allowance of $15.1 million against the related deferred tax assets.
As of December 31, 2010, the Company has U.S. alternative minimum tax credit carryforwards of $1.0 million which have an indefinite life. The Company also has U.S. research and development credit carryforwards of $13.1 million, $2.5 million of the credits have an indefinite life and $10.6 million of the credits expire in varying amounts between 2012 and 2029. The Company has U.S. foreign tax credits of $90.2 million which expire in varying amounts between 2012 and 2021. The Company has concluded that these U.S. tax credit carryforwards did not meet the more likely than not standard contained in FASB ASC 740-10 and has therefore placed a $104.3 million valuation allowance against the related deferred tax assets. As of December 31, 2010, the Company has foreign research and development credit carryforwards of $1.2 million which expire in varying amounts between 2015 and 2029. The Company also has concluded that these foreign research & development credit carryforwards did not meet the more likely than not standard and has therefore placed a $1.2 million valuation allowance against the related deferred tax assets.
The difference between the Company's effective income tax rate and the federal statutory rate is reconciled below:
| |
Years Ended December 31, | |||||||||
|---|---|---|---|---|---|---|---|---|---|---|
| |
2010 | 2009 | 2008 | |||||||
| |
(in thousands) |
|||||||||
Federal tax (benefit) at statutory rate |
$ | (21,760 | ) | $ | (75,185 | ) | $ | (50,308 | ) | |
State tax (benefit)/expense, net of federal income tax benefit |
(918 | ) | (1,634 | ) | 2,410 | |||||
Tax benefit of convertible debentures |
— | — | (1,223 | ) | ||||||
Stock compensation expense |
1,042 | 2,154 | 3,549 | |||||||
Effect of differences in foreign tax rates |
1,853 | 5,146 | 53,012 | |||||||
Tax on unremitted earnings of subsidiaries |
(11 | ) | (173 | ) | (10,695 | ) | ||||
Effect of tax rate changes on deferred taxes |
151 | (19,026 | ) | 13,803 | ||||||
Change in deferred tax valuation allowance |
20,897 | 112,172 | 12,623 | |||||||
Tax credits |
(1,002 | ) | (18,729 | ) | (24,870 | ) | ||||
Other |
2,863 | 6,135 | 8,786 | |||||||
Total Tax Expense |
$ | 3,115 | $ | 10,860 | $ | 7,087 | ||||
The China Corporate Income Tax Law ("CIT Law") became effective on January 1, 2008. Under the CIT Law, China's dual tax system for domestic enterprises and foreign investment enterprises ("FIEs") was effectively replaced by a unified system. The new law establishes a tax rate of 25% for most enterprises and a reduced tax rate of 15% for certain qualified high technology enterprises.
125
NOTES TO CONSOLIDATED FINANCIAL STATEMENTS (Continued)
NOTE 9—INCOME TAXES (Continued)
Prior to this change in tax law, certain subsidiaries and joint ventures located in China enjoyed tax benefits in China which were generally available to FIEs. The tax holidays/incentives for FIEs were applicable or potentially applicable to UTStarcom ChongQing Telecom Co. Ltd. ("CUTS"), UTStarcom Telecom Co., Ltd. ("HUTS"), and UTStarcom China Co., Ltd. ("UTSC"), the Company's active subsidiaries in China, as these entities may qualify as accredited technologically advanced enterprises.
The CIT Law provides the reduced 15% enterprise income tax rate for qualified high and new technology enterprises. Two of the Company's China subsidiaries, HUTS and UTSC, through which the majority of our business in China is conducted, obtained their High and New Technology Enterprise Certificates, or High-tech Certificates, from the relevant approval authorities on September 19, 2008 and December 30, 2008, respectively, and thereafter were approved to pay CIT at the reduced tax rate of 15%. The approval for the reduced 15% tax rate is valid for three years and applies retroactively from January 1, 2008, subject to possible re-assessment by the approval authorities. During the re-assessment, the tax authority may suspend the implementation of the reduced 15% rate. HUTS's High-tech Certificate will expire on September 19, 2011 and UTSC's High-tech Certificate will expire on December 30, 2011. HUTS and UTSC may apply for the extension of their respective High-tech Certificates prior to the expiration date of the respective certificates and, if approved, each extended term will be three years. If HUTS or UTSC fails to pass the re-assessment by the approval authorities or fails to renew its High-tech Certificate, the preferential tax rate of 15% will cease to apply and HUTS or UTSC would be subject to a tax rate of 25%. However, since both entities are currently in significant loss positions, the change in tax rate will not have a material adverse impact on the business or liquidity until the two China subsidiaries begin to generate profit and deplete all the net operating loss carry forwards.
In 2010, the $0.4 million tax benefit for the effect of tax rate changes is attributable to the revaluation of the Company's deferred tax assets in China related to decrease in tax rates due to the HUTS qualifying for the reduced 15% tax rate in 2008 and the UTSC's likely disqualification for the reduced 15% in 2010. In 2009, the $19.0 million tax benefit for the effect of tax rate changes is attributable to the revaluation of the Company's deferred tax assets in China related to decrease in tax rates due to the HUTS and UTSC qualifying for the reduced 15% tax rate in 2008 discussed above. In 2008, the $13.8 million tax expense for the effect of tax rate changes is attributable to the revaluation of the Company's deferred tax assets in China related to decrease in tax rates due to the passage of HUTS and UTSC qualifying for the reduced 15% tax rate in 2008 discussed above.
In establishing its deferred income tax assets and liabilities, the Company makes judgments and interpretations based on the enacted tax laws and published tax guidance applicable to its operations as well as the amount and jurisdiction of future taxable income. The Company records deferred tax assets and liabilities and evaluates the need for valuation allowances to reduce the deferred tax assets to realizable amounts. As of September 30, 2005, the Company did not believe it was more likely than not that it would generate a sufficient level and proper mix of taxable income within the appropriate period to utilize all the deferred tax assets in China and the United States. As a result of the review undertaken at September 30, 2005, the Company has concluded that it was appropriate to establish a full valuation allowance for the net deferred tax assets in China and the United States wherein the cumulative losses weigh heavily in the overall assessment.
In 2010, the change in deferred tax valuation allowance of $20.9 million is primarily attributable to the tax expense related to continuing to provide a full valuation allowance on the Company's deferred tax assets at December 31, 2010 in the United States and China. In 2009, the change in deferred tax
126
NOTES TO CONSOLIDATED FINANCIAL STATEMENTS (Continued)
NOTE 9—INCOME TAXES (Continued)
valuation allowance of $112.2 million is primarily attributable to the tax expense related to continuing to provide a full valuation allowance on the Company's net deferred tax assets at December 31, 2009 in the United States and China. In 2008, the change in deferred tax valuation allowance of $12.6 million is primarily attributable to the tax expense related to continuing to provide a full valuation allowance on the Company's net deferred tax assets in the United States and China at December 31, 2008.
In 2010, the income tax benefit of $1.0 million related to tax credits is primarily attributable to an increase in the amount of foreign tax credits generated in the United States due to foreign taxes paid. In 2009, the income tax benefit of $18.7 million related to tax credits is primarily attributable to an increase in the amount of foreign tax credits generated in the United States due to foreign withholding taxes and repatriations of dividends from the Company's foreign operations. In 2008, the income tax benefit of $24.9 million related to tax credits is primarily attributable to an increase in the amount of foreign tax credits generated in the United States due to foreign withholding taxes paid and repatriations of dividends from the Company's foreign operations.
NOTE 10—COMMON STOCK PURCHASE AND OPTION TO PURCHASE ADDITIONAL SHARES
On February 1, 2010, the Company entered into Stock Purchase Agreements with Beijing E-town International Investment and Development Co., Ltd. ("BEIID"), and two unrelated investment funds, Elite Noble Limited and Shah Capital Opportunity Fund LP, which included a proposed investment of $48.5 million in the Company's common stock. The Stock Purchase Agreements were subsequently amended on May 4, 2010, June 4, 2010 and July 7, 2010, respectively.
On September 7, 2010, the Company and the investors entered into a fourth amendment to each of the Stock Purchase Agreements ("Fourth Amendments") to reduce the per share purchase price and to make certain adjustment to the number of shares sold under the agreements. Under the terms of the Fourth Amendments, the Company and the investors agreed to reduce the purchase price from $2.20 per share to $2.027 per share and adjust the number of shares sold to each of the investors. The Fourth Amendments also provided an option to Elite Noble Limited to purchase up to an additional 3,972,251 shares through November 8, 2010 for approximately $8.1 million based on a stated exercise price of $2.027 per share if the purchase takes place on or prior to October 7, 2010 and $2.047 per share if the purchase takes place between October 8, 2010 and November 8, 2010. On September 7, 2010, the Company completed the transaction and issued an aggregate 18,073,202 shares of its common stock and the option to purchase an additional 3,972,251 shares for cash proceeds, net of issuance costs, of $34.6 million. Net cash proceeds were allocated to the common stock issued and the option to purchase additional shares based on their relative fair value at the date of issuance, resulting in $34.1 million of net cash proceeds allocated to the common stock issued and $0.5 million of net cash proceeds allocated to the option to purchase additional shares.
The fair value of the option to purchase the additional 3,972,251 shares was estimated to be $0.5 million at the date of issuance based on the Black-Scholes option pricing model using a risk-free interest rate of 0.16%, volatility of approximately 55%, the contractual life of 0.2 years and zero dividend rate. The net cash proceeds allocated to the option to purchase additional shares were recorded as additional paid in capital. The option expired unexercised at December 31, 2010.
NOTE 11—ACQUISITION, GOODWILL AND INTANGIBLE ASSETS
On October 16, 2010, the Company entered into an Ordinary Shares Purchase Agreement with Stage Smart Limited ("Stage Smart") and Smart Frontier Holdings Limited ("Smart Frontier"), the
127
NOTES TO CONSOLIDATED FINANCIAL STATEMENTS (Continued)
NOTE 11—ACQUISITION, GOODWILL AND INTANGIBLE ASSETS (Continued)
sole shareholder of Stage Smart, to enable the Company to launch a internet TV platform to generate revenue through subscription, advertising and value-added service in the coming years.. Pursuant to the Ordinary Shares Purchase Agreement, the Company agreed to purchase from Smart Frontier 5,100,000 ordinary shares of Stage Smart held by Smart Frontier (the "Purchase Shares") for an aggregate purchase price of $10.0 million. The Purchased Shares constitute 51% of the total shares of Stage Smart currently held by Smart Frontier. The purchase price for the Purchased Shares is paid in the form of the number of shares of the Company's common stock calculated by dividing $10.0 million by the average closing price per share of the Company's common stock quoted on the NASDAQ stock market for the thirty day period immediately preceding the date of closing of the transaction which closely approximates the market value on the day of issuance subject to customary closing conditions. Pursuant to the Ordinary Shares Purchase Agreement, the Company has the right to repurchase the Company's shares issued as part of the consideration to Stage Smart Shareholders if by the one year anniversary of the closing date regulatory approvals have not been obtained as outlined in the post-closing covenants. Concurrent with entering into the Ordinary Shares Purchase Agreement, the Company also entered into a Series A Preference Shares Purchase Agreement with Stage Smart and its affiliated entity, its wholly owned subsidiaries, and Smart Frontier. Pursuant to the Series A Preference Shares Purchase Agreement, the Company agreed to purchase from Stage Smart 9,600,000 Series A Preference Shares of Stage Smart at a price of $2.08333 per share, for an aggregate cash consideration of $20.0 million. Under certain conditions, shares of Series A Preference Shares are convertible into ordinary shares on a 1:1 basis. Series A Preference Shares have equal voting rights as ordinary shares. They are entitled to cumulative dividends at a rate of 8% of the original issue price and can also participate in other dividends declared by Stage Smart. The Purchase Shares and the Series A Preference Shares together constitute 75% of the total shares of Stage Smart which gives the Company control over Stage Smart. The Company has recorded this transaction as an acquisition of a business.
The transactions closed on November 8, 2010. The Company issued 4,473,272 shares of common stock to Smart Frontier with a fair value of $ 9.8 million based on the market price of the Company's common stock as at November 8, 2010 for the purchase price of $10.0 million and made cash payments of $20.0 million to Stage Smart for the purchase of Series A Preference Shares.
From the date of acquisition of November 8, 2010, the results of operations of Stage Smart Limited and its wholly owned subsidiary have been included in the Company's consolidated financial statements and are reported in the Multimedia Communications segment as they were not material. Pro forma results of operations have not been presented because it is not material to Company's consolidated results of operations, either individually or in the aggregate. Goodwill, which represents the excess of the purchase price over the net tangible and intangible assets acquired, is not deductible for tax purposes. The following table presents the aggregate purchase price allocation, which reflects
128
NOTES TO CONSOLIDATED FINANCIAL STATEMENTS (Continued)
NOTE 11—ACQUISITION, GOODWILL AND INTANGIBLE ASSETS (Continued)
preliminary fair value estimates and analyses, including preliminary work performed by third-party valuation specialists.
| |
(in thousands) | |||
|---|---|---|---|---|
Net tangible assets |
$ | 144 | ||
Amortizable intangible assets |
4,955 | |||
Goodwill |
13,820 | |||
Less Net liabilities assumed |
300 | |||
Less Deferred Tax Liability |
1,239 | |||
Net Assets Acquired, Other Than Cash |
17,380 | |||
Cash Received On Issuance of Series A Preference Shares |
20,000 | |||
Total Net Assets Acquired |
37,380 | |||
Less Noncontrolling Interest |
7,380 | |||
Total Purchase Price |
$ | 30,000 | ||
These purchase price allocation amounts are subject to change within the measurement period as valuations are finalized and relate to the fair values of certain tangible assets and liabilities acquired, the valuation of intangible assets acquired, and residual goodwill measurement period adjustments that are determined to be material will be applied retrospectively to the period of acquisition in the Company's consolidated financial statements and, depending on the nature of the adjustments, other periods subsequent to the period of acquisition could also be affected.
Goodwill mainly consisted of the extensive knowledge and expertise of the management team in the internet TV industry complemented by the execution ability of the operation team. The amortizable intangible assets acquired consisted of estimated fair values of Stage Smart's technology platform of $4.7 million and non-compete agreements signed with key executives upon closing of the transaction of $0.3 million. The Company is amortizing these intangible assets on a straight-line basis over an estimated weighted-average life of 4 years.
Transaction costs incurred with the Stage Smart acquisition amounted to $0.9 million and have been expensed and included under selling, general and administrative expense in the Consolidated Statements of Operations for the year ended December 31, 2010.
NOTE 12—COMMON STOCK AND STOCK INCENTIVE PLANS
Stock Incentive Plans
At December 31, 2010, the Company has the stock incentive plans described below. Substantially all outstanding awards are subject to potential accelerated vesting in the event of a change in control of the Company. The Company repurchases and cancels shares of its common stock forfeited with respect to the tax liability associated with certain vesting of restricted stock and restricted stock unit grants under these plans.
2006 Equity Incentive Plan:
The 2006 Equity Incentive Plan ("2006 Plan") was implemented on July 21, 2006 after being adopted by the Board of Directors on June 6, 2006 and approved by the Company's stockholders on July 21, 2006. The 2006 Plan replaces the 1997 Plan, the 2001 Plan, and the 2003 Plan (collectively, the
129
NOTES TO CONSOLIDATED FINANCIAL STATEMENTS (Continued)
NOTE 12—COMMON STOCK AND STOCK INCENTIVE PLANS (Continued)
"Prior Plans") and no further awards will be granted pursuant to the Prior Plans. The 2006 Plan provides for the grant of the following types of incentive awards: (i) stock options, (ii) stock appreciation rights, (iii) restricted stock, (iv) restricted stock units, (v) performance shares and performance units, and (vi) other stock or cash awards ("Award," collectively, "Awards"). Those who are eligible for Awards under the 2006 Plan include employees, directors and consultants who provide services to the Company and its affiliates.
The maximum aggregate number of shares that may be awarded and sold under the 2006 Plan is 4,500,000 shares plus (i) any shares that have been reserved but remain unissued under the Prior Plans as of July 21, 2006, and (ii) any shares subject to stock options or similar awards granted under the Prior Plans that expire or become exercisable without having been exercised in full and shares issued pursuant to awards granted under the Prior Plans that are forfeited to or repurchased by the Company. As of December 31, 2010, the number of shares transferred from the Prior Plans to the 2006 plan totaled 24,584,584. As of December 31, 2010, 4,877,512 options and restricted stock units were outstanding under the 2006 Plan.
The Board of Directors or the Compensation Committee of the Board ("Compensation Committee") administers the 2006 Plan ("Administrator"). Subject to the terms of the 2006 Plan, the Administrator has the sole discretion to select the employees, consultants, and directors who will receive Awards, determine the terms and conditions of Awards, and to interpret the provisions of the 2006 Plan and outstanding Awards. Options granted under the 2006 Plan generally vest and become exercisable over four years.
Awards granted under the 2006 Plan are generally not transferable, and all rights with respect to an Award granted to a participant generally may be exercised during a participant's lifetime only by the participant; provided, however, that with the Administrator's approval, a participant may (i) transfer an Award to a participant's spouse or former spouse pursuant to a court-approved domestic relations order which relates to the provision of child support, alimony payments or marital property rights, or (ii) transfer an Award by gift to or for the benefit of the participant's immediate family.
The exercise price of all stock options and stock appreciation rights granted under the 2006 Plan must be at least equal to 100% of the fair market value of the Common Stock on the date of grant (or at least 110% of such fair market value for an incentive stock option ("ISO") granted to a stockholder with greater than 10% voting power of the Company's stock). The maximum term of a stock option granted to any participant must not exceed seven years from the date of grant (or five years for an ISO granted to a stockholder with greater than 10% of the voting power of the Common Stock). The Administrator will determine the terms and conditions of all other Awards granted under the Plan.
Prior Plans—The 1997 Stock Plan, 2001 Director Option Plan, and 2003 Non-Statutory Stock Option Plan:
The 1997 Stock Plan:
Prior to the implementation of the 2006 Plan on July 21, 2006, officers, employees and consultants of the Company and its affiliates were eligible to receive options to purchase shares of common stock and stock purchase rights under the 1997 Stock Plan ("1997 Plan"). The 1997 Plan was terminated in July 2006 effective upon stockholder approval of the 2006 Plan. As of December 31, 2010, there were options to purchase 597,901 shares of common stock outstanding under the 1997 Plan.
Options granted under the 1997 Plan prior to July 21, 2006 were either ISOs intended to qualify for favorable federal income tax treatment under the provisions of Section 422 of the Internal Revenue
130
NOTES TO CONSOLIDATED FINANCIAL STATEMENTS (Continued)
NOTE 12—COMMON STOCK AND STOCK INCENTIVE PLANS (Continued)
Code of 1986, as amended, or non-qualified stock options ("NSOs"), which did not so qualify. The Compensation Committee oversaw the selection of eligible persons for option grants and determined the grant date, amounts, exercise prices, vesting periods and other relevant terms of the options, including whether the options would be ISOs or NSOs. The exercise price of ISOs granted under the 1997 Plan could not be less than 100% of the fair market value of common stock on the grant date (or at least 110% of such fair market value for an ISO granted to a stockholder with greater than 10% voting power of the Company's stock), while the exercise price of NSOs could be determined by the Compensation Committee in its discretion. Options granted under the 1997 Plan were generally not transferable during the life of the optionee.
Under the 1997 Plan, options vest and become exercisable as determined by the Compensation Committee, generally over four years. Options may generally be exercised at any time after they vest and before their expiration date as determined by the Compensation Committee. However, no option may be exercised more than ten years after the grant date (or five years for ISOs granted to a stockholder with greater than 10% voting power of the Common Stock). Options will generally terminate (i) 12 months after the death or permanent disability of an optionee and (ii) three months after termination of employment for any other reason. The aggregate fair market value of the shares of common stock represented by ISOs that become exercisable in any calendar year by any one option holder may not exceed $100,000. Options in excess of this limit are treated as NSOs.
Prior to the implementation of the 2006 Plan, the Company could also grant stock purchase rights to eligible participants under the 1997 Plan. Under the 1997 Plan, any shares purchased pursuant to stock purchase rights were subject to a restricted stock purchase agreement. Unless the Compensation Committee determined otherwise, this agreement granted the Company a right to repurchase the restricted stock upon the voluntary or involuntary termination of the employee for any reason, including death or disability prior to vesting. The purchase price for repurchased shares was the original price paid and could be paid by cancellation of any indebtedness owed to the Company. The Company's repurchase right lapsed at a rate determined by the Compensation Committee.
2001 Director Option Plan:
Prior to the implementation of the 2006 Plan on July 21, 2006, those directors who were not employees of the Company ("Outside Directors") were eligible to receive options to purchase shares of common stock under the 2001 Director Option Plan ("2001 Plan"). The 2001 Plan was terminated in July 2006 effective upon stockholder approval of the 2006 Plan. As of December 31, 2010, there were options to purchase 260,000 shares of common stock outstanding under the 2001 Plan. The Compensation Committee was the administrator of the 2001 Plan.
Under the terms of the 2001 Plan, the exercise price of each option granted equaled the market value of the common stock on the date of grant. Such options have terms of ten years, but terminate earlier if the individual ceases to serve as a director. The First Option grants vest as to 25% of shares subject to the First Option on each of the first four anniversaries of its date of grant, subject to the Outside Director continuing to serve as a director on such dates. The Subsequent Option grants vest as to 100% of the shares subject to the Subsequent Option on the first anniversary of its date of grant.
The 2003 Nonstatutory Stock Option Plan:
Prior to the implementation of the 2006 Plan on July 21, 2006, directors, officers, employees and consultants of the Company and its affiliates were eligible to receive options to purchase shares of the
131
NOTES TO CONSOLIDATED FINANCIAL STATEMENTS (Continued)
NOTE 12—COMMON STOCK AND STOCK INCENTIVE PLANS (Continued)
Company's common stock under the 2003 Nonstatutory Stock Option Plan ("2003 Plan"). Only nonstatutory stock options, which would not qualify for favorable federal income tax treatment under the provisions of Section 422 of the Internal Revenue Code of 1986, as amended, could be granted under the 2003 Plan. The 2003 Plan was terminated in July 2006 effective upon stockholder approval of the 2006 Plan. As of December 31, 2010, options to purchase 26,250 shares of common stock were outstanding under the 2003 Plan.
The 2003 Plan has been administered by the Compensation Committee. The Compensation Committee oversaw the selection of the eligible persons to whom options would be granted and determined the number of shares subject to the option, exercise prices, vesting periods and other terms applicable to each option.
Options granted under the 2003 Plan generally vest and become exercisable over four years, and may be exercised at any time after they vest but before their expiration date. Options will generally terminate (i) 12 months after the death or employment termination due to disability of an option holder and (ii) three months after termination of an option holder's service for any other reason other than for disability or due to the option holder's death. No option, however, may be exercised more than ten years after the grant date.
Stock Award and Stock Option Activity
In past years, the Company has granted equity awards consisting primarily of stock options. During fiscal 2010, the Company granted equity awards primarily consisting of restricted stock and restricted stock units ("RSUs"), and to a much lesser extent, option awards. As of December 31, 2010, 2009, and 2008, the number of shares of common stock available for issuance pursuant to future grants under the 2006 Plan, including remaining unissued shares under Prior Plans that have been transferred into the 2006 Plan was 12,679,755, 12,201,930 and 10,710,921, respectively.
On October 1, 2008, the Company completed a tender offer to exchange certain outstanding employee stock options to purchase shares of the Company's common stock. Eligible for exchange were outstanding options, vested or unvested, held by current employees (excluding directors and executive officers) and granted under the Company's 1997 Stock Plan with an exercise price greater than or equal to $6.00 per share, which included options with an exercise price less than the fair market value of the Company's common stock on the date of grant. Subject to the terms and conditions of the tender offer, the Company accepted for exchange and cancelled options to purchase an aggregate of 6,072,818 shares with a weighted average exercise price of $14.15 per share, and issued new options to purchase an aggregate of 1,983,920 shares with an exercise price of $3.24 per share, the closing stock price of the Company's common stock on October 1, 2008. The new options were granted under the Company's 2006 Equity Incentive Plan and generally vest over two years. Because of the exchange ratio, the number of options canceled pursuant to the offer exceeded the number of options to be granted in connection with the offer. There was no incremental compensation expense resulting from the completion of the tender offer.
132
NOTES TO CONSOLIDATED FINANCIAL STATEMENTS (Continued)
NOTE 12—COMMON STOCK AND STOCK INCENTIVE PLANS (Continued)
The following summarizes the Company's stock options activity:
| |
Number of shares outstanding (in thousands) |
Weighted average exercise price |
|||||
|---|---|---|---|---|---|---|---|
Options Outstanding, January 1, 2008 |
17,647 | $ | 13.91 | ||||
Options Granted |
2,888 | $ | 3.20 | ||||
Options Exercised |
(62 | ) | $ | 2.05 | |||
Options Forfeited or Expired |
(11,706 | ) | $ | 14.52 | |||
Options Outstanding, December 31, 2008 |
8,767 | $ | 9.63 | ||||
Options Granted |
448 | $ | 1.86 | ||||
Options Exercised |
(7 | ) | $ | 0.21 | |||
Options Forfeited or Expired |
(3,458 | ) | $ | 9.73 | |||
Options Outstanding, December 31, 2009 |
5,750 | $ | 8.98 | ||||
Options Granted |
655 | $ | 2.17 | ||||
Options Exercised |
(2 | ) | $ | 2.82 | |||
Options Forfeited or Expired |
(2,238 | ) | $ | 14.35 | |||
Options Outstanding, December 31, 2010 |
4,165 | $ | 5.02 | ||||
In February 2008, the Compensation Committee also granted 1,073,333 performance-based awards to certain senior executive officers. During the third quarter of 2008, 233,333 of these contingently issuable shares were forfeited as a result of employee terminations. On October 6, 2008, the performance requirements with respect to 60,000 of these contingently issuable shares were eliminated; these restricted stock units have a fair value of $2.69 per share, which equals the closing price of the Company's common stock on the NASDAQ Global Select Market on the measurement date of October 6, 2008. On February 18, 2009, the Committee determined, based on the Company's and each executive officer's level of performance during the Company's 2008 fiscal year, that an additional 367,500 shares underlying the previously granted performance- based restricted stock units had been earned, each of these performance-based restricted stock units has a fair value of $1.27 per share, which equals the closing price of the Company's common stock on the NASDAQ Global Select Market on the measurement date of February 18, 2009. These restricted stock units vested 50% on February 27, 2009 and vested 50% on February 26, 2010.
In February 2009, the Compensation Committee also granted to senior executive officers 313,293 restricted stock units with a four-year vesting and an additional 626,586 performance-based awards, subject to the attainment of goals determined by the Compensation Committee. The Company may be subject to variable levels of expense related primarily to the varying levels of performance, as well as for fluctuations in the Company's stock price as these awards are "marked to market" periodically until the earlier of i) the date of the Compensation Committee's determination on performance or ii) the date they were deemed fully vested as a result of involuntary termination. Of the 626,586 performance-based awards granted in February 2009, 401,859 awards were deemed fully vested during fiscal 2009 and the rest awards were deemed fully vested during fiscal 2010 as a result of involuntary terminations, prior to the annual Compensation Committee's evaluation of performance.
133
NOTES TO CONSOLIDATED FINANCIAL STATEMENTS (Continued)
NOTE 12—COMMON STOCK AND STOCK INCENTIVE PLANS (Continued)
In February 2010, the Compensation Committee decided no new stock-based awards would be granted to senior executives for the 2010 year in light of the Company's previously announced planned changes in management.
Under the 2006 and 1997 Plans, the Company granted restricted stock awards. Restricted stock awards are nonvested stock awards that may include grants of restricted stock or grants of restricted stock units. Such awards generally vest over a period of one to four years from the date of grant. Restricted stock has the voting rights of common stock and the shares underlying restricted stock are considered to be currently issued and outstanding. Restricted stock units do not have the voting rights of common stock, and the shares underlying the restricted stock units are not considered issued and outstanding. The expense for such awards is based on the fair market value of the shares at the date of grant and is recognized on a straight-line basis over the requisite service period. The weighted average fair value of restricted stock awards granted under our equity incentive plans during the years ended December 31, 2010, 2009 and 2008 was $2.25, $1.35 and $2.91, respectively. The grant of restricted stock awards is deducted from the shares available on a one to one basis for grant under the Company's stock plan. Nonvested restricted awards as of December 31, 2010 and changes during the year ended December 31, 2010 are summarized below:
Restricted stock awards activity
|
Shares (in thousands) |
Weighted average grant date fair value |
|||||
|---|---|---|---|---|---|---|---|
Nonvested at January 1, 2010 |
4,030 | $ | 2.38 | ||||
Granted |
1,487 | $ | 2.25 | ||||
Vested |
(3,258 | ) | $ | 2.39 | |||
Forfeited |
(696 | ) | $ | 2.12 | |||
Total nonvested at December 31, 2010 |
1,563 | $ | 2.35 | ||||
During the year ended December 31, 2010, 3.3 million shares of restricted stock awards vested. The total fair value of restricted stock awards vested, as measured on the date of vesting, during the year ended December 31, 2010 was 7.24 million. The Company also granted 1.5 million restricted stock awards.
During the year ended December 31, 2009, 3.5 million shares of restricted stock awards vested. The total fair value of restricted stock awards vested, as measured on the date of vesting, during the year ended December 31, 2009 was $4.8 million. The Company also granted 2.0 million restricted stock awards.
During the year ended December 31, 2008, 2.6 million shares of restricted stock awards vested. The total fair value of restricted stock awards vested, as measured on the date of vesting, during the year ended December 31, 2008 was $8.4 million. The Company also granted 6.0 million restricted stock awards.
134
NOTES TO CONSOLIDATED FINANCIAL STATEMENTS (Continued)
NOTE 12—COMMON STOCK AND STOCK INCENTIVE PLANS (Continued)
The following table summarizes significant ranges of outstanding and exercisable stock options as of December 31, 2010 (in thousands, except years and share prices):
| |
Stock Options Outstanding | |
|
|
||||||||||||||||||
|---|---|---|---|---|---|---|---|---|---|---|---|---|---|---|---|---|---|---|---|---|---|---|
| |
Stock Options Exercisable | |||||||||||||||||||||
| |
|
|
|
Weighted- average remaining contractual life (in years) |
||||||||||||||||||
Range of exercise price
|
Number outstanding |
Weighted- average exercise price per share |
Aggregate intrinsic value |
Number Exercisable |
Weighted- average exercise price per share |
Aggregate intrinsic value |
||||||||||||||||
$ 1.01 - $ 2.09 |
398 | $ | 1.95 | $ | 53 | 4.12 | 371 | $ | 2.02 | $ | 53 | |||||||||||
$ 2.17 - $ 2.17 |
556 | $ | 2.17 | — | 6.75 | 99 | $ | 2.17 | — | |||||||||||||
$ 2.18 - $ 2.90 |
433 | $ | 2.72 | — | 3.86 | 300 | $ | 2.88 | — | |||||||||||||
$ 3.20 - $ 3.20 |
753 | $ | 3.20 | — | 0.70 | 753 | $ | 3.20 | — | |||||||||||||
$ 3.24 - $ 3.24 |
747 | $ | 3.24 | — | 3.67 | 747 | $ | 3.24 | — | |||||||||||||
$ 3.25 - $ 5.99 |
434 | $ | 3.76 | — | 3.24 | 382 | $ | 3.78 | — | |||||||||||||
$ 6.25 - $ 7.98 |
431 | $ | 7.07 | — | 3.14 | 431 | $ | 7.07 | — | |||||||||||||
$ 8.06 - $31.24 |
388 | $ | 18.36 | — | 1.40 | 388 | $ | 18.36 | — | |||||||||||||
$45.21 - $45.21 |
25 | $ | 45.21 | — | 2.64 | 25 | $ | 45.21 | — | |||||||||||||
|
4,165 | $ | 5.02 | $ | 53 | 3.29 | 3,496 | $ | 5.55 | $ | 53 | |||||||||||
Options exercisable and expected to vest at December 31, 2010 |
4,165 | $ | 5.02 | $ | 53 | 3.29 | ||||||||||||||||
The intrinsic value represents the total pre-tax intrinsic value and is calculated as the difference between the market value as reported by NASDAQ on December 31, 2010 of $2.06 and the exercise price of the in-the-money shares. During the years ended December 31, 2010, 2009 and 2008, the total pre-tax intrinsic value of options exercised was negligible. The weighted average remaining contractual life of options exercisable was 2.72 years, and the weighted average remaining contractual life of options expected to vest was 3.29 years as of December 31, 2010. The weighted average fair value of options granted under the stock plans during the years ended December 31, 2010, 2009 and 2008 was $1.30, $0.99 and $1.46 per share, respectively.
2000 Employee Stock Purchase Plan:
In February 2000, the Company's stockholders approved the 2000 Employee Stock Purchase Plan ("ESPP"). The purchase plan was intended to qualify as an employee stock purchase plan under Section 423 of the Internal Revenue Code. The stock purchase plan was administered by the Board or a committee appointed by the Board. To reduce the Company's long term cost structure and manage shareholder dilution, the Company elected to terminate the ESPP program in February 2009 with an effective date of May 15, 2009. The cancellation has been accounted for as a settlement of shares for no consideration. This resulted in an immediate expense recognition of $1.2 million in the first quarter of 2009 associated with the unrecognized compensation for canceled purchase periods of the 24-month offering. The ESPP expired in March 2010.
Employees were eligible to participate in the stock purchase plan if they were employed by the Company for more than 20 hours per week and more than five months in a calendar year. The stock purchase plan permitted eligible employees to purchase the Company's common stock through payroll deductions, not to exceed 15% of the employee's total compensation. Stock could be purchased under
135
NOTES TO CONSOLIDATED FINANCIAL STATEMENTS (Continued)
NOTE 12—COMMON STOCK AND STOCK INCENTIVE PLANS (Continued)
the plan at a price equal to 85% of the fair market value of the Company's stock on either the date of purchase or the first day of the offering period, whichever was lower.
Stock-Based Compensation
Stock-based compensation expense for stock options is estimated at the grant date based on each option's fair value as calculated by the Black-Scholes option pricing model ("Black-Scholes model"). The Black-Scholes model was developed for use in estimating the fair value of short-lived exchange traded options that have no vesting restrictions and are fully transferable. In addition, option pricing models require the input of highly subjective assumptions, including the expected stock price volatility over the term of the awards, actual and projected employee stock option exercise behaviors, risk-free interest rate and expected dividends.
The Company uses historical volatility as management believes it is more representative of future stock price trends than implied volatility due to the relatively small number of actively traded options on the Company's common stock available to determine implied volatility. The Company estimates an expected term of options granted based upon the Company's historical exercise and cancellation data for vested options. In addition, separate groups of employees that have similar exercise behavior are considered separately. The expected term of employee stock purchase plan shares is the average of the remaining purchase periods under each offering period.
The Company bases the risk free interest rate used in the option valuation model on U.S. Treasury zero-coupon issues with remaining terms similar to the expected term on the options. The Company does not anticipate paying any cash dividends in the foreseeable future and therefore uses an expected dividend yield of zero in the option valuation model. The Company is required to estimate forfeitures at the time of grant and revise those estimates in subsequent periods if actual forfeitures differ from those estimates. The Company uses historical data to estimate pre-vesting option forfeitures and record stock- based compensation expense only for those awards that are expected to vest.
The fair values of stock-based payment awards were estimated using the Black- Scholes option pricing model with the following assumptions:
| |
Years Ended December 31, | |||||||||
|---|---|---|---|---|---|---|---|---|---|---|
Stock Options:
|
2010 | 2009 | 2008 | |||||||
Expected term in years |
4.0 | 3.7 | 3.7 | |||||||
Weighted average risk-free interest rate |
1.40 | % | 1.69 | % | 2.31 | % | ||||
Expected dividend rate |
0.0 | % | 0.0 | % | 0.0 | % | ||||
Volatility |
83 | % | 74 | % | 63 | % | ||||
| |
Years Ended December 31, | |||||||||
|---|---|---|---|---|---|---|---|---|---|---|
ESPP Shares:
|
2010 | 2009 | 2008 | |||||||
Expected term in years |
0 | 0 | 0.5 to 2.0 | |||||||
Weighted average risk-free interest rate |
0.0 | % | 0.0 | % | 1.67 | % | ||||
Expected dividend rate |
0.0 | % | 0.0 | % | 0.0 | % | ||||
Volatility |
0 | % | 0 | % | 64 | % | ||||
At December 31, 2010, there was approximately $2.8 million of total unrecognized compensation cost, as measured, related to non-vested stock options and restricted stock and restricted stock units, which is expected to be recognized over a weighted-average period of 2.25 years.
136
NOTES TO CONSOLIDATED FINANCIAL STATEMENTS (Continued)
NOTE 12—COMMON STOCK AND STOCK INCENTIVE PLANS (Continued)
During the second quarter of 2009, an adjustment was made to increase the estimated forfeiture rate for equity awards of employees that are being included in the 2009 Restructuring Plan as the awards are not expected to ultimately vest. The resulting net effect of the forfeiture rate adjustment was a decrease to the Company's stock-based compensation expense for the year ended December 31, 2009 by approximately $0.4 million.
Certain executives of the Company have employment contracts which provide for acceleration of all unvested equity awards in the event that the employee is terminated without cause. During 2010, eight executives were involuntarily terminated as part of the 2008 and 2009 Restructuring Plans. For the year ended December 31, 2010, approximately $2.1 million of previously unrecognized compensation costs related to the vesting acceleration was recognized within restructuring. For the year ended December 31, 2009, approximately $2.8 million of compensation costs related to the vesting acceleration was recognized within restructuring.
The following table summarizes the stock-based compensation expense recognized in the Company's consolidated statement of operations:
| |
Years Ended December 31, | ||||||||||
|---|---|---|---|---|---|---|---|---|---|---|---|
| |
2010 | 2009 | 2008 | ||||||||
| |
(in thousands) |
||||||||||
Cost of net sales |
$ | 166 | $ | 662 | $ | 1,306 | |||||
Selling, general and administrative |
4,600 | 7,146 | 15,652 | ||||||||
Research and development |
784 | 1,509 | 3,607 | ||||||||
Restructuring |
2,052 | 2,777 | — | ||||||||
Total |
$ | 7,602 | $ | 12,094 | $ | 20,565 | |||||
At December 31, 2010 and 2009, there was no stock-based compensation capitalized within inventory. Stock-based compensation for 2008 includes $2.5 million of charges relating to prior periods resulting from the correction of the forfeiture rate application. The impact of recording these prior period charges on 2008 and the prior periods is not material.
NOTE 13—401(K) PLAN
On January 1, 2000, the Company adopted the UTStarcom, Inc. 401(k) Savings Plan ("401(k) Plan"), a cash-or-deferred arrangement, which covers the Company's eligible employees who have attained the age of 21. The Company's matching contributions were suspended, effective March 1, 2009. Prior to the suspension, the Company contributed $0.50 for each dollar contributed by qualified employees to the 401(k) Plan, to a maximum of $5,500 per employee for the 2009, 2008 and 2007 plan years. The plan was reinstituted in 2010 and the Company contributed to a maximum of $3,252 per employee for the 2010 plan year. The Company's matching contributions are subject to a five-year vesting schedule based upon longevity of employee service with the Company. Matching contributions were $0.3 million, $0.5 million, and $1.9 million for 2010, 2009, and 2008, respectively.
NOTE 14—COMMITMENTS AND CONTINGENCIES
Leases
The Company leases certain facilities under non-cancelable operating leases that expire at various dates through 2015. In connection with the Sale Leaseback Agreement, the Company entered into a
137
NOTES TO CONSOLIDATED FINANCIAL STATEMENTS (Continued)
NOTE 14—COMMITMENTS AND CONTINGENCIES (Continued)
lease with respect to the leaseback of a portion of the Hangzhou facility, see Note 6. The leaseback commenced on June 1, 2010 and will be early terminated on June 2011. The contractual obligations related to the Hangzhou facility lease through June 2011 are included in the table below. Future minimum lease payments under all noncancelable operating leases with an initial term in excess of one year as of December 31, 2010 are as follows:
Years Ended December 31:
|
Amount | ||||
|---|---|---|---|---|---|
| |
(in thousands) |
||||
2011 |
$ | 10,429 | |||
2012 |
2,672 | ||||
2013 |
1,527 | ||||
2014 |
569 | ||||
2015 |
521 | ||||
Total |
$ | 15,718 | |||
Rent expense for the years ended December 31, 2010, 2009 and 2008 was $15.9 million, $15.3 million and $17.3 million, respectively.
Third Party Commissions
The Company records accruals for commissions payable to third parties in the normal course of business. Such commissions are recorded based on the terms of the contracts between the Company and the third parties and paid pursuant to such contracts. Consistent with the Company's accounting policies, these commissions are recorded as cost of net sales in the period in which the liability is incurred. As of December 31, 2010, the Company had approximately $0.4 million of such accrued commissions. Management has performed, and continues to perform, follow-up procedures with respect to these accrued commissions. Upon completion of such follow-up procedures, if the accrued commissions have not been claimed and the statute of limitations, if any, has expired, the Company reverses such accruals. Such reversals are recorded in the Statement of Operations during the period management determines that such accruals are no longer necessary. With the assistance of its China counsel, the Company concluded that for certain of these accrued commissions the statute of limitations had expired in August 2010 and November 2010, two years after formal communication was sent to these agents. During the year ended December 31, 2010 approximately $6.0 million, was released to cost of net sales as a result of expiration of statute of limitations. During year ended December 31, 2009, approximately $0.8 million, was released to cost of net sales as a result of expiration of statute of limitations.
India Department of Telecommunication Security and Supply Chain Standards
Recent changes in India require equipment manufacturers to satisfy certain security and supply chain standards to the satisfaction of Indian authorities. The Company entered into such agreements with several customers in India which establish detailed security and supply chain standards covering products supplied to these telecommunication customers. These agreements contain significant penalty clauses in the event a security breach is detected related to product supplied by the Company. Management is unable to estimate the likelihood or the financial impact of any such potential security breach on the Company's financial position, results of operations, or cash flows as the regulation is still under further review by DOT and new interpretation is expected later in 2011. As of December 31,
138
NOTES TO CONSOLIDATED FINANCIAL STATEMENTS (Continued)
NOTE 14—COMMITMENTS AND CONTINGENCIES (Continued)
2010, the Company has not been subject to any penalty liability related to these agreements. In 2010, there has been no impact to the revenue recognized, however, contracts signed after the effective date of the agreements may be affected. The Company continues to assess the potential impact these agreements may have on the timing of revenue recognition.
Contractual obligations and commercial commitments
Letters of credit:
The Company issues standby letters of credit primarily to support international sales activities outside of China and in support of purchase commitments. As of December 31, 2010, the Company has approximately $17.4 million outstanding under letters of credit, $9.7 million of which are due in less than a year, $5.1 million of which are due in one to three years and $2.6 million of which are due in three to five years. When the Company submits a bid for a sale, often the potential customer will require that the Company issue a bid bond or a standby letter of credit to demonstrate its commitment through the bid process. In addition, the Company may be required to issue standby letters of credit as guarantees for advance customer payments upon contract signing or performance guarantees. The standby letters of credit usually expire without being drawn by the beneficiary thereof. Finally, the Company may issue commercial letters of credit in support of purchase commitments.
Purchase commitments
The Company is obligated to purchase raw materials and work-in-process inventory under various orders from various suppliers, all of which should be fulfilled without adverse consequences material to the Company's operations or financial condition. At December 31, 2010, the Company had outstanding purchase commitments, including agreements that are non-cancelable and cancelable without penalty, approximating $45.9million.
Intellectual property:
Certain sales contracts include provisions under which customers would be indemnified by the Company in the event of, among other things, a third party claim against the customer for intellectual property rights infringement related to the Company's products. There are no limitations on the maximum potential future payments under these guarantees. The Company has not accrued any amounts in relation to these provisions as no such claims have been made and the Company believes it has valid enforceable rights to the intellectual property embedded in its products.
Uncertain Tax Positions
As of December 31, 2010, the Company had $56.5 million of gross unrecognized tax benefits, of which $14.4 million related to tax benefits that, if recognized, would impact the annual effective tax rate. The impact on annual effective tax rate reflects the gross unrecognized tax benefits net of certain deferred tax assets and the federal tax benefit of state income tax items totaling $42.1 million.
Litigation
Securities Class Action Litigation
Beginning in October 2004, several shareholder class action lawsuits alleging federal securities violations were filed against the Company and various officers and directors of the Company. The
139
NOTES TO CONSOLIDATED FINANCIAL STATEMENTS (Continued)
NOTE 14—COMMITMENTS AND CONTINGENCIES (Continued)
actions have been consolidated in United States District Court for the Northern District of California under the caption In re UTStarcom, Inc. Securities Litigation, Master File No. C-04-4908-JW (PVT). The lead plaintiffs in the case filed a First Amended Consolidated Complaint on July 26, 2005. The First Amended Complaint alleged violations of the Securities Exchange Act of 1934, and was brought on behalf of a putative class of shareholders who purchased the Company's stock after April 16, 2003 and before September 20, 2004. On April 13, 2006, the lead plaintiffs filed a Second Amended Complaint adding new allegations and extending the end of the class period to October 6, 2005. In addition to the Company defendants, the plaintiffs are also suing Softbank. Plaintiffs' complaint seeks recovery of damages in an unspecified amount.
On June 2, 2006, the Company and the individual defendants filed a motion to dismiss the Second Amended Complaint. On March 21, 2007, the Court granted defendants' motion and dismissed plaintiffs' Second Amended Complaint. The Court granted plaintiffs leave to file a Third Amended Complaint, which plaintiffs filed on May 25, 2007. On July 13, 2007, the Company and the individual defendants filed a motion to dismiss and a motion to strike the Third Amended Complaint. On March 14, 2008, the Court granted defendants' motion and dismissed plaintiffs' Third Amended Complaint. The Court granted plaintiffs leave to file a Fourth Amended Complaint, which plaintiffs filed on May 14, 2008. On June 13, 2008, consistent with the Court's March 14, 2008 dismissal order, the Company and the individual defendants filed objections to the form and content of the Fourth Amended Complaint. On July 24, 2008, the Court overruled the objections. On September 8, 2008, the Company and the individual defendants filed a motion to dismiss and a motion to strike certain allegations from the Fourth Amended Complaint. On March 27, 2009, the Court denied defendants' motion to dismiss and granted defendants' motion to strike.
Plaintiffs, the Company and the individual defendants have signed and filed a stipulation of settlement providing for the settlement of the case. Defendant Softbank is not a party to the settlement. Under the terms of the settlement, the Company's and individual defendants' insurers would pay the full amount of the settlement. On May 13, 2010, the Court granted preliminary approval of the settlement, and on August 31, 2010, the Court granted final approval of the settlement. On October 8, 2010, plaintiffs and Defendant Softbank filed a motion for preliminary approval of a separate settlement between plaintiffs and Defendant Softbank. On November 17, 2010, the Court granted preliminary approval of the settlement, and on February 9, 2011, the Court granted final approval of the settlement. The Court's decision is subject to appeal. If it is appealed, we may continue to incur costs with regard to discovery in connection with the litigation between plaintiffs and Defendant Softbank. Accordingly, the Company is unable at this time to estimate the effects of this lawsuit on the Company's financial position, results of operations, or cash flows.
Governmental Investigations
In December 2005, the U.S. Embassy in Mongolia informed the Company that it had forwarded to the Department of Justice (the "DOJ") allegations that an agent of the Company's Mongolia joint venture had offered payments to a Mongolian government official in possible violation of the Foreign Corrupt Practices Act (the "FCPA"). The Company, through its Audit Committee, authorized an independent investigation into possible violations of the FCPA, and it has been in contact with the DOJ and U.S. Securities and Exchange Commission (the "SEC") regarding the investigation. The investigation identified possible FCPA violations in Mongolia, Southeast Asia, India, and China, as well as possible violations of U.S. immigration laws. The DOJ requested that the Company voluntarily produce documents related to the investigation, the SEC subpoenaed the Company for documents, and
140
NOTES TO CONSOLIDATED FINANCIAL STATEMENTS (Continued)
NOTE 14—COMMITMENTS AND CONTINGENCIES (Continued)
the Company received a Grand Jury Subpoena requiring the production of documents related to one aspect of the DOJ investigation, that is, travel the Company had sponsored. The Company has resolved the investigations with the DOJ and the SEC. On December 21, 2009, as part of the resolution of these investigations, the Company executed a consent pursuant to which, without admitting or denying the SEC's allegations, it agreed to a judgment in favor of the SEC of $1.5 million, and agreed to certain reporting obligations for up to four years. The SEC approved that resolution. On April 14, 2010, the United States District Court for the Northern District of California entered a judgment incorporating the terms of that consent. On December 31, 2009, the Company entered into a non-prosecution agreement with the DOJ, pursuant to which the Company has paid an additional $1.5 million and agreed to undertake a three-year reporting obligation and to review and, where appropriate, strengthen the Company's compliance, bookkeeping and internal controls standards and procedures. Under the non-prosecution agreement, subject to compliance with its terms, the DOJ has agreed not to criminally prosecute the Company for crimes (other than criminal tax violations) relating to certain travel arrangements it provided to customers in China. The Company submitted our first reports to the DOJ and SEC on May 1, 2010.
Shareholder Derivative Litigation
On November 17, 2006, a shareholder derivative complaint captioned Ernesto Espinoza v. Ying Wu et al., Case No. RG06298775, was filed against certain of the Company's former officers current and former directors in the Superior Court of the County of Alameda, California. The complaint alleges that the individual defendants, among other things, breached their duties, were unjustly enriched, and violated the California Corporations Code in connection with the timing of stock option grants. The complaint names the Company as a nominal defendant and seeks unspecified monetary damages against the individual defendants and various forms of injunctive relief. On February 2, 2007, the Company and the individual defendants filed demurrers against the complaint. On April 11, 2007, the Court sustained the individual defendants' demurrer, overruled the Company's demurrer, ordered the plaintiff to file an amended complaint, and ordered the Company to answer the original complaint. The plaintiff filed an amended complaint and the Company has filed an answer to the amended complaint. On August 21, 2007, the individual defendants filed demurrers against the amended complaint. The Court sustained the individual defendants' demurrers and ordered the plaintiff to file a second amended complaint. On September 26, 2008, plaintiff filed his second amended complaint. On November 21, 2008, the Company and the individual defendants filed demurrers against the second amended complaint. On February 27, 2009, the Court sustained the Company's demurrer and ordered the plaintiff to file a third amended complaint. On March 20, 2009, plaintiff filed his third amended complaint. On May 5, 2009, the Company and the individual defendants filed demurrers against the third amended complaint. On August 11, 2009, the Court sustained the Company's demurrer without leave to amend. On October 13, 2009, plaintiffs filed a notice of appeal.
The parties have signed a final stipulation of settlement providing for the settlement of the case. The settlement is contingent on approval by the court. Under the terms of the settlement, the individual defendants' insurer would pay the full amount of the monetary portion of the settlement. On April 15, 2010, plaintiff filed a Request for Dismissal without prejudice with the Court of Appeals. On January 12, 2011, the Court of Appeals dismissed the appeal. Pursuant to the Request, the appeal may be reinstated if the Superior Court does not grant preliminary or final approval of the settlement. There is no assurance that the settlement will receive court approval. Accordingly, the Company is
141
NOTES TO CONSOLIDATED FINANCIAL STATEMENTS (Continued)
NOTE 14—COMMITMENTS AND CONTINGENCIES (Continued)
unable at this time to estimate the effects of this lawsuit on the Company's financial position, results of operations, or cash flows.
IPO Allocation
On October 31, 2001, a complaint was filed in United States District Court for the Southern District of New York against the Company, some of the Company's directors and officers and various underwriters for the Company's initial public offering. Substantially similar actions were filed concerning the initial public offerings for more than 300 different issuers, and the cases were coordinated as In re Initial Public Offerings Securities Litigation, Civil Action No. 01-CV-9604. Plaintiffs allege violations of the Securities Act of 1933 and the Securities Exchange Act of 1934 through undisclosed improper underwriting practices concerning the allocation of IPO shares in exchange for excessive brokerage commissions, agreements to purchase shares at higher prices in the aftermarket and misleading analyst reports. Plaintiffs seek unspecified damages on behalf of a purported class of purchasers of the Company's common stock between March 2, 2000 and December 6, 2000. On February 19, 2003, the Court granted in part and denied in part a motion to dismiss the claims brought by defendants, including the Company. The order dismissed all claims against the Company except for a claim brought under Section 11 of the Securities Act of 1933, which alleges that the registration statement filed in accordance with the IPO was misleading.
The parties have reached a global settlement of the litigation. Under the settlement the insurers will pay the full amount of the settlement share allocated to the Company, and the Company will bear no financial liability. The Company and other defendants will receive complete dismissals from the case. On October 5, 2009, the Court entered an Opinion and Order granting final approval of the settlement. Certain objectors have filed appeals; plaintiffs have filed motions to dismiss the appeals. If for any reason the settlement does not become effective, the Company believes it has meritorious defenses to the claims and intends to defend the action vigorously. Accordingly, the Company is unable at this time to estimate the effects of this lawsuit on its financial position, results of operations, or cash flow.
Other Litigation
The Company is a party to other litigation matters and claims that are normal in the course of operations, and while the results of such litigation matters and claims cannot be predicted with certainty, management of the Company believes that the final outcome of such matters will not have a material adverse impact on the Company's financial position, results of operations or cash flows.
NOTE 15—CREDIT RISK AND CONCENTRATION
Financial Risks:
Financial instruments, which potentially subject the Company to concentrations of credit risk, consist principally of cash, cash equivalents, short-term investments and accounts and notes receivable. The Company places its temporary cash and short-term investments with several financial institutions. Approximately $287.6 million and $197.6 million of the Company's cash and cash equivalents and short-term investments were on deposit in foreign accounts at December 31, 2010 and 2009, respectively.
142
NOTES TO CONSOLIDATED FINANCIAL STATEMENTS (Continued)
NOTE 15—CREDIT RISK AND CONCENTRATION (Continued)
The Company's exposure to market risk for changes in interest rates relates primarily to its investment portfolio. The fair value of its investment portfolio would not be significantly affected by either a 10% increase or decrease in interest rates due mainly to the short term nature of most of its investment portfolio. However, the Company's interest income can be sensitive to changes in the general level of U.S and China interest rates since the majority of its funds are invested in instruments with maturities of less than one year. In a declining interest rate environment, as short term investments mature, reinvestment occurs at less favorable market rates. Given the short term nature of certain investments, declining interest rates will negatively impact the Company's investment income.
The Company maintains an investment portfolio of various holdings, types and maturities. The Company does not use derivative financial instruments. The Company places its cash investments in instruments that meet high credit quality standards, as specified in its investment policy guidelines. The Company's policy is to limit the risk of principal loss and to ensure the safety of invested funds by generally attempting to limit market risk. Funds in excess of current operating requirements are mostly invested in money market funds which are rated AAA.
Concentration of Credit Risk and Major Customers:
Most Chinese telecommunication carriers have three levels of operations: the central headquarters level, the provincial level and the local city/county level. Both central and provincial levels are independent legal entities and have their own corporate mandate. The purchasing decision making process may take various forms for different projects and may also differ significantly from carrier to carrier. The Company groups all China customers together by province and treats each province as one customer since that is the level at which purchasing decisions are made.
At December 31, 2010, the Company's accounts receivable balance included amounts due from affiliates of Softbank representing approximately 32% of the Company's total accounts receivables, net of allowances for doubtful accounts. At December 31, 2009, the Company's accounts receivable balance included amounts due from China Telecom, JiangSu Branch representing approximately 11% of the Company's total accounts receivable, net of allowances for doubtful accounts.
The following customers accounted for 10% or more of the Company's net revenues:
| |
For the Years Ended December 31, | |||||||||
|---|---|---|---|---|---|---|---|---|---|---|
| |
2010 | 2009 | 2008 | |||||||
Affiliates of Softbank |
16 | % | — | — | ||||||
PCD LLC |
— | 14 | % | — | ||||||
Verizon Wireless |
— | — | 20 | % | ||||||
Sprint Spectrum L.P. |
— | — | 12 | % | ||||||
Sales to Verizon, T-Mobile and Sprint Spectrum L.P. were primarily from the PCD segment which was sold in July 2008, see Note 3. Approximately 53%, 30% and 19% of the Company's net sales during 2010, 2009, and 2008, respectively, were to entities affiliated with the government of China. Accounts receivable balances from these China government affiliated entities or state owned enterprises were $38.2 million and $45.7 million, respectively, as of December 31, 2010 and 2009. The Company extends credit to its customers in China generally without requiring collateral. In global sales outside of China, the Company may require letters of credit from its customers. The Company monitors its exposure for credit losses and maintains allowances for doubtful accounts.
143
NOTES TO CONSOLIDATED FINANCIAL STATEMENTS (Continued)
NOTE 15—CREDIT RISK AND CONCENTRATION (Continued)
Country Risks:
Approximately 57%, 46% and 27% of the Company's sales for the year ended December 31, 2010, 2009, and 2008, respectively, were made in China. Accordingly, the political, economic and legal environment, as well as the general state of China's economy may influence the Company's business, financial condition and results of operations. The Company's operations in China are subject to special considerations and significant risks not typically associated with companies in the United States. These include risks associated with, among others, the political, economic and legal environments and foreign currency exchange. The Company's results may be adversely affected by, among other things, changes in the political, economic and social conditions in China, and by changes in governmental policies with respect to laws and regulations, changes in China's telecommunications industry and regulatory rules and policies, anti-inflationary measures, currency conversion and remittance abroad, and rates and methods of taxation.
NOTE 16—SEGMENT REPORTING
To align the business units with its corporate strategy to focus on core businesses, on July 1, 2008 the Company sold its Personal Communications Division ("PCD") to PCD LLC (see Note 3 of Notes to the Consolidated Financial Statements included under Part II, Item 8 of this Annual Report on Form 10-K). Prior to July 1, 2008, PCD sold and supported handsets other than PAS handsets, mainly in the United States.
Included in the Other segment were Mobile Solutions Business Unit ("MSBU") and Custom Solutions Business Unit ("CSBU"). On July 31, 2008, the Company sold MSBU which was responsible for the development, sales and service of its wireless IPCDMA/IPGSM product line. In the first quarter of 2009, the Company completed the wind-down of CSBU and the consolidation of voice messaging technology into its Multimedia Communications segment. CSBU historically had been responsible for the development, sales and service of other non-core products. The consolidation of voice messaging technology into the Multimedia Communications segment did not have a significant impact on segment net sales or gross profit.
In order to optimize our resources and improve efficiency, beginning on January 1, 2010, the Company integrated its Services Segment into its Multimedia Communications and Broadband Infrastructure segments based on products for which services are performed. As we substantially completed the wind-down of our handsets business in the fourth quarter of 2009, except for sales relating to inventory clearing, we did not have any significant revenue from our handset segment in 2010 and do not expect any in 2011 and beyond. Effective January 1, 2010, the new reporting segments are as follows:
- •
- Multimedia Communications—Focused on development and market opportunities in IPTV solutions and Wireless
infrastructure technologies, including related services revenue.
- •
- Broadband Infrastructure—Focused on our world class portfolio of broadband products, including related
services revenue.
- •
- Handsets—Focused on mobile phone business including PAS and CDMA handset market, as well as data cards markets. Handset sales to PCD LLC, which commenced after the July 1, 2008 sale of PCD, are included in this segment.
The Company's chief operating decision makers make financial decisions based on information they receive from their internal management system and currently evaluate the operating performance of and allocate resources to the reporting segments based on segment revenue and gross profit. Cost of sales and direct expenses in relation to production are assigned to the reporting segments. The accounting policies used in measuring segment assets and operating performance are the same as those used at the consolidated level.
144
NOTES TO CONSOLIDATED FINANCIAL STATEMENTS (Continued)
NOTE 16—SEGMENT REPORTING (Continued)
Summarized below are the Company's segment net sales, gross (loss) profit and segment margin for the years ended December 31, 2010, 2009 and 2008 based on the current reporting segment structure. The Company has reclassified its previously reported segment information for the year ended December 31, 2009 and 2008 to conform to the current segment presentation.
| |
Years Ended December 31, | ||||||||||||||||||
|---|---|---|---|---|---|---|---|---|---|---|---|---|---|---|---|---|---|---|---|
| |
2010 | % of net sales |
2009 | % of net sales |
2008 | % of net sales |
|||||||||||||
| |
(in thousands, except percentages) |
||||||||||||||||||
Net Sales by Segment |
|||||||||||||||||||
Multimedia Communication |
$ | 175,047 | 60 | % | $ | 177,080 | 46 | % | $ | 319,792 | 19 | % | |||||||
Broadband Infrastructure |
109,966 | 38 | % | 107,264 | 28 | % | 129,372 | 8 | % | ||||||||||
Handsets |
6,522 | 2 | % | 102,000 | 26 | % | 287,607 | 18 | % | ||||||||||
PCD |
— | — | — | — | 879,588 | 54 | % | ||||||||||||
Others |
— | — | — | — | 24,090 | 1 | % | ||||||||||||
|
$ | 291,535 | 100 | % | $ | 386,344 | 100 | % | $ | 1,640,449 | 100 | % | |||||||
| |
Years Ended December 31, | ||||||||||||||||||
|---|---|---|---|---|---|---|---|---|---|---|---|---|---|---|---|---|---|---|---|
| |
2010 | Gross Profit % |
2009 | Gross Profit % |
2008 | Gross Profit % |
|||||||||||||
| |
(in thousands, except percentages) |
||||||||||||||||||
Gross profit (loss) by Segment |
|||||||||||||||||||
Multimedia Communication |
$ | 49,849 | 28 | % | $ | 69,691 | 39 | % | $ | 139,662 | 44 | % | |||||||
Broadband Infrastructure |
15,063 | 14 | % | 14,270 | 13 | % | 1,341 | 1 | % | ||||||||||
Handsets |
5,326 | 82 | % | (18,982 | ) | (19 | )% | 39,015 | 14 | % | |||||||||
PCD |
— | — | — | — | 69,005 | 8 | % | ||||||||||||
Others |
— | — | — | — | 12,219 | 51 | % | ||||||||||||
|
$ | 70,238 | 24 | % | $ | 64,979 | 17 | % | $ | 261,242 | 16 | % | |||||||
| |
Years Ended December 31, | ||||||||||
|---|---|---|---|---|---|---|---|---|---|---|---|
| |
2010 | 2009 | 2008 | ||||||||
| |
(in thousands) |
||||||||||
Segment Margin and Operating Loss |
|||||||||||
Multimedia Communication |
$ | 22,476 | $ | 28,352 | $ | 82,415 | |||||
Broadband Infrastructure |
2,275 | (2,487 | ) | (24,720 | ) | ||||||
Handsets |
4,309 | (33,540 | ) | (11,879 | ) | ||||||
PCD |
— | — | 53,488 | ||||||||
Others |
— | — | (14,208 | ) | |||||||
Total segment margin |
29,060 | (7,675 | ) | 85,096 | |||||||
General and Corporate |
(102,782 | ) | (211,013 | ) | (261,312 | ) | |||||
Operating Loss |
$ | (73,722 | ) | $ | (218,688 | ) | $ | (176,216 | ) | ||
The segment margin includes all direct expenses related to operations of the segment such as direct product management and research and development expenses. General and corporate expenses include all un-allocated expenses such as sales and marketing, general and administration, common
145
NOTES TO CONSOLIDATED FINANCIAL STATEMENTS (Continued)
NOTE 16—SEGMENT REPORTING (Continued)
research and development expenses, equity award related charges, amortization of intangibles and restructuring and impairment charges. The Company excludes these items consistent with the manner in which it internally evaluates the performance of the segments.
Sales are attributed to a geographical area based upon the location of the customer. Sales data by geographical areas are as follows:
| |
Years Ended December 31, | ||||||||||||||||||
|---|---|---|---|---|---|---|---|---|---|---|---|---|---|---|---|---|---|---|---|
| |
2010 | % of net sales |
2009 | % of net sales |
2008 | % of net sales |
|||||||||||||
| |
(in thousands, except percentages) |
||||||||||||||||||
Net Sales by Region |
|||||||||||||||||||
United States |
$ | 5,903 | 2 | % | $ | 78,806 | 21 | % | $ | 1,003,072 | 61 | % | |||||||
China |
166,621 | 57 | % | 177,147 | 46 | % | 435,846 | 27 | % | ||||||||||
India |
31,426 | 11 | % | 62,859 | 16 | % | 28,166 | 2 | % | ||||||||||
Japan |
48,217 | 17 | % | 29,361 | 7 | % | 40,644 | 2 | % | ||||||||||
Other |
39,368 | 13 | % | 38,171 | 10 | % | 132,721 | 8 | % | ||||||||||
|
$ | 291,535 | 100 | % | $ | 386,344 | 100 | % | $ | 1,640,449 | 100 | % | |||||||
Long-lived assets, consisting of property, plant and equipment, by geographical area are as follows:
| |
December 31, | ||||||
|---|---|---|---|---|---|---|---|
| |
2010 | 2009 | |||||
| |
(in thousands) |
||||||
United States |
$ | 38 | $ | 170 | |||
China |
3,713 | 129,746 | |||||
Other |
1,068 | 696 | |||||
Total long-lived assets |
$ | 4,819 | $ | 130,612 | |||
NOTE 17—RELATED PARTY TRANSACTIONS
Softbank and affiliates
The Company recognizes revenue with respect to sales of telecommunications equipment to affiliates of Softbank, a significant stockholder of the Company. Softbank offers ADSL coverage throughout Japan, which is marketed under the name "YAHOO! BB". The Company supports Softbank's fiber-to-the-home service through sales of its carrier class GEPON product as well as its NetRing™ product. In addition, the Company supports Softbank's new internet protocol television ("IPTV"), through sales of its RollingStream™ product.
146
NOTES TO CONSOLIDATED FINANCIAL STATEMENTS (Continued)
NOTE 17—RELATED PARTY TRANSACTIONS (Continued)
During 2010, 2009 and 2008, the Company recognized revenue and cost of net sales for sales of telecommunications equipment and services to affiliates of Softbank as follows:
| |
Years Ended December 31, | |||||||||
|---|---|---|---|---|---|---|---|---|---|---|
| |
2010 | 2009 | 2008 | |||||||
| |
(in thousands) |
|||||||||
Net sales |
$ | 46,267 | $ | 23,063 | $ | 38,283 | ||||
Cost of net sales |
19,147 | 12,873 | 22,518 | |||||||
Gross profit |
$ | 27,120 | $ | 10,190 | $ | 15,765 | ||||
Fluctuations in gross profit as a percentage of net sales are expected and generally result from changes in product mix. In the year ended December 31, 2010, gross profit as a percentage of net sales also benefited approximately $2.4 million from the release of previously deferred revenue carve-out for potential penalty and cancellation penalties as a result of completing these obligations. Included in accounts receivable at December 31, 2010 and 2009 were $9.7 million and $5.5 million, respectively, related to these transactions. Amounts due to Softbank included in accounts payable was $1.3 million at December 31, 2010, and none as at December 31, 2009.
Sales to Softbank include a three year service period and a penalty clause if product failure rates exceed a certain level over a seven year period. As of December 31, 2010 and 2009, the Company's customer advance balance related to Softbank agreements was $0.2 million and $0.2 million, respectively. The current deferred revenue balance related to Softbank was $2.3 million and $1.4 million as of December 31, 2010 and 2009, respectively. The Company's noncurrent deferred revenue balance related to Softbank was $6.6 million as of December 31, 2010 compared to $8.8 million as of December 31, 2009.
As discussed in Note 4, the Company has a $1.2 million investment in SBI and affiliates of Softbank have a controlling interest in SBI.
As of December 31, 2010 and 2009, Softbank beneficially owned approximately 9.4% and 11%, respectively, of the Company's outstanding stock.
Yellowstone
Subsequent to the completion of BEIID investment on September 7, 2010, one of the Company's new directors also served as a director for Yellowstone Investment Advisory Ltd ("Yellowstone"). During 2010, the Company paid approximately $0.2 million for consulting services provided by Yellowstone. The Company also incurred approximately $0.9 million in expenses for a success fee for acquisition support services provided by Yellowstone.
Audiovox
Prior to the sale of PCD on July 1, 2008, one of the Company's former officers served as a director for Audiovox Corporation ("Audiovox"). During 2008, the Company paid approximately $0.8 million for IT services provided by Audiovox.
147
NOTES TO CONSOLIDATED FINANCIAL STATEMENTS (Continued)
NOTE 18—RESTRUCTURING
Restructuring Costs
2009 Restructuring Plan
On June 9, 2009, the Board of Directors of the Company approved a restructuring plan (the "2009 Restructuring Plan") designed to reduce the Company's operating costs. The 2009 Restructuring Plan includes a worldwide reduction in force of approximately 50% of the Company's headcount, or approximately 2,300 employees located primarily in China and the United States and, to a lesser degree, other international locations. During the year ended December 31, 2010, the Company recorded restructuring costs of approximately $15.7 million related to the 2009 Restructuring Plan, net of approximately $2.1 million of reversal of charges recorded in prior periods. The restructuring costs for the year ended December 31, 2010 consist primarily of $14.6 million for severance and benefits related to approximately 200 employees included in the 2009 Restructuring Plan, adjusted for changes in estimate in termination date of employees, and approximately $1.1 million of lease exit costs primarily related to a lease expiring in 2013. During the year ended December 31, 2009, the Company recorded restructuring costs of approximately $40.0 million related to the 2009 Restructuring Plan. Restructuring costs for the year ended December 31, 2009 included $38.0 million for severance and benefits related to approximately 2,100 employees and $1.9 million related primarily to the estimated loss on a lease obligation which expires in 2013. Total restructuring costs recorded through December 31, 2010 related to the 2009 Restructuring Plan approximated $55.7 million.
2008 Restructuring Plan
During fiscal 2008, the Company implemented a restructuring plan (the "2008 Restructuring Plan") and recorded $13.1 million in restructuring charges primarily related to a global reduction in force across all functions and employee terminations at certain non-core operations which the Company was in the process of winding down. The total number of employees affected totaled approximately 750, including 350 in China, 200 in Korea and 200 in other locations including the United States. During the year ended December 31, 2010, the Company recorded additional restructuring costs related to the 2008 Restructuring Plan of approximately $0.3 million, for severance and benefit costs being recognized over the remaining service period for employees included in the 2008 Restructuring Plan. During the year ended December 31, 2009, the Company recorded restructuring costs of approximately $6.3 million related to the 2008 Restructuring Plan, net of approximately $0.5 million of reversal of charges recorded in fiscal year 2008. The costs for the year ended December 31, 2009 of $6.3 million consist primarily of severance and benefits related to the transition of certain key functions to China, the divestiture of the Company's Korea operations and lease costs related to a lease obligation which expires in fiscal year 2010. Total restructuring costs recorded through December 31, 2010 related to the 2008 Restructuring Plan approximated $19.7 million.
2007 Restructuring Plan
At June 30, 2010, the 2007 Restructuring Plan was complete.
148
NOTES TO CONSOLIDATED FINANCIAL STATEMENTS (Continued)
NOTE 18—RESTRUCTURING (Continued)
The activity in the accrued restructuring balances related to all the plans described above was as follows for the year ended December 31, 2010:
| |
Balance at December 31, 2009 |
Restructuring Charges |
Cash Payments |
Non-cash Settlement |
Balance at December 31, 2010 |
||||||||||||
|---|---|---|---|---|---|---|---|---|---|---|---|---|---|---|---|---|---|
| |
(in thousands) |
||||||||||||||||
2009 Restructuring Plan |
|||||||||||||||||
Workforce Reduction |
$ | 16,939 | $ | 14,613 | $ | (20,075 | ) | $ | (2,052 | ) | $ | 9,425 | |||||
Lease Costs |
1,516 | 1,052 | (597 | ) | — | 1,971 | |||||||||||
Other Costs |
6 | 45 | — | (51 | ) | — | |||||||||||
Total 2009 Restructuring Plan |
18,461 | 15,710 | (20,672 | ) | (2,103 | ) | 11,396 | ||||||||||
2008 Restructuring Plan |
|||||||||||||||||
Workforce Reduction |
2,526 | 338 | (2,843 | ) | — | 21 | |||||||||||
Lease Costs |
385 | — | (385 | ) | — | — | |||||||||||
Other Costs |
30 | (30 | ) | — | — | — | |||||||||||
Total 2008 Restructuring Plan |
2,941 | 308 | (3,228 | ) | — | 21 | |||||||||||
2007 Restructuring Plan—Lease Costs |
305 |
— |
(305 |
) |
— |
— |
|||||||||||
Total |
$ | 21,707 | $ | 16,018 | $ | (24,205 | ) | $ | (2,103 | ) | $ | 11,417 | |||||
The activity in the accrued restructuring balances related to the plans described above was as follows for the years ended December 31, 2007, 2008 and 2009:
| |
Balance at December 31, 2007 |
Restructuring Charges |
Cash Payments |
Balance at December 31, 2008 |
Restructuring Charges |
Cash Payments |
Non-cash Settlement of Stock-based Compensation |
Balance at December 31, 2009 |
||||||||||||||||||
|---|---|---|---|---|---|---|---|---|---|---|---|---|---|---|---|---|---|---|---|---|---|---|---|---|---|---|
| |
(in thousands) |
|||||||||||||||||||||||||
2009 Restructuring Plan |
||||||||||||||||||||||||||
Workforce Reduction |
$ | — | $ | — | $ | — | $ | — | $ | 38,040 | $ | (18,704 | ) | $ | (2,397 | ) | $ | 16,939 | ||||||||
Lease Costs |
— | — | — | — | 1,923 | (407 | ) | — | 1,516 | |||||||||||||||||
Other Costs |
— | — | — | — | 13 | (7 | ) | — | 6 | |||||||||||||||||
Total 2009 Restructuring Plan |
— | — | — | — | 39,976 | (19,118 | ) | (2,397 | ) | 18,461 | ||||||||||||||||
2008 Restructuring Plan |
||||||||||||||||||||||||||
Workforce Reduction |
— | 12,232 | (4,256 | ) | 7,976 | 5,348 | (10,418 | ) | (380 | ) | 2,526 | |||||||||||||||
Lease Costs |
— | 329 | (80 | ) | 249 | 1,075 | (939 | ) | — | 385 | ||||||||||||||||
Other Costs |
— | 498 | — | 498 | (108 | ) | (360 | ) | — | 30 | ||||||||||||||||
Total 2008 Restructuring Plan |
— | 13,059 | (4,336 | ) | 8,723 | 6,315 | (11,717 | ) | (380 | ) | 2,941 | |||||||||||||||
2007 Restructuring Plan |
||||||||||||||||||||||||||
Workforce Reduction |
1,923 | — | (1,923 | ) | — | — | — | — | — | |||||||||||||||||
Lease Costs |
1,268 | — | (480 | ) | 788 | 204 | (687 | ) | — | 305 | ||||||||||||||||
Total 2007 Restructuring Plan |
3,191 | — | (2,403 | ) | 788 | 204 | (687 | ) | — | 305 | ||||||||||||||||
Total |
$ | 3,191 | $ | 13,059 | $ | (6,739 | ) | $ | 9,511 | $ | 46,495 | $ | (31,522 | ) | $ | (2,777 | ) | $ | 21,707 | |||||||
149
NOTES TO CONSOLIDATED FINANCIAL STATEMENTS (Continued)
NOTE 18—RESTRUCTURING (Continued)
The following table shows the total amount of costs incurred by segment in connection with the restructuring programs:
| |
Years Ended December 31, | ||||||||||
|---|---|---|---|---|---|---|---|---|---|---|---|
| |
2010 | 2009 | 2008 | ||||||||
| |
(in thousands) |
||||||||||
Multimedia Communications |
$ | 2,207 | $ | 8,255 | $ | 1,894 | |||||
Broadband Infrastructure |
1,338 | 5,863 | 769 | ||||||||
Handsets |
(34 | ) | 2,590 | 4,067 | |||||||
Other |
— | — | 1,252 | ||||||||
Total restructuring by segment |
3,511 | 16,708 | 7,982 | ||||||||
General and Corporate |
12,507 | 29,787 | 5,077 | ||||||||
Total restructuring |
$ | 16,018 | $ | 46,495 | $ | 13,059 | |||||
The remaining cash expenditures related to the 2009 and 2008 Restructuring Plans are expected to be paid in 2011. The remaining liabilities related to lease obligations are expected to be settled over the remaining lease term. The Company does not expect to incur additional significant restructuring charges in 2011 related to the 2009 and 2008 Restructuring Plans.
NOTE 19—OTHER INCOME, NET
Other income, net consists of the following:
| |
Years Ended December 31, | |||||||||
|---|---|---|---|---|---|---|---|---|---|---|
| |
2010 | 2009 | 2008 | |||||||
| |
(in thousands) |
|||||||||
Gain on sale of investments |
$ | — | $ | 355 | $ | 40,206 | ||||
Gain on liquidation of investment in a variable interest entity (see Note 20) |
— | — | 8,169 | |||||||
Other-than-temporary impairment of equity investments |
— | (5,517 | ) | (4,307 | ) | |||||
Foreign exchange (losses) gains |
8,004 | 6,256 | (9,908 | ) | ||||||
Settlement with MRV Communications(1) |
481 | — | — | |||||||
Other |
1,323 | 1,209 | 1,267 | |||||||
Total |
$ | 9,808 | $ | 2,303 | $ | 35,427 | ||||
- (1)
- Previously, the Company held an 8% ownership interest in Fiberxon, which was acquired by MRV Communications ("MRV") in 2007. In connection with the acquisition, Fiberxon shareholders received cash and stock as well as the right to potential deferred consideration. In December 2009, MRV entered into a settlement agreement for dismissal of legal proceedings between MRV and the former shareholders of Fiberxon regarding the amount of contingent consideration owed related to its acquisition. Proceeds received in the first quarter of 2010 represented the Company's proportionate share of the settlement amounts.
150
NOTES TO CONSOLIDATED FINANCIAL STATEMENTS (Continued)
NOTE 20—VARIABLE INTEREST ENTITIES
TET
In October 2008, the Company made an investment in Turnstone Environment Technologies LLC ("TET"), a Delaware limited liability company formed for the purpose of licensing and developing energy efficient renewable cooling solutions for cell towers in the telecommunications industry. In exchange for 5,180,788 Series A Preferred units representing approximately 22% of voting interest in TET and 500,000 Series A Preferred warrants at an exercise price of $0.9265 per unit and with an expiration term of 5 years, the Company contributed $4.8 million in cash. The Company currently does not have any representation on TET's board of directors nor the ability to control the management and operation decisions of TET. The operations of TET are in the development stage and the entity is actively seeking additional investors. The Company does not intend to and has no obligation to fund future losses or make additional contributions other than its initial investment. As of December 31, 2009 and 2008, TET was in effect entirely funded by the Company's initial investment as the capital contributions of the other current investors were not substantive. The Company has determined that the venture is a variable interest entity and the Company is the primary beneficiary because it is exposed to the majority of the variable interest entity's expected losses. Therefore, the Company is required to consolidate TET's financial statements under ASC 810-10-15, Variable Interest Entities Subsections. Beginning January 1, 2009, the assets, liabilities and operating results of TET were consolidated into the Company's balance sheet and statement of operations. The assets, liabilities and operating results of TET were determined to be immaterial to the Company as of December 31, 2008 and to the Company's results of operations and cash flows for the full year and the fourth quarter of 2008 and, therefore, were not consolidated. TET had no revenues and $3.9 million in expenses for the year ended December 31, 2009, of which $3.1 million relates to amortization of an acquired exclusive license to utilize solar cooling technology. The Company initially determined the appropriate amortization period for the exclusive license was to match the estimated revenue generation period from sale of products utilizing the licensed technology. In the third quarter of 2009, as a result of the delay in revenue generation, the Company changed its estimate to a systematic and rational allocation of straight-line amortization expense based on the term of the technology license. TET's operations are not considered to be integral to the Company's major operating activities. As such, all income and expenses from TET's operations, which are includable in the Company's income statement as a result of the application of ASC 810-10-15, Variable Interest Entities Subsections, have been classified within operating expense.
In the fourth quarter of 2009, the Company evaluated several fourth quarter events, including the continued unsuccessful efforts of TET to secure additional funding; the continued unsuccessful efforts of TET to locate a suitable local manufacturing partner, TET's continued need to amend and extend payment due dates of the acquired exclusive license to utilize solar cooling technology and the departure of a key employee of TET. The Company determined that the combined effect of these events, as well as others, was a triggering event for an impairment analysis of TET's long-lived assets. The Company furthered determined that the estimated cash flows from TET were not sufficient to recover the carrying value of TET's net assets. As a result, the Company recorded a $0.9 million impairment charge, included within operating expense, equal to its initial cost of investment of $4.8 million less the cumulative absorbed losses to date. As of December 31, 2009, the effect of consolidating TET resulted in an immaterial impact on the consolidated balance sheet.
In June 2009, the FASB issued authoritative guidance which revised the approach to identifying primary beneficiaries from a quantitative-based risks-and rewards calculation to a qualitative approach when assessing whether an entity has a controlling financial interest in a variable interest entity. This
151
NOTES TO CONSOLIDATED FINANCIAL STATEMENTS (Continued)
NOTE 20—VARIABLE INTEREST ENTITIES (Continued)
analysis identifies the primary beneficiary of a variable interest entity as one with the power to direct the activities of a variable interest entity that most significantly impact the entity's economic performance and the obligation to absorb losses of the entity that could potentially be significant to the variable interest. The Company adopted this new guidance in the first quarter of fiscal year 2010. Under the new guidance, the Company concluded that it does not have the power to direct the activities of TET that most significantly impact the entity's economic performance, and therefore, is not TET's primary beneficiary which would require consolidation. The Company further concluded that under the new guidance it would have accounted for its initial investment under the cost method. The new guidance also requires an enterprise upon initial adoption to determine the carrying amount of an investment in an entity that is no longer consolidated, as if it always had applied the provisions of the new guidance. Because under either the consolidation model or the cost method, the balance(s) of the assets/liabilities (investment) would be zero in the financial statements of the Company at December 31, 2009 or January 1, 2010, respectively, the adoption of the new guidance in 2010 has no financial statement impact to the Company.
Other
During the fourth quarter of 2005, the Company provided an interest free, $12.4 million loan to a party in China as seed capital for a venture organized to participate in providing technical service, networking technology and equipment to the emerging market for IPTV products in China. The loan, partially secured by an indirect ownership interest in the venture, was payable in 10 years and could be called early without penalty. As a result of the foregoing, and the fact that the venture's continuing viability was heavily dependent on the further provision of network and terminal equipment by the Company, the Company determined that the venture was a VIE and that the Company was the primary beneficiary of the venture. Therefore, the Company was required to consolidate the VIE's financial statements. The consolidation of this VIE in prior years did not have a significant impact on the Company's consolidated financial statements. In March 2008, the Company received a repayment in full of the loan's principal balance, eliminating its interest in the VIE, and resulting in reconsideration of the Company's position as the primary beneficiary. Based on this reconsideration event, management concluded the Company was no longer the primary beneficiary under FIN 46R and was no longer required to consolidate the VIE's financial statements. The Company's Consolidated Statement of Operations for the year ended December 31, 2008 includes the operating results of the VIE through February 2008, at which point the VIE was deconsolidated from the Company's financial statements. In the first quarter of 2008, the Company recorded an $8.2 million gain upon the repayment of the loan and deconsolidation that was included in other income, expense, net. As management expects continuing involvement with the ongoing entity's business as a supplier of IPTV equipment, the Company has determined the conditions for presentation as a discontinued operation were not met.
NOTE 21—SUBSEQUENT EVENTS
In March 2011, the Company entered into a Lease Agreement ("Lease") for research and development and administrative office in Hangzhou, China. Under the terms of the Lease, the Company will lease 32,983 square meters of gross floor area ("GFA") aboveground of the buildings, including common areas, through July 15, 2016. The lease payment is approximately $2.3 million annually, with a 9% increase starting from the fourth year of the lease and then another 9% increase from the fourth year's increased rent for year five. The Company has priority over third parties if it desires to renew the lease. The Company is also required to pay a security deposit in the amount of approximately $0.5 million. The Company may terminate all or part of the Lease by giving six months advance notice; however, the Company would be required to pay penalties and additional compensation, subject to a maximum of six months of lease payments, in the event of early termination.
152
QUARTERLY FINANCIAL DATA (UNAUDITED)
| |
Three months ended December 31, 2010 |
Three months ended September 30, 2010 |
Three months ended June 30, 2010 |
Three months ended March 31, 2010 |
||||||||||
|---|---|---|---|---|---|---|---|---|---|---|---|---|---|---|
| |
(in thousands, except per share amounts) |
|||||||||||||
Net sales |
||||||||||||||
Products |
67,298 | $ | 52,041 | $ | 62,615 | $ | 69,180 | |||||||
Services |
8,831 | 9,353 | 10,550 | 11,667 | ||||||||||
|
76,129 | 61,394 | 73,165 | 80,847 | ||||||||||
Cost of net sales |
||||||||||||||
Products |
60,713 | 43,065 | 43,507 | 46,282 | ||||||||||
Services |
7,352 | 6,236 | 6,786 | 7,356 | ||||||||||
Gross profit |
8,064 | 12,093 | 22,872 | 27,209 | ||||||||||
Operating expenses (income): |
||||||||||||||
Selling, general and administrative |
19,358 | 24,530 | 21,162 | 30,190 | ||||||||||
Research and development |
9,021 | 9,922 | 9,078 | 10,023 | ||||||||||
Amortization of intangible assets |
206 | — | — | — | ||||||||||
Restructuring |
6,391 | 2,336 | (216 | ) | 7,507 | |||||||||
Net gain on divestitures |
(304 | ) | (1,436 | ) | (2,056 | ) | (1,752 | ) | ||||||
Total net operating expenses |
34,672 | 35,352 | 27,968 | 45,968 | ||||||||||
Operating loss |
(26,608 | ) | (23,259 | ) | (5,096 | ) | (18,759 | ) | ||||||
Interest income |
626 | 594 | 450 | 348 | ||||||||||
Interest expense |
(71 | ) | (70 | ) | (68 | ) | (70 | ) | ||||||
Other income (expense), net |
2,741 | 6,967 | (4,767 | ) | 4,867 | |||||||||
Loss before income taxes |
(23,312 | ) | (15,768 | ) | (9,481 | ) | (13,614 | ) | ||||||
Income tax benefit (expense) |
128 | (1,400 | ) | 510 | (2,353 | ) | ||||||||
Net loss |
(23,184 | ) | (17,168 | ) | (8,971 | ) | (15,967 | ) | ||||||
Net loss (gain) attributable to noncontrolling interests |
155 | (4 | ) | 6 | 4 | |||||||||
Net loss attributable to UTStarcom, Inc. |
$ | (23,029 | ) | $ | (17,172 | ) | $ | (8,965 | ) | $ | (15,963 | ) | ||
Net loss per share attributable to UTStarcom, Inc.—basic and diluted |
$ | (0.15 | ) | $ | (0.13 | ) | $ | (0.07 | ) | $ | (0.12 | ) | ||
153
QUARTERLY FINANCIAL DATA (UNAUDITED) (Continued)
| |
Three months ended December 31, 2009 |
Three months ended September 30, 2009 |
Three months ended June 30, 2009 |
Three months ended March 31, 2009 |
||||||||||
|---|---|---|---|---|---|---|---|---|---|---|---|---|---|---|
| |
(in thousands, except per share amounts) |
|||||||||||||
Net sales |
||||||||||||||
Products |
$ | 98,220 | $ | 53,920 | $ | 65,735 | $ | 105,512 | ||||||
Services |
18,117 | 16,584 | 14,428 | 13,828 | ||||||||||
|
116,337 | 70,504 | 80,163 | 119,340 | ||||||||||
Cost of net sales |
||||||||||||||
Products |
72,943 | 36,994 | 87,265 | 87,036 | ||||||||||
Services |
8,418 | 9,321 | 8,736 | 10,652 | ||||||||||
Gross profit |
34,976 | 24,189 | (15,838 | ) | 21,652 | |||||||||
Operating expenses (income): |
||||||||||||||
Selling, general and administrative |
26,452 | 33,139 | 26,971 | 54,180 | ||||||||||
Research and development |
11,260 | 14,246 | 16,229 | 21,508 | ||||||||||
Impairment of long-lived assets |
33,287 | — | — | — | ||||||||||
Restructuring |
5,010 | 8,909 | 27,757 | 4,819 | ||||||||||
Net loss (gain) on divestitures |
(432 | ) | 1,689 | (1,357 | ) | — | ||||||||
Total net operating expenses |
75,577 | 57,983 | 69,600 | 80,507 | ||||||||||
Operating loss |
(40,601 | ) | (33,794 | ) | (85,438 | ) | (58,855 | ) | ||||||
Interest income |
283 | 462 | 599 | 749 | ||||||||||
Interest expense |
(8 | ) | (24 | ) | (230 | ) | (290 | ) | ||||||
Other income (expense), net |
5,644 | (1,556 | ) | 5,429 | (7,214 | ) | ||||||||
Loss before income taxes |
(34,682 | ) | (34,912 | ) | (79,640 | ) | (65,610 | ) | ||||||
Income tax benefit (expense) |
(4,694 | ) | 317 | (4,659 | ) | (1,824 | ) | |||||||
Net loss |
(39,376 | ) | (34,595 | ) | (84,299 | ) | (67,434 | ) | ||||||
Net loss (gain) attributable to noncontrolling interests |
(16 | ) | 15 | 16 | 1 | |||||||||
Net loss attributable to UTStarcom, Inc. |
$ | (39,392 | ) | $ | (34,580 | ) | $ | (84,283 | ) | $ | (67,433 | ) | ||
Net loss per share attributable to UTStarcom, Inc.—basic and diluted |
$ | (0.31 | ) | $ | (0.27 | ) | $ | (0.66 | ) | $ | (0.54 | ) | ||
154
ITEM 9—CHANGES IN AND DISAGREEMENTS WITH ACCOUNTANTS ON ACCOUNTING AND FINANCIAL DISCLOSURE
None.
ITEM 9A—CONTROLS AND PROCEDURES
Evaluation of Disclosure Controls and Procedures
The Company maintains disclosure controls and procedures that are designed to ensure that information required to be disclosed in the reports the Company files or submits under the Securities Exchange Act of 1934, as amended (the "Exchange Act"), is recorded, processed, summarized and reported within the time periods specified in the Securities and Exchange Commission's ("SEC") rules and forms, and that such information is accumulated and communicated to the Company's management, including its chief executive officer ("CEO") and chief financial officer ("CFO"), as appropriate, to allow timely decisions regarding required disclosures.
In connection with the preparation of this annual report on Form 10-K ("Form 10-K"), the Company's management carried out an evaluation as of December 31, 2010 under the supervision and with the participation of the CEO and CFO, of the effectiveness of the design and operation of the Company's disclosure controls and procedures, as such term is defined in Rules 13a-15(e) and 15d-15(e) under the Exchange Act. Based upon this evaluation, the CEO and CFO concluded that as of December 31, 2010 the Company's disclosure controls and procedures were not effective because of the material weaknesses described below under "Management's Annual Report on Internal Control over Financial Reporting."
To address the material weaknesses identified in the Company's evaluation of internal control over financial reporting, the Company implemented additional procedures (described below under the subheading "Remediation Initiatives Implemented By the Management") to ensure that the Company's consolidated financial statements as of and for year ended December 31, 2010, including the quarterly periods, were prepared in accordance with generally accepted accounting principles in the United States ("GAAP"). Accordingly, Company management believes that the consolidated financial statements included in this Form 10-K fairly present in all material respects the Company's financial condition, results of operations and cash flows for the periods presented and that this Form 10-K does not contain any untrue statement of a material fact or omit to state a material fact necessary to make the statements made, in light of the circumstances under which such statements were made, not misleading with respect to the periods covered by this report.
Management's Annual Report on Internal Control over Financial Reporting
Management is responsible for establishing and maintaining adequate internal control over financial reporting, as such term is defined in Rules 13a-15(f) and 15d-15(f) under the Exchange Act. Internal control over financial reporting is a process designed to provide reasonable assurance regarding the reliability of financial reporting and the preparation of financial statements for external reporting purposes in accordance with GAAP. Because of its inherent limitations, internal control over financial reporting may not prevent or detect misstatements. Also, projections of any evaluation of effectiveness to future periods are subject to the risk that controls may become inadequate because of changes in conditions, or that the degree of compliance with policies or procedures may deteriorate.
Management has conducted, with the participation of the CEO and CFO, an assessment, including testing, of the effectiveness of the Company's internal control over financial reporting as of December 31, 2010. In making its assessment, management used the criteria in Internal Control—Integrated Framework issued by the Committee of Sponsoring Organizations of the Treadway Commission ("COSO").
155
A material weakness is a deficiency, or a combination of deficiencies, in internal control over financial reporting, such that there is a reasonable possibility that a material misstatement of the company's annual or interim financial statements will not be prevented or detected on a timely basis. The following material weaknesses in internal control over financial reporting have been identified as of December 31, 2010.
1. The Company did not maintain effective controls over the period-end financial reporting process. Specifically, the Company's controls did not operate effectively to ensure the appropriate and timely analysis and monitoring of the underlying information relating to its period-end financial reporting process and preparation of consolidated financial statements including the timely and complete identification and recording of unusual and non-routine transactions.
The material weaknesses described above could result in misstatement of the Company's consolidated financial statements that would result in a material misstatement to the quarterly or annual consolidated financial statements that would not be prevented or detected.
2. The Company did not maintain effective controls over treasury process. Specifically, the Company did not maintain adequate segregation of duties and implement appropriate approval requirements for non-routine transactions relating to cash management. While this control deficiency did not result in any losses to the Company in the year ended December 31, 2010, the controls did not prevent inappropriate material banking transactions.
The material weakness described above could result in potential losses to the Company due to misappropriation of assets that would not be prevented and detected.
Because of these material weaknesses described above, management has concluded that the Company did not maintain effective internal control over financial reporting as of December 31, 2010, based on criteria established in Internal Control—Integrated Framework issued by the COSO.
The assessment of the effectiveness of the Company's internal control over financial reporting as of December 31, 2010 has been audited by PricewaterhouseCoopers ZhongTian CPAs Limited Company, an independent registered public accounting firm, as stated in their report which is included in Item 8 of this Form 10-K.
Remediation Initiatives Implemented by Management
The Company's management has been engaged in, and continues to engage in making necessary changes and improvements to the overall design of its control environment to address the material weaknesses in internal control over financial reporting and the ineffectiveness of the Company's disclosure controls and procedures described above.
In particular, the Company has implemented the specific remediation initiatives described below in the year 2010. These initiatives provide reasonable assurance regarding the reliability and completeness of financial information and disclosures reported in the Company's annual consolidated financial statements as of and for the year ended December 31, 2010 included in this Form 10-K.
1. To remediate the material weakness described above over "period-end financial reporting process" the Company has designed and implemented an adequate global financial close process and hired key individuals in the corporate finance and accounting function with significant technical skills and experience, deemed appropriate to their assigned responsibilities. Accordingly, the Company was able to implement controls to ensure independent management oversight and perform review procedures over accounts and disclosures in the Company's consolidated financial statements. The Company will continue to assess its standardized processes to further enhance the effectiveness of financial reviews including the analysis and monitoring of financial information in a consistent and thorough manner.
156
2. To remediate the material weakness described above over "Treasury Process" the Company has designed and implemented controls to separate closely related functions in the cash management function and reduce the risk of misappropriation of assets. The Company also reviewed and revised approval requirements for certain actions relating to cash management to better enhance management's monitoring of cash transactions. In addition, management implemented annual reviews of such approval requirements to ensure their continued appropriateness and effectiveness.
Management's Conclusion
Management believes there is a need to continue to enhance the effectiveness of the standardized review processes and the remediation measures described under "Remediation Initiatives Implemented by Management" above have not been operated for an adequate period of time to conclude that the material weaknesses identified in "Management's Annual Report on Internal Control over Financial Reporting" have been remediated. Management has discussed its conclusions with the Company's Audit Committee.
The Company is committed to continuing to improve its internal control processes and will continue to diligently and vigorously review its disclosure controls and procedures and its internal control over financial reporting in order to ensure compliance with the requirements of Section 404 of the Sarbanes-Oxley Act of 2002. However, any control system, regardless of how well designed, operated and evaluated, can provide only reasonable, not absolute, assurance that its objectives will be met. As management continues to evaluate and work to improve the Company's internal control over financial reporting, it may take additional measures as needed to further address the control deficiencies above.
Remediation of Material Weaknesses in Internal Control over Financial Reporting Reported in 2009
As of December 31, 2010, the Company believes it has effectively remediated material weaknesses in internal control over financial reporting that were included in "Management's Annual Report on Internal Control over Financial Reporting" in "Item 9A—Controls and Procedures" contained in the Company's Annual Report on Form 10-K for the fiscal year ended December 31, 2009:
1. Maintaining effective controls over "the recording of reserves for losses on customer contracts" to ensure timely and accurate recording of costs relating to reserves for losses on customer contracts and that existing loss reserves are adequate.
2. Maintaining effective controls over "financial reporting related to revenue recognition" to ensure that revenue is accurately and completely recorded.
For additional information relating to the control deficiencies that resulted in the material weaknesses listed above, please see the discussion under "Management's Report on Internal Control over Financial Reporting" in "Item 9A—Controls and Procedures" contained in the Company's Annual Report on Form 10-K for the fiscal year ended December 31, 2009.
During 2009, the Company designed and implemented remediation measures to address the material weaknesses listed above. As described in the Company's Annual Report on Form 10-K for fiscal year 2009, the remediation measures included the following:
1. Maintaining effective controls over "the recording of reserves for losses on customer contracts" to ensure correct accounting on loss contracts—The Company transitioned in the third quarter of 2008 the responsibility for calculating the loss contract reserves to its local project office in India, which facilitated enhanced coordination between the local business units, operations, sales and the finance team resulting in more timely and complete information available to Finance to analyze. During the third quarter of 2009, the Company finalized its assessment of additional
157
implemented modules of its ERP system in the operation in India, which enhanced the overall monitoring and analysis of the various accounts and balances in India. In the first quarter of 2010, the Company further enhanced the reviewing procedures and formalized cross-function meetings which further improved information sharing.
2. Maintaining effective controls over "financial reporting related to revenue recognition" to ensure that revenue is accurately and completely recorded—The Company enhanced its contracts review process in order to ensure that appropriate members of management have reviewed and confirmed critical information necessary to assess the proper revenue recognition accounting. Specifically, the Company implemented additional review procedures which require appropriately qualified company personnel to review the contracts in detail to improve the scope and quality of the independent reviews of underlying information related to the revenue contracts.
Management's Conclusion
Management has conducted an assessment, including testing, of the effectiveness of the Company's remediated internal control processes over financial reporting described above under "Remediation of Material Weaknesses Reported in 2009" as of December 31, 2010. In making its assessment, management used the criteria in Internal Control—Integrated Framework issued by COSO. Management believes these remediated internal control processes described above effectively mitigated, as of December 31, 2010, the material weaknesses listed above under "Remediation of Material Weaknesses Reported in 2009".
Changes in Internal Control over Financial Reporting
As discussed above under "Remediation Initiatives Implemented by Management" and "Remediation of Material Weaknesses in Internal Control over Financial Reporting Reported in 2009," the control processes adopted represent material changes to the Company's internal control over financial reporting during 2009 and 2010 that have materially affected, or are reasonably likely to materially affect, the Company's internal control over financial reporting.
None
158
ITEM 10—DIRECTORS, EXECUTIVE OFFICERS AND CORPORATE GOVERNANCE
Information regarding our directors, executive officers and corporate governance is incorporated by reference from the information contained in our Proxy Statement for the 2011 Annual Meeting of Stockholders. The information regarding current executive officers found under the heading "Executive Officers of the Registrant" in Part I, Item 1 hereof is also incorporated by reference into this Item 10. Information regarding Section 16 reporting compliance is incorporated by reference from information in our Proxy Statement for the 2011 Annual Meeting of Stockholders under the section heading "Section 16(a) Beneficial Ownership Reporting Compliance." The information regarding Audit Committee members and "audit committee financial experts" is incorporated by reference to the information contained in our Proxy Statement for the 2011 Annual Meeting of Stockholders.
We have adopted a Code of Business Conduct and Ethics ("Code of Ethics") that applies to all employees including our principal executive officers. The Code of Ethics is designed to promote: (i) honest and ethical conduct, including the ethical handling of actual or apparent conflicts of interest between personal and professional relationships, (ii) full, fair, accurate, timely and understandable disclosure in reports and documents that we are required to file to the SEC and in other public communications, (iii) compliance with applicable laws, rules and regulations, (iv) the prompt internal reporting of violations of the Code of Ethics to an appropriate person or entity, and (v) accountability for adherence to the Code of Ethics.
As a supplement to the Code of Ethics, we have also adopted a Code of Ethics for Chief Executive Officer and Senior Financial Officers ("Code of Ethics for Financial Officers"), which is designed to highlight the legal and ethical obligations of the Chief Executive Officer and financial officers. The Code of Ethics for Financial Officers imposes upon applicable officers certain additional internal reporting requirements for acts committed in violation of the Code of Ethics and/or the securities laws.
Copies of the Code of Ethics and the Code of Ethics for Financial Officers are available on our website at http://investorrelations.utstar.com/governance.cfm. Any waiver of the Code of Ethics or Code of Ethics for Financial Officers pertaining to a member of our Board or one of our executive officers will be disclosed on our website at http://investorrelations.utstar.com/governance.cfm.
ITEM 11—EXECUTIVE COMPENSATION
Information required by this item is incorporated by reference from the information contained in our Proxy Statement for the 2011 Annual Meeting of Stockholders.
ITEM 12—SECURITY OWNERSHIP OF CERTAIN BENEFICIAL OWNERS AND MANAGEMENT AND RELATED STOCKHOLDER MATTERS
Information relating to security ownership of certain beneficial owners and management required by this item is incorporated by reference from the information contained in our Proxy Statement for the 2011 Annual Meeting of Stockholders.
159
EQUITY COMPENSATION PLAN INFORMATION
The following table sets forth information, as of December 31, 2010, with respect to compensation plans under which the Company's equity securities are authorized to be issued:
Plan Category(1)
|
Number of securities to be issued upon exercise/ vesting of outstanding options and restricted stock units |
Weighted-average exercise price of outstanding options |
Number of securities remaining available for future issuance under equity compensation plans (excluding securities reflected in column(a)) |
|||||||
|---|---|---|---|---|---|---|---|---|---|---|
| |
(a) |
(b) |
(c) |
|||||||
Equity compensation plans approved by security holders |
5,046,953 | (2) | $ | 4.88 | (3) | 13,584,434 | (4) | |||
Equity compensation plans not approved by security holders |
26,250 | (5) | $ | 28.55 | — | (6) | ||||
Total |
5,073,203 | $ | 5.03 | (3) | 13,584,434 | |||||
- (1)
- See
Note 12 to the Consolidated Financial Statements for a description of the Company's equity compensation plans.
- (2)
- Includes
shares of common stock to be issued upon exercise of options granted under our 2006 Equity Incentive Plan (the "2006 Plan"), our 1997 Stock Plan,
and our 2001 Director Option Plan and 914,157 shares of our common stock issuable pursuant to restricted stock units under our 2006 Plan.
- (3)
- Because
restricted stock units do not have an exercise price, the 914,157 shares of common stock issuable pursuant to RSUs under our 2006 Plan are not
included in the calculation of weighted average exercise price.
- (4)
- Includes
906,440 shares of common stock to be issued upon exercise of options granted under our 2000 Employee Stock Purchase Plan and 12,677,994 shares of
common stock available for issuance under our 2006 Plan.
- (5)
- Includes
shares of common stock to be issued upon exercise of options granted under our 2003 Non-Statutory Option Plan. Upon implementation of
the 2006 Plan, the remaining securities available for future issuance under the 2003 Non-Statutory Stock Option Plan were rolled into the 2006 Plan. Does not include 5,768 shares of common
stock subject to outstanding options with a weighted average price of $3.35 that were assumed in acquisitions of Advanced Communication Devices Corporation.
- (6)
- Does not include 1,762 shares remaining available for future issuance under equity compensation plans related to our acquisition of Rolling Streams Systems, Ltd.
ITEM 13—CERTAIN RELATIONSHIPS AND RELATED TRANSACTIONS, AND DIRECTOR INDEPENDENCE
Information required by this item is incorporated by reference from the information contained in our Proxy Statement for the 2011 Annual Meeting of Stockholders.
ITEM 14—PRINCIPAL ACCOUNTING FEES AND SERVICES
Information required by this item is incorporated by reference from the information contained in our Proxy Statement for the 2011 Annual Meeting of Stockholders.
160
ITEM 15—EXHIBITS AND FINANCIAL STATEMENT SCHEDULES
| (a) | (1) | Financial Statements—See Index to Consolidated Financial Statements and Financial Statement Schedules at page 88 of this Form 10-K. | ||
(2) |
Financial Statement Schedules—See Index to Consolidated Financial Statements and Financial Statement Schedules at page 88 of this Form 10-K. |
| Exhibit Number |
Description | Form | Incorporated by Reference From Exhibit Number |
Date Filed | |||||||||
|---|---|---|---|---|---|---|---|---|---|---|---|---|---|
| 2.1 | Property Transfer and Leaseback Agreement, dated as of December 19, 2009, by and between UTStarcom Telecom Co., Ltd. and Zhejiang Zhongnan Construction Group Co., Ltd. (translation from Chinese). | 8-K | 2.1 | 12/24/2009 | |||||||||
3.1 |
Thirteenth Amended and Restated Certificate of Incorporation of UTStarcom, Inc., as amended. |
8-K |
3.1 |
12/12/03 |
|||||||||
3.2 |
Second Amended and Restated Bylaws of UTStarcom, Inc., as effective June 28, 2008. |
8-K |
3.1 |
4/14/08 |
|||||||||
4.1 |
See exhibits 3.1 and 3.2 for provisions of the Certificate of Incorporation and Bylaws defining the rights of holders of Common Stock. |
— |
— |
— |
|||||||||
4.2 |
Specimen Common Stock Certificate. |
S-1/A |
4.1 |
2/7/00 |
|||||||||
4.3 |
Third Amended and Restated Registration Rights Agreement dated December 14, 1999. |
S-1 |
4.2 |
12/20/99 |
|||||||||
4.4 |
Underwriting Agreement, dated January 8, 2004 between the Company and Bank of America Securities LLC, as amended on January 14, 2004. |
10-K |
4.7 |
4/15/05 |
|||||||||
4.5 |
Stockholder Rights Agreement, made as of February 1, 2010, by and between UTStarcom, Inc. and Beijing E-town International Investment and Development Co., Ltd. |
8-K |
4.1 |
2/4/2010 |
|||||||||
4.6 |
Stockholder Rights Agreement, made as of February 1, 2010, by and among UTStarcom, Inc., Elite Noble Limited and Shah Capital Opportunity Fund LP |
8-K |
4.2 |
2/4/2010 |
|||||||||
10.1 |
Form of Indemnification Agreement. |
S-1 |
10.1 |
12/20/99 |
|||||||||
10.2* |
1997 Stock Plan, as amended, and forms of related agreements. |
10-K |
10.4 |
6/1/06 |
|||||||||
10.3* |
2000 Employee Stock Purchase Plan and forms of related agreements. |
S-1 |
10.5 |
12/20/99 |
|||||||||
161
| Exhibit Number |
Description | Form | Incorporated by Reference From Exhibit Number |
Date Filed | |||||||||
|---|---|---|---|---|---|---|---|---|---|---|---|---|---|
| 10.4†† | Land Use Right Assignment Agreement between the Administration Committee of Hangzhou Hi-Tech Industry Development Zone of Zhejiang Province of the People's Republic of China and UTStarcom, Inc. dated May 18, 2000. | 10-Q | 10.2 | 8/14/00 | |||||||||
10.5* |
Amended 2001 Director Option Plan and forms of related agreements. |
10-K |
10.66 |
6/1/06 |
|||||||||
10.6* |
UTStarcom, Inc. 2003 Nonstatutory Stock Option Plan. |
S-8 |
4.4 |
9/15/03 |
|||||||||
10.7* |
Amended and Restated Change of Control/Involuntary Termination Severance Agreement by and between Hong Liang Lu and UTStarcom, Inc., effective as of January 30, 2008. |
8-K |
10.1 |
2/5/08 |
|||||||||
10.8† |
Infrastructure Equipment License Agreement between Qualcomm Inc. and UTStarcom, Inc., dated January 30, 2004. |
10-Q |
10.97 |
5/10/04 |
|||||||||
10.9† |
Subscriber Unit License Agreement between Qualcomm Inc. and UTStarcom, Inc., dated January 30, 2004. |
10-Q |
10.98 |
5/10/04 |
|||||||||
10.10 |
Asset Purchase Agreement by and among Audiovox Communications Corp., Quintex Mobile Communications Corporation, Audiovox Communications Canada Co., UTStarcom, Inc., UTStarcom Canada Company and Audiovox Corporation, dated as of June 11, 2004. |
10-Q |
10.101 |
8/16/04 |
|||||||||
10.11* |
Agreement by and between Francis P. Barton and UTStarcom, Inc., dated July 29, 2005. |
8-K |
10.3 |
9/12/05 |
|||||||||
10.12* |
Form of Restricted Stock Agreement for use under the Company's 1997 Stock Plan. |
8-K |
10.1 |
9/12/05 |
|||||||||
10.13* |
Form of Director and Officer Stock Option Agreement for use under the Company's 1997 Stock Plan. |
8-K |
10.1 |
12/6/05 |
|||||||||
10.14* |
UTStarcom, Inc. 2006 Equity Incentive Plan (2006 EIP), as amended February 18, 2009. |
10-K |
10.14 |
3/2/2009 |
|||||||||
10.15* |
Form of Stock Option Award Agreement for use under 2006 Equity Incentive Plan. |
10-Q |
10.2 |
8/7/2009 |
|||||||||
10.16* |
Form of Stock Option Agreement for Directors and Officers for use under the 2006 Equity Incentive Plan. |
10-Q |
10.3 |
8/7/2009 |
|||||||||
10.17* |
Form of Restricted Stock Agreement for use under the 2006 EIP. |
10-K |
10.17 |
3/2/2009 |
|||||||||
162
| Exhibit Number |
Description | Form | Incorporated by Reference From Exhibit Number |
Date Filed | |||||||||
|---|---|---|---|---|---|---|---|---|---|---|---|---|---|
| 10.18* | Form of Restricted Stock Unit Agreement for use under the 2006 EIP. | 10-K | 10.18 | 3/2/2009 | |||||||||
10.19* |
Amended and Restated Change of Control/Involuntary Termination Severance Agreement by and between Francis P. Barton and UTStarcom, Inc., effective as of January 30, 2008. |
8-K |
10.3 |
2/5/08 |
|||||||||
10.20* |
Form of Stock Option Amendment Election Form executed by key executive officers and directors. |
8-K |
10.1 |
1/4/07 |
|||||||||
10.21* |
Stock Option Amendment Election Form executed by Hong Liang Lu on December 29, 2006. |
8-K |
10.2 |
1/4/07 |
|||||||||
10.22* |
Offer Letter to Viraj Patel dated November 2, 2005. |
10-Q |
10.6 |
10/10/07 |
|||||||||
10.23* |
Offer Letter to Mark Green dated December 19, 2005. |
10-Q |
10.7 |
10/10/07 |
|||||||||
10.24* |
Employment Agreement by and between Philip Christopher and UTStarcom, Inc. dated June 11, 2004. |
10-Q |
10.9 |
10/10/07 |
|||||||||
10.25†† |
Strategic Alliance Agreement by and between Pantech & Curitel Communications and UTStarcom Personal Communications LLC dated September 25, 2006. |
10-Q |
10.11 |
10/10/07 |
|||||||||
10.26* |
UTStarcom, Inc. Amended and Restated Vice President Change in Control and Involuntary Termination Severance Pay Plan. |
10-Q |
10.1 |
5/8/2009 |
|||||||||
10.27* |
UTStarcom, Inc. Amended and Restated Executive Involuntary Termination Severance Pay Plan. |
10-Q |
10.2 |
5/8/2009 |
|||||||||
10.28* |
Amended and Restated Change of Control/ Involuntary Termination Severance Agreement between UTStarcom, Inc. and Peter Blackmore, effective as of January 30, 2008. |
8-K |
10.2 |
2/5/08 |
|||||||||
10.29* |
Peter Blackmore Offer Letter as amended on October 25, 2007. |
8-K |
99.1 |
10/31/07 |
|||||||||
10.30* |
Form of Performance Share Agreement for use under the 2006 EIP. |
10-K |
10.33 |
3/2/2009 |
|||||||||
10.31* |
Form of Performance Unit Agreement for use under the 2006 EIP. |
10-K |
10.34 |
3/2/2009 |
|||||||||
10.32* |
Retention Agreement between the Company and Francis P. Barton dated November 30, 2007. |
8-K |
10.2 |
11/30/07 |
|||||||||
163
| Exhibit Number |
Description | Form | Incorporated by Reference From Exhibit Number |
Date Filed | |||||||||
|---|---|---|---|---|---|---|---|---|---|---|---|---|---|
| 10.33 | Merger Agreement, dated as of June 30, 2008, by and among UTStarcom, Inc., UTStarcom Personal Communications, LLC, Personal Communications Devices, LLC and Personal Communications Devices Holdings, LLC. | 8-K | 2.1 | 7/7/08 | |||||||||
10.34* |
Separation Agreement and Release, dated August 28, 2008, by and between Francis P. Barton and UTStarcom, Inc. |
10-Q |
10.2 |
11/7/08 |
|||||||||
10.35* |
Amendment to Stock Option Agreements dated January 11, 2008 between the Company and Hong Liang Lu. |
8-K |
10.1 |
1/17/08 |
|||||||||
10.36* |
Amendment dated December 17, 2008 to Peter Blackmore Offer Letter. |
10-K |
10.41 |
3/2/2009 |
|||||||||
10.37* |
Amendment dated December 17, 2008 to Amended and Restated Change of Control/Involuntary Termination Severance Agreement, dated as of January 30, 2008, by and between Hong Liang Lu and UTStarcom, Inc. |
10-K |
10.42 |
3/2/2009 |
|||||||||
10.38* |
Amendment dated December 17, 2008 to Amended and Restated Change of Control/Involuntary Termination Severance Agreement, dated as of January 30, 2008, by and between Peter Blackmore and UTStarcom, Inc. |
10-K |
10.43 |
3/2/2009 |
|||||||||
10.39* |
Offer letter to Susan Marsch dated March 9, 2007. |
10-K |
10.44 |
3/2/2009 |
|||||||||
10.40* |
Letter to Susan Marsch dated June 16, 2008 regarding Restricted Cash Award. |
10-K |
10.45 |
3/2/2009 |
|||||||||
10.41* |
Amendment to Equity Awards dated December 17, 2008. |
10-K |
10.46 |
3/2/2009 |
|||||||||
10.42* |
Letter dated December 17, 2008 regarding Financial Planning Program. |
10-K |
10.47 |
3/2/2009 |
|||||||||
10.43* |
Special Bonus Letter, dated November 1, 2008 by and between Viraj Patel and UTStarcom, Inc. |
10-K |
10.48 |
3/2/2009 |
|||||||||
10.44* |
Amendment, dated December 17, 2008, to Special Bonus Letter, dated November 1, 2008 by and between Viraj Patel and UTStarcom, Inc. |
10-K |
10.49 |
3/2/2009 |
|||||||||
10.45* |
Letter to Viraj Patel dated December 7, 2007 regarding bonus and stock awards. |
10-K |
10.50 |
3/2/2009 |
|||||||||
10.46* |
Letter to Mark Green dated December 7, 2007 regarding bonus and stock award. |
10-K |
10.51 |
3/2/2009 |
|||||||||
10.47* |
Letter to Susan Marsch dated December 7, 2007 regarding bonus and stock award. |
10-K |
10.52 |
3/2/2009 |
|||||||||
164
| Exhibit Number |
Description | Form | Incorporated by Reference From Exhibit Number |
Date Filed | |||||||||
|---|---|---|---|---|---|---|---|---|---|---|---|---|---|
| 10.48* | Letter Agreement dated March 23, 2009 by and between UTStarcom, Inc. and Hong Liang Lu relating to temporary salary reduction. | 8-K | 10.1 | 3/25/2009 | |||||||||
10.49* |
Letter Agreement dated March 23, 2009 by and between UTStarcom, Inc. and Peter Blackmore relating to temporary salary reduction. |
8-K |
10.2 |
3/25/2009 |
|||||||||
10.50 |
Settlement Agreement & Release, dated as of June 30, 2009, by and among UTStarcom, Inc., Personal Communications Devices, LLC and Personal Communications Devices Holdings, LLC. |
8-K |
10.1 |
7/2/2009 |
|||||||||
10.51* |
Offer Letter to Kenneth Luk dated November 15, 2009. |
8-K |
10.1 |
12/18/2009 |
|||||||||
10.52* |
Letter to Viraj Patel regarding transition bonus |
10-K |
10.52 |
3/15/2010 |
|||||||||
10.53 |
Manufacturing Agreement signed as of January 23, 2010 |
8-K |
10.1 |
1/28/2010 |
|||||||||
10.54 |
Common Stock Purchase Agreement, made as of February 1, 2010, by and between UTStarcom, Inc. and Beijing E-town International Investment and Development Co., Ltd. |
8-K |
10.1 |
2/4/2010 |
|||||||||
10.55 |
Common Stock Purchase Agreement, made as of February 1, 2010, by and among UTStarcom, Inc., Elite Noble Limited and Shah Capital Opportunity Fund LP |
8-K |
10.2 |
2/4/2010 |
|||||||||
10.56 |
Agreement of Entry into the Zone, made as of February 1, 2010, by and between UTStarcom, Inc. and the Management Committee of Beijing Economic and Technology Development Zone (Translation from Chinese) |
8-K |
10.3 |
2/4/2010 |
|||||||||
10.57* |
Employment Offer Letter, dated February 1, 2010 from UTStarcom, Inc. to Mr. Jack Lu |
8-K |
10.4 |
2/4/2010 |
|||||||||
10.58* |
Involuntary Termination Severance Agreement, dated as of February 1, 2010, by and between UTStarcom, Inc. and Mr. Jack Lu |
8-K |
10.5 |
2/4/2010 |
|||||||||
10.59 |
Lease Contract dated as of February 1, 2010, by and between UTStarcom Telecom Co., Ltd. and Zhejiang Zhongnan Construction Group Co., Ltd. (translation from Chinese) |
8-K/A |
10.1 |
2/5/2010 |
|||||||||
10.60* |
Amendment to Employment Offer Letter dated February 22, 2010 from UTStarcom, Inc. to Ying (Jack) Lu |
8-K |
10.1 |
3/1/2010 |
|||||||||
165
| Exhibit Number |
Description | Form | Incorporated by Reference From Exhibit Number |
Date Filed | |||||||||
|---|---|---|---|---|---|---|---|---|---|---|---|---|---|
| 10.61* | Letter to Peter Blackmore dated March 4, 2010 regarding transition bonus | 10-K | 10.61 | 3/15/2010 | |||||||||
10.62 |
Amendment to Common Stock Purchase Agreement dated February 1, 2010 by and between the Company and Beijing E-town International Investment and Development Co., Ltd. dated April 20, 2010 |
8-K |
10.1 |
5/4/2010 |
|||||||||
10.63 |
Amendment to Common Stock Purchase Agreement dated February 1, 2010 by and among the Company, Elite Noble Limited and Shah Capital Opportunity Fund LP dated April 30, 2010 |
8-K |
10.2 |
5/4/2010 |
|||||||||
10.64* |
Offer Letter to Edmond Cheng dated April 26, 2010 |
8-K |
10.1 |
5/4/2010 |
|||||||||
10.65* |
Agreement between Kenneth Luk and UTStarcom, Inc. dated May 3, 2010 |
8-K |
10.2 |
5/4/2010 |
|||||||||
10.66 |
Supplementary Agreement on Payment Method between UTStarcom Telecom Co., Ltd and Hangzhou Zhong Nan Wen Chuang Information Technical Co., Ltd. (translation from Chinese) |
10-Q |
10.11 |
5/10/2010 |
|||||||||
10.67 |
Second Amendment to Common Stock Purchase Agreement dated February 1, 2010, as amended on April 30, 2010, by and between the Company and Beijing E-town International Investment and Development Co., Ltd. dated June 4, 2010 |
8-K |
10.1 |
6/10/2010 |
|||||||||
10.68 |
Second Amendment to Common Stock Purchase Agreement dated February 1, 2010, as amended on April 30, 2010, by and among the Company, Elite Noble Limited and Shah Capital Opportunity Fund LP dated June 4, 2010 |
8-K |
10.2 |
6/10/2010 |
|||||||||
10.69 |
Third Amendment to Common Stock Purchase Agreement dated February 1, 2010, as amended on April 30, 2010 and June 4, 2010, by and between the Company and Beijing E-town International Investment and Development Co., Ltd. dated July 7, 2010 |
8-K |
10.1 |
7/13/2010 |
|||||||||
10.70 |
Third Amendment to Common Stock Purchase Agreement dated February 1, 2010, as amended on April 30, 2010 and June 4, 2010, by and among the Company, Elite Noble Limited and Shah Capital Opportunity Fund LP dated July 7, 2010 |
8-K |
10.2 |
7/13/2010 |
|||||||||
166
| Exhibit Number |
Description | Form | Incorporated by Reference From Exhibit Number |
Date Filed | |||||||||
|---|---|---|---|---|---|---|---|---|---|---|---|---|---|
| 10.71 | Fourth Amendment to Common Stock Purchase Agreement dated February 1, 2010, as amended on April 30, 2010, June 4, 2010 and July 7, 2010, by and between the Company and Beijing E-town International Investment and Development Co., Ltd. dated September 7, 2010 | 8-K | 10.1 | 9/13/2010 | |||||||||
10.72 |
Fourth Amendment to Common Stock Purchase Agreement dated February 1, 2010, as amended on April 30, 2010, June 4, 2010 and July 7, 2010, by and among the Company, Elite Noble Limited and Shah Capital Opportunity Fund LP dated September 7, 2010 |
8-K |
10.2 |
9/13/2010 |
|||||||||
10.73 |
Ordinary Shares Purchase Agreement dated October 16, 2010 by and among Stage Smart Limited, Smart Frontier Holdings Limited, and UTStarcom, Inc. |
8-K |
10.1 |
10/21/2010 |
|||||||||
10.74 |
Series A Preference Shares Purchase Agreement dated October 16, 2010 by and among Stage Smart Limited, Stage Smart (Beijing) Technology Limited, Stage Smart (Hong Kong) Limited, CRIStar (Beijing) Culture and Media Co., Ltd., UTStarcom, Inc. and Smart Frontier Holdings Limited. |
8-K |
10.2 |
10/21/2010 |
|||||||||
21.1 |
Subsidiaries of UTStarcom Inc. |
Filed herewith |
— |
— |
|||||||||
23.1 |
Consent of Independent Registered Public Accounting Firm. |
Filed herewith |
— |
— |
|||||||||
24.1 |
Power of Attorney (included on signature page). |
Filed herewith |
— |
— |
|||||||||
31.1 |
Certification of Chief Executive Officer Pursuant to Section 302 of the Sarbanes-Oxley Act of 2002. |
Filed herewith |
— |
— |
|||||||||
31.2 |
Certification of Chief Financial Officer Pursuant to Section 302 of the Sarbanes-Oxley Act of 2002. |
Filed herewith |
— |
— |
|||||||||
32.1 |
Certifications Pursuant to 18 U.S.C. Section 1350, As Adopted Pursuant To Section 906 of the Sarbanes-Oxley Act of 2002. |
Filed herewith |
— |
— |
|||||||||
- *
- Management
contract, plan or arrangement.
- †
- Portions
of the exhibit have been omitted pursuant to an order granted by the Securities and Exchange Commission for confidential treatment.
- ††
- Portions of the exhibit have been omitted pursuant to a request for confidential treatment filed with the Securities and Exchange Commission.
In reviewing the agreements included as exhibits to this Annual report on Form 10-K, please remember they are included to provide you with information regarding their terms and are not
167
intended to provide any other factual or disclosure information about the Company or the other parties to the agreements. The agreements contain representations and warranties by each of the parties to the applicable agreement. These representations and warranties have been made solely for the benefit of the other parties to the applicable agreement and:
- •
- should not in all instances be treated as categorical statements of fact, but rather as a way of allocating the risk to
one of the parties if those statements prove to be inaccurate;
- •
- have been qualified by disclosures that were made to the other party in connection with the negotiation of the applicable
agreement, which disclosures are not necessarily reflected in the agreement;
- •
- may apply standards of materiality in a way that is different from what may be viewed as material to you or other
investors; and
- •
- were made only as of the date of the applicable agreement or such other date or dates as may be specified in the agreement and are subject to more recent developments.
Accordingly, these representations and warranties may not describe the actual state of affairs as of the date they were made or at any other time. Additional information about the Company may be found elsewhere in this Annual Report on Form 10-K and the Company's other public filings, which are available without charge at our website, www.utstar.com. The information contained on our website is not being incorporated herein.
168
Pursuant to the requirements of Section 13 or 15(d) of the Securities Exchange Act of 1934, the registrant has duly caused this Annual Report on Form 10-K for the year ended December 31, 2010 to be signed on its behalf by the undersigned, thereunto duly authorized.
| UTSTARCOM, INC. | ||||
Date: March 16, 2011 |
By: |
/s/ EDMOND CHENG |
||
| Name: | Edmond Cheng | |||
| Title: | Senior Vice President and Chief Financial Officer |
|||
KNOW ALL PERSONS BY THESE PRESENT, that each person whose signature appears below constitutes and appoints Jack Lu and Edmond Cheng, jointly and severally, his or her attorneys-in-fact, each with the power of substitution, for him in any and all capacities, to sign any amendments to this report on Form 10-K, and to file the same, with exhibits thereto and other documents in connection therewith with the Securities and Exchange Commission, hereby ratifying and confirming all that each of said attorneys-in-fact, or his substitute or substitutes may do or cause to be done by virtue hereof.
Pursuant to the requirements of the Securities Exchange Act of 1934, this report has been signed below by the following persons on behalf of the registrant and in the capacities and on the dates indicated:
Name
|
Title
|
Date
|
||
|---|---|---|---|---|
| /s/ JACK LU Jack Lu |
Chief Executive Officer, President and Director (principal executive officer) | March 16, 2011 | ||
/s/ EDMOND CHENG Edmond Cheng |
Senior Vice President and Chief Financial Officer, (principal financial officer and principal accounting officer) |
March 16, 2011 |
||
/s/ HONG LIANG LU Hong Liang Lu |
Director |
March 16, 2011 |
||
/s/ THOMAS J. TOY Thomas J. Toy |
Chairman |
March 16, 2011 |
||
/s/ WILLIAM SHIU KAU WONG William Shiu Kau Wong |
Director |
March 16, 2011 |
||
/s/ LI XIAOPING Li Xiaoping |
Director |
March 16, 2011 |
||
/s/ DU BAICHUAN Du Baichuan |
Director |
March 16, 2011 |
||
/s/ XIE LIN ZHEN Xie Lin Zhen |
Director |
March 16, 2011 |
169
UTSTARCOM, INC. (UNCONSOLIDATED—PARENT COMPANY BASIS)
REGISTRANT BALANCE SHEETS
(in thousands, except par value)
| |
December 31, | |||||||
|---|---|---|---|---|---|---|---|---|
| |
2010 | 2009 | ||||||
ASSETS |
||||||||
Current assets: |
||||||||
Cash and cash equivalents |
$ | 89,225 | $ | 75,606 | ||||
Accounts receivable—unrelated party, net of allowances for doubtful accounts |
2,745 | 5,848 | ||||||
Accounts receivable—related party |
8,471 | 3,199 | ||||||
Accounts receivable—intercompany |
118,154 | 156,926 | ||||||
Inventories and deferred costs |
6,522 | 25,871 | ||||||
Prepaids and other current assets |
14,686 | 15,555 | ||||||
Restricted cash |
12,357 | 19,225 | ||||||
Total current assets |
252,160 | 302,230 | ||||||
Property, plant and equipment, net |
47 | 191 | ||||||
Long-term investment |
10,040 | 7,931 | ||||||
Investment in affiliated companies |
24,801 | 25,566 | ||||||
Non-current deferred tax asset |
326 | — | ||||||
Other long-term assets |
33,267 | 37,692 | ||||||
Total assets |
$ | 320,641 | $ | 373,610 | ||||
LIABILITIES AND STOCKHOLDERS' EQUITY |
||||||||
Current liabilities: |
||||||||
Accounts payable |
$ | 12,737 | $ | 10,931 | ||||
Accounts payable—intercompany |
5,930 | 19,103 | ||||||
Income taxes payable |
8,256 | 8,463 | ||||||
Customer advances |
5,292 | 10,477 | ||||||
Deferred revenue |
5,389 | 6,167 | ||||||
Current deferred tax liability |
326 | — | ||||||
Other current liabilties |
31,038 | 48,915 | ||||||
Total current liabilities |
68,968 | 104,056 | ||||||
Long-term deferred revenue and other long-term liabilities |
10,744 | 14,195 | ||||||
Total liabilities |
79,712 | 118,251 | ||||||
Stockholders' equity: |
||||||||
Common stock: $.00125 par value; authorized: 750,000 shares; issued and outstanding:155,327 and 130,095 at December 31, 2010 and 2009, respectively |
182 | 153 | ||||||
Additional paid-in capital |
1,303,627 | 1,251,532 | ||||||
Retained earnings |
(1,132,303 | ) | (1,067,174 | ) | ||||
Accumulated other comprehensive income |
69,423 | 70,848 | ||||||
Total stockholders' equity |
240,929 | 255,359 | ||||||
Total liabilities and stockholders' equity |
$ | 320,641 | $ | 373,610 | ||||
The accompanying notes are an integral part of these financial statements.
170
UTSTARCOM, INC. (UNCONSOLIDATED—PARENT COMPANY BASIS)
CONDENSED INFORMATION AS TO THE RESULTS OF OPERATIONS OF THE REGISTRANT
(in thousands)
| |
Years Ended December 31, | ||||||||||
|---|---|---|---|---|---|---|---|---|---|---|---|
| |
2010 | 2009 | 2008 | ||||||||
Net sales |
|||||||||||
Unrelated parties |
$ | 35,552 | $ | 113,280 | $ | 214,835 | |||||
Related parties |
34,702 | 9,535 | 28,702 | ||||||||
Intercompany |
18,983 | 30,743 | 75,656 | ||||||||
|
89,237 | 153,558 | 319,193 | ||||||||
Cost of sales |
|||||||||||
Unrelated parties |
40,518 | 97,262 | 118,774 | ||||||||
Related parties |
12,178 | 7,170 | 17,476 | ||||||||
Intercompany |
18,513 | 32,125 | 79,110 | ||||||||
Gross profit |
18,028 | 17,001 | 103,833 | ||||||||
Operating expenses: |
|||||||||||
Selling, general and administrative |
30,701 | 64,748 | 119,536 | ||||||||
Research and development |
20,301 | 32,581 | 39,555 | ||||||||
Amortization of intangible assets |
— | — | 1,586 | ||||||||
Restructuring charges |
9,994 | 21,970 | 7,728 | ||||||||
Impairment of long-lived assets |
— | — | 19,435 | ||||||||
Total operating expenses |
60,996 | 119,299 | 187,840 | ||||||||
Operating loss |
(42,968 |
) |
(102,298 |
) |
(84,007 |
) |
|||||
Interest income |
101 |
653 |
4,649 |
||||||||
Interest expense |
(269 | ) | (20 | ) | (7,763 | ) | |||||
Other income, net |
4,742 | 15,939 | 35,651 | ||||||||
Loss before income taxes and equity in loss of affiliated companies |
(38,394 | ) | (85,726 | ) | (51,470 | ) | |||||
Equity in net loss of affiliated companies |
(26,438 | ) | (141,748 | ) | (102,524 | ) | |||||
Income tax benefit (expense) |
(297 | ) | 1,786 | 3,678 | |||||||
Net loss |
$ | (65,129 | ) | $ | (225,688 | ) | $ | (150,316 | ) | ||
The accompanying notes are an integral part of these financial statements.
171
UTSTARCOM, INC. (UNCONSOLIDATED—PARENT COMPANY BASIS)
CONDENSED INFORMATION AS TO THE CASH FLOWS OF THE REGISTRANT
(in thousands)
| |
Years Ended December 31, | |||||||||||
|---|---|---|---|---|---|---|---|---|---|---|---|---|
| |
2010 | 2009 | 2008 | |||||||||
CASH FLOWS FROM OPERATING ACTIVITIES: |
||||||||||||
Net loss |
$ | (65,129 | ) | $ | (225,688 | ) | $ | (150,316 | ) | |||
Adjustment to reconcile net loss to net cash provided by (used in) operating activities: |
||||||||||||
Depreciation and amortization |
172 | 653 | 9,180 | |||||||||
Stock-based compensation expense |
7,602 | 12,094 | 20,565 | |||||||||
(Gain) loss on sale of assets |
80 | (44 | ) | 264 | ||||||||
Net gain on long-term investment |
— | — | — | |||||||||
Net loss (gain) on divestitures |
— | 15,044 | (7,782 | ) | ||||||||
Impairment of long-lived assets |
— | — | 19,435 | |||||||||
Gain on settlement of an investment interest |
(481 | ) | — | — | ||||||||
Gain on sale of short-term investment |
— | (355 | ) | (40,206 | ) | |||||||
Impairment of long-term investments |
— | 10,317 | 4,307 | |||||||||
Provision (recovery) for doubtful accounts |
489 | (810 | ) | 57 | ||||||||
Provision for deferred cost |
— | — | — | |||||||||
Deferred income taxes |
1,129 | (1,060 | ) | (13,662 | ) | |||||||
Equity in (net income) loss of affiliated companies |
26,438 | 141,748 | 102,524 | |||||||||
Other |
— | 51 | 265 | |||||||||
Changes in operating assets and liabilities, net of acquisitions: |
||||||||||||
Accounts receivable |
31,267 | 160,725 | (60,443 | ) | ||||||||
Inventories |
19,498 | 577 | 95,879 | |||||||||
Other assets |
4,935 | 5,979 | (19,383 | ) | ||||||||
Accounts payable |
(11,913 | ) | (104,882 | ) | 97,463 | |||||||
Income taxes payable |
(207 | ) | (2,652 | ) | 3,414 | |||||||
Customer advances |
(5,185 | ) | (5,170 | ) | (40,030 | ) | ||||||
Deferred revenue |
(1,082 | ) | (10,376 | ) | 5,568 | |||||||
Other current liabilities |
(19,035 | ) | (13,452 | ) | (31,188 | ) | ||||||
Net cash used in operating activities |
(11,422 | ) | (17,301 | ) | (4,089 | ) | ||||||
CASH FLOWS FROM INVESTING ACTIVITIES: |
||||||||||||
Additions to property, plant and equipment |
(37 | ) | 18 | (5,018 | ) | |||||||
Investment in affiliates |
(22,115 | ) | — | (8,360 | ) | |||||||
Net proceeds from divestitures |
3,381 | 11,508 | 214,051 | |||||||||
Change in restricted cash |
11,086 | 4,849 | (8,048 | ) | ||||||||
Purchase of short-term investment |
(10,168 | ) | — | — | ||||||||
Proceeds from sale of short-term investments |
7,886 | — | — | |||||||||
Proceeds from settlement of an investment interest |
481 | 1,039 | 42,084 | |||||||||
Other |
— | 1,488 | 64 | |||||||||
Net cash provided by investing activities |
(9,486 | ) | 18,902 | 234,773 | ||||||||
CASH FLOWS FROM FINANCING ACTIVITIES: |
||||||||||||
Issuance of common stock and option per stock purchase agreement , net of expense |
34,594 | — | — | |||||||||
Repayment of borrowings |
— | (274,600 | ) | |||||||||
Other |
(67 | ) | 234 | (4,506 | ) | |||||||
Net cash provided by (used in) financing activities |
34,527 | 234 | (279,106 | ) | ||||||||
Net increase in cash and cash equivalents |
13,619 | 1,835 | (48,422 | ) | ||||||||
Cash and cash equivalents at beginning of period |
75,606 | 73,771 | 122,193 | |||||||||
Cash and cash equivalents at end of period |
89,225 | $ | 75,606 | $ | 73,771 | |||||||
The accompanying notes are an integral part of these financial statements.
172
UTSTARCOM, INC.
NOTES TO CONDENSED FINANCIAL STATEMENTS
NOTE 1—BASIS OF PRESENTATION
UTStarcom, Inc., a Delaware corporation, is the parent company of all UTStarcom, Inc. subsidiaries. The accompanying condensed financial statements reflect the financial position, results of operations and cash flows of UTStarcom, Inc. on a separate, parent company basis. All subsidiaries of UTStarcom, Inc. are reflected as investments accounted for using the equity method. Accordingly, intercompany transactions have not been eliminated. Inventory balances at December 31, 2010 and 2009 include intercompany profit of $1.6 million and $1.3 million, respectively. There was $100 million and $150 million of cash dividends paid by its subsidiaries in China during the years ended December 31, 2008 and 2007, respectively. In February 2009, there was an additional $50 million of cash dividends paid by its subsidiaries in China. For accounting policies and other information, see the Notes to Consolidated Financial Statements included elsewhere herein.
NOTE 2—INVENTORY
A majority of the Company's inventories as of December 31, 2010 and 2009 is finished goods.
173
UTSTARCOM, INC.
VALUATION AND QUALIFYING ACCOUNTS AND RESERVES
For the Years Ended December 31, 2010, 2009, and 2008
Description
|
Balance at beginning of the period |
Charged (credited) to costs and expenses |
Charged (credited) to other accounts |
(Deductions) Adjustments |
Balance at end of the period |
|||||||||||
|---|---|---|---|---|---|---|---|---|---|---|---|---|---|---|---|---|
| |
(in thousands) |
|||||||||||||||
Year ended December 31, 2010 |
||||||||||||||||
Allowance for doubtful accounts |
$ | 26,065 | $ | 5,499 | $ | — | $ | 612 | $ | 32,176 | ||||||
Tax valuation allowance |
$ | 481,742 | $ | 20,897 | $ | (28,725 | ) | $ | — | $ | 473,914 | |||||
Year ended December 31, 2009 |
||||||||||||||||
Allowance for doubtful accounts |
$ | 37,359 | $ | (6,757 | ) | $ | — | $ | (4,537 | ) | $ | 26,065 | ||||
Tax valuation allowance |
$ | 363,676 | $ | 112,172 | $ | 5,894 | (1) | $ | — | $ | 481,742 | |||||
Year ended December 31, 2008 |
||||||||||||||||
Allowance for doubtful accounts |
$ | 45,728 | $ | (5,227 | ) | $ | — | $ | (3,142 | ) | $ | 37,359 | ||||
Tax valuation allowance |
$ | 342,961 | $ | 12,623 | $ | 8,092 | (1) | $ | — | $ | 363,676 | |||||
- (1)
- Charged (credited) against other comprehensive income
174