Attached files
| file | filename |
|---|---|
| 8-K - FORM 8-K - United Airlines Holdings, Inc. | d8k.htm |
 JP
Morgan High Yield Conference
United Continental
Holdings, Inc.
March 1, 2011
Exhibit 99.1 |
| Safe
Harbor Statement Certain
statements
included
in
this
presentation
are
forward-looking
and
thus
reflect
our
current
expectations
and
beliefs
with
respect
to
certain
current
and
future
events
and
financial
performance.
Such
forward-looking
statements
are
and
will
be
subject
to
many
risks
and
uncertainties
relating
to
our
operations
and
business
environment
that
may
cause
actual
results
to
differ
materially
from
any
future
results
expressed
or
implied
in
such
forward-looking
statements.
Words
such
as
“expects,”
“will,”
“plans,”
“anticipates,”
“indicates,”
“believes,”
“forecast,”
“guidance,”
“outlook”
and
similar
expressions
are
intended
to
identify
forward-
looking
statements.
Additionally,
forward-looking
statements
include
statements
which
do
not
relate
solely
to
historical
facts,
such
as
statements
which
identify
uncertainties
or
trends,
discuss
the
possible
future
effects
of
current
known
trends
or
uncertainties,
or
which
indicate
that
the
future
effects
of
known
trends
or
uncertainties
cannot
be
predicted,
guaranteed
or
assured.
All
forward-looking
statements
in
this
presentation
are
based
upon
information
available
to
us
on
the
date
of
this
presentation.
We
undertake
no
obligation
to
publicly
update
or
revise
any
forward-looking
statement,
whether
as
a
result
of
new
information,
future
events,
changed
circumstances
or
otherwise,
except
as
required
by
applicable
law.
Our
actual
results
could
differ
materially
from
these
forward-looking
statements
due
to
numerous
factors
including,
without
limitation,
the
following:
our
ability
to
comply
with
the
terms
of
our
various
financing
arrangements;
the
costs
and
availability
of
financing;
our
ability
to
maintain
adequate
liquidity;
our
ability
to
execute
our
operational
plans;
our
ability
to
control
our
costs,
including
realizing
benefits
from
our
resource
optimization
efforts,
cost
reduction
initiatives
and
fleet
replacement
programs;
our
ability
to
utilize
our
net
operating
losses;
our
ability
to
attract
and
retain
customers;
demand
for
transportation
in
the
markets
in
which
we
operate;
an
outbreak
of
a
disease
that
affects
travel
demand
or
travel
behavior;
demand
for
travel
and
the
impact
that
global
economic
conditions
have
on
customer
travel
patterns;
excessive
taxation
and
the
inability
to
offset
future
taxable
income;
general
economic
conditions
(including
interest
rates,
foreign
currency
exchange
rates,
investment
or
credit
market
conditions,
crude
oil
prices,
costs
of
aviation
fuel
and
energy
refining
capacity
in
relevant
markets);
our
ability
to
cost-effectively
hedge
against
increases
in
the
price
of
aviation
fuel;
any
potential
realized
or
unrealized
gains
or
losses
related
to
fuel
or
currency
hedging
programs;
the
effects
of
any
hostilities,
act
of
war
or
terrorist
attack;
the
ability
of
other
air
carriers
with
whom
we
have
alliances
or
partnerships
to
provide
the
services
contemplated
by
the
respective
arrangements
with
such
carriers;
the
costs
and
availability
of
aviation
and
other
insurance;
the
costs
associated
with
security
measures
and
practices;
industry
consolidation
or
changes
in
airline
alliances;
competitive
pressures
on
pricing
and
on
demand;
our
capacity
decisions
and
the
capacity
decisions
of
our
competitors;
U.S.
or
foreign
governmental
legislation,
regulation
and
other
actions
(including
open
skies
agreements);
labor
costs;
our
ability
to
maintain
satisfactory
labor
relations
and
the
results
of
the
collective
bargaining
agreement
process
with
our
union
groups;
any
disruptions
to
operations
due
to
any
potential
actions
by
our
labor
groups;
weather
conditions;
the
possibility
that
expected
merger
synergies
will
not
be
realized
or
will
not
be
realized
within
the
expected
time
period;
and
other
risks
and
uncertainties
set
forth
under
Item
1A.,
Risk
Factors
of
Annual
Report
on
Form
10-K,
as
well
as
other
risks
and
uncertainties
set
forth
from
time
to
time
in
the
reports
we
file
with
the
SEC.
Consequently,
forward-looking
statements
should
not
be
regarded
as
representations
or
warranties
by
us
that
such
matters
will
be
realized.
2 |
 Gerry
Laderman Senior Vice President Finance and Treasurer
United Continental Holdings, Inc. |
 4
UAL fourth quarter 2010 results
•
Earned net income of $160M or $0.44 per
diluted share
1
•
Pre-tax earnings of $172M and pre-tax
margin of 2.0%
1
•
Passenger unit revenue increased 11.5%
year-over-year vs. pro forma 4Q 2009
•
Generated $106M of operating cash flow
•
Year end unrestricted cash balance of
$8.7B
1. Excludes specials, one-time items and non-cash MTM hedge gains/losses. See
GAAP to non-GAAP reconciliation in Appendix A Source: Earnings release Form
8-K filed on 1/26/11. |
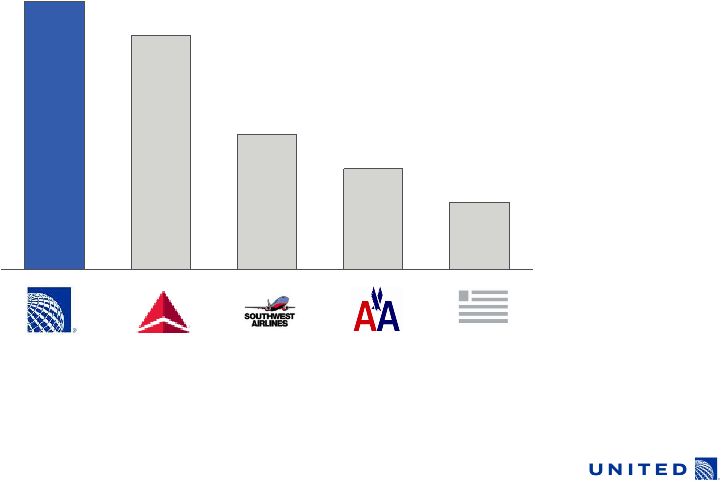
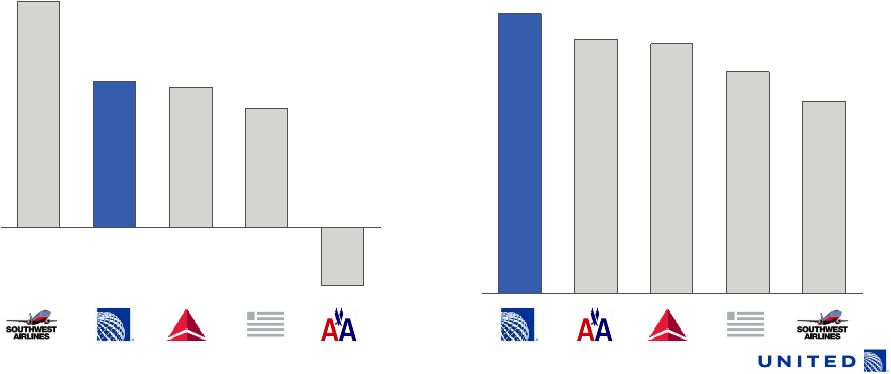 5
Top tier financial performance driven by industry leading
revenue premium
•
Well diversified global network
•
Carrier of choice for business and premium travelers
•
Award winning loyalty programs and industry leading operational performance
FY 2010 PRASM
2
FY 2010 Pre-tax Income Margin
1
-1.9%
3.9%
4.6%
4.8%
7.4%
1. Excludes specials, one-time items and non-cash MTM hedge gains/losses. See
GAAP to non-GAAP reconciliation in Appendix A 2. Consolidated PRASM numbers
for carriers other than UAL adjusted for length of haul versus UAL’s length of haul
Source: Earnings releases and SEC filings.
8.11
9.36
10.55
10.71
11.81 |
 World’s leading network with unsurpassed presence
6
#1 across the
Pacific
#2 across the
Atlantic
#2 to Latin
America
#1 in US /
Canada
Rankings by ASMs as of TME 4Q10
Source: Earnings releases and SEC filings. |
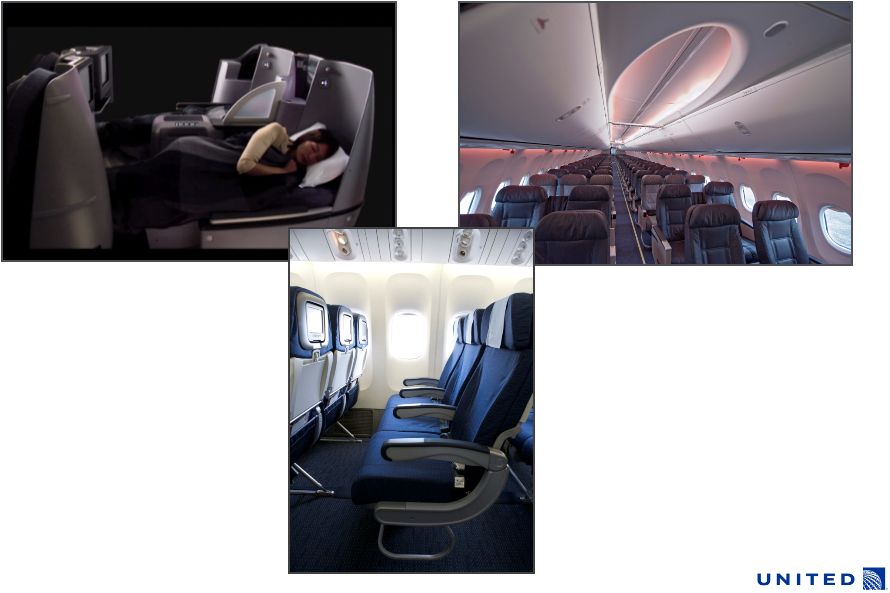 Best-in-class products, including Economy Plus seating
7
Lie-flat seats in premium cabins
Boeing Sky Interior on new B-737
Economy Plus®
seating with up to
5 inches of more legroom |
    Continue
to grow ancillary revenue streams and expect them to exceed $2B in 2011
8
Creating industry leading products
to let customers tailor their experience
Improving how and when we offer
these products to our customers
Economy Plus®
Upsell
Premium Cabin Upsell
Seating & Space
Onboard
Buy-on-Board Meals
Premium Wines
Baggage Services
1
st
& 2
nd
Checked Bags
Premium Experience
United Club Lounge Pass
Premier®
Travel
Premier Line
Award Accelerator
Flexibility
FareLock® |
       Expect to
generate net synergies of $1.0 to $1.2B 9
•
Airport efficiencies
•
Improved website content,
accessibility and penetration
•
Streamline corporate overhead
•
Co-locate airport facilities
•
Reduce IT overlap
Examples:
Expected by summer 2011:
•
Harmonized boarding and departure
management processes
•
Websites will offer and sell flights
across the new United Airlines as
one network
•
All management employees selected
•
Co-located at more than 35 stations
•
Transition to selected major IT
systems underway |
 10
We remain focused on achieving our Go Forward Plan goals
Fly to Win
•Be profitable every year, across the business cycle
Fund the future
•Maintain appropriate liquidity and use our assets to
build our future
Make reliability a reality
•Deliver clean, safe and reliable air transportation and a
competitive product
Working together
•Make the new United a great place to work
|
 United
continues to manage fleet for profitability, fuel efficiency and
flexibility 11
•
Expected 2011 deliveries: 4 Boeing 737
•
1Q: 2 Boeing 737-800
•
2Q: 1 Boeing 737-900
•
3Q: 1 Boeing 737-800
•
New 737 equipped with winglets; will
replace older less fuel efficient aircraft
•
Firm orders for 50 Boeing 787 and 25
Airbus A350 aircraft
Industry leading order book will
continue to improve fuel efficiency
Over 325 aircraft have leases expiring or
will become unencumbered by 2015 |
 12
Capacity and hedge strategies help to mitigate
risk due to rising fuel
FY 2011 capacity guidance
remains disciplined
Approximately 40% of expected
2011 fuel needs hedged
2Q11
1Q11
17%
4Q11
3Q11
34%
50%
63%
Consolidated
1.0% -
2.0%
International
4.5% -
5.5%
Domestic
(0.5)% -
(1.5%)
Guidance Range
Source: 1/26/11 UAL Form 8-K Investor Update. |
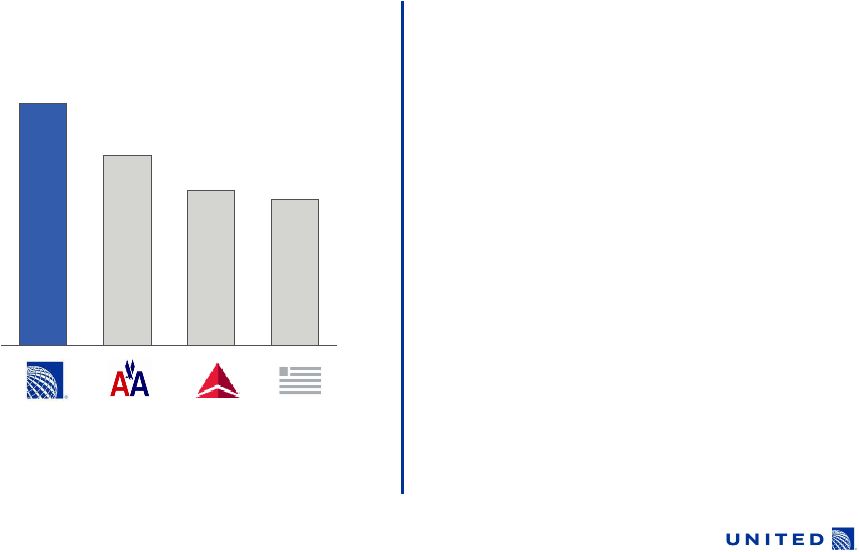
 13
United generated more than $3.2B of operating
cash flow during 2010
FY 2010 Operating Cash Flow ($B)
1.
Revenue defined as 2010 FY consolidated revenue.
Source: Carrier Form 10-Ks.
OCF % of Revenue
1
9.4%
8.7% 12.9% 5.6%
6.8%
0.8
1.2
1.6
2.8
3.2 |
 14
United has strong liquidity position and announced
plans to prepay debt
2010 Year End Liquidity
1
(Percent of 2010 Revenue)
1.
Liquidity is calculated based on 4Q10 ending unrestricted cash balance and 2010 FY
consolidated revenue. 2.
Source: Carrier Earnings Release 8Ks
•
Prepaid $150M of debt in January 2011
•
Has $2.5B of scheduled debt payments
in 2011
•
Even at current elevated fuel price,
United has sufficient liquidity for
integration
16.1%
16.4%
20.3%
25.5%
Year End
Liquidity
Balance
$8.7B
$4.5B $5.2B $1.9B |
 15
In 2011 United will work to:
Achieve sustained, sufficient profitability
through the business cycle
Capture synergies
through network optimization and cost savings
Maintain focus on operating a clean, reliable and safe
airline
Continue to systematically hedge to reduce fuel volatility exposure
Manage cash balance
to mitigate economic environment and integration risk |
 16
Appendix A
GAAP to non-GAAP reconciliation
Three Months Ended
Twelve Months Ended
12/31/2010
12/31/2010
PRE-TAX MARGIN ($M)
Earnings/(Loss) before income taxes and after equity in earnings of affiliates
($324)
$854
Add: impairments, special items and other charges and non-cash, net mark-
to-market gains/losses
$496
$777
Adjusted Pre-Tax Income/(Loss)
$172
$1,631
Revenue
$8,433
$34,013
Adjusted Pre-Tax Margin
2.0%
4.8%
Three Months Ended
12/31/2010
NET INCOME/(LOSS) - GAAP ($M)
Earnings/(Loss) after income taxes and equity in earnings of affiliates
($325)
Add: impairments, special items and other charges and non-cash, net mark-
to-market gains/losses
$485
Adjusted Net Income/(Loss)
$160 |