Attached files
Table of Contents
UNITED STATES
SECURITIES AND EXCHANGE COMMISSION
Washington, D.C. 20549
FORM 10-K
| x | ANNUAL REPORT PURSUANT TO SECTION 13 OR 15(d) OF THE SECURITIES EXCHANGE ACT OF 1934 |
For the fiscal year ended December 31, 2010
OR
| ¨ | TRANSITION REPORT PURSUANT TO SECTION 13 OR 15(d) OF THE SECURITIES EXCHANGE ACT OF 1934 |
For the transition period from to
Commission file number 1-33119
ALLIED NEVADA GOLD CORP.
(Exact name of Registrant as specified in its charter)
| Delaware | 20-5597115 | |
| (State or other jurisdiction of incorporation or organization) |
(I.R.S. Employer Identification No.) |
9790 Gateway Drive, Suite 200, Reno Nevada 89521
(775) 358-4455
(Address and telephone number of principal executive offices)
Securities registered pursuant to Section 12(b) of the Act:
| Title of Class |
Name of Each Exchange on Which Registered | |
| Common Stock, $0.001 Par Value | NYSE Amex LLC |
Securities registered pursuant to Section 12(g) of the Act: None
Indicate by check mark if the registrant is a well-known seasoned issuer, as defined in Rule 405 of the Securities Act. Yes x No ¨
Indicate by check mark if the registrant is not required to file reports pursuant to Section 13 or Section 15(d) of the Act. Yes ¨ No x
Indicate by check mark whether the registrant (1) has filed all reports required to be filed by Section 13 or 15(d) of the Securities Exchange Act of 1934 during the preceding 12 months (or for such shorter period that the registrant was required to file such reports), and (2) has been subject to such filing requirements for the past 90 days. Yes x No ¨
Indicate by check mark whether the registrant has submitted electronically and posted on its corporate Web site, if any, every Interactive Data File required to be submitted and posted pursuant to Rule 405 of Regulation S-T (§232.405 of this chapter) during the preceding 12 months (or for such shorter period that the registrant was required to submit and post such files): Yes ¨ No ¨
Indicate by check mark if disclosure of delinquent filers pursuant to Item 405 of Regulation S-K is not contained herein, and will not be contained, to the best of registrant’s knowledge, in definitive proxy or information statements incorporated by reference in Part III of the Form 10-K or any amendment to this Form 10-K. ¨
Indicate by check mark whether the registrant is a large accelerated filer, an accelerated filer, or a non-accelerated filer. See definition of “accelerated filer and large accelerated filer” in Rule 12b-2 of the Exchange Act.
| Large Accelerate Filer | x | Accelerated Filer | ¨ | |||
| Non-accelerated Filer | ¨ | Smaller Reporting Company | ¨ | |||
Indicate by check mark whether the registrant is a shell company (as defined in Rule 12b-2 of the Exchange Act). Yes ¨ No x
The aggregate market value of voting Common Stock held by non-affiliates as of June 30, 2010, the last business day of the registrant’s most recently completed second fiscal quarter, was $1,590,767,856 based on the last reported sale price of the Common Stock on the NYSE Amex LLC on that date.
Number of shares outstanding of the registrant’s Common Stock as of February 22, 2011: 88,999,553
Documents Incorporated by Reference:
To the extent specifically referenced in Part III, portions of the registrant’s definitive Proxy Statement on Schedule 14A for the 2011 Annual Meeting of Stockholders are hereby incorporated by reference into this report. See Part III.
Table of Contents
Table of Contents
Note Regarding Forward-Looking Statements
In addition to historical information, this Form 10-K contains forward-looking statements within the meaning of Section 27A of the Securities Act of 1933, as amended, Section 21E of the Securities Exchange Act of 1934, as amended, and the Private Securities Litigation Reform Act of 1995. All statements, other than statements of historical fact, included herein or incorporated by reference, that address activities, events or developments that we expect or anticipate will or may occur in the future, are forward-looking statements, including but not limited to such things as:
| • | our future business strategy, plans and goals; |
| • | our estimated capital expenditures; |
| • | our expansion expectations, including with respect to the Hycroft mine and Hasbrouck property; |
| • | our expectations regarding the growth of our business, our estimates of reserves and other mineralized material; |
| • | the economic potential of the sulfide mineralization and milling project at the Hycroft property; |
| • | the preliminary economic assessment at the Hasbrouck property; |
| • | the anticipated results of the exploration drilling programs at our properties; |
| • | future gold and silver prices; |
| • | our production estimates; |
| • | our expectations regarding gold and silver recovery; |
| • | our estimated future sales and cost of sales; |
| • | the availability of outside contractors; |
| • | our anticipated cash flows and cash operating costs; and |
| • | the availability of additional capital. |
These statements can be found under Part I—Item 1. Business, Part I—Item 1A. Risk Factors, Part I—Item 2. Properties, Part I—Item 7. Management’s Discussion and Analysis of Financial Condition and Results of Operations and elsewhere throughout this Annual Report on Form 10-K. The words “estimate”, “plan”, “anticipate”, “expect”, “intend”, “believe”, “target”, “budget”, “may”, “schedule” and similar words or expressions identify forward-looking statements. These statements involve known and unknown risks, uncertainties, assumptions and other factors which may cause our actual results, performance or achievements to be materially different from any results, performance or achievements expressed or implied by such forward-looking statements. Forward-looking statements are based on current expectations. Important factors that could cause actual results to differ materially from those in the forward-looking statements include, but are not limited to:
| • | volatile market prices of gold and silver; |
| • | risks related to the heap leaching process at the Hycroft Mine, including but not limited to gold recovery rates, gold extraction rates, and the grades of ore placed on our leach pads; |
| • | uncertainties concerning estimates of mineral reserves, mineral resources and grading; |
| • | cost of compliance with current and future government regulations, including those related to environmental protection, mining, health and safety, corporate governance and public disclosure; |
| • | uncertainties relating to obtaining or retaining approvals and permits from governmental regulatory authorities; |
| • | our ability to achieve our estimated production rates and stay within our estimated operating costs; |
| • | the commercial success of our exploration and development activities; |
| • | an increase in the cost or timing of new projects; |
| • | our current intention not to use forward sale arrangements; |
| • | the inherently hazardous nature of mining activities, including operational, geotechnical and environmental risks; |
| • | our ability to raise additional capital on favorable terms or at all; |
| • | intense competition within the mining industry; |
| • | uncertainties related to our ability to find and acquire new mineral properties; |
| • | potential operational and financial effects of current and proposed federal and state regulations related to environmental protection and mining, and the exposure to potential liability created by such regulations; |
| • | availability of equipment or supplies; |
i
Table of Contents
| • | our ability to attract and retain personnel; |
| • | our ability to manage our growth; |
| • | potential challenges to title in our mineral properties; |
| • | risks associated with the expansion of our operations, including those associated with any future acquisitions or joint ventures; |
| • | risks that our principal stockholders will be able to exert significant influence over matters submitted to stockholders for approval; |
| • | potential conflicts of interests that may arise though some of our directors’ involvement with other natural resources companies; |
| • | the market price and future sales of our common stock; and |
| • | our decision not to pay dividends. |
For a more detailed discussion of such risks and other important factors that could cause actual results to differ materially from those in such forward-looking statements, please see the risk factors discussed in Part I—Item 1A. Risk Factors of this Form 10-K and in other filings with the SEC. Although we have attempted to identify important factors that could cause actual results to differ materially from those described in forward-looking statements, there may be other factors that cause results not to be as anticipated, estimated or intended. There can be no assurance that our forward-looking statements will prove to be accurate, as actual results and future events could differ materially from those anticipated in the statements. We assume no obligation to publicly update any forward-looking statements, whether as a result of new information, future events or otherwise.
Cautionary Note Regarding Mineralized Material
Allied Nevada has reported reserve and mineralized material estimates in accordance with SEC Industry Guide 7. In accordance with SEC Industry Guide 7, resources have been reported as “mineralized material”. Canadian investors are cautioned that estimates of mineralized materials may differ from mineral resource estimates prepared in accordance with the standards of the Canadian Institute of Mining, Metallurgy and Petroleum referred to in Canadian National Instrument 43-101 (NI 43-101). Canadian investors should review the mineral resource estimates prepared in accordance with NI 43-101 contained in the mineral proven and probable ore reserves table.
ii
Table of Contents
| Item 1. | Business |
Allied Nevada Gold Corp. is a mining and exploration company which produces gold as a primary product and silver as a by-product. Allied Nevada currently operates its wholly-owned Hycroft Mine, located west of Winnemucca, Nevada. The Hycroft mine hosts a current Proven and Probable mineral reserve of 2.6 million ounces of gold and 49.3 million ounces of silver. The property resides on an aggregate land position of approximately 96 square miles. The mine reopened in 2007, and in 2010, the Company began an accelerated mining plan for its oxide heap leach operation involving the purchase of a larger capacity mining fleet, essentially tripling the 2009 mining rate over a three-year period. The expansion is in progress and will increase expected annual production from 130,000 ounces of gold in 2011 to over 260,000 ounces of gold in 2012. With the accelerated mining rate taken into account, the reserve is sufficient to support a 6 year mine life. The Company has completed a scoping study that includes a milling option for processing sulfide ore and higher grade oxide ores. The Company plans to issue an initial feasibility study in 2011 for this milling option. The Company intends to continue exploration programs with a goal of extending the mine life at Hycroft and identifying potential development opportunities at outside exploration properties.
Allied Nevada’s corporate headquarters is located at 9790 Gateway Drive, Suite 200, Reno, Nevada 89521. In this report, “Allied Nevada”, the “Company”, “our” and “we” refer to Allied Nevada Gold Corp. and its subsidiaries.
Formation of Allied Nevada
Allied Nevada Gold Corp. was incorporated under the laws of Delaware on September 14, 2006 and until May 10, 2007 we were a wholly-owned subsidiary of Vista Gold Corp. (“Vista”), a corporation incorporated under the laws of the Yukon Territory, Canada.
We commenced operations on May 10, 2007, following Vista’s transfer to us of its Nevada-based mining properties and related assets, along with cash, and the transfer to us by Carl Pescio and Janet Pescio (the “Pescios”) of their interests in certain Nevada mining properties and related assets. In this document, we sometimes use the term “Vista Nevada Assets” to refer to, Vista’s Nevada-based mining properties and related assets that were transferred to us pursuant to the Arrangement Agreement that we entered into with Vista and the Pescios on September 22, 2006, as amended. Before the Arrangement Agreement transactions were completed, we had no properties or property interests, were not yet conducting business operations and had no shareholders other than Vista. The shares of Allied Nevada common stock began trading on May 10, 2007, on the NYSE Amex, and the Toronto Stock Exchange (“TSX”).
In July 2007, Allied Nevada completed a private placement for gross proceeds of CDN$17,000,000. We issued 3,696,000 units consisting of one common share and common share purchase warrant. The proceeds of the private placement were for the exploration and development of the Hycroft Mine and for general corporate purposes.
In September 2007, the Board of Directors approved the re-opening of the Hycroft Mine (“Hycroft Development Program”). The Hycroft Development Program involved re-opening the Hycroft Mine and heap leach facilities which had been placed on a care and maintenance program due to low gold prices since 1998.
In April 2008, we completed a financing and issued 14,375,000 common shares for gross proceeds of CDN$75,468,750. Proceeds from the financing were to fund the reactivation of the Hycroft Mine and to continue oxide and sulfide exploration activities at Hycroft.
In August 2009, we completed a cross-border financing and issued 11,150,000 common shares for gross proceeds of CDN$100,350,000. Proceeds from the financing were to fund an expanded oxide and sulfide exploration program at Hycroft and general corporate purposes.
In June, 2010, we completed a cross-border financing and issued 13,500,000 common shares for aggregate proceeds of CDN$283,500,000. Proceeds from the financing were to satisfy initial capital needs for the accelerated oxide expansion, to fund exploration programs and to complete an initial milling feasibility study related to the development of the sulfide resource.
Segment Information
Our operating segments are the Hycroft Mine, Exploration Properties, and other. The Hycroft Mine operating segment contains the exploration and operational activities at our wholly-owned Hycroft Mine located in Nevada. The Exploration Properties segment contains the exploration and development activities on the Company’s Advanced Exploration Properties and Other Exploration Properties. The other operating segment primarily contains the corporate overhead functions of the Company. Please see Note 19 to our Consolidated Financial Statements for information related to our business segments.
General Description of the Business of Allied Nevada
Allied Nevada owns the Hycroft Mine, Hasbrouck, Mountain View, Three Hills and Wildcat projects, the Maverick Springs project (a 45% joint venture with Silver Standard Resources Inc. (“Silver Standard”)), the Pony Creek/Elliot Dome project, and the
1
Table of Contents
exploration rights to approximately 100 Other Exploration Properties. For more information related to each of these properties, see “Part I—Item 2. Properties”. All of these properties are located in the state of Nevada.
Allied Nevada operates the wholly-owned Hycroft Mine, which is located 54 miles west of Winnemucca, Nevada. The Hycroft Mine is an open pit, run-of-mine and crushed ore heap leach gold mine that also produces silver as a byproduct of the gold recovery process. We intend to mine all currently identified ore reserves by open pit methods with a typical drill, blast, load, and haul cycle from six pits; the Brimstone, Bay, Central, Cut-5, Camel and Boneyard pits. Currently, the majority of the ore-grade material placed on the leach pad is run-of-mine with a small percentage being crushed. Ore is selectively crushed based on ore type and grade. The pregnant solution is processed using a Merrill-Crowe zinc-precipitation process (“Merrill-Crowe process”) and a Carbon-in-Column leach solution recovery process (“CIC process”).
In addition to operating the Hycroft Mine, Allied Nevada is engaged in the evaluation, acquisition, exploration and advancement of gold exploration and development projects in the State of Nevada. We expect to continue our focus on gold project acquisition and development in the future.
Principal Products
Allied Nevada sold 102,483 ounces of gold and 238,242 ounces of silver during 2010. We generally sell our gold at the prevailing market price during the month in which the gold is delivered to the customer. We recognize revenue from a sale when the price is determinable, the gold has been delivered, the title has been transferred to the customer and collection of the sales price is reasonably assured.
Most of our revenue arises from the sale of refined gold in the international market. The end product at our gold operations, however, is generally doré bars. Doré is an alloy consisting of gold, silver and other metals. Doré is sent to refiners to produce bullion that meets the required market standard of 99.95% pure gold. Under the terms of our refining agreements, the doré bars are refined for a fee, and our share of the refined gold and the separately-recovered silver are credited to our account or delivered to our buyers.
During 2010, our gold revenues were more than 26 times our silver revenues. As such, we consider gold to be a principal product and silver to be a byproduct of the gold recovery process.
Gold Uses. Gold has two main categories of use: fabrication and investment. Fabricated gold has a variety of end uses, including jewelry, electronics, dentistry, industrial and decorative uses, medals, medallions and official coins. Gold investors buy gold bullion, official coins and jewelry.
Gold Supply. The supply of gold consists of a combination of current production from mining and the draw-down of existing stocks of gold held by governments, financial institutions, industrial organizations and private individuals. Based on public information total world gold supply increased only 2% for 2010. For the years 2007 through 2009, global mine production has, on average, accounted for approximately 60% of the annual supply of gold. Increased mine supply and recycling along with reduced producer de-hedging accounted for a sizable increase year over year. These gains were partially offset by net official sector sales, which decreased to 49 tons in 2009 compared with the average annual sales over the last five years ending 2008 of 489 tons. According to the World Gold Council, gold demand in 2010 reached a 10 year high, up 9% year-over-year, and marginally above the previous peak of 2008 despite a 40% increase in the annual average price level between 2008 and 2010. Annual demand for gold jewelry rose 17%, investment demand, comprising bar and coin demand, ETFs and similar products, remained stable in 2010, down just 2% from 2009 and demand for gold used in technology was 12.4% higher than in 2009. India was the strongest growth market in 2010 with total annual consumer demand registering growth of 66% relative to 2009, which was largely driven by the jewelry sector. China was the strongest market for investment demand growth with demand for small bars and coins increasing 70% compared with 2009.
Gold Prices. The price of gold is volatile and is affected by many factors beyond our control, such as the sale or purchase of gold by central banks and financial institutions, inflation or deflation, fluctuation in the value of the US dollar and foreign currencies, global and regional demand and the political and economic conditions of major gold producing countries throughout the world. The following table presents the annual high, low and average afternoon fixing prices for gold over the past ten years, expressed in US dollars per ounce, on the London Bullion Market.
| Gold Price (USD) per Ounce on the London Bullion Market |
||||||||||||
| Year |
High | Low | Average | |||||||||
| 2001 |
293 | 256 | 271 | |||||||||
| 2002 |
349 | 278 | 310 | |||||||||
| 2003 |
416 | 320 | 363 | |||||||||
| 2004 |
454 | 375 | 410 | |||||||||
| 2005 |
536 | 411 | 444 | |||||||||
| 2006 |
725 | 525 | 604 | |||||||||
| 2007 |
841 | 608 | 695 | |||||||||
| 2008 |
1,011 | 713 | 872 | |||||||||
| 2009 |
1,213 | 810 | 972 | |||||||||
| 2010 |
1,421 | 1,058 | 1,225 | |||||||||
Source: London Metal Exchange
2
Table of Contents
On February 22, 2011, the afternoon fixing price for gold on the London Bullion Market was $1,401 per ounce.
Business Strategy
Our business plan was developed with the overriding goal of maximizing shareholder value through the operation of the Hycroft Mine, the exploration and development of our mineral properties, and through strategic partnerships. To achieve this goal, our business plan focuses on three strategic areas:
| • | Hycroft Mine |
| • | Mine Operations |
| • | Hycroft Expansion Projects |
| • | Hycroft Exploration Drilling Program |
| • | Advanced Exploration Properties |
| • | Mergers and Acquisitions |
Hycroft Mine
Mine Operations
The Hycroft Mine is located 54 miles west of Winnemucca, Nevada along the border of Humboldt and Pershing Counties, and covers approximately 61,389 acres of mineral rights. The mine can be accessed by various routes year-round. However, primary access is by an all-weather, maintained gravel road from the town of Winnemucca.
Our operating objective at the Hycroft Mine is to mine the deposit in a profitable, safe, and environmentally friendly manner. To attain this goal, we have focused on recruiting and retaining experienced executives, managers, and employees. Our team has extensive experience in managing and operating mines utilizing the specific mining and processing methods used by the Company. We believe this team has identified the appropriate technologies and developed the appropriate production management, health and safety programs and environmental management, monitoring, and protection programs.
2010 Operations
In 2010, Hycroft successfully completed its second full year of operations, achieving its stated operating goals. The mine moved 26.5 million tons of material, including 9.9 million tons of ore placed on the leach pad at average grades of 0.020 opt gold and 0.246 opt silver, placing 194,100 contained ounces of gold (109,900 ounces of recoverable gold) and 2,436,600 contained ounces of silver (243,700 ounces of recoverable silver).
The mine completed a 3.5 million square foot expansion of its Brimstone leach pad in 2010, increased the flow rate through the Merrill-Crowe plant from 2,500 to 3,500 gallons per minute (“gpm”) and began work on the construction of a new truck shop capable of handling larger capacity mining equipment. The improvements were all in connection with the ramping up of the accelerated oxide mine plan, announced in early 2010.
Hycroft Expansion Projects
Accelerated Oxide Heap Leach Plan
The Company began implementing an accelerated oxide mine plan in mid-2010 with a goal of tripling the mining rate utilizing a larger capacity mining fleet. By the end of 2010, one hydraulic shovel and three of the 320-ton trucks were in operation.
The accelerated oxide mine plan that we began implementing in 2010, is being phased in over the next two years, with gold production being expected to increase from approximately 100,000 ounces in 2010 to over 260,000 ounces of gold in 2012 and an expectation that it will peak at over 300,000 ounces in each of 2013 and 2014.
Mill Project Scoping Study
The Company completed a milling scoping study in April 2010, designed to extract the large sulfide resource and additional oxide resources associated with the sulfides. This study was subsequently updated in September of 2010 (“2010 scoping study”). The 2010 scoping study envisions an 174,000 ore ton per day (“tpd”) milling and heap leach operation. This updated scoping study concludes that average annual production of approximately 610,000 ounces of gold and 27 million ounces of silver could be produced from the combined 100,000 tpd milling operation and 74,000 tpd heap leach operation. The estimated capital cost was expected to be $1.1 billion for the milling and flotation process facility, additional leach pads, mining equipment and other ancillary infrastructure. The milling facility would be comprised of one or two lines, with each consisting of a primary crusher, semi-autogenous grinding mill, two ball mills and a flotation circuit and could be implemented in stages in order to manage capital expenditures over the first few years of the project.
3
Table of Contents
The Company expects to complete an update to the 2010 scoping study in March 2011. Based on the favorable result of the milling scoping study and the subsequent updates, the Company is preparing an initial feasibility study, currently expected to be released in the third quarter of 2011. For detailed information regarding the scoping study see “Part I—Item 2. Properties—Operating Properties—Hycroft Mine—Mill Project Scoping Study”.
Hycroft Exploration Drilling Program
In 2010, Allied Nevada successfully completed its drill campaign with primary goals of improving the confidence level of other mineralized material and providing data for engineering and metallurgical studies in support of the initial milling feasibility study that the Company expects to issue in the third quarter of 2011. In the first quarter of 2011, drilling is expected to utilize a fleet of seven to ten drill rigs. For the remainder of the year, we expect to reduce the drill fleet to two or three rigs which will be directed toward step-out drilling and testing geophysical anomalies around the Hycroft property with a goal of expanding the resource base.
In 2010, the Company continued to define sulfide gold and silver mineralization as part of the Hycroft exploration drilling program. The drilling was also used to collect samples for ongoing metallurgical work and pit slope analyses in preparation of an initial feasibility study for a milling scenario. Results of this exploration campaign are expected to be released in the first quarter of 2011 as part of the Company’s annual reserve reporting.
Any expansion of the Hycroft Mine necessary to exploit any additional reserves that may be established through our Hycroft exploration drilling program that are not located within our current mine plan will require us to obtain all permits, approvals and consents of regulatory agencies responsible for the use and development of mines in Nevada.
For further discussions concerning these programs, see “Part I—Item 2. Properties—Operating Properties—Hycroft Mine—Hycroft Mine Exploration”.
Advanced Exploration Properties
Our Advanced Exploration Properties portfolio consists of six advanced properties, being Hasbrouck, Mountain View, Maverick Springs (a 45% joint venture interest with Silver Standard), Three Hills, Wildcat, and Pony Creek/ Elliot Dome.
The Company commenced drilling activities on Hasbrouck in 2010 with the goal of developing the property. The Company intends to publish an updated resource estimate and preliminary economic assessment in 2011 for Hasbrouck. Exploration drilling will continue through the first half of 2011 with a goal of delineating and expanding the mineralization. The resource model and economic analyses will then be updated during the second half of the year.
The Company is developing exploration programs at other Advanced Exploration Properties for 2011 with the goal of confirming or establishing mineralization at these properties.
For further discussions concerning our exploration properties, please see information concerning each property under “Part I—Item 2. Properties”.
Other Exploration Properties
The Company has approximately 100 Other Exploration Properties in the state of Nevada. The Company intends to pursue strategic options for these exploration properties that could include development through exploration programs, joint ventures, royalty agreements, or the sale or release of the property.
Mergers and Acquisitions
We routinely review merger and acquisition opportunities. Our primary focus will be on those opportunities involving precious metal production or near-term production with a secondary focus on other resource-based opportunities. Potential acquisition targets would include private and public companies or individual properties. Although our preference would be for acquisition candidates located in the United States, Allied Nevada will consider opportunities located in other countries where the geopolitical risk is acceptably low.
Financial Information Included in This Document
This Annual Report on Form 10-K includes financial and other information for the years ended December 31, 2006-2010. Prior to May 10, 2007, we were still a wholly-owned subsidiary of Vista. Consistent with our past filings, the financial statements, related discussion and analysis and other financial information in this document were prepared as it relates to the subsidiaries of Vista that held Nevada-based mining properties and related assets that were transferred to Allied Nevada as part of the Arrangement Agreement. In our filings prior to the completion of the Arrangement Agreement, we referred to these subsidiaries as “Vista Gold Corp.—Nevada exploration properties” or “Vista Nevada”. Our financial statements do not include any historical financial information on the property interests acquired by Allied Nevada from the Pescios. Accordingly, the financial statements for periods prior to the completion of the Arrangement Agreement as presented in this Annual Report on Form 10-K are those of Vista Nevada, as so termed, and are not indicative of results of operations of Allied Nevada as it is now constituted.
For further information concerning financial information included in this document, please see “Part II—Item 7. Management’s Discussion and Analysis of Financial Condition and Results of Operations” and Notes to Consolidated Financial Statements—Note 1.
4
Table of Contents
Employees
Allied Nevada currently has 231 employees, of which 207 are employed at the Hycroft Mine. To the extent necessary, Allied Nevada uses consultants with specific skills to assist with various aspects of its project evaluation drill program management, expansion and feasibility studies, due diligence, acquisition initiatives, corporate governance and property management.
Competition
Allied Nevada competes with other mining companies in connection with the acquisition of gold properties. There is competition for the limited number of gold acquisition opportunities, some of which is with companies having substantially greater financial resources than Allied Nevada. As a result, Allied Nevada may have difficulty acquiring attractive gold projects at reasonable prices.
Allied Nevada also competes with other mining companies for skilled employees and from time-to-time certain production inputs have been in short supply. Shortages of production supplies rarely lead to serious issues for the operation, but would require us to either substitute with lower quality supplies or to ship these supplies from longer distances. These substitutions and changes would therefore result in minor production inefficiencies or additional costs. We have not experienced any material shortages in production inputs of this nature.
Management of Allied Nevada believes that no single company has sufficient market power to affect the price or supply of gold in the world market.
Allied Nevada does not have any major customers for its gold production that would adversely affect the Company should such customers fail.
Please see “Part I—Item 1A. Risk Factors—Risks Relating to Our Company—We face intense competition in the mining industry”, for additional discussion related to our current and potential competition.
Available Information
Allied Nevada maintains an internet web site at www.alliednevada.com. Allied Nevada makes available, free of charge, through the Investor Information section of the web site, its Annual Reports on Form 10-K, Quarterly Reports on Form 10-Q, current reports on Form 8-K filed or furnished pursuant to Section 13(a) of 15(c) of the Exchange Act, and all amendments to those reports, as soon as reasonably practical after such material is electronically filed with the Securities and Exchange Commission. Allied Nevada’s Corporate Governance Guidelines, the charters of key committees of its Board of Directors and its Code of Business Ethics and Conduct are also available on the web site.
Government Regulation of Mining-Related Activities
Property Interests and Mining Claims
Our exploration activities are conducted in the state of Nevada. Mineral interests may be owned in Nevada by (a) the United States, (b) the state itself, or (c) private parties. Where prospective mineral properties are owned by private parties, or by the state, some type of property acquisition agreement is necessary in order for Allied Nevada to explore or develop such property. Generally, these agreements take the form of long-term mineral leases under which we acquire the right to explore and develop the property in exchange for periodic cash payments during the exploration and development phase and a royalty, usually expressed as a percentage of gross production or net profits derived from the leased properties if and when mines on the properties are brought into production. Other forms of acquisition agreements are exploration agreements coupled with options to purchase and joint venture agreements. Where prospective mineral properties are held by the United States, mineral rights may be acquired through the location of unpatented mineral claims upon unappropriated federal land. If the statutory requirements for the location of a mining claim are met, the locator obtains a valid possessory right, subject to the paramount title of the United States, to develop and produce minerals from the claim conditioned upon applicable environmental reviews and permitting programs. Federal unpatented mining claims must be maintained through filing notices of intent to maintain the claims with the county and the completion of annual assessment work or, since 1993, payment of federal maintenance fees. The right can be transferred as prescribed under law and, provided that the locator is able to prove the discovery of valuable, locatable minerals on the claims and to meet all other applicable federal and state requirements and procedures pertaining to the location and maintenance of federal unpatented mining claims, the claim locator would have the right to prosecute a patent application to secure fee title to the claim from the federal government. The right to pursue a patent, however, has been subject to a moratorium since October 1993, through federal legislation restricting the U.S. Bureau of Land Management (BLM) from accepting any new mineral patent applications. Additionally, proposed federal legislation has been introduced to amend the federal mining law pursuant to which, if adopted, would, among other changes, remove the right to obtain a patent and replace the claim location process with a leasing program.
Mining claims are subject to the same risk of defective title that is common to all real property interests. Additionally, mining claims are self-initiated and self-maintained and therefore, possess some unique vulnerabilities not associated with other types of property interests. It is impossible to ascertain the validity of unpatented mining claims solely from an examination of the public real estate records and, therefore, it can be difficult or impossible to confirm that all of the requisite steps have been followed for location and maintenance of a claim. If the validity of a patented mining claim is challenged by the BLM or the U.S. Forest Service on the grounds that mineralization has not been demonstrated, the claimant has the burden of proving the present economic feasibility of mining minerals located thereon. Such a challenge might be raised when a patent application is submitted, when the government seeks to include the land in an area to be dedicated to another use, or when a party files a permit application or plan of operation to develop the mining claims.
5
Table of Contents
Reclamation
We are required to mitigate long-term environmental impacts by stabilizing, contouring, resloping and revegetating various portions of a site after mining and mineral processing operations are completed. These reclamation efforts will be conducted in accordance with detailed plans, which must be reviewed and approved by the appropriate regulatory agencies.
Allied Nevada’s principal reclamation liability is at the Hycroft Mine. At December 31, 2010, we have posted reclamation bonds totaling $16.6 million. These reclamation bonds are supported by an insurance-backed financial assurance program and a surety bond. Please see Note 7-Restricted Cash to our consolidated financial statements for more information.
In January, 2010, the reclamation surety for the Hycroft mine was increased to a total of $16.6 million. This increase covers the reclamation liability associated with the increased exploration activities, Brimstone and Central pit expansions, and a consolidation and expansion of the numerous waste rock facilities into larger, well-defined areas.
Government Regulation
Mining operations and exploration activities are subject to various federal, state and local laws and regulations in the United States, which govern prospecting, development, mining, production, exports, taxes, labor standards, occupational health, waste disposal, protection of the environment, mine safety, hazardous substances and other matters. We have obtained or have pending applications for those licenses, permits or other authorizations currently required to conduct our exploration and other programs. We believe that Allied Nevada is in compliance in all material respects with applicable mining, health, safety and environmental statutes and the regulations passed thereunder in Nevada and the United States and in any other jurisdiction in which we will operate. We are not aware of any current orders or directions relating to Allied Nevada with respect to the foregoing laws and regulations.
Environmental Regulation
Our gold projects are subject to various federal and state laws and regulations governing protection of the environment. These laws are continually changing and, in general, are becoming more restrictive. It is our policy to conduct business in a way that safeguards public health and the environment. We believe that Allied Nevada’s operations are and will be conducted in material compliance with applicable laws and regulations.
Changes to current state or federal laws and regulations in Nevada, where we operate currently, or in jurisdictions where we may operate in the future, could require additional capital expenditures and increased operating and/or reclamation costs. Although we are unable to predict what additional legislation, if any, might be proposed or enacted, additional regulatory requirements could impact the economics of our projects.
During 2008, 2009, and 2010, there were no material environmental incidents or non-compliance with any applicable environmental regulations on the properties now held by Allied Nevada. Allied Nevada did not incur material capital expenditures for environmental control facilities during 2008, 2009, or 2010 and does not expect to incur any such expenditures in 2011.
Mine Safety and Health Administration Regulations
Allied Nevada considers health, safety and environmental stewardship to be a core value for the Company and received a “Sentinels of Safety” award for 2008 in 2009. Allied Nevada has a mandatory mine safety and health program including employee training, risk management, workplace inspection, emergency response, accident investigation and program auditing. The Company considers this program to be essential at all levels to ensure that employees and the Company conduct themselves in an environment of exemplary health, safety and environmental governance.
Our operations and exploration properties are subject to regulation by the Federal Mine Safety and Health Administration (“MSHA”) under the Federal Mine Safety and Health Act of 1977 (the “Mine Act”). MSHA inspects our mines on a regular basis and issues various citations and orders when it believes a violation has occurred under the Mine Act. Following passage of The Mine Improvement and New Emergency Response Act of 2006, MSHA significantly increased the numbers of citations and orders charged against mining operations. The dollar penalties assessed for citations issued has also generally increased in recent years.
In accordance with the Dodd-Frank Wall Street Reform and Consumer Protection Act (the “Act”) made law in July 2010, which requires certain disclosures by companies required to file periodic reports under the Securities Exchange Act of 1934, as amended, the Company has provided disclosure as required by the Act in Part I—Item 4B. A list of the citations/orders and proposed assessments for Hycroft for the year ended December 31, 2010 were taken from the MSHA data retrieval system, which can be found at http://www.msha.gov/drs/drshome.htm.
| Item 1A. | Risk Factors |
An investment in our common stock involves a high degree of risk. You should carefully consider the risks described below and the other information contained in this Form 10-K before deciding to invest or to continue holding your investment in our common stock. The risks described below are not the only ones facing us or otherwise associated with an investment in our common stock. Additional risks not presently known to us or which we currently consider immaterial may also adversely affect our business. We have attempted to identify the major factors that could cause differences between actual and planned or expected results, and we have
6
Table of Contents
included these material risk factors. If any of the following risks actually happen, our business, financial condition and operating results could be materially adversely affected. In this case, the trading price of our common stock could decline, and you could lose part or all of your investment. See “Note Regarding Forward-Looking Statements” above.
The market prices of gold and silver are volatile. Low gold and silver prices could result in decreased revenues, decreased net income or losses and decreased cash flows, and may negatively affect our business.
Gold and silver are commodities. Their prices fluctuate and are affected by many factors beyond our control, including interest rates, expectations regarding inflation, speculation, currency values, central bank activities, governmental decisions regarding the disposal of precious metals stockpiles, global and regional demand and production, political and economic conditions and other factors. The prices of gold and silver on the London Bullion Market on December 31, 2010 were $1,410.25 per ounce for gold and $30.65 per ounce for silver. The prices of gold and silver may decline in the future. Any decline in our realized gold or silver price adversely impacts our revenues, net income and cash flows, particularly in light of our strategy of not engaging in hedging transactions with respect to gold. In addition, sustained lower gold or silver prices can:
| • | reduce revenues further through production declines due to cessation of the mining of deposits, or portions of deposits, that have become uneconomic at the then-prevailing gold or silver price; |
| • | reduce or eliminate the profit that we currently expect from ore stockpiles and ore on leach pads; |
| • | halt or delay the development of new projects; |
| • | cause us to recognize an impairment to the carrying values of mineral properties; |
| • | reduce funds available for exploration with the result that depleted reserves may not be replaced; and |
| • | reduce existing reserves by removing ores from reserves that can no longer be economically processed at prevailing prices. |
The estimation of the ultimate recovery of gold and silver contained within the Hycroft heap leach pad inventory (and that of any future heap leach mines, although based on standard industry sampling and estimating methods) is subjective. Actual recoveries can be expected to vary from estimations.
The Hycroft Mine utilizes the heap leach process to extract gold and silver from ore. The heap leach process is a process of extracting gold and silver by placing ore on an impermeable pad and applying a diluted cyanide solution that dissolves a portion of the contained gold and silver, which are then recovered in metallurgical processes. We use several integrated steps in the process of extracting gold and silver to estimate the metal content of ore placed on the leach pad. Although we refine our estimates as appropriate at each step in the process, the final amounts are not determined until a third-party smelter converts the doré and determines final ounces of gold and silver available for sale. We then review this end result and reconcile it to the estimates we developed and used throughout the production process. Based on this review, we adjust our estimation procedures when appropriate. Due to the complexity of the estimation process and the number of steps involved, among other things, actual recoveries can vary from estimates, and the amount of the variation could be significant and could have a material adverse impact on our financial condition and results of operations.
Each of these factors also applies to any future development of properties not yet in production. In the case of mines that we may develop in the future, we will not have the benefit of actual experience in our estimates with respect to those mines, and there is a greater likelihood that actual results will vary from the estimates.
Reserve and resource calculations are estimates only, and are subject to uncertainty due to factors including metal prices, inherent variability of the ore and recoverability of metal in the mining process.
The calculation of mineral reserves, mineral resources and grading are merely estimates and depend upon geological interpretation and statistical inferences or assumptions drawn from drilling and sampling analysis, which may prove to be unpredictable. There is a degree of uncertainty attributable to the calculation of reserves, resources and corresponding grades. Until reserves and resources are actually mined and processed, the quantity of ore and grades must be considered as an estimate only. In addition, the quantity of reserves and resources and ore may vary depending on metal prices. Any material change in the quantity of reserves, resources, mineralization, grade or stripping ratio may affect the economic viability of our properties. In addition, there can be no assurance that gold recoveries or other metal recoveries in small-scale laboratory tests will be duplicated in larger scale tests under on-site conditions or during production.
Compliance with current and future government regulations may cause us to incur significant costs.
Our operations are subject to extensive federal and state legislation governing matters such as mine safety, occupational health, labor standards, prospecting, exploration, production, exports, toxic substances, explosives, management of natural resources, price controls, land use, water use, air emissions, waste disposal, environmental review and taxes. Compliance with this and other legislation could require us to make significant capital outlays. The enactment of new legislation or more stringent enforcement of
7
Table of Contents
current legislation may increase costs, which could have a negative effect on our financial position. We cannot make assurances that we will be able to adapt to these regulatory developments on a timely or cost-effective basis. Violations of these laws, regulations and other regulatory requirements could lead to substantial fines, penalties or other sanctions, including possible shut-downs of the Hycroft Mine or future operations, as applicable.
Our operations are subject to numerous governmental permits that are difficult to obtain and we may not be able to obtain or renew all of the permits we require, or such permits may not be timely obtained or renewed.
In the ordinary course of business we are required to obtain and renew governmental permits for our operations, including in connection with our mining and exploration plans at the Hycroft Mine and our exploration plan at Hasbrouck. Obtaining or renewing the necessary governmental permits is a complex and time-consuming process involving costly undertakings by us. The duration and success of our efforts to obtain and renew permits are contingent upon many variables not within our control, including the interpretation of applicable requirements implemented by the permitting authority and intervention by third parties in any required environmental review. We may not be able to obtain or renew permits that are necessary to our operations on a timely basis or at all, and the cost to obtain or renew permits may exceed our estimates. Failure to comply with the terms of our permits may result in injunctions, fines, suspension or revocation of permits and other penalties. There can be no assurance that we have been or will at all times be in full compliance with all of the terms of our permits or that we have all required permits. The costs and delays associated with compliance with these permits and with the permitting process could stop us from proceeding with the operation or development of a property or increase the costs of development or production and may materially adversely affect our business, results of operations or financial condition.
We may not achieve our production estimates and our operating costs may be higher than our estimates.
We prepare estimates of future production and operating costs for our operations. We develop our estimates based on, among other things, mining experience, reserve and resource estimates, assumptions regarding ground conditions and physical characteristics of ores (such as hardness and presence or absence of certain metallurgical characteristics) and estimated rates and costs of mining and processing. All of our estimates are subject to numerous uncertainties, many of which are beyond our control. Our actual production may be lower than our production estimates and our actual operating costs may be higher than our operating cost estimates.
We cannot be certain that our future exploration and development activities will be commercially successful.
Substantial expenditures are required to further explore our Hycroft and Hasbrouck properties, to establish reserves and resources through drilling and analysis, to develop metallurgical processes to extract metal from the ore and, in the case of new properties or the expansion of our existing projects, to develop the mining and processing facilities and infrastructure at any site chosen for mining. We cannot provide assurance that any reserves or resources discovered will be in sufficient quantities to justify commercial operations or that the funds required for development can be obtained on a timely basis. A number of factors, including costs, actual mineralization, consistency and reliability of ore grades and commodity prices, affect successful project development. The reactivation and efficient operation of processing facilities, the existence of competent operational management and prudent financial administration, as well as the availability and reliability of appropriately skilled and experienced consultants also can affect successful project development. There can be no assurance that our exploration and development programs, including the advancement of the Hycroft oxide operation, the feasibility study for the Hycroft milling project and the preliminary economic assessment of Hasbrouck, will result in economically viable mining operations or yield new mineral reserves and resources.
Cost estimates and timing of new projects are uncertain.
The capital expenditures and time required to develop and explore our properties, including the Hycroft and Hasbrouck properties, are considerable and changes in costs, construction schedules or both, can affect project economics. There are a number of factors that can affect costs and construction schedules, including, among others:
| • | availability of labor, power, transportation and infrastructure; |
| • | changes in input commodity prices and labor costs; |
| • | fluctuations in currency exchange rates; |
| • | availability and terms of financing; |
| • | changes in anticipated tonnage, grade and metallurgical characteristics of the ore to be mined and processed; |
| • | recovery rates of gold and other metals from the ore; |
| • | difficulty of estimating construction costs over a period of years; |
| • | delays in completing any environmental review or in obtaining environmental or other government permits; |
| • | weather and severe climate impacts; and |
| • | potential delays related to social and community issues. |
8
Table of Contents
The scoping study initially announced by us in April 2010 and subsequently updated in September 2010 relates to the economic potential of the sulfide mineralization at the Hycroft property and is not part of, and should be distinguished from, the current oxide heap leach mining operation. The scoping study is based solely on the other mineralized material (or measured and indicated sulfide resources as defined by NI 43-101) defined on the property. Mineral resources that are not mineral reserves do not have demonstrated economic viability. Investors should be cautioned that the scoping study is very preliminary in nature and, accordingly, is subject to a high degree of uncertainty. A preliminary and/or a definitive feasibility study will be required to further evaluate project economics.
We do not currently intend to use forward sale arrangements to protect against low commodity prices and, as a result, our operating results are exposed to the impact of any significant drop in commodity prices.
We do not currently intend to enter into forward sales arrangements to reduce the risk of exposure to volatility in commodity prices. Accordingly, our future operations are exposed to the impact of any significant decrease in commodity prices. If such prices decrease significantly, we will realize reduced revenues. While it is not our current intention to enter into forward sales arrangements, we are not restricted from entering into forward sales arrangements at a future date.
The hazards and uncertainties associated with mining pose operational and environmental risks that may not be covered by insurance and may increase our costs.
Mining and processing operations involve many hazards and uncertainties, including, among others: environmental contamination; metallurgical and other processing problems; unusual and unexpected rock formations or water conditions; seismic activity; ground or slope failures or underground cave-ins; industrial accidents; fires; flooding and periodic interruptions due to inclement or hazardous weather conditions or other acts of nature; organized labor disputes or work slow-downs; mechanical equipment failure and facility performance problems; and the availability of critical materials, equipment and skilled labor. These risks could result in damage to, or destruction of, our properties or production facilities, personal injury or death, environmental damage, delays in mining or processing, increased production costs, asset write downs, monetary losses and legal liability.
We cannot be certain that our insurance will cover all of the risks associated with mining and processing or that we will be able to maintain insurance to cover these risks at economically feasible premiums. We could also become subject to liability for hazards against which we cannot insure or against which we may elect not to insure because of high premium costs or commercial impracticality. Such events could result in a prolonged interruption in operations that would have a negative effect on our ability to generate revenues, profits and cash flow. Losses from such events may increase costs and decrease profitability.
We may be unable to raise additional capital on favorable terms.
The exploration and development of our properties, including the advancement of the Hycroft oxide operation, the feasibility study for the Hycroft milling project and the preliminary economic assessment of Hasbrouck, will require significant capital investment. Failure to obtain sufficient financing may result in the delay or indefinite postponement of exploration activity, development or production on any of our properties. There can be no assurance that additional financing will be available at all or on terms we consider acceptable.
We face intense competition in the mining industry.
The mining industry is intensely competitive. As a result of this competition, some of which is with large established mining companies with substantial capabilities and with greater financial and technical resources than ours, we may be unable to acquire additional attractive mining claims or financing on terms we consider acceptable. This, in turn, may adversely affect our financial condition and our results of operations. We also compete with other mining companies in the recruitment and retention of qualified managerial and technical employees. If we are unable to successfully attract and retain qualified employees, our exploration and development programs may be slowed down or suspended.
Our exploration and development operations are subject to extensive environmental regulations, which could result in the incurrence of additional costs and operational delays.
All phases of our operations are subject to extensive environmental regulation. These environmental regulations require we obtain various operating approvals and licenses and also impose standards and controls relating to exploration, development and production activities. The regulatory environment in which we operate is evolving in a manner that will require stricter standards and enforcement, increased fines and penalties for non-compliance, more stringent environmental assessments of proposed projects and a heightened degree of responsibility for companies and their officers, directors and employees. New environmental laws and regulations or changes in existing environmental laws and regulations could have a negative effect on exploration activities, operations, production levels and methods of production. There is no assurance that future changes in environmental laws and regulations will not adversely affect our projects.
9
Table of Contents
Our properties in Nevada occupy private and public lands and are subject to environmental regulation, under applicable Federal and state laws and regulations. Production at our Hycroft Mine involves the use of sodium cyanide, which is a toxic material. Should sodium cyanide leak or otherwise be discharged from the containment system, we may become subject to liability for cleanup work that may not be insured.
U.S. Federal Laws
The Comprehensive Environmental, Response, Compensation, and Liability Act (CERCLA), and comparable state statutes, impose strict, joint and several liability on current and former owners and operators of sites and on persons who disposed of or arranged for the disposal of hazardous substances found at such sites. It is not uncommon for the government to file claims requiring cleanup actions, demands for reimbursement for government-incurred cleanup costs, or natural resource damages, or for neighboring landowners and other third parties to file claims for personal injury and property damage allegedly caused by hazardous substances released into the environment. The Federal Resource Conservation and Recovery Act (RCRA), and comparable state statutes, govern the disposal of solid waste and hazardous waste and authorize the imposition of substantial fines and penalties for noncompliance, as well as requirements for corrective actions. CERCLA, RCRA and comparable state statutes can impose liability for clean-up of sites and disposal of substances found on exploration, mining and processing sites long after activities on such sites have been completed.
The Clean Air Act, as amended, restricts the emission of air pollutants from many sources, including mining and processing activities. Our mining operations may produce air emissions, including fugitive dust and other air pollutants from stationary equipment, storage facilities and the use of mobile sources such as trucks and heavy construction equipment, which are subject to review, monitoring and/or control requirements under the Clean Air Act and state air quality laws. New facilities may be required to obtain permits before work can begin, and existing facilities may be required to incur capital costs in order to remain in compliance. In addition, permitting rules may impose limitations on our production levels or result in additional capital expenditures in order to comply with the rules.
The National Environmental Policy Act (NEPA) requires federal agencies to integrate environmental considerations into their decision-making processes by evaluating the environmental impacts of their proposed actions, including issuance of permits to mining facilities such as Hycroft Mine, and assessing alternatives to those actions. If a proposed action could significantly affect the environment, the agency must prepare a detailed statement known as an Environmental Impact Statement (EIS). The U.S. Environmental Protection Agency, other federal agencies, and any interested third parties will review and comment on the scoping of the EIS and the adequacy of and findings set forth in the draft and final EIS. This process can cause delays in issuance of required permits or result in changes to a project to mitigate its potential environmental impacts, which can in turn impact the economic feasibility of a proposed project.
The Clean Water Act (CWA), and comparable state statutes, impose restrictions and controls on the discharge of pollutants into waters of the United States. The discharge of pollutants into regulated waters is prohibited, except in accordance with the terms of a permit issued by the Environmental Protection Agency (EPA) or an analogous state agency. The CWA regulates storm water mining facilities and requires a storm water discharge permit for certain activities. Such a permit requires the regulated facility to monitor and sample storm water run-off from its operations. The CWA and regulations implemented thereunder also prohibit discharges of dredged and fill material in wetlands and other waters of the United States unless authorized by an appropriately issued permit. The CWA and comparable state statutes provide for civil, criminal and administrative penalties for unauthorized discharges of pollutants and impose liability on parties responsible for those discharges for the costs of cleaning up any environmental damage caused by the release and for natural resource damages resulting from the release.
The Safe Drinking Water Act (SDWA) and the Underground Injection Control (UIC) program promulgated thereunder, regulate the drilling and operation of subsurface injection wells. EPA directly administers the UIC program in some states and in others the responsibility for the program has been delegated to the state. The program requires that a permit be obtained before drilling a disposal or injection well. Violation of these regulations and/or contamination of groundwater by mining related activities may result in fines, penalties, and remediation costs, among other sanctions and liabilities under the SWDA and state laws. In addition, third party claims may be filed by landowners and other parties claiming damages for alternative water supplies, property damages, and bodily injury.
Nevada Laws
At the state level, mining operations in Nevada are also regulated by the Nevada Department of Conservation and Natural Resources, Division of Environmental Protection. Nevada state law requires the Hycroft Mine to hold Nevada Water Pollution Control Permits, which dictate operating controls and closure and post-closure requirements directed at protecting surface and ground water. In addition, we are required to hold Nevada Reclamation Permits. These permits mandate concurrent and post-mining reclamation of mines and require the posting of reclamation bonds sufficient to guarantee the cost of mine reclamation. We have set up a provision for our reclamation bond at the Hycroft Mine but this provision may not be adequate. If we are required to carry out unanticipated reclamation work, our financial position could be adversely affected.
10
Table of Contents
Other Nevada regulations govern operating and design standards for the construction and operation of any source of air contamination and landfill operations. Any changes to these laws and regulations could have an adverse impact on our financial performance and results of operations by, for example, requiring changes to operating constraints, technical criteria, fees or surety requirements.
Legislation has been proposed that would significantly affect the mining industry.
Members of the U.S. Congress have repeatedly introduced bills which would supplant or alter the provisions of the Mining Law of 1872. If enacted, such legislation could change the cost of holding unpatented mining claims and could significantly impact our ability to develop mineralized material on unpatented mining claims. Such bills have proposed, among other things, to either eliminate or greatly limit the right to a mineral patent and to impose a federal royalty on production from unpatented mining claims. Although we cannot predict what legislated royalties might be, the enactment of these proposed bills could adversely affect the potential for development of unpatented mining claims and the economics of existing operating mines on federal unpatented mining claims. Passage of such legislation could adversely affect our financial performance.
Regulations and pending legislation governing issues involving climate change could result in increased operating costs, which could have a material adverse effect on our business.
A number of governments or governmental bodies have introduced or are contemplating regulatory changes in response to various climate change interest groups and the potential impact of climate change. Legislation and increased regulation regarding climate change could impose significant costs on us, our venture partners and our suppliers, including costs related to increased energy requirements, capital equipment, environmental monitoring and reporting and other costs to comply with such regulations. Any adopted future climate change regulations could also negatively impact our ability to compete with companies situated in areas not subject to such limitations. Given the emotion, political significance and uncertainty around the impact of climate change and how it should be dealt with, we cannot predict how legislation and regulation will affect our financial condition, operating performance and ability to compete. Furthermore, even without such regulation, increased awareness and any adverse publicity in the global marketplace about potential impacts on climate change by us or other companies in our industry could harm our reputation. The potential physical impacts of climate change on our operations are highly uncertain, and would be particular to the geographic circumstances in areas in which we operate. These may include changes in rainfall and storm patterns and intensities, water shortages, changing sea levels and changing temperatures. These impacts may adversely impact the cost, production and financial performance of our operations.
A shortage of equipment and supplies could adversely affect our ability to operate our business.
We are dependent on various supplies and equipment to carry out our mining exploration and development operations. The shortage of such supplies, equipment and parts could have a material adverse effect on our ability to carry out our operations and therefore limit or increase the cost of production.
If we lose key personnel or are unable to attract and retain additional personnel, we may be unable to establish and develop our business.
Our development in the future will be highly dependent on the efforts of key management employees, namely, Robert Buchan, our Executive Chairman, Scott Caldwell, our President and Chief Executive Officer, Hal Kirby, our Executive Vice President and Chief Financial Officer, and other key employees that we may hire in the future. Although we have entered into employment agreements with key employees, we do not have and currently have no plans to obtain key man insurance with respect to any of our key employees. As well, we will need to recruit and retain other qualified managerial and technical employees to build and maintain our operations. If we are unable to successfully recruit and retain such persons, our development and growth could be significantly curtailed.
Our lack of operating experience may cause us difficulty in managing our growth.
We commenced operations on May 10, 2007 as an independent entity and are establishing operating procedures for evaluating, acquiring and developing properties, and negotiating, establishing and maintaining strategic relationships. Our ability to manage our growth, if any, will require us to improve and expand our management and our operational and financial systems and controls. If the experience of current management is unable to manage growth effectively, our business and financial condition would be materially harmed. In addition, if rapid growth occurs, it may strain our operational, managerial and financial resources.
There are uncertainties as to title matters in the mining industry. Any defects in such title could cause us to lose our rights in mineral properties and jeopardize our business operations.
Our mineral properties consist of private mineral rights, leases covering state and private lands, leases of patented mining claims and unpatented mining claims. Many of our mining properties in the United States are unpatented mining claims located on lands
11
Table of Contents
administered by the U.S. Bureau of Land Management (BLM), Nevada State Office to which we have only possessory title. Because title to unpatented mining claims is subject to inherent uncertainties, it is difficult to determine conclusively ownership of such claims. These uncertainties relate to such things as sufficiency of mineral discovery, proper location and posting and marking of boundaries, and possible conflicts with other claims not determinable from descriptions of record. Since a substantial portion of all mineral exploration, development and mining in the United States now occurs on unpatented mining claims, this uncertainty is inherent in the mining industry.
The present status of our unpatented mining claims located on public lands allows us the right to mine and remove valuable minerals, such as precious and base metals, from the claims conditioned upon applicable environmental reviews and permitting programs. We also are allowed to use the surface of the land solely for purposes related to mining and processing the mineral-bearing ores. However, legal ownership of the land remains with the United States. We remain at risk that the mining claims may be forfeited either to the United States or to rival private claimants due to failure to comply with statutory requirements. Prior to 1993, a mining claim locator who was able to prove the discovery of valuable, locatable minerals on a mining claim, and to meet all other applicable federal and state requirements and procedures pertaining to the location and maintenance of federal unpatented mining claims, had the right to prosecute a patent application to secure fee title to the mining claim from the Federal government. The right to pursue a patent, however, has been subject to a moratorium since October 1993, through federal legislation restricting the BLM from accepting any new mineral patent applications. If we do not obtain fee title to our unpatented mining claims, there can be no assurance that we will be able to obtain compensation in connection with the forfeiture of such claims.
There may be challenges to title to the mineral properties in which we hold a material interest. If there are title defects with respect to any properties, we might be required to compensate other persons or perhaps reduce our interest in the affected property. Also, in any such case, the investigation and resolution of title issues would divert our management’s time from ongoing exploration and development programs.
Some of our directors may have conflicts of interest as a result of their involvement with other natural resource companies.
Some of our directors are directors or officers of other natural resource or mining-related companies, or may be involved in related pursuits that could present conflicts of interest with their roles at Allied Nevada. In the event that any such conflict of interest arises, a director who has such a conflict is required to disclose the conflict at a meeting of the directors of the Company and to abstain from voting for or against approval of any matter in which such director may have a conflict. In appropriate cases, we will establish a special committee of independent directors to review a matter in which directors, or management, may have a conflict.
Future sales of our common stock in the public or private markets could adversely affect the trading price of our common stock and our ability to raise funds in new stock offerings.
Future sales of substantial amounts of our common stock or equity-related securities in the public or private markets, or the perception that such sales could occur, could adversely affect prevailing trading prices of our common stock and could impair our ability to raise capital through future offerings of equity or equity-related securities. As of February 22, 2011, 88,999,553 shares of our common stock were outstanding. We cannot predict the effect, if any, that future sales of our common stock, or the perception that such sales could occur, will have on the trading price of our common stock.
We do not intend to pay dividends for the foreseeable future.
We have never declared or paid any dividends on our common stock. We intend to retain all of our earnings for the foreseeable future to finance the operation and expansion of our business, and we do not anticipate paying any cash dividends in the future. As a result, you may only receive a return on your investment in our common stock if the market price of our common stock increases. Our board of directors retains the discretion to change this policy.
Anti-takeover provisions in our organizational documents and under Delaware law could make a third party acquisition of the Company difficult.
Our certificate of incorporation and bylaws contain provisions that may discourage unsolicited takeover proposals that stockholders may consider to be in their best interests. These provisions include the ability of our board of directors to designate the terms of and issue new series of preferred stock and the ability of our board of directors to amend the bylaws without stockholder approval. In addition, as a Delaware corporation, we are subject to Section 203 of the Delaware General Corporation Law, which generally prohibits a Delaware corporation from engaging in any business combination with any interested stockholder for a period of three years following the date that the stockholder became an interested stockholder, unless certain specific requirements are met as set forth in Section 203. Collectively, these provisions could make a third party acquisition of the Company difficult or could discourage transactions that otherwise could involve payment of a premium over prevailing market prices for our securities.
12
Table of Contents
Our gold and silver production may decline, reducing our revenues and negatively impacting our business.
Our future gold and silver production may decline as a result of an exhaustion of reserves and possible closure of mines. It is our business strategy to conduct gold and silver exploratory activities at the Hycroft and Hasbrouck properties and to consider the acquisition of gold and silver mining properties and businesses or reserves that possess minable ore reserves and are expected to become operational in the near future. We can provide no assurance that our gold and silver production in the future will not decline. Accordingly, our revenues from the sale of gold and silver may decline, negatively affecting our results of operations.
Our ability to find and acquire new mineral properties is uncertain. Accordingly, our prospects are uncertain for the future growth of our business.
Because mines have limited lives based on proven and probable ore reserves, we are continually seeking to replace and expand our ore reserves. Identifying promising mining properties is difficult and speculative. Furthermore, we encounter strong competition from other mining companies in connection with the acquisition of properties producing or capable of producing gold and silver. Many of these companies have greater financial resources than we do. Consequently, we may be unable to replace and expand current ore reserves through the acquisition of new mining properties or interests therein on terms we consider acceptable. As a result, our revenues from the sale of gold and silver may decline, resulting in lower income and reduced growth.
Environmental regulations could require us to make significant expenditures or expose us to potential liability.
To the extent we may become subject to environmental liabilities, the payment of such liabilities or the costs that we may incur to remedy environmental pollution would reduce funds otherwise available to us and could have a material adverse effect on our financial condition and results of operations. If we are unable to fully remedy an environmental problem, we might be required to suspend operations or enter into interim compliance measures pending completion of the required remedy. The environmental standards that may ultimately be imposed at a mine site impact the cost of remediation and may exceed the financial accruals that have been made for such remediation. The potential exposure may be significant and could have a material adverse effect on our financial condition and results of operations.
Moreover, governmental authorities and private parties may bring lawsuits based upon damage to property and injury to persons resulting from the environmental, health and safety impacts of our past and current operations, which could lead to the imposition of substantial fines, remediation costs, penalties and other civil and criminal sanctions. Substantial costs and liabilities, including for restoring the environment after the closure of mines, are inherent in our operations. Although we believe that we are in substantial compliance with applicable laws and regulations, we cannot assure you that any such law, regulation, enforcement or private claim will not have a negative effect on our business, financial condition or results of operations.
Our business is subject to evolving corporate governance and public disclosure regulations that have increased both our compliance costs and the risk of noncompliance, which could have an adverse effect on our stock price.
We are subject to changing rules and regulations promulgated by a number of governmental and self-regulated organizations, including the Securities and Exchange Commission, the NYSE Amex, and the Financial Accounting Standards Board. These rules and regulations continue to evolve in scope and complexity and many new requirements have been created in response to laws enacted by Congress, making compliance more difficult and uncertain. For example, on July 21, 2010, Congress passed the Dodd-Frank Wall Street Reform and Protection Act. Our efforts to comply with the Dodd-Frank Act and other new regulations have resulted in, and are likely to continue to result in, increased general and administrative expenses and a diversion of management time and attention from revenue-generating activities to compliance activities.
We may be adversely affected by challenges relating to slope stability.
Our open-pit mines get deeper as we mine them, presenting certain geotechnical challenges including the possibility of slope failure. If we are required to decrease pit slope angles or provide additional road access to prevent such a failure, our stated reserves could be negatively affected. Further, hydrological conditions relating to pit slopes, renewal of material displaced by slope failures and increased stripping requirements could also negatively affect our stated reserves. We have taken actions in order to maintain slope stability, but we cannot assure that we will not have to take additional action in the future or that our actions taken to date will be sufficient. Unexpected failure or additional requirements to prevent slope failure may negatively affect our results of operations and financial condition, as well as have the effect of diminishing our stated ore reserves.
To the extent that we seek to expand our operations and increase our reserves through acquisitions, we may experience issues in executing acquisitions or integrating acquired operations.
From time to time, we may examine opportunities to make selective acquisitions in order to expand our operations and reported reserves. The success of any acquisition would depend on a number of factors, including, but not limited to:
| • | identifying suitable candidates for acquisition and negotiating acceptable terms for any such acquisition; |
13
Table of Contents
| • | obtaining approval from regulatory authorities and potentially the Company’s shareholders; |
| • | maintaining our financial and strategic focus and avoiding distraction of management during the process of integrating the acquired business; and |
| • | implementing our standards, controls, procedures and policies at the acquired business. |
There can be no assurance that we will be able to conclude any acquisitions successfully, or that any acquisition will achieve the anticipated synergies or other positive results. Any material problems that we encounter in connection with such an acquisition could have a material adverse effect on our business, operating results and financial condition.
Joint ventures and other partnerships may expose us to risks.
In the future, we may enter into joint ventures or other partnership arrangements with other parties in relation to the exploration, development and production of certain of the properties in which we have an interest. Joint ventures can often require unanimous approval of the parties to the joint venture or their representatives for certain fundamental decisions such as an increase or reduction of registered capital, merger, division, dissolution, amendments of constating documents, and the pledge of joint venture assets, which means that each joint venture party may have a veto right with respect to such decisions which could lead to a deadlock in the operations of the joint venture or partnership. Further, we may be unable to exert control over strategic decisions made in respect of such properties. Any failure of such other companies to meet their obligations to us or to third parties, or any disputes with respect to the parties’ respective rights and obligations, could have a material adverse effect on the joint ventures or their properties and therefore could have a material adverse effect on our results of operations, financial performance, cash flows and the price of the common shares.
| Item 1B. | Unresolved Staff Comments |
None.
| Item 2. | Properties |
We classify our mineral properties into three categories: “Operating Properties”, “Advanced Exploration Properties”, and “Other Exploration Properties”. Operating Properties are properties on which the Company operates a producing mine. The Hycroft Mine, as described below, is currently our only Operating Property. Advanced Exploration Properties are properties where we retain a significant controlling interest or joint venture and there has been sufficient drilling and analysis completed to identify and report reserves or other mineralized material. Other Exploration Properties are those for which insufficient drilling and geologic investigations have been completed to define mineralized materials. Please see below for information about our Operating Properties, Advanced Exploration Properties, and Other Exploration Properties.
Other than the Hycroft Mine, we cannot be certain that any mineral deposits will be discovered in sufficient quantities and grade to justify commercial operations. Whether a mineral deposit will be commercially viable depends on a number of factors, including the particular attributes of the deposit; metal prices, which are highly cyclical; the cost to extract and process the mineralized material; and government regulations and permitting requirements. We may be unable to upgrade our mineralized material to proven and probable reserves in sufficient quantities to justify commercial operations and we may not be able to raise sufficient capital to develop our properties. Estimates of reserves and mineralization herein are subject to the effect of changes in metal prices, and to the risks inherent in mining and processing operations.
In addition, Allied Nevada has seven geothermal leases that were entered into during 2009 from the BLM. These leases occur in proximity to, or in some cases overlap with, existing Allied Nevada mineral holdings, and were obtained through competitive bidding.
14
Table of Contents
Operating Properties
Hycroft Mine
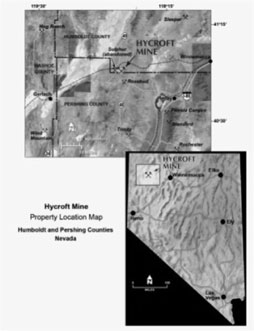
We currently have one Operating Property, the Hycroft Mine, which we also refer to as the “Hycroft Mine” in this document. This mine and related facilities are located 54 miles west of Winnemucca, Nevada. Winnemucca (population 8,500) is a commercial community on Interstate 80, 164 miles northeast of Reno. The town is served by a transcontinental railroad and has a municipal airport. Access to the Hycroft Mine from Winnemucca is by means of State Road No. 49 (Jungo Road), a good-quality, unpaved road. The entrance to the mine is several hundred feet off the road. Well-maintained mine and exploration roads provide access throughout the property. Access is also possible from Imlay, Gerlach, and Lovelock by unpaved roads intersecting Interstate 80 and Nevada State Route 447. The majority of our employees live in the Winnemucca area.
The mine is situated east of the Black Rock Desert on the western flank of the Kamma Mountains between Winnemucca and Gerlach. There are no streams, rivers, or major lakes in the general area. Elevations in the mine area range between 4,500 and 5,500 ft above sea level.
The Company holds 22 patented and 2,893 unpatented mining claims that constitute our Hycroft Mine Operating Property. The total acreage covered by unpatented claims is approximately 59,595 acres with an additional 1,794 acres related to the patented claims. The details of these claims and the holding requirements are discussed in greater detail in the geology and ore reserve section that follows.
The climate of the region is arid, with precipitation averaging 7.6 inches per year. Temperatures during the summer range from daily low temperatures (“lows”) of 50°F to daily high temperatures (“highs”) of greater than 90°F and winter temperatures range from lows of 20°F to highs of 40°F. There is strong surface heating during the day and rapid nighttime cooling because of the dry air. This results in wide ranges in daily temperatures.
The Hycroft Mine consists of multiple open pit mines, associated waste dumps and two heap leach pads. The Hycroft Mine was formally known as the Crofoot Lewis open pit mine. Mining began in the area in 1983 with a small heap leaching operation known as the Lewis mine. Lewis mine production was followed by production from the Crofoot property in the Bay, South Central, Boneyard, Gap and Cut 4 pits along the Central fault, and finally the north end of the Brimstone pit and continued until it was placed on a care and maintenance program in December 1998 due to low gold prices. During this first operating period the mine produced over one million ounces of gold and two and half million ounces of silver. Gold production from the leaching and rinsing of the heap leach pads, continued in 2000 and 2001. In 2002, 2003, 2004 and 2005, the amount of gold recovered was not material.
The Lewis mine was acquired by Vista in early 1987 from F.W. Lewis, Inc. and the Crofoot mine was acquired by Vista in April 1988. The leasehold interest in the Lewis property along with gold and silver NSRs was purchased from F.W. Lewis, Inc. by Vista on December 13, 2005 in consideration of the payment of $5.1 million. The Crofoot property was originally held under two leases and is now owned by Allied Nevada subject to a 4% net profits interest retained by the former owners. The lease agreements include for the payment of advance royalty payments of $120,000 in any year where mining occurs on the Crofoot claims. All advance royalty payments are credited against the future payments under the 4% net profits royalty. The total lease payments under the Crofoot leases claims are subject to a maximum of $7.6 million in royalty payments of which the Company has paid $960,000 through December 31, 2010.
The site receives line current provided by NV Energy from the northwestern power grid. With the cooperation of the power provider, we inspected the substations, power lines and transformers and repaired and replaced necessary components.
15
Table of Contents
We currently have water rights, which are adequate to process the planned oxide heap leach ore. We have rehabilitated the primary process water well and fresh water well and have developed a new back up process water well.
In 2010, Hycroft successfully completed its second full year of operations, achieving its stated operating goals. The mine moved 26.5 million tons of material, including 9.9 million tons of ore placed on the leach pad at average grades of 0.020 opt gold and 0.246 opt silver, placing 194,100 contained ounces of gold (109,900 recoverable ounces) and 2,436,500 contained ounces of silver (243,700 recoverable ounces). The Company sold 102,483 ounces of gold and 238,242 ounces of silver in 2010.
The major accomplishments in 2010 were as follows:
| • | Completed more than one full year with no lost time accidents and no significant environmental issues. |
| • | Completed two NI 43-101 compliant updated mineralized material estimates in April and August, 2010. The mineralized material estimate announced in April 2010 indicated a 118% increase in gold Proven and Probable Reserves to 2.4 million ounces and an initial silver Proven and Probable reserve of 32.3 million ounces, subsequently updated to 38.9 million ounces in August when compared with the mineralized material estimate announced in March 2009. |
| • | Began implementing the accelerated oxide heap leach project designed to increase the mining rate, thereby more than doubling gold production by 2012. This will be accomplished by purchasing a larger capacity mining fleet of 320-ton haul trucks and hydraulic shovels over the next two years. |
| • | Purchased and placed into operation three 320-ton haul trucks and a larger capacity shovel in connection with the accelerated oxide mining expansion. Also, in 2010, the Company began operating a mobile crushing unit which is expected to crush the higher grade siliceous mineralization in order to improve total leach recoveries for gold and silver. It is expected that additional larger capacity mining equipment and mobile crushing units will be added in the next two years as part of the implementation of the accelerated oxide mining expansion. |
| • | Announced and updated a positive milling scoping study with the goal of defining an economically viable processing option for the mineralization. |
| • | Ongoing metallurgical test work throughout 2010 continued to show positive results for the grind-flotation-cyanidation of the tailings flowsheet for the milling scenario. At January 2011, the Company had completed approximately 70% of the required test work for the milling feasibility study. Overall, testing of the composites through the grind-flotation-cyanidation of the tailing flowsheet indicate recoveries of 87% for gold and 82% for silver. Concentrate from six bulk samples are currently being tested through various oxidation techniques and the results will indicate the overall recovery through the entire milling-flotation-oxidation circuit. |
| • | Completed a 3.5 million square foot expansion to the Brimstone leach pad as planned. |
| • | Completed modifications to the leach pad, ponds, pumping system and piping to allow for “stacking” of pregnant solutions (increasing the grade by recycling lower grade solution back to the pad). By increasing the grade of gold and silver in the pregnant solution, the operating efficiencies of the Merrill-Crowe plant and the CIC plant are expected to improve. In addition, the solution flow rate was increased from 2,500 to 3,500 gpm allowing for the lower grade solutions to be recycled back up to the pad without impacting production. |
| • | In June, 2010, we completed an underwritten public offering pursuant to which we issued 13,500,000 common shares for aggregate proceeds of CDN$283,500,000. Proceeds from the financing were to satisfy initial capital needs for the accelerated oxide expansion, to fund exploration programs and to complete the initial milling feasibility study for Hycroft. |
| • | Completed the 2010 Hycroft exploration season with 396 holes drilled totaling 333,248 feet of drilling. |
| • | Completed an initial drill program at Hasbrouck with positive results. Management intends to complete a preliminary economic assessment for Hasbrouck in the first quarter of 2011. |
Accelerated Oxide Plan
The accelerated oxide mine plan is being phased in over the next two years, with expected production increasing from 102,483 ounces of gold and 238,242 ounces of silver in 2010 to over 260,000 ounces of gold in 2012 and peaking at over 300,000 ounces in each of 2013 and 2014. This accelerated plan assumes an average mining rate of 80.5 million tons per year will be achieved by 2012 utilizing larger 320-ton haul trucks and larger capacity hydraulic shovels. Total annual tons moved are expected to include 37.5 million tons of ore and 43.0 million tons of waste with approximately 10% of the ore being crushed. The current oxide reserve is sufficient to support this mining rate into 2016; however, based on past exploration success and technical knowledge, management believes that ongoing exploration will continue to convert and expand oxide mineralization, extending mine life.
The total capital required, over the life of the mine, to implement this accelerated mining plan is expected to be approximately $212 million. The initial capital of approximately $180 million, spent over the first three years, is for the inclusion of a larger capacity mining fleet ($130 million), leach pad expansions ($20 million), mobile crushing units ($14 million) and modifications to existing infrastructure such as the process plant and refinery ($12 million). It is expected that the mobile mining fleet may be purchased with capital lease financing through the equipment manufacturer if commercial terms are available.
Mill Project Scoping Study
The Company completed a milling scoping study in April 2010, designed to extract the large sulfide resource and additional oxide resources associated with the sulfides. This study was subsequently updated in September of 2010. The 2010 scoping study
16
Table of Contents
envisions an 174,000 ore ton per day (“tpd”) milling and heap leach operation. This updated scoping study concludes that average annual production of approximately 610,000 ounces of gold and 27 million ounces of silver could be produced from the combined 100,000 tpd milling operation and 74,000 tpd heap leach operation. The estimated capital cost was expected to be $1.1 billion for the milling and flotation process facility, additional leach pads, mining equipment and other ancillary infrastructure. The milling facility would be comprised of one or two lines, with each consisting of a primary crusher, semi-autogenous grinding mill, two ball mills, a flotation and cyanidation leach circuit and could be implemented in stages in order to manage capital expenditures over the first few years of the project.
The Company expects to complete an update to the 2010 scoping study in March 2011. Based on the favorable result of the milling scoping study and the subsequent updates, the Company is preparing an initial feasibility study, currently expected to be released in the third quarter of 2011.
Recent metallurgical testing shows a processing method for the oxide and sulfide ore that would include grinding, flotation to make a sulfide concentrate, autoclaving and leaching of the concentrate, and conventional leaching of the flotation tails. Management continues to review other options for concentrate processing including roasting and offsite sales.
The project described in the scoping study will require federal and state environmental permits and a site wide Environmental Impact Statement (“EIS”). Preliminary work required for the EIS, such as base line water sampling and archeology surveys, began late in 2009. The scoping study assumes receipt of all required state and federal permits to construct and operate the sulfide mine and plant in three years. Management believes that construction and commissioning of the plant may take two years.
Geology
The Hycroft Mine is located on the western flank of the Kamma Mountains. The deposit is hosted in a volcanic eruptive breccia and conglomerates associated with the Tertiary Kamma Mountain volcanics. The volcanics are mainly acidic to intermediate tuffs, flows and coarse volcaniclastic rocks. Fragments of these units dominate the clasts in the eruptive breccia. Volcanic rocks have been block-faulted by dominant north-trending structures, which have affected the distribution of alteration and mineralization. The Central Fault and East Fault control the distribution of mineralization and subsequent oxidation. A post-mineral range-front fault separates the orebody from the adjacent Pleistocene Lahontan Lake sediments in the Black Rock Desert.
The known gold mineralization within the Crofoot and Lewis properties extends for a distance of three miles in a north-south direction by 1.5 miles in an east-west direction. Mineralization extends to a depth of less than 330 feet in the outcropping to near-outcropping portion of the deposit on the northwest side to over 2,500 feet in the Vortex deposit in the east. Not all the mineralization is oxidized and the depth of oxide ore varies considerably over the area of mineralization.
We currently have patented claims that comprise approximately 1,794 acres and 2,893 unpatented claims that comprise approximately 59,595 acres. Combining the patented and unpatented claims, our claims total approximately 61,389 acres. This claim package was acquired by the Company in a series of transactions:
| • | The Crofoot property and approximately 3,500 acres of claims were acquired by Vista in 1988. The Crofoot property, originally held under lease, is owned by Hycroft Resources & Development, Inc. subject to a 4% net profits interest retained by the former owners. |
| • | The F.W. Lewis property and approximately 8,700 acres of claims were acquired by Vista in early 1987 |
| • | In 2006, approximately 13,100 acres of additional claims were staked by Vista. These claims were around or contiguous to the original Crofoot and F.W. Lewis Claims. |
| • | In 2008, we staked approximately 22,700 acres of additional claims contiguous to or around the existing Hycroft claims. |
| • | In 2009, we staked an additional 79 claims consisting of approximately 1,600 acres contiguous to or around the existing Hycroft land holding. |
| • | In 2010, we staked an additional 466 claims and 10,870 acres contiguous to or around the existing Hycroft land holding. |
Our Hycroft patented claims occupy private lands and our unpatented claims occupy public lands. The public lands include unpatented mining claims on lands administered by the BLM. These claims are governed by the laws and regulations of the U.S. federal government and the state of Nevada. To maintain the patented claims in good standing, we must pay the annual property tax payments to the county in which the claims are held. To maintain the unpatented claims in good standing, we must file a notice of intent to maintain the claims within the county and pay the annual mineral claim filing fees to the BLM.
Mineral Proven and Probable Ore Reserves
Recoverable proven and probable reserves summarized below and detailed on the following pages have been calculated as of December 31, 2010, in accordance with Industry Guide 7 as required by the Securities Exchange Act of 1934. Proven and probable reserves may not be comparable to similar information regarding mineral reserves disclosed in accordance with the guidance of other countries. Proven and probable reserves were determined by the use of mapping, drilling, sampling, assaying and evaluation methods generally applied in the mining industry, as more fully discussed below. The term “reserve,” as used in the reserve data presented here, means that part of a mineral deposit that can be economically and legally extracted or produced at the time of the reserve determination. The term “proven reserves” means reserves for which (1) quantity is computed from dimensions revealed in outcrops,
17
Table of Contents
trenches, workings or drill holes; (2) grade and/or quality are computed from the results of detailed sampling; and (3) the sites for inspection, sampling and measurements are spaced so closely and the geologic character is sufficiently defined that size, shape, depth and mineral content of reserves are well established. The term “probable reserves” means reserves for which quantity and grade are computed from information similar to that used for proven reserves but the sites for sampling are farther apart or are otherwise less adequately spaced. The degree of assurance, although lower than that for proven reserves, is high enough to assume continuity between points of observation.
Our reserve estimates are based on the latest available geological and geotechnical studies. We conduct ongoing studies of our ore bodies to optimize economic values and to manage risk. We revise our mine plans and estimates of recoverable proven and probable mineral reserves as required in accordance with the latest available studies. Our estimates of recoverable proven and probable reserves are prepared by and are the responsibility of our employees, and a majority of these estimates are reviewed and verified by independent experts in mining, geology and reserve determination. Estimated recoverable proven and probable reserves at December 31, 2010, were determined using long-term average prices of $800 per ounce for gold and $14 per ounce for silver. The London spot metal prices for the past three years averaged $1,022.95 per ounce for gold and $16.60 per ounce for silver.
Below is a summary of the mineral proven and probable ore reserves as of December 31, 2010.
| Gold | Silver | |||||||||||||||||||||||||||
| Ore | Contained | Contained | Waste | |||||||||||||||||||||||||
| Tons | Ounces | Ounces | Tons | Strip | ||||||||||||||||||||||||
| Category |
(000’s) | oz/ton | (000’s) | oz/ton | (000’s) | (000’s) | Ratio | |||||||||||||||||||||
| Proven reserves |
162,381 | 0.013 | 2,160 | 0.261 | 42,308 | |||||||||||||||||||||||
| Probable reserves |
33,650 | 0.012 | 399 | 0.207 | 6,981 | |||||||||||||||||||||||
| Proven and probable reserves |
196,031 | 0.013 | 2,559 | 0.251 | 49,289 | 201,685 | 1.09 | |||||||||||||||||||||
Mine Operations
The mining in 2011 of our current proven and probable ore reserves in the Brimstone Pit and Cut-5 Pit will be conducted by open pit methods using 320 and 200-ton haul trucks, 35-cubic yard hydraulic shovels and 30-cubic yard wheel loaders and DML blast hole drills. Mining in the Brimstone pit has been designed with five mining phases, and the Cut-5 Pit will be mined in two single top-down mining sequences. Our current mine plans are to increase production to an annual mining rate of 44.0 million tons of material in 2011, 80.5 million tons of material in 2012, and 86.0 million tons of material in 2013.
We are currently in the third phase of five phases of mining in the Brimstone Pit and the first phase of mining in the Cut-5 Pit. This phase of mining involves the mining of more ore and less waste, than experienced in the previous phase, and it is expected that the strip ratio will be lower than the average life of mine strip ratio of 1.09:1. We are in the middle of an expansion program to deliver more ore to the heap leach pads and have taken delivery of three 320-ton haul trucks and one hydraulic shovel have been mobilized and we are expecting deliveries of an additional five 320-ton haul trucks and two 35-cubic yard hydraulic shovels. A mobile crusher was purchased and delivered in 2010 and is capable of crushing twelve thousand tons per day to 3/4 inch minus, allowing for enhanced recovery of high grade heap leach ores. This crushing unit has primarily been used for crushing overliner material for the expansion of the Brimstone leach pad. There is a significant amount of acid leach material being mined, which is relatively soft material and does not require crushing. It is anticipated that we will mine out the acid leach material by mid to late 2011, and we may ultimately add two more similar crushing systems when more siliceous ore feed becomes available.
For 2011, lower grade ore will be hauled by truck and placed on the Brimstone leach pad as run-of-mine material. Higher grade material will be crushed and placed on the Brimstone leach pad in dedicated areas. The Brimstone pad system is currently comprised of the previously operated Brimstone leach pad and has grown through three expansions in each of 2008, 2009 and 2010. This leach pad system has sufficient capacity to handle our ore placement requirements for 2011. We plan to continually expand this leach pad system in 2011 and future years to meet production requirements. All ore-grade material placed on the leach pad will be cross-ripped to enhance permeability. A network of solution drip lines will be positioned and the run of mine material will be leached with a cyanide solution for a period of about 60 to 90 days before another 30 foot high lift of ore is placed on top of the existing lift. Return solution from the pad containing the precious metals is directed to the pregnant or lean solution pond. Gold will be removed from pregnant solutions using a CIC process and at the Brimstone plant using the Merrill-Crowe process. The product from the CIC process will be transported to a third party for processing to recover the precious metals from the carbon and produce a doré containing gold and silver. Doré containing gold and silver will be produced at the Hycroft Mine from the Merrill-Crowe process. Low grade pregnant solution directed to the lean pond will be used for “stacking” which encompasses recycling pregnant solution back to the ore pad to increase solution overall metal grades. Based on previous operating experience, 56.6% of the gold and 10% of the silver placed on the pad as run of mine production is expected to be recovered in the plant. Crushing ore is expected to improve the overall average recovery of gold and silver.
18
Table of Contents
During 2011, we expect to increase the annual gold production from the Hycroft mine. The alternatives we are implementing include:
| • | Increasing mining rates in order to increase annual gold production. An accelerated mine plan, approved by the Company in 2010, will increase the tons mined to 86.0 million per year by 2013. The additional ore mined would result in annual gold recoveries of 130,000 ounces, 260,000 ounces, and 300,000 ounces for the years ended 2011, 2012, and 2013, respectively. The existing mobile mine equipment fleet and process facilities are currently being expanded to accommodate the increased production. |
| • | Expanding the Merrill-Crowe operation to allow the flow rate to be increased from 3,500 gpm to 5,000 gpm. This will increase gold and silver production. |
Hycroft Mine Exploration
Since the formation of the Company in May 2007, Allied Nevada, as of year-end 2010, has drilled a total of 917 holes, for combined total of 727,889 feet, at the Hycroft mine. Material from all the holes has been assayed using a fire assay procedure for both gold and silver content by one of two independent laboratories. Upon completion of a drill hole, the hole is surveyed and then plugged. Management of the drill program, sample collection and assay program is being carried out by Allied Nevada. Qualified independent consultants have reviewed all aspects of the exploration program and are expected to conduct regular reviews of the ongoing exploration program.
In 2010, we drilled 396 holes, representing approximately 333,248 feet, with focus on infilling the Vortex zone to the south of the Brimstone pit and better defining material at the Central pit. We are expecting to announce a reserve update in 2011, incorporating all drilling completed to December 15, 2010.
Of the 2010 total program, 70 holes were directed towards infill and step out off of the Vortex zone, 44 holes towards infill of the Bay zone, 150 holes at Central zone, and 50 holes at Brimstone zone. The balance of the holes were primarily drilled to obtain material for metallurgical testing material.
A 196,800 foot exploration program has been designed for 2011 with a focus on expanding oxide and sulfide resources, improving the confidence level of oxide resources, and exploration of new areas of mineralization. Exploration spending at Hycroft will be success-driven and is expected to be approximately $14 million in 2011.
Management intends to continue exploration drilling to expand on the sulfide system in 2011. Additional metallurgical testing and engineering work in 2011 will be conducted as part of an initial feasibility study evaluating the economic viability of the sulfide mineralization. The study is expected to be completed in the third quarter 2011.
The analysis of the current drill results and historical geological information suggests that gold and silver mineralization is hosted along north-south trending zones of approximately 14,000 feet in length. These zones are partially defined laterally by post-mineral faults. The following currently identified zones are: Albert, Bay, Camel, Central, Boneyard, Brimstone, Foothills, and Vortex. The 2011 program is planned to include further exploration of the Vortex, Albert, and Central zones.
Any expansion of the Hycroft Mine necessary to exploit any additional reserves that may be established through our Hycroft exploration drilling program that are not located within our current mine plan, will require us to obtain all necessary permits, approvals and consents of regulatory agencies responsible for the use and development of mines in Nevada.
Advanced Exploration Properties
Advanced Exploration Properties are both those properties where we retain a significant controlling interest or joint venture and where there has been sufficient drilling and analysis completed to identify and report reserves or other mineralized material and more than 100 Other Exploration Properties. Allied Nevada currently has six properties on which mineralized material has been identified: Maverick Springs (a 45% joint venture with Silver Standard), Mountain View, Hasbrouck, Three Hills, Wildcat and Pony Creek/Elliot Dome.
None of these properties currently have proven or probable reserves as defined by Industry Guide 7. We are currently evaluating these properties to determine how to best advance these projects by increasing the identified mineral resources, improving the quality of these mineral resources, or advancing the project to a development decision.
The following map provides the general location of each of these six properties on which we have identified mineralized material. All of the Company’s properties are within the state of Nevada.
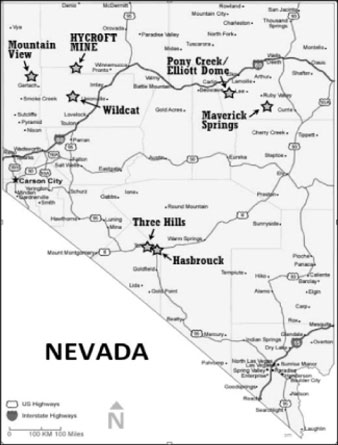
19
Table of Contents
The following table summarizes information we consider important concerning our Advanced Exploration Properties. The reader is directed to the more comprehensive information about these properties starting immediately following the summary table.
Advanced Exploration Properties
Summary Information
| Property Name |
Approximate Acreage |
Original Ownership Interest |
Geology |
Exploration/Mining History | ||||
| Hasbrouck |
2,500 acres (22 patented, 122 unpatented) | 100%, subject to two individual royalties of 2.0% each. | Gold is hosted in volcanics below sinter deposits of an epithermal, hot spring environment. | Previously explored and drilled by other operators. | ||||
| Three Hills |
300 acres (15 unpatented) | 100% subject to 2% royalties. | Gold occurs in silicification zone where faults cut volcanic rocks. | Previously explored and drilled by other operators. | ||||
| Maverick Springs |
4,920 acres (246 unpatented) | 45%, subject to underlying royalties and annual lease payments of $100,000 (Allied Nevada’s share is 45%). | Sediment hosted disseminated gold/silver system. | Prior exploration and drilling by Vista and Silver Standard Resources Inc. and others. | ||||
| Mountain View |
2,560 acres (128 unpatented) | 50%, with an option to acquire additional 50% by paying $250,000, subject to two underlying royalties of 1.0% and 1.5%. | Severance rhyolite hosts gold mineralization under cover. | Previously drilled and explored by others, Vista has drilled on the property. | ||||
| Wildcat |
5,900 acres (4 patented, 284 unpatented) | 100%, subject to underlying 0.4-1.0% royalties. | Structurally controlled epithermal gold and silver in volcanic rocks. | Historic small scale mining of veins. Extensively drilled by former operators. | ||||
| Pony Creek/ Elliot Dome |
17,900 acres (895 unpatented) | 100% | Gold is related to felsite breccias and probably to felsic intrusions into graben faults | Newmont explored and drilled 1980-1989, followed by others off and on through present. | ||||
20
Table of Contents
Hasbrouck
The Hasbrouck property is located in southwestern Nevada about 5 miles south-southwest of the town of Tonopah in Esmeralda County, Nevada, adjacent to U.S. Highway 95 and approximately half-way between Reno and Las Vegas. The property is accessed from Tonopah by traveling south along US Highway 95, which transects the claim block. The project is accessed by a gravel road off of U.S. Highway 95 that connects to a network of dirt drill roads that traverse Hasbrouck. The property consists of 22 patented lode mining claims and 122 unpatented lode claims that cover an area of approximately 2,500 acres.
On May 23, 2003, Vista executed a purchase agreement with Newmont Capital, which includes both the Hasbrouck property and the Three Hills property, which lies approximately 4.5 miles to the north-northwest. The agreement included the right to acquire 51% of Hasbrouck and Three Hills properties upon an expenditure of $1.0 million. Allied completed the threshold expenditure during the first half of 2010. Upon notice by Allied in August 2010, Newmont Capital has elected to not participate in a joint venture on the properties. As a result, Allied Nevada will retain 100% ownership in these properties, subject to a 2% NSR in each project together with the right to a $500,000 cash payment at the start of commercial production at either project and a further $500,000 cash payment if, after the start of commercial production, the gold price averages $400 per ounce or more for any three-month period. An additional 2.0% NSR on certain Hasbrouck claims is held by other parties.
Geology
The property is located on Hasbrouck Mountain, which is thought to lie along the western edge of a caldera. The mountain is underlain by gently dipping ash-flow, air-fall and waterlain tuffs and volcaniclastic sediments of the Miocene Siebert Formation. Several occurrences of chalcedonic sinter deposits occur near the summit of the mountain. Gold and silver mineralization in the Hasbrouck deposit appears to have formed relatively close to the paleo-surface in an epithermal, hot spring environment. The mineralization is concentrated in the Siebert Formation, in units stratigraphically below the chalcedonic sinter deposits that are exposed near the top of Hasbrouck.
Detailed surface mapping in conjunction with preliminary geological modeling conducted in 2010 strongly suggests the primary structural control to mineralization is northeast to northwest and not east-west as previously believed. Multiple zones of mineralization are presently defined. The “Main” zone consists of two structurally and stratigraphically controlled mineral bodies. Additional areas of mineralization, such as the South Adit Zone, 700 to 1,000 feet south of the Main Zone, are believed to be lateral zones along controlling faults with minimal to no drilling between.
A third-party technical study was completed for Vista in August 2003 and was updated in August 2006. The Hasbrouck study was developed using data from 54,339 feet of drilling, principally comprised of 105 reverse circulation holes totaling 44,400 feet and 22 rotary drill holes totaling 8,980 feet. The drilling database was compiled from work performed by FMC Gold Co., Cordex Syndicate and Franco Nevada Inc. between 1974 and 1988.
The 2010 exploration program consisted of detailed mapping, systematic surface sampling, and drilling 14 core holes for an aggregate of 7,615 feet to verify grade and provide material for metallurgical testing. Allied also revised, in 2010, the geologic model for Hasbrouck based on surface mapping and reinterpretation of drill-hole logging data. Based on encouraging results, an expanded drilling campaign is anticipated in 2011. Allied Nevada has updated the resource model during the first quarter of 2011, and intends to complete an updated mineral resource calculation.
Three Hills
Three Hills is located in southwestern Nevada about 1 mile west of the town of Tonopah in Esmeralda County, Nevada, and about 4.5 miles northwest of the Hasbrouck property described above. Access to the site is via county-maintained gravel roads from the northwest end of town. Three Hills consists of 15 unpatented lode claims totaling approximately 300 acres.
21
Table of Contents
On May 23, 2003, Vista executed a purchase agreement with Newmont Capital, which included both the Hasbrouck property and the Three Hills property. The terms of this agreement are detailed under the Hasbrouck description above. Newmont Capital did not exercise their right to acquire 51% of the properties in August of 2010.
Geology
Three Hills is located in the Walker Lane structural domain of the Basin and Range physiographic province. It is in an area of structural disruption resulting from a series of orogenic events occurring in Paleozoic, Mesozoic and Cenozoic times. Basin and Range high-angle normal faults control the mineralization at Three Hills, where they cut the Siebert Formation. Gold mineralization occurs in a zone of pervasive silicification and in the Siebert Formation and the upper 10 to 30 feet of the Fraction Tuff. The contact between these two units contains consistently higher grades of gold and is more commonly argillized than silicified.
A third-party technical study was completed for Vista in August 2003 and was updated in August 2006. The Three Hills study included data from 62,874 feet of drilling, comprised of 183 reverse circulation holes totaling 54,657 feet, 45 air-track and rotary holes totaling 6,320 feet and 9 diamond drill holes totaling 1,897 feet. The drilling was completed by Echo Bay Mines Ltd., Eastfield Resources, Saga Exploration and Cordex Syndicate between 1974 and 1996.
Maverick Springs
The Maverick Springs project is located in northeast Nevada at the southeast end of the Carlin Trend belt of gold-silver mineralization, approximately half-way between Elko and Ely, Nevada. A gravel road provides immediate access to the property from the Ruby Valley road. The property consists of 246 claims with a total area of approximately 4,920 acres.
On October 7, 2002, Vista completed the acquisition of a 100% interest in the Maverick Springs gold and silver project from Newmont Mining Corporation (“Newmont”) and the Mountain View gold project (described below) from Newmont’s wholly-owned subsidiary Newmont Capital Limited (“Newmont Capital”). Maverick Springs is subject to a lease agreement, between Newmont and Artemis Exploration Company. The lease was entered into on October 1, 2001, and the key terms include: payment of advance minimum royalties of $50,000 on October 1, 2003 and advance minimum royalties of $100,000 on October 1, 2004 , $100,000 on October 1, 2005 and each year thereafter while the agreement is in effect; work commitments of 6,400 feet of exploration drilling, on or before October 1 in each of 2002 (extended by agreement to November 15, 2002), 2003 and 2004 , a preliminary economic evaluation to be conducted by October 1, 2004 which was extended to April 7, 2005; and a net smelter returns royalty based on a sliding scale ranging from 2% to 6%, depending on gold and silver prices at the time of production.
On June 9, 2003, Vista entered into an agreement granting Silver Standard Resources Inc. (“Silver Standard” or “SSRI”) an option to acquire its interest in the silver mineralized material hosted in the Maverick Springs project. Allied Nevada, as successor to Vista, will retain its 100% interest in the gold mineralized material. The agreement with SSRI is subject to the terms of the Newmont purchase agreement. Under the agreement, Silver Standard was to pay $1.5 million over four years, completing the $1.5 million obligation in 2005. Since Silver Standard has satisfied the $1.5 million obligation, all costs incurred for Maverick Springs are now being shared by the two corporations as stated below. Silver Standard and Vista formed a committee to jointly manage exploration of the Maverick Springs project. Allied Nevada, as successor to Vista, has a 45% vote on the committee, and Silver Standard is the operator and has a 55% vote. Future costs will be shared by Silver Standard and Allied Nevada on the same ratio as established for operation of the management committee: Allied Nevada 45% / Silver Standard 55%, subject to standard dilution provisions.
Prior operators have conducted drilling on the Maverick Springs project. In November 2002, Vista completed a 7-hole reverse circulation drill program totaling 7,020 feet on the Maverick Springs project. The program consisted of seven vertical reverse circulation holes, stepped out 500 feet to 2,200 feet from previously identified mineralization. All seven holes encountered flat-lying mineralization, predominantly oxidized to depths of up to 900 feet. The program outlined continuous mineralization in a 2,200-foot by 1,200-foot area, immediately adjacent to known gold-silver mineralization. With additional in-fill drilling, this newly outlined mineralization has the potential to significantly increase the mineralized material.
In October 2003, Vista completed a 16-hole reverse circulation program totaling 14,015 feet, in October 2004, Vista completed a 13-hole reverse circulation program totaling 13,015 feet and in August 2006, Vista completed a 18-hole reverse circulation drill program totaling approximately 16,000 feet. In the 4th quarter of 2008, Silver Standard completed a 5-hole program totaling 5,305 feet. These results indicate the potential for bulk-mineable gold-silver mineralization.
Geology
Maverick Springs can be classified as a Carlin-type or sediment/carbonate hosted disseminated silver-gold deposit. Sediment hosted deposits are common within northern Nevada, although the systems are usually gold dominated with relatively minor amounts of silver. Silver and gold mineralization at Maverick Springs has been interpreted as a roughly antiformal or arch-shaped zone with an axis that plunges shallowly to the south and seems to flatten to horizontal over the northern half of the deposit. The limbs of the arch dip shallowly to moderately at 10-30o to the east and west. Overall, the mineralized zone is elongated in the north-south direction with a length of over 6,000 feet, a width of up to 3,000 feet, and a thickness of commonly 100-300 feet.
Alteration consists of pervasive decalcification, weak to intense silicification and weak alunitic argillization. Massive jasperoid is common in surface exposures and in drill core. Oxidation has affected all sulfides on surface and is pervasive to a depth of at least 400 feet, intermittent to 900 feet, and generally absent below 1,000 feet.
22
Table of Contents
Mountain View
The Mountain View property is located in northwest Nevada near the Blackrock Desert. The property is approximately 15 miles northwest of Gerlach, Nevada in Washoe County; it straddles the boundary between the Squaw Valley and Banjo topographic quadrangles. The property is accessed from Gerlach by traveling approximately 14 miles along Nevada State Highway 447, a paved road, and then approximately one (1) mile east along an unimproved dirt road. On the property, drill roads provide good access to most areas. The property currently consists of 128 claims with a total area of approximately 2,560 acres.
Vista’s acquisition of the Mountain View property was completed along with that of the Maverick Springs property, as described above. To acquire the interest in the Mountain View property, Vista paid cash of $50,000 and issued 56,497 equity units, each unit comprised of one Vista share and a two-year Vista warrant, to Newmont Capital, and Newmont Capital retains a 1.5% NSR. Newmont Capital’s interest in the Mountain View property is subject to an underlying lease and two other royalty arrangements, the principal terms of which are: the underlying lease grants a 50% interest to Newmont in all claims, with a few exceptions where a 5% interest is granted; and the lessee may purchase the remaining interest in the claims for $250,000 at any time. The lessee is obligated to purchase the remaining 50% for $250,000 on achieving commercial production. Also, the lessee shall pay a 1% NSR during production, with advance minimum payments of $25,000 per year. Advanced royalties are deductible from the net smelter returns royalty and cease upon purchase of the remaining interest of the underlying lease. A 1% NSR also applies to certain other claims.
Prior operators have conducted drilling on the Mountain View property. Vista completed a five-hole reverse circulation program totaling 4,330 feet in November 2003. The results indicate the presence of a new zone of bulk mineralization approximately 200 feet east of the known core of mineralization. Vista completed a five-hole reverse circulation program totaling 4,070 feet in 2004, and the results indicate potential bulk-mineable gold mineralization and the down-dip extension of higher-grade gold mineralization.
Geology
The dominant rock types in the area are Miocene volcanics and interbedded volcaniclastic sediments. Minor greenschist facies Permo-Triassic strata occur to the northeast and a large body of granodiorite makes up the bulk of the Granite Range to the east and south.
The Miocene lithologies consist of mafic tuffs, rhyolite tuffs and flows, volcaniclastic sediments and basalts. These units are separated from the Granite Range to the east by a range front normal fault that dips steeply to the southwest. The Severance deposit is hosted by a unit known as the Severance rhyolite that is sandwiched between the range front fault to the northeast and older Tertiary tuffs, flows and volcaniclastic sediments to the southwest.
Structure on the property is dominated by northwest and northeast trending faults. Major fault offsets occur along the range-front fault system and these are offset by the northeast trending structures. Recent alluvium is offset by the range front faults.
Wildcat
Wildcat is located about 35 miles northwest of Lovelock and 26 miles south of the Hycroft Mine in Pershing County, Nevada. The property is accessed, from Lovelock, by traveling 15 miles along Nevada State Route 399, a paved road, and then approximately 16 miles along a well-maintained gravel road through Sage Valley. The east property boundary is approximately 2.5 miles west of the road through Sage Valley, along a gravel road. Four-wheel drive roads traverse the property. The project consists of 284 unpatented claims and 4 patented claims, comprising approximately 5,900 acres.
During September and October 2003, Vista concluded due diligence reviews and executed formal purchase agreements to acquire the Wildcat project and the associated exploration data in three separate transactions. On September 23, 2003, Vista purchased 71 unpatented mining claims from Monex Exploration. On commencement of commercial production, Allied Nevada will make a one-time production payment in the amount of $500,000. Thirteen of the claims are subject to an underlying 0.4% NSR, and the remaining 58 claims are subject to an underlying 1% NSR.
On October 12, 2003, Vista purchased a 100% interest in the Vernal unpatented mining claim from David C. Mough and Jody Ahlquist Mough.
On October 28, 2003, Vista purchased four patented mining claims and exploration data from Sagebrush Exploration, Inc. The four patented claims are subject to an underlying net smelter returns royalty of 1% for gold production between 500,000 and 1,000,000 ounces, increasing to 2% on production in excess of 1,000,000 ounces.
Geology
Wildcat lies in the Seven Troughs Range, which is underlain by Triassic and Jurassic sedimentary rocks and has been intruded by Cretaceous granodiorite. Volcanic domes and plugs of rhyolite, quartz latite, trachyte, and andesite have been emplaced by Tertiary volcanism. Post mineral Tertiary flows of pyroclastic debris, and vitrophyres of rhyolite, quartz latite, trachyte, and andesite composition blanket much of the area.
23
Table of Contents
The property contains at least two aerially extensive breccia bodies located at the intersection of through-going fault zones. Four areas; Hero/Tag, Main, Northeast, and Knob 32 are located within the southern breccia body and contain the majority of drilling and all of the known resource. These four areas are geologically similar with mineralization straddling the contact between granodiorite and overlying tuff within the breccia body. Mineralization hosted in the tuff generally tends to be lower grade disseminated style of mineralization represented by pervasive and intense silicification. The underlying granodiorite also contains low-grade disseminated style of mineralization with areas of higher-grade associated with quartz vein stockwork. Generally, the granodiorite has higher grade and is not silicified. Any silicification is restricted to adjacent veins and veinlets. Peripheral to the breccia bodies, discrete mineralized banded veins in the granodiorite were exploited by historical mining and were generally not targeted by drilling. Deeper roots to the mineralized breccia bodies also have not been explored. A second aerially extensive mineralized breccia body is located 0.9 miles to the northwest in the Cross Roads area and is predominantly defined by surface samples only.
Work completed in 2010 consisted of surface mapping, sampling, and a geophysical survey. Permits have been received from the Bureau of Land Management and State of Nevada to conduct an initial drill program in 2011. Drilling will focus on initial testing of the Cross Roads breccia body, banded veins proximal to the southern breccia body, and potential roots to the southern breccia body. The Company anticipates submitting for additional permits for additional drilling activities in the first half of 2011.
Pony Creek/Elliot Dome Property
The Pony Creek/Elliot Dome Property is located in the Larrabee mining district of Elko County, Nevada, in the southern half of the Carlin Trend, 28 miles southeast of the town of Carlin and 19 miles south of Newmont Gold Company’s Rain Mine. The property is accessed by traveling south from Carlin along State Highway 278 (a paved road), and then west on the Pony Creek Road.
The Pony Creek/Elliot Dome Property consists of 895 unpatented lode mining claims (approximately 17,900 acres). The property is located across the crest of the southern part of the Pinyon Range at elevations ranging from 6,600 feet to about 8,000 feet. Access to the property from the west is by traveling the Indian Pony road off State Highway 278, or from the east via the Red Rock Ranch road off a junction with State highway 228.
The exploration agreement previously in effect with Mill City was terminated in 2009 and Allied Nevada has regained full title to the property.
Prior to commencement of any surface disturbance, permits must be obtained from the BLM which permits exploration activities and a reclamation bond must also be posted.
Newmont Exploration Ltd. (“Newmont Exploration”) conducted regional exploration programs in search of additional gold deposits along the Carlin trend. In 1980 a stream-sediment sampling program identified anomalous gold and arsenic associated with an altered rhyolite body at what is now the Pony Creek Property. Newmont located 100 claims in 1980 to cover the prospect and located 80 more claims in 1982 to cover additional ground. Newmont began drilling in 1981 and conducted drill programs through 1985. Newmont conducted additional drilling campaigns in 1987 and 1989 with limited success. An option was acquired by Westmont Mining, Inc. in 1990, and in April of 1993 Quest International Management Services, Inc. (formerly Ramrod Gold, Inc.) acquired Westmont. Quest then joint ventured the property with Uranerz U.S.A., Inc. in 1994. Uranerz drilled a total of 15 holes in 1994-1995 before terminating the JV in 1995. In 1997 Quest purchased Newmont’s remaining interest in the property and signed a JV agreement with Barrick. Four holes were drilled by Barrick before they terminated the agreement in 1998. In 1999, Quest International Resources was acquired by Standard Mining Co. and it abandoned the Pony Creek property. Mr. Pescio acquired Pony Creek by staking claims in the fall of 1999. Homestake optioned the property shortly afterward. A year later, after drilling 5 reverse circulation drill holes, Homestake terminated their agreement with Mr. Pescio. Nevada Contact Inc. optioned the property from the Pescios in 2001 and drilled 8 holes before terminating the agreement in early 2003. In July 2003, Mill City optioned the property from the Pescios. The Mill City agreement was terminated in 2009.
Geology
Most of the property is comprised of dry, sagebrush-covered and grass-covered hills with a few juniper and pinyon pines. The climate is favorable for year-round mining and exploration may be done from May through November.
The Pony Creek property lies along the axis of a regional Mesozoic anticline that parallels the crest of the Pinyon Range. The lithologies of the region include the eastern carbonate assemblage and the mixed overlap assemblage. The Late Devonian Early Mississippian Roberts Mountain Thrust and the post Pinyon Anticline, Mesozoic thrust faults have moved the western assemblage and
24
Table of Contents
a significant portion of the overlap series over the eastern facies. High-angle northeast and northwest trending faults and north trending faults, all with oblique displacement, and a younger set of east trending normal faults, are important elements in the structural framework of the region. Gold mineralization in the Bowl area is related to felsite breccias. In the Pot Holes area, a lens of fragmental felsite approximately 60 feet thick intersects the low-angle fault that is at the base of the Robinson Thrust plate. The felsite breccias of the Bowl area may be fault breccia to explosion breccias. Alteration within the intrusive includes quartz-sericite-pyrite (Qsp) associated with north and northeast trending shears.
Other Exploration Properties
In general, these properties are those for which insufficient drilling and geologic investigations have been completed to define mineralized materials. Other Exploration Properties may include properties that the Company does not have a significant controlling interest or joint venture on.
Certain of these exploration properties have been optioned and leased to other exploration companies in return for production royalties averaging approximately 3.0% advance minimum royalties and, on some of the properties, work commitments. For the properties under lease, the lessee is typically responsible for making the land payments including the BLM fees and county property tax payments.
BLM filing fees and county property tax payments were paid for approximately 7,600 unpatented mining claims held by Allied Nevada.
We will pursue strategic options for the exploration properties that could include development through exploration programs, joint ventures, royalty agreements, or the sale or release of the mineral property.
| Item 3. | Legal Proceedings |
From time to time, the Company is a party to routine litigation and proceedings that are considered part of the ordinary course of its business. The Company is not aware of any material current, pending, or threatened litigation.
| Item 4. | Reserved. |
| Item 4B. | Mine Safety Disclosure |
Allied Nevada considers health, safety and environmental stewardship to be a core value for the Company and received a “Sentinels of Safety” award at Hycroft for 2008 in 2009. Allied Nevada has a mandatory safety and health program including employee training, risk management, workplace inspection, emergency response, accident investigation and program auditing. The Company considers this program to be essential at all levels to ensure that employees and the Company conduct themselves in an environment of exemplary health, safety and environmental governance
Our operations and exploration properties are subject to regulation by the Federal Mine Safety and Health Administration (“MSHA”) under the Federal Mine Safety and Health Act of 1977 (the “Mine Act”). MSHA inspects our mines on a regular basis and issues various citations and orders when it believes a violation has occurred under the Mine Act. Following passage of The Mine Improvement and New Emergency Response Act of 2006, MSHA significantly increased the numbers of citations and orders charged against mining operations. The dollar penalties assessed for citations issued has also generally increased in recent years.
The following disclosures are provided pursuant to the Dodd-Frank Wall Street Reform and Consumer Protection Act (the “Act”) made law in July 2010, which requires certain disclosures by companies required to file periodic reports under the Securities Exchange Act of 1934, as amended, that operate mines regulated under the Mine Act. Under the Act, the SEC is authorized to issue rules and regulations to carry out the purposes of these provisions. While we believe the following disclosures meet the requirements of the Act, it is possible that any rule-making by the SEC will require disclosures to be presented in a form that differs from this presentation.
Mine Safety Information.
Whenever MSHA believes a violation of the Mine Act, any health or safety standard or any regulation has occurred, it may issue a citation which describes the alleged violation and fixes a time within which the operator (e.g. our subsidiary, Hycroft Resources & Development Inc.) must abate the alleged violation. In some situations, such as when MSHA believes that conditions pose a hazard to miners, MSHA may issue an order removing miners from the area of the mine affected by the condition until the alleged hazards are corrected. When MSHA issues a citation or order, it generally proposes a civil penalty, or fine, as a result of the alleged violation, that the operator is ordered to pay. Citations and orders can be contested and appealed, and as part of that process, are often reduced in severity and amount, and are sometimes dismissed. The following table reflects citations and orders issued to us by MSHA during the year ended December 31, 2010 and pending legal actions before the Federal Mine Safety and Health Review Commission (the “Commission”) as of December 31, 2010. The proposed assessments for the year ended December 31, 2010 were taken from the MSHA data retrieval system as of December 31, 2010.
Additional information about the Act and MSHA references used in the table follows.
| • | Section 104 Citations: Citations received from MSHA under section 104 of the Mine Act, which includes citations for health or safety standards that could significantly and substantially contribute to a serious injury if left unabated. |
25
Table of Contents
| • | Section 104(b) Orders: Orders issued by MSHA under section 104(b) of the Mine Act, which represents a failure to abate a citation under section 104(a) within the period of time prescribed by MSHA. This results in an order of immediate withdrawal from the area of the mine affected by the condition until MSHA determines that the violation has been abated. |
| • | Section 104(d) Citations and Orders: Citations and orders issued by MSHA under section 104(d) of the Mine Act for unwarrantable failure to comply with mandatory health or safety standards. |
| • | Section 110(b)(2) Violations: Flagrant violations issued by MSHA under section 110(b)(2) of the Mine Act. |
| • | Section 107(a) Orders: Orders issued by MSHA under section 107(a) of the Mine Act for situations in which MSHA determined an “imminent danger” (as defined by MSHA) existed. |
| • | Pending Legal Actions: Pending legal actions before the Commission as required to be reported by Section 1503(a) (3) of the Act. The Commission is an independent adjudicative agency that provides administrative trial and appellate review of legal disputes arising under the Mine Act. These cases may involve, among other questions, challenges by operators to citations, orders and penalties they have received from MSHA or complaints of discrimination by miners under Section 105 of the Mine Act. The following is a brief description of the types of legal actions that may be brought before the Commission. |
| • | Contests of Citations and Orders — A contest proceeding may be filed with the Commission by operators, miners or miners’ representatives to challenge the issuance of a citation or order issued by MSHA. |
| • | Contests of Proposed Penalties (Petitions for Assessment of Penalties) — A contest of a proposed penalty is an administrative proceeding before the Commission challenging a civil penalty that MSHA has proposed for the alleged violation contained in a citation or order. The validity of the citation may also be challenged in this proceeding as well. |
| Mine1 |
Section 104 Citations2 |
Sections 104(b) Orders2 |
Section 104(d) Citations and Orders2 |
Section 110(b) Violations |
Section 107(a) Orders |
Proposed MSHA Assessments (US$)3 |
Pending Legal Actions |
|||||||||||||||||||||
| Hycroft |
19 | — | 4 | — | — | $ | 10,621 | — | ||||||||||||||||||||
Pattern or Potential Pattern of Violations
During the year ended December 31, 2010, Hycroft did not receive written notice from MSHA of (a) a pattern of violations of mandatory health or safety standards that are of such nature as could have significantly and substantially contributed to the cause and effect of mine health or safety hazards under section 104(e) of the Mine Act or (b) the potential to have such a pattern.
“AMR” means advance minimum royalty.
“Assay” means to test minerals by chemical or other methods for the purpose of determining the amount of valuable metals contained.
“Breccia” means rock consisting of fragments, more or less angular, in a matrix of finer-grained material or of cementing material.
“Claim” means a mining interest giving its holder the right to prospect, explore for and exploit minerals within a defined area.
“Cut-off grade” means the grade below which mineralized material will be considered waste.
“Deposit” means an informal term for an accumulation of mineral ores.
“Development Project” is one which is engaged in the preparation of an established commercially mineable deposit for its extraction but which is not yet in production. This stage occurs after completion of a feasibility study.
“Diamond drill” means a rotary type of rock drill that cuts a core of rock and is recovered in long cylindrical sections, two centimeters or more in diameter.
| 1 | The table above reflects citations and orders issued to us by MSHA during year ended December 31, 2010, and the pending legal actions before the Commission as of December 31, 2010. The definition of “mine” under section 3 of the Mine Act includes the mine, as well as other items used in, or to be used in, or resulting from, the work of extracting minerals, such as land, structures, facilities, equipment, machines, tools, and minerals preparation facilities. |
| 2 | Two Section 104 Citations and one Section 104(d) Citation and/or Orders were subject to contest as of December 31, 2010. |
| 3 | Represents the total dollar value of the proposed assessment from MSHA under the Mine Act pursuant to the citations and or orders preceding such dollar value in the corresponding row. |
26
Table of Contents
“Exploration Projects” is one which is engaged in the search for mineral deposits (reserves), which are not in either the development or production stage.
“Fault” means a fracture in rock along which there has been displacement of the two sides parallel to the fracture.
“Heap leach” means a gold extraction method that percolates a cyanide solution through ore heaped on an impervious pad or base.
“Mineralization” means the concentration of metals within a body of rock.
“Mineralized material” is a body that contains mineralization which has been delineated by appropriately spaced drilling and/or underground sampling to support a sufficient tonnage and average grade of metal(s). Such a deposit does not qualify as a reserve until a comprehensive evaluation based upon unit cost, grade, recoveries, and other material factors conclude legal and economic feasibility.
“NI 43-101” means “National Instrument 43-101—Standards of Disclosure for Mineral Projects of the Canadian Securities Administrators.”
“NSR” means net smelter return royalty.
“opt” or “oz/ton” means ounces per ton.
“Ore” means material containing minerals that can be economically extracted.
“Ounce” means a troy ounce.
“Oxide” means mineralized rock in which some of the original minerals have been oxidized (i.e., combined with oxygen). Oxidation tends to make the ore more porous and permits a more complete permeation of cyanide solutions so that minute particles of gold in the interior of the minerals will be more readily dissolved.
“Probable reserves” means reserves for which quantity and grade and/or quality are computed from information similar to that used for proven reserves, but the sites for inspection, sampling and measurement are farther apart or are otherwise less adequately spaced. The degree of assurance, although lower than that for proven reserves, is high enough to assume continuity between points of observation.
“Production Stage” is one engaged in the exploitation of a mineral deposit (reserve).
“Proven reserves” means reserves for which (a) quantity is computed from dimensions revealed in outcrops, trenches, workings or drill holes; grade and/or quality are computed from the results of detailed sampling and (b) the sites for inspection, sampling and measurement are spaced so closely and the geologic character is so well defined that size, shape, depth, and mineral content of reserves are well-established.
“Recovery” means that portion of the metal contained in the ore that is successfully extracted by processing, expressed as a percentage.
“Reserves” or “ore reserves” mean that part of a mineral deposit, which could be economically and legally extracted or produced at the time of the reserve determination.
“Sampling” means selecting a fractional, but representative, part of a mineral deposit for analysis.
“Sediment” means solid material settled from suspension in a liquid.
“Stockwork” means a rock mass interpenetrated by small veins of mineralization.
“Strike”, when used as a noun, means the direction, course or bearing of a vein or rock formation measured on a level surface and, when used as a verb, means to take such direction, course or bearing.
“Stripping ratio” means the ratio of waste to ore in an open pit mine.
“Sulfide” means a compound of sulfur and some other element.
“Tailings” means material rejected from a mill after most of the valuable minerals have been extracted.
“Ton” means a short ton (2,000 pounds).
“Vein” means a fissure, fault or crack in a rock filled by minerals that have traveled upwards from some deep source.
“Volcaniclastic” means clastic (made up of fragments of preexisting rocks) rock chiefly composed of volcanic material derived by ejection of volcanic material from a volcanic vent.
“Waste” means rock lacking sufficient grade and/or other characteristics of ore.
27
Table of Contents
| Item 5. | Market for Registrant’s Common Equity, Related Stockholder Matters and Issuer Purchases of Equity Securities |
Our common stock is listed on the NYSE Amex and the Toronto Stock Exchange (“TSX”) under the symbol “ANV”. Allied Nevada commenced trading on each of these exchanges on May 10, 2007. The following table sets out the reported high and low sale prices as reported by the exchanges.
| NYSE Amex ($) |
Toronto Stock Exchange (CDN$) |
|||||||||||||||||
| High | Low | High | Low | |||||||||||||||
| 2011 | 1st quarter (through February 22) |
30.74 | 23.62 | 30.25 | 23.48 | |||||||||||||
| 2010 | 1st quarter |
16.57 | 12.18 | 16.84 | 13.00 | |||||||||||||
| 2nd quarter |
22.38 | 16.25 | 23.17 | 16.35 | ||||||||||||||
| 3rd quarter |
27.50 | 15.70 | 28.37 | 16.23 | ||||||||||||||
| 4th quarter |
28.67 | 22.46 | 28.84 | 23.00 | ||||||||||||||
| 2009 | 1st quarter |
5.85 | 3.70 | 7.29 | 4.59 | |||||||||||||
| 2nd quarter |
8.85 | 5.39 | 10.10 | 6.40 | ||||||||||||||
| 3rd quarter |
9.79 | 7.47 | 10.50 | 8.70 | ||||||||||||||
| 4th quarter |
15.28 | 9.14 | 15.90 | 9.89 | ||||||||||||||
On February 22, 2011, the last reported sale price of our common stock on the NYSE Amex was $29.11 and on the TSX was CDN$28.76. As of February 22, 2011, there were 88,999,553 shares of our common stock issued and outstanding, and we had 142 registered shareholders of record.
We have never paid dividends or repurchased equity. While any future transactions of this nature will be determined by our directors after consideration of our earnings, financial condition and other relevant factors, it is currently expected that available cash resources will be utilized in connection with the ongoing acquisition, exploration and evaluation programs and development projects of Allied Nevada.
See “Part III—Item 11. Executive Compensation” for information relating to our equity compensation plans.
Performance Graph
The following performance graph and related information shall not be deemed “soliciting material” or to be “filed” with the Securities and Exchange Commission, nor shall such information be incorporated by reference into any future filing under the Securities Act of 1933 or Securities Exchange Act of 1934, each as amended, except to the extent that we specifically incorporate it by reference in such filing.
The following graph compares the cumulative total shareholder return of Allied Nevada common stock with the cumulative total shareholder return of the S&P 500 and the PHLX Gold/Silver Sector IndexSM, assuming reinvestment of dividends on December 31 of each year indicated. The graph assumes $100 invested at the per share closing price on NYSE Amex in Allied Nevada and each of the indices on May 10, 2007. Because Allied Nevada’s common stock commenced trading on May 10, 2007, measurement periods are limited to December 31, 2007, 2008, 2009, and 2010, respectively.
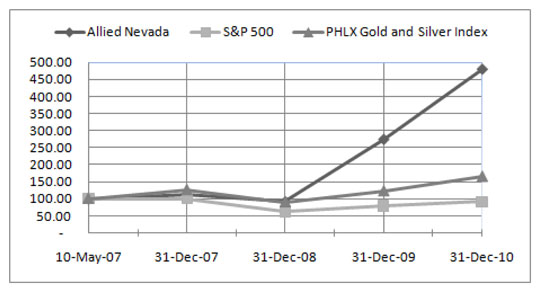
28
Table of Contents
Recent Sales of Unregistered Securities
The Company had no sales of unregistered securities during the year ended December 31, 2010.
| Item 6. | Selected Financial Data |
Set forth below are selected consolidated financial data for each of the five fiscal years ended December 31, 2006 through 2010. For all periods prior to the effective date of the Arrangement Agreement, the financial statements from which these data are derived reflect the financial position and results for subsidiaries of Vista that held Nevada-based mining properties and related assets that were transferred to Allied Nevada as part of the Arrangement Agreement (“Vista Nevada”) and do not include any historical information on the properties that were acquired by Allied Nevada from the Pescios, as such acquisition is considered an asset purchase and not the purchase of a business. Please see “Part II—Item 7. Management’s Discussion and Analysis of Financial Condition and Results of Operations—Basis of Presentation” and “Part I—Item 1. Business—Formation of Allied Nevada” for further information on the derivation of these financial statements and the formation of the Company. Accordingly, for periods prior to May 10, 2007, the financial statements of Allied Nevada as presented herein are not indicative of results of operations of Allied Nevada as it is now constituted.
We selected the statement of loss data for the year ended December 31, 2006 and the balance sheet data as of December 31, 2006 from Vista Nevada’s audited Consolidated Financial Statements not included herein. See “Part II—Item 8. Financial Statements and Supplementary Data.” You should read the information presented below in conjunction with “Part II—Item 7. Management’s Discussion and Analysis of Financial Condition and Results of Operations” and the consolidated financial statements of Allied Nevada and related notes included herein. See “Part II—Item 8. Financial Statements and Supplementary Data.”
29
Table of Contents
Selected Financial Data
U.S. dollars in thousands
| Years Ended December 31, | ||||||||||||||||||||
| Results of operations |
2010 | 2009 | 2008 | 2007 | 2006 | |||||||||||||||
| Sales |
$ | 130,930 | $ | 43,204 | $ | — | $ | — | $ | — | ||||||||||
| Cost of sales |
47,646 | 17,411 | — | — | — | |||||||||||||||
| Net income (loss) |
34,128 | 8,451 | (79,641 | ) | (11,265 | ) | (2,465 | ) | ||||||||||||
| Basic net income (loss) per share |
0.41 | 0.13 | (1.49 | ) | (0.42 | ) | N/A | |||||||||||||
| Diluted net income (loss) per share |
0.41 | 0.13 | (1.49 | ) | (0.42 | ) | N/A | |||||||||||||
| December 31, | ||||||||||||||||||||
| Financial position |
2010 | 2009 | 2008 | 2007 | 2006 | |||||||||||||||
| Cash and cash equivalents |
$ | 337,829 | $ | 91,581 | $ | 16,511 | $ | 20,105 | $ | 7 | ||||||||||
| Ore on leachpads |
49,357 | 34,179 | 2,737 | — | — | |||||||||||||||
| Mineral properties |
35,522 | 35,845 | 36,583 | 76,394 | 8,892 | |||||||||||||||
| Plant and equipment |
66,081 | 35,367 | 29,294 | 1,037 | 997 | |||||||||||||||
| Total assets |
567,352 | 252,425 | 112,259 | 106,514 | 17,303 | |||||||||||||||
| Current capital lease obligations |
3,215 | 1,298 | 602 | 11 | 10 | |||||||||||||||
| Current asset retirement obligation |
463 | 476 | 98 | 133 | — | |||||||||||||||
| Non-current capital lease obligations |
11,104 | 4,700 | 2,392 | 12 | 23 | |||||||||||||||
| Non-current asset retirement obligation |
6,303 | 6,167 | 5,735 | 5,167 | 4,663 | |||||||||||||||
| Non-current other accrued liabilities |
6,850 | 2,686 | — | — | — | |||||||||||||||
| Total liabilities |
44,598 | 29,245 | 18,653 | 6,758 | 4,848 | |||||||||||||||
| Total shareholders’ equity |
522,754 | 223,180 | 93,606 | 99,756 | 12,455 | |||||||||||||||
30
Table of Contents
| Item 7. | Management’s Discussion and Analysis of Financial Condition and Results of Operations |
General
Allied Nevada commenced operations on May 10, 2007, following Vista’s transfer to us of the Vista Nevada Assets, along with cash, and the transfer to us by the Pescios of the Pescio Nevada Assets. Since May 10, 2007, we have been conducting our business of evaluation, acquisition, exploration and advancement of gold exploration and development projects in the state of Nevada. Before the Arrangement Agreement was completed, we had no properties or property interests, were not yet conducting business operations and had no shareholders other than Vista. For periods prior to the effective date of the Arrangement Agreement, the financial statements, related discussion and analysis and other financial information in this document were prepared as relates to the subsidiaries of Vista that held Nevada-based mining properties and related assets that were transferred to Allied Nevada as part of the Arrangement Agreement. In our SEC filings prior to the completion of the Arrangement Agreement, we referred to these subsidiaries as “Vista Gold Corp—Nevada exploration properties” or “Vista Nevada”. Also see “Part I—Item 1.—Business” for discussion of the history and a general description of the business of Allied Nevada and the Company’s business strategy.
The discussion and analysis of the consolidated operating results and financial condition of Allied Nevada for the year ended December 31, 2010 has been prepared based on information available to us as of February 25, 2011. This discussion should be read in conjunction with the consolidated financial statements of Allied Nevada for the three years ended December 31, 2010 and the related notes thereto, which have been prepared in accordance with U.S. GAAP. All amounts stated herein are in U.S. dollars, unless otherwise noted.
Outlook
In 2011, we expect Hycroft to mine approximately 44.1 million tons of material, including 24.3 million tons of ore at average grades of 0.014 oz/ton gold. Average grades in 2011 are expected to be lower than the average grades mined in 2010 due to a lower grade phase of mining of the Brimstone pit. The silver to gold production ratio is expected to be 2.5 ounces of silver for each ounce of gold.
Gold sales for 2011 are expected to be 125,000-135,000 ounces at an expected cost of sales per ounce of gold sold1 of $450-$490 (with silver as a byproduct credit). Production is expected to be weaker in the first half of 2011 and increase through the remainder of the year as the impact of mining more tons and placing more ore begins to take effect. The overall strip ratio for 2011 is expected to be less than 1:1. The strip ratio for the first quarter of 2011 is expected to be higher than 1:1, and will decline through the remainder of the year as the mine completes the stripping program commenced in 2010 to remove waste and allow access to an area of ore in the Brimstone pit and a new mining area, Cut 5. Cost of sales per ounce of gold sold1 is expected to be higher in 2011 compared to 2010 due to higher commodity price expectations, the lower grade mining phase and an increased mining rate as the mine continues to ramp up the oxide expansion. Cost of sales per ounce of gold sold1 is calculated assuming a fuel price of $100/barrel and a $22 per ounce silver price. It is expected that a $10/barrel change in the world fuel price would results in approximately a $1 per ounce change in operating expenses.
Company-wide exploration expense is expected to be $18.0 million with approximately $4.5 million of developmental drilling and related costs being capitalized. The exploration program at Hycroft includes 196,800 feet of planned drilling with work in the first quarter focused on infill and engineering drilling for the initial milling feasibility study utilizing a fleet of seven to ten core and reverse circulation rigs. For the remainder of the year, we expect to use two or three rigs to test additional targets outside of the current known mineralization at Hycroft. At Hasbrouck, exploration plans are focused on advancing the project along the development path with a goal of completing a preliminary economic assessment in early 2011. An exploration program has been designed at Wildcat to test a number of encouraging targets identified through the successful 2010 field program.
Capital expenditures in 2011 are expected to total approximately $110 million, a portion of which may be purchased through capital leases if commercially acceptable terms are available. Significant capital projects include: expansion of the mobile equipment fleet at Hycroft with additional 320-ton haul trucks and larger capacity shovels ($53 million); support building improvements, increased process plant capacity modifications and ongoing leach pad expansion at Hycroft ($22 million); capitalized stripping and drilling ($9 million); and other capitalized spending ($26 million).
The Company continues to implement near and long-term opportunities with a view to increasing production, reducing costs and extending the life of the Hycroft mine. These initiatives include:
| 1. | Continued implementation of the Hycroft Accelerated Oxide Heap Leach Project: The mine has been successful in initiating the accelerated oxide heap leach plan with the addition of a crushing circuit, completion of the 2010 leach pad expansion and integration of the larger scale mining equipment. The operating plan will be to continue increasing the mining rate as new equipment comes on-line throughout the year. The goal for 2011 is to increase the mining rate to 47.8 million tons (from 24 million in 2010) and ultimately to 81.0 million tons by the end of 2012. By tripling the mining rate, the mine expects to increase gold production to average over 260,000 ounces annually by the end of 2012. |
| 1 | Allied Nevada uses the non-GAAP financial measure “cost of sales per ounce of gold sold” in this document. Please see the section titled “Non-GAAP Measures” for further information regarding these measures. |
31
Table of Contents
| 2. | Hycroft milling project development: Based on the positive results of the milling scoping studies completed in 2010, the Company intends to complete an initial feasibility study for a milling scenario designed to develop the most economically viable solutions for extracting the large sulfide resource at Hycroft. It is currently expected that this study will be completed by mid-2011. |
| 3. | Develop exploration properties: A greater emphasis will be placed on regional exploration targets and advancing potential development properties in 2011. In early 2011, we intend to publish a preliminary economic assessment for Hasbrouck. Exploration programs have been designed for other advanced exploration projects in 2011. The reserve model and economic analyses will then be updated. Initial drilling of Wildcat and Illipah properties will also be conducted during 2011. |
Non-GAAP Measures
Allied Nevada provides non-GAAP measures of “cost of sales per ounce of gold sold” and “cost of sales, net of byproduct credits” in this document. The Company believes that, in addition to conventional measures prepared in accordance with United States generally accepted accounting principles (U.S. “GAAP”), stakeholders use non-GAAP measures to evaluate the Company’s performance and its ability to generate cash flow. The above non-GAAP measures do not have any standardized meaning prescribed by GAAP and, therefore, may not be comparable to similar measures presented by other companies. Accordingly, the above measures are intended to provide additional information and should not be considered in isolation or as a substitute for measures of performance prepared in accordance with GAAP.
The calculation of these non-GAAP measures are presented in the table below for the years ended December 31, 2010 and 2009. There were no comparable measures for 2008 as the Company had no sales in 2008:
| Year
ended December 31 2010 |
Year
ended December 31, 2009 |
|||||||
| Cost of sales (thousands) |
$ | 47,646 | $ | 17,411 | ||||
| Less: Silver revenues (thousands) |
$ | (4,842 | ) | $ | (806 | ) | ||
| Cost of sales, net of byproduct credits (thousands) |
$ | 42,804 | $ | 16,605 | ||||
| Gold ounces sold |
102,483 | 42,358 | ||||||
| Cost of sales per gold ounce sold |
$ | 418 | $ | 392 | ||||
Basis of Presentation
The Consolidated Financial Statements of Allied Nevada Gold Corp. and its subsidiaries (collectively, “Allied Nevada” or the “Company”), have been prepared in accordance with generally accepted accounting principles in the United States. The results of operations are not necessarily indicative of the operating results of future years.
Critical Accounting Policies and Estimates
Use of Estimates
The preparation of the Company’s Consolidated Financial Statements requires management to make estimates and assumptions that affect the reported amounts of assets and liabilities and the related disclosure of contingent assets and liabilities at the date of the Consolidated Financial Statements and the reported amounts of expenses during the reporting period. The more significant areas requiring the use of management estimates and assumptions relate to mineral reserves that are the basis for future cash flow estimates utilized in impairment calculations and units of production amortization calculations; environmental, reclamation and closure obligations; estimates of fair value for asset impairments; estimates of recoverable gold in leach pad inventories; net realizable value of ore on leach pads; and the valuation allowance for deferred tax assets and uncertain tax positions. The Company bases its estimates on various assumptions that are believed to be reasonable under the circumstances. Accordingly, actual results may differ significantly from these estimates under different assumptions or conditions.
Principles of Consolidation
The Consolidated Financial Statements include the accounts of Allied Nevada Gold Corp. and its wholly-owned subsidiaries. All significant intercompany balances and transactions have been eliminated.
Cash and Cash Equivalents
Cash and cash equivalents consist of all cash balances and highly liquid investments with an original maturity of three months or less. Because of the short maturity of these investments, the carrying amounts approximate their fair value. Cash and cash equivalents are invested in a highly liquid money market fund. Restricted cash is excluded from cash and cash equivalents and is included in other current and long-term assets.
32
Table of Contents
Ore on Leach Pads and Inventories
As described below, costs that are incurred in or benefit the productive process are accumulated as ore on leach pads and inventories. Ore on leach pads and inventories are carried at the lower of average cost or net realizable value. Net realizable value represents the estimated future sales price of the product based on current metals prices, less the estimated costs to complete production and bring the product to sale.
The recovery of gold from the Hycroft Mine’s oxide ore is accomplished through the heap leaching process. Under this method, oxide ore is placed on leach pads where it is treated with a chemical solution, which dissolves the gold contained in the ore. The resulting “pregnant” solution is further processed in a plant where doré is produced. Costs are added to ore on leach pads based on current mining and processing costs, including applicable depreciation, depletion and amortization relating to mining and processing operations. Costs are removed from ore on leach pads as ounces are recovered based on the average cost per estimated recoverable ounce of gold on the leach pad.
The estimates of recoverable gold on the leach pads are calculated from the quantities of ore placed on the leach pads (measured in tons), the grade of ore placed on the leach pads (based on assay data), a recovery percentage (based on ore type), and the processing method (crushed ore or run of mine ore).
Although we expect to reconcile the quantities of recoverable gold placed on the leach pads by comparing the grades of ore placed on pads to the quantities of gold actually recovered (metallurgical balancing), the nature of the leaching process inherently limits the ability to precisely monitor inventory levels. As a result, we expect the metallurgical balancing process will be constantly monitored and estimates will be refined based on actual results over time. Variations between actual and estimated quantities resulting from changes in assumptions and estimates that do not result in write-downs to net realizable value will be accounted for on a prospective basis.
In-process Inventory
In-process inventories represent materials that are currently in the process of being converted to a saleable product. Conversion processes currently being used by the Company include a Merrill-Crowe zinc-precipitation process (“Merrill-Crowe process”) and a Carbon in Column solution recovery process (“CIC process”). In-process material is measured based on assays of the material fed into the process and the projected recoveries of the respective plants. In-process inventories are valued at the average cost of the material fed into the process attributable to the source material coming from the leach pads plus the in-process conversion costs, including applicable depreciation relating to the process facilities incurred to that point in the process.
Precious Metals Inventory
Precious metals inventories include doré and gold and silver bullion. Precious metals that result from the Company’s mining and processing activities are valued at the average cost of the respective in-process inventories incurred prior to the refining process.
Materials and Supplies Inventory
Materials and supplies are valued at the lower of average cost or net realizable value. Cost includes applicable taxes and freight.
Plant and Equipment
Expenditures for new facilities or equipment and expenditures that extend the useful lives or expand the production capacity of existing facilities or equipment are capitalized and depreciated using the straight-line or units of production method at rates sufficient to depreciate such costs over the estimated productive lives of such facilities based on proven and probable reserves.
Planned major maintenance activities are accounted for using the deferral method. Under the deferral method, applicable costs incurred are deferred and charged to expense on a straight-line basis over the period to the next estimated planned major maintenance, which we estimate to be a period of twelve months based on frequency of such activities for our mining equipment. The activities associated with such planned major maintenance cannot be performed while the equipment is in service and, as such, are completed during a planned major maintenance activity. The costs deferred are not otherwise routinely performed to maintain the intended operating capability of the equipment. Repairs and maintenance activities are charged to expense as incurred.
Mine Development and Stripping Costs
Mine development costs consist primarily of the cost of removing overburden and waste materials (“stripping costs”) incurred prior to production as defined in Accounting Standards Codification 930-330-20, and development drilling and related assaying costs to delineate an ore body. The above costs incurred before mineralization is classified as proven and probable reserves are expensed as incurred.
33
Table of Contents
Capitalization of mine development costs, that meet the definition of an asset, begins once mineralization is classified as proven and probable. The cost of removing overburden and waste materials to access proven and probable reserves prior to the production phase of a mine are referred to as “pre-stripping costs” and are capitalized during the development of an open pit mine. Where multiple open pits exist using common processing facilities, pre-stripping costs are capitalized at each pit. Normal stripping costs are included as a component of inventory. Stripping costs in excess of those considered to be normal are expensed as incurred.
Drilling and related costs are capitalized for an ore body where proven and probable reserves exist and the activities are directed at obtaining additional information on the ore body or converting non-reserve mineralization to proven and probable reserves. All other drilling costs are expensed as incurred. Drilling costs incurred during the production phase for ore control are allocated to inventory costs and then included as a component of cost of sales.
Mine development costs are amortized using the units of production (“UOP”) method based upon projected recoverable ounces in proven and probable reserves. Projected recoverable ounces are determined by the Company based upon its proven and probable reserves and estimated metal recovery associated with those reserves.
Mineral Properties
Mineral property acquisition costs are recorded at cost and are deferred until the viability of the property is determined. We currently have one operating property, the Hycroft Mine (“Hycroft Mine”), which is located approximately 54 miles west of Winnemucca, Nevada. Exploration, mineral property evaluation, option payments, related acquisition costs for mineral properties acquired under an option agreement, general overhead, administrative and holding costs to maintain a property on a care and maintenance basis are expensed in the period they are incurred. When proven and probable reserves are determined for a property, subsequent development costs on the property are capitalized. If a project were to be put into production, capitalized development costs would be depleted on the units of production basis determined by the proven and probable reserves for that project.
Advanced minimum royalty (“AMR”) payments are made by the mining operators on certain mineral interests to the Company prior to the commencement of commercial production on the property under lease. After the commencement of commercial production, the mining operator recovers these payments out of production royalty payments due to the Company. Upon receipt, these payments are initially recorded by the Company as deferred income. The related income is recognized when the lessee’s right to offset the AMR against future royalty payments expires or is forfeited upon releasing the mineral interests back to Allied Nevada.
The Company reviews the cost of mineral properties for impairment whenever events and circumstances indicate that a decline in recoverability of their carrying value may have occurred but in any event not less than annually. Where applicable, management estimates the expected future cash flows of mineral properties and compares such future cash flows to the carrying amount of the mineral properties to determine if the carrying amount is recoverable. If the carrying amount exceeds the estimated undiscounted future net cash flows, the Company will adjust the carrying amount of such mineral properties to fair value. Other factors used to determine fair value include, but are not limited to, estimates of land value of Other Exploration Properties, the value of unproven acreage, the value of advanced minimum royalty agreements, and a discount rate commensurate with the risk associated with realizing the expected cash flows projected. There were no impairments to the carrying value of mineral properties in 2010 or 2009. In 2008, we recognized a mineral property impairment of $39.0 million.
Although the Company has taken steps to verify title to mineral properties in which it has an interest, these procedures do not guarantee the Company’s title. Such properties may be subject to prior undetected agreements or transfers and title may be affected by such defects.
Long-lived Assets
The Company reviews and evaluates its long-lived assets for impairment annually, and at interim periods if events or changes in circumstances indicate that the related carrying amounts may not be recoverable, in accordance with Accounting Standards Codification 360-10-35 regarding subsequent measurement of long-lived assets. An impairment is determined to exist if the total estimated future cash flows on an undiscounted basis are less than the carrying amount of the assets. An impairment loss is measured and recorded based on the excess carrying value of the impaired assets over fair value. The Company analyzes future discounted cash flows to determine the fair value of its mineral properties. Future cash flows are estimated based on quantities of recoverable minerals, expected gold and other commodity prices (considering current and historical prices, price trends and related factors), production levels and operating costs of production and capital, all based on life-of-mine plans. The term “recoverable minerals” refers to the estimated amount of gold or other commodities that will be obtained after taking into account losses during ore processing and treatment. Estimates of recoverable minerals from such mineral interests are risk adjusted based on management’s relative confidence in such materials. In estimating future cash flows, assets are grouped at the lowest level for which there are identifiable cash flows that are largely independent of future cash flows from other asset groups. The Company’s estimates of future cash flows are based on numerous assumptions and it is possible that actual future cash flows will be significantly different than the estimates, as actual future quantities of recoverable minerals, gold and other commodity prices, production levels and operating costs of production and capital are each subject to significant risks and uncertainties. There were no impairments to long-lived assets in 2010, 2009, or 2008.
34
Table of Contents
Assets under Lease
Assets under lease which in substance transfer the risks and benefits of ownership of the assets to the Company are capitalized under fixed assets. The assets and the corresponding lease obligations are recorded at the lower of present value of the minimum lease payments or the fair value of the leased assets at the beginning of the lease terms. Such leased assets are subject to depreciation consistent with that for depreciable assets which are owned. Leases which do not meet such criteria are classified as operating leases and the related rentals are charged to the income statement as incurred.
Reclamation and Remediation Costs (Asset Retirement Obligations)
Reclamation costs are allocated to expense over the life of the related assets and are periodically adjusted to reflect changes in the estimated present value resulting from revisions to the estimates of either the timing or amount of the reclamation and abandonment costs. Such costs include care and maintenance, removal of mining infrastructure, covering disturbed areas, and revegetation of the land. The asset retirement obligation is based on when the spending for an existing environmental disturbance and activity to date will occur. The Company reviews, on an annual basis, unless otherwise deemed necessary, the asset retirement obligation at each mine site in accordance with Accounting Standards Codification 410, “Asset Retirement and Environmental Obligations” (“ASC 410”).
In addition, the related asset retirement costs and premiums are capitalized and amortized on a units of production basis. These typically arise from insurance premiums that are paid which enable the Company to acquire the necessary reclamation bonds, required by the Bureau of Land Management (“BLM”) in order to continue mining operations; or changes in estimated cash flows resulting from the Company’s annual review of the asset retirement obligation.
Sales
The Company recognizes revenue on gold and silver sales when persuasive evidence of an arrangement exists, the price is fixed or determinable, the metal is delivered, the title has been transferred to the customer, and collectability is reasonably assured. The Company sold 93% of its gold and silver to one customer during 2010.
Income Taxes
The Company accounts for income taxes using the liability method, recognizing certain temporary differences between the financial reporting basis of the Company’s liabilities and assets and the related income tax basis for such liabilities and assets. This method generates either a net deferred income tax liability or asset for the Company, as measured by the statutory tax rates in effect. The Company derives its deferred income tax charge or benefit by recording the change in either the net deferred income tax liability or asset balance for the year.
The Company’s deferred income tax assets include certain future tax benefits. The Company records a valuation allowance against any portion of those deferred income tax assets when it believes, based on the weight of available evidence, it is more likely than not that some portion or all of the deferred income tax asset will not be realized.
Stock-Based Compensation
The Company accounts for stock-based compensation in accordance with Accounting Standards Codification 718, “Stock Compensation” (“ASC 718”), which requires companies to recognize compensation expense for share-based payments based on the estimated fair value of the awards. ASC 718 also requires tax benefits relating to the deductibility of increases in the value of equity instruments issued under share-based compensation arrangements that are not included in costs applicable to sales (“excess tax benefits”) to be presented as financing cash inflows in the Statement of Cash Flows.
Income (loss) Per Share
Basic loss per share amounts are calculated by using the weighted-average number of common shares outstanding during the year. Diluted income per share amounts reflect the potential dilution that could occur if securities or other contracts that may require the issuance of common shares in the future were converted unless their inclusion would be anti-dilutive. As the Company incurred a net loss in 2008, potential shares to be issued from the assumed exercise of options, warrants, and restricted shares were not included in the computation of diluted earnings per share in 2008 since their result would have been anti-dilutive.
Concentration of Risk
The Company is engaged in the production of gold at its sole operating property, the Hycroft Mine. Accordingly, it expects the principal source of future revenue to be the sale of gold. A significant and sustained decrease in the price of gold from current levels could have a material and negative impact on the Company’s business, financial condition and results of operations.
The Company has placed nearly all of its cash investments with a single high quality financial institution. All cash equivalents were invested in high quality short-term money market instruments, including government securities, bankers’ acceptances, bank notes, certificates of deposit, commercial paper and repurchase agreements of domestic and foreign issuers. At December 31, 2010 and 2009, respectively, we had no funds invested in asset-backed commercial paper. The Company has not experienced any losses on its cash investments.
35
Table of Contents
The Company currently has one operating property, the Hycroft Mine. The Company does not carry business interruption insurance relating to the Hycroft Mine. Accordingly, loss of production at the Hycroft Mine could produce a near-term severe impact to Allied Nevada. Additionally, not all risks that could result in cessation of operations are insurable.
All of the Company’s properties are located in the State of Nevada. Any significant changes to the BLM regulations could have a negative impact on the Company’s financial position.
Operations
The Hycroft mine completed its second full year of operations in 2010. Key operating statistics for the years ended December 31, 2010 and 2009 are as follows:
| Years Ended December 31, | ||||||||
| 2010 | 2009 | |||||||
| Ore mined (tons) |
9,923 | 9,772 | ||||||
| Waste mined (tons) |
16,611 | 17,149 | ||||||
| Total material mined (tons) |
26,534 | 26,921 | ||||||
| Ore grade - gold (oz/ton) |
0.020 | 0.022 | ||||||
| Ore grade - silver (oz/ton) |
0.246 | 0.221 | ||||||
| Ounces sold - gold |
102,483 | 42,358 | ||||||
| Ounces sold - silver |
238,242 | 53,125 | ||||||
| Average realized price - gold |
$ | 1,227 | $ | 1,003 | ||||
| Average realized price - silver |
$ | 20 | $ | 15 | ||||
| Average spot price - gold |
$ | 1,225 | $ | 972 | ||||
| Average spot price - silver |
$ | 20 | $ | 15 | ||||
| Cost of sales, net of byproduct credits (thousands) 1 |
$ | 42,804 | $ | 16,605 | ||||
| Cost of sales per ounce of gold sold 1 |
$ | 418 | $ | 392 | ||||
We sold 102,483 ounces of gold and 238,242 ounces of silver in the year ended December 31, 2010, exceeding our production guidance. Cost of sales for the year ended December 31, 2010 was at the lower end of guidance at $418 per ounce of gold sold. Costs were better than planned due to lower than expected commodity prices and the benefit of a higher silver price than expected. The Company mined 26.5 million tons of material, including 9.9 million tons of ore at an average grade of 0.020 oz/ton gold and 0.246 oz/ton silver for the year ended December 31, 2010. The mine placed approximately 194,100 contained ounces of gold (109,900 recoverable ounces) and 2,436,500 contained ounces of silver (243,700 recoverable ounces) on the pads in the year ended December 31, 2010.
The major accomplishments in 2010 were as follows:
| • | Completed more than one full year with no lost time accidents and no significant environmental incidents. |
| • | Completed two NI 43-101 compliant updated mineralized material estimates in April and August, 2010. The mineralized material estimate announced in April 2010 indicated a 118% increase in gold Proven and Probable Reserves to 2.4 million ounces and an initial silver Proven and Probable reserve of 32.3 million ounces, subsequently updated to 38.9 million ounces in August when compared with the mineralized material estimate announced in March 2009. |
| • | Began implementing the accelerated oxide heap leach project designed to increase the mining rate, thereby more than doubling gold production by 2012. This will be accomplished by purchasing a larger capacity mining fleet of 320-ton haul trucks and hydraulic shovels over the next two years. Purchased and placed into operation three 320-ton haul trucks and a larger capacity shovel in connection with the accelerated oxide mining expansion. Also, in 2010, the Company began operating a mobile crushing unit which is expected to crush the higher grade siliceous mineralization in order to improve total leach recoveries for gold and silver. It is expected that additional larger capacity mining equipment and mobile crushing units will be added in the next two years as part of the implementation of the accelerated oxide mining expansion. |
| 1 | The terms “cost of sales per ounce of gold sold” and “cost of sales, net of byproduct credits” are non-GAAP financial measures. Please see the section on “Non-GAAP Measures” in this MD&A. |
36
Table of Contents
| • | Announced and updated a positive milling scoping study with the goal of defining an economically viable processing option for the mineralization. |
| • | Ongoing metallurgical test work throughout 2010 continued to show positive results for the grind-flotation-cyanidation of the tailings flowsheet for the milling scenario. At January 2011, the Company had completed approximately 70% of the required test work for the milling feasibility study. Overall, testing of the composites through the grind-flotation-cyanidation of the tailing flowsheet indicate recoveries of 87% for gold and 82% for silver. Concentrate from six bulk samples are currently being tested through various oxidation techniques and the results will indicate the overall recovery through the entire milling-flotation-oxidation circuit. |
| • | Completed a 3.5 million square foot expansion to the Brimstone leach pad as planned. |
| • | Completed modifications to the leach pad, ponds, pumping system and piping to allow for “stacking” of pregnant solutions (increasing the grade by recycling lower grade solution back to the pad). By increasing the grade of gold and silver in the pregnant solution, the operating efficiencies of the Merrill-Crowe plant and the CIC plant are expected to improve. In addition, the solution flow rate was increased from 2,500 to 3,500 gpm allowing for the lower grade solutions to be recycled back up to the pad without impacting production. |
| • | In June, 2010, we completed an underwritten public offering pursuant to which we issued 13,500,000 common shares for aggregate proceeds of CDN$283,500,000. Proceeds from the financing were to satisfy initial capital needs for the accelerated oxide expansion, to fund exploration programs and to complete the initial milling feasibility study for Hycroft. |
| • | Completed the 2010 Hycroft exploration season with 396 holes drilled totaling 333,248 feet of drilling. |
| • | Completed an initial drill program at Hasbrouck with positive results. Management intends to complete a preliminary economic assessment for Hasbrouck in the first quarter of 2011. |
Results of Operations
Year Ended December 31, 2010 Compared with Year Ended December 31, 2009
Allied Nevada had net income during the year ended December 31, 2010 of $34.1 million compared to $8.5 million during the same period in 2009. The increase in net income of $25.7 million is largely due to an increase of $87.7 million in revenue from the sale of gold and silver, a decrease in the loss due to change in value of equity-linked financial instruments of $5.2 million, and an increase in foreign exchange gains of $2.5 million. The above increases were partially offset by an increase of $30.2 million in cost of sales, an increase of $16.9 million in exploration and land holding costs, a decrease of $10.8 million in income tax benefit, an increase in corporate general and administrative costs of $7.4 million, an increase of $3.8 million in depreciation and amortization expenses, and an increase of $1.8 million in stripping costs compared to the same period of 2009.
Revenue
Revenue increased $87.7 million in 2010 to $130.9 million compared to $43.2 million in 2009. The increase was primarily attributable to a 60,125 ounce increase in gold sales to 102,483 ounces compared to 42,358 ounces in 2009, and a $224 increase in the average realized price for gold to $1,227 per ounce compared to $1,003 per ounce in 2009. In addition, we experienced an 185,114 ounce increase in silver sales to 238,242 ounces in 2010 compared to 53,125 ounces in 2009, and a $5 increase in the average realized price for silver to $20 per ounce compared to $15 per ounce in 2009.
Cost of sales
Cost of sales consists of mining and process costs, together with normal stripping costs that are variable costs of production. Cost of sales increased $30.2 million in 2010 to $47.6 million compared to $17.4 million in 2009. The increase was primarily attributable to the 60,125 ounce increase in gold sales and to a $54 per ounce increase in the average cost of sales per ounce sold to $465 compared to $411 in 2009. The $54 increase in the average cost of sales per ounce is attributable in large part to the decrease in the ore grade mined in 2010 to 0.020 ounces of gold per ton from 0.022 ounces of gold per ton in 2009 and higher Nevada net proceeds tax in 2010 compared to 2009, which was partially offset by the weighted average cost per gold ounce in the Company’s precious metals inventories and ore on leach pad balances.
Stripping costs
Stripping costs represent costs incurred in excess of those considered to be normal and are expensed as incurred. For the years ended December 31, 2010 and 2009, stripping costs totaled $10.1 million and $8.3 million, respectively. Although the ratio of waste tons to ore tons for the years ended December 31, 2010 and 2009 was comparable, the life of mine strip ratio reported in the April and September 2010 NI 43-101 Technical Reports decreased during 2010 compared to the same period of 2009 resulting in more stripping costs being expensed in 2010.
37
Table of Contents
Depreciation and amortization
During the year ended December 31, 2010, depreciation and amortization expense was $7.0 million compared to $3.1 million in 2009. The increase was primarily due to an increase in plant and equipment in operation and an increase in the number of ounces of gold sold in 2010 compared to 2009. For the year ended December 31, 2010, there was a $16.0 million increase in leach pads being depreciated on a units of production method and a $21.6 million increase in mine equipment being depreciated using the straight-line method over the useful life compared to 2009.
Exploration and land holding costs
Exploration and land holding costs increased to $22.5 million during the year ended December 31, 2010, compared to $5.6 million during 2009. The increase is primarily due to 2010 activity related to Hycroft exploration drilling programs compared to 2009. For the year ended December 31, 2010, the Hycroft drilling programs consisted of approximately 396 drill holes and 333,248 feet drilled compared to approximately 123 drill holes and 94,000 feet drilled in 2009.
Accretion
Allied Nevada recorded accretion expenses of $0.4 million during the year ended December 31, 2010 which was comparable to the amount recorded in 2009. Accretion expense in the year ended December 31, 2010 was based upon a risk-free credit adjusted rate of 6.8%.
Corporate general and administrative costs
Corporate general and administrative costs increased to $19.8 million during the year ended December 31, 2010, compared to $12.4 million in 2009. The increase was largely due to higher aggregate compensation and benefit costs for employees associated with increased staffing levels at the corporate office, increased stock-based compensation costs for employees and directors, and increased consulting fees for engineering and metallurgical services.
Interest income
Allied Nevada earned a minimal amount in interest income from both its liquid savings and restricted cash accounts during the years ended December 31, 2010 and 2009 due to low interest rate environments in both periods.
Interest expense
Allied Nevada incurred nil interest expense during the year ended December 31, 2010 compared to $1.0 million during 2009. The decrease in interest expense is primarily attributable to increased capitalized interest in 2010 and repayment of the Ionic loan in September 2009.
Loss due to change in value of equity-linked financial instruments
There was no change in value of equity-linked financial instruments during the year ended December 31, 2010, compared to a $5.2 million non-cash loss due to a change in fair value of warrants in 2009. The loss due to change in value of equity-linked financial instruments in the prior 2009 period was attributable to the exercise or forfeiture of all warrants issued in the Company’s July 2007 private placement prior to July 2009.
Net foreign exchange gain
For the year ended December 31, 2010, the Company recognized a foreign exchange gain of $3.1 million compared to $0.5 million for 2009. The foreign exchange gain consisted of a $2.9 million foreign exchange gain on converting nearly all of the net proceeds from the June 2010 offering from Canadian to U.S dollars and a foreign exchange gain of $0.2 million based upon the change in exchange rates between the Canadian and U.S. dollar and the Company’s average net Canadian dollar asset position. During the year ended December 31, 2009, the Company recognized a foreign exchange gain of $0.5 million consisting of a $1.2 million foreign exchange gain on converting nearly all of the net proceeds from an August 2009 offering from Canadian to U.S. dollars, a foreign exchange gain of $0.3 million based upon the change in exchange rates between the Canadian and U.S. dollar and the Company’s average net Canadian dollar asset position, and a loss of $1.0 million on the repayment of the Ionic term loan, which was denominated in Canadian dollars.
38
Table of Contents
Other income (expense)
Other income was $0.3 million for the year ended December 31, 2010 due to recognition of income from advance minimum royalties that were recognized after exploration rights were returned to the Company by joint venture partners, which were previously recorded as deferred royalty income. Other expense was $0.1 million in 2009.
Income tax benefit
For the year ended December 31, 2010, the Company recorded an estimated tax benefit of $7.1 million compared to a benefit of $17.9 million in 2009. The 2010 benefit included a provision for income taxes, using the federal statutory income tax rate, of $9.5 million, which was offset by a reduction to the Company’s valuation allowance of approximately $11.5 million, and a percentage depletion deduction in excess of tax basis of $3.7 million. The 2010 reduction in the valuation allowance was based upon revised estimates of future taxable income resulting from the September 2010 reserve update. In 2009 Allied Nevada recognized a tax benefit of $17.9 million attributable to its then estimate of future taxable income.
Net income
For the reasons described above, we reported net income of $34.1 million for the year ended December 31, 2010 compared to $8.5 million in 2009.
Year Ended December 31, 2009 Compared with Year Ended December 31, 2008
Allied Nevada had net income during the year ended December 31, 2009 of $8.5 million compared to a net loss of $79.6 million during 2008. The increase from 2008 to 2009 of $88.0 million is largely due to $43.2 million of revenue from the sale of gold and silver, a $39.0 million reduction in non-cash impairments to mineral properties, an income tax benefit of $17.9 million, a decrease of $12.0 million in mine start-up costs, and an $11.1 million decrease in exploration and land holding costs, which was offset by $17.4 million of cost of sales, $8.3 million of stripping costs, and a loss of $5.2 million attributable to the change in fair value of equity-linked financial instruments (described in Note 15 to the Consolidated Financial Statements).
Revenue
During the year ended December 31, 2009, the Company sold 42,358 ounces of gold at an average price of $1,003 per ounce for $42.4 million of revenue and 53,125 ounces of silver at an average price of $15 per ounce for approximately $0.8 million of revenue. There were no comparable sales of precious metals in 2008.
Cost of sales
Cost of sales consists of mining and process costs, together with normal stripping costs that are variable costs of production. For the year ended December 31, 2009, total cost of sales was $17.4 million for 42,358 ounces of gold sold at an average cost of $411 per ounce of gold. Cost of sales, net of byproduct credits1 (reduced by silver revenue) totaled $16.6 million for a cost of sales per ounce of gold sold1 averaging $392 for the year ended December 31, 2009. There were no comparable costs in 2008.
Stripping costs
Stripping costs represent costs incurred in excess of those considered to be normal and are expensed as incurred. For the year ended December 31, 2009, stripping costs totaled $8.3 million. There were no comparable stripping costs in 2008.
Mine start-up costs
Mine start-up costs represent costs incurred to recommission the Hycroft Mine during 2008, prior to entering the production phase. There were no mine start-up costs in the year ended December 31, 2009. Mine start-up costs were $12.0 million in 2008.
Depreciation and amortization
During the year ended December 31, 2009, depreciation and amortization expense was $3.1 million compared to $1.6 million in 2008. Substantially all of the $1.5 million increase was attributable to the depreciation of the mining fleet and amortization of royalty rights, mine development costs, and the Asset Retirement Cost (ARC) asset, based upon commencement of production at Hycroft.
| 1 | The terms “cost of sales per ounce of gold sold” and “cost of sales, net of byproduct credits” are non-GAAP financial measures. Please see the section on “Non-GAAP Measures” in this MD&A. |
39
Table of Contents
Exploration and land holding costs
Exploration and land holding costs decreased to $5.6 million during the year ended December 31, 2009, as compared with $16.7 million during 2008. The decrease of $11.1 million is primarily due to the following:
| • | During the year ended December 31, 2009, we expensed $3.8 million for a third phase oxide reserve and resource drilling program and a sulfide gold and silver resource development drilling program compared to $13.2 million of drilling and exploration costs at Hycroft in connection with the 2008 exploration drilling program. The 2009 drilling program consisted of about 123 drill holes for approximately 94,000 feet drilled, compared to the 2008 drilling program that consisted of about 341 drill holes for approximately 240,000 feet drilled. |
| • | We did not incur care and maintenance costs in 2009 as the mine was reactivated in the third quarter of 2008, compared to $1.5 million of such costs in 2008. |
Impairment of mineral interests
There were no mineral interest impairments for the year ended December 31, 2009 compared to non-cash mineral interest impairments of $39.0 million in the prior year. Non-cash 2008 impairments of $38.6 million resulted from adverse changes in valuation assumptions relating to our exploration properties. Additionally, $0.4 million of non-cash impairments were the result of the termination of royalty agreements and exploration rights on nine mineral properties by a joint venture partner in April 2008.
Accretion
Allied Nevada recorded accretion expenses of $0.4 million during 2009 which was comparable to the amount recorded in 2008. Accretion expense in the year ended December 31, 2009 was based upon a risk-free credit adjusted rate of 6.8%.
Corporate general and administrative costs
Corporate general and administrative costs increased to $12.4 million in 2009, compared to $9.6 million for the same period in 2008. The increase was largely due to higher aggregate compensation and benefit costs for employees associated with increased staffing levels at the corporate office, increased consulting fees for engineering and metallurgical services, and expenses related to the Deferred Phantom Unit Plan for directors, offset by related reductions to Restricted Share Unit plan for directors.
Interest income
Allied Nevada earned a minimal amount in interest income from both our liquid savings and restricted cash accounts during 2009 compared to $0.9 million during 2008. The decrease in interest on our liquid savings account is largely attributable to substantially lower interest rates, despite substantially higher average cash balances.
Interest expense
Allied Nevada incurred $1.0 million of interest expense during the year ended December 31, 2009 compared to $1.9 million during the same period in 2008. The interest expense in both periods was largely related to the March 2009 and March 2008 credit agreements with Ionic. Interest expense during 2009 was net of $0.1 million capitalizable interest related to the leach pad expansion project and includes $0.3 million in interest paid for additional mining equipment under capital lease. Interest expense during 2008 was net of $0.2 million capitalizable interest related to the mine development project and includes $0.1 million attributable to interest on capital lease obligations.
Loss due to change in value of equity-linked financial instruments
For the year ended December 31, 2009, the Company recognized a $5.2 million non-cash loss due to a change in fair value of warrants, which are considered to be equity-linked financial instruments, as described in Note 15 and subject to the guidance of Accounting Standards Codification 815-40, “Derivatives and Hedging – Contracts in Entity’s Own Equity” (“ASC 815-40”), regarding contracts in an entity’s own stock. Although the warrants described in Note 15 were outstanding in 2008, ASC 815-40 required recognition of a cumulative effect of a change in accounting principle to the opening balances of our accumulated deficit, additional paid in capital, and liability for equity-linked financial instruments. Accordingly, there was no change in fair value recognized in 2008.
Net foreign exchange gain (loss)
For the year ended December 31, 2009, the Company recognized a foreign exchange gain of $0.5 million compared to a foreign exchange loss of $0.3 million in 2008. The net increase is attributable to foreign exchange gains in second half of 2009 related to both changes in exchange rates and between the U.S. and Canadian dollar and increased balances in Canadian accounts following the August 2009 public offering (described in Note 16 to the Consolidated Financial Statements), which was partially offset by losses in
40
Table of Contents
2009 related to changes in exchange rates during the period when the March 2009 Credit Facility was outstanding. The foreign exchange loss in 2008 was attributable to the changes in exchange rates during the period when the March 2008 Credit Facility was outstanding. The 2009 and 2008 credit facilities are described in Note 18 to the Consolidated Financial Statements.
Other income
Other income, net was $0.1 million for the year ended December 31, 2009 compared to other income of $0.8 million in 2008. Other income in 2008 was largely related to $0.2 million non-cash gains from advance minimum royalties that were recognized for exploration rights returned to the Company by joint venture partners, which was offset by a $0.1 million lost on the disposal of mineral interests. In 2008, other income was comprised of gains on the sale of two mineral properties.
Income taxes
The Company provided a valuation allowance against its net deferred tax assets of $25.4 million as of December 31, 2009, since it could note conclude that it is more likely than not that $25.4 million of the net deferred tax assets will be fully realized on future income tax returns. The Company released $17.9 million of its valuation allowance as of December 31, 2009 based on its future taxable income projections and ability to utilize its net operating loss carryforwards. The Company will continue to evaluate whether the remaining valuation allowance is required in future reporting periods.
Financial Position, Liquidity and Capital Resources
Year Ended December 31, 2010 Compared with Year Ended December 31, 2009
Cash provided by operating activities
Cash provided by operating activities was $24.3 million for the year ended December 31, 2010, compared to $23.8 million of cash used in operating activities in 2009. The net increase of $48.1 million of cash provided by operating activities was primarily attributable to the following:
| • | For the year ended December 31, 2010, the Company had $34.1 million in net income compared to $8.5 million in 2009. This amounted to a net increase in cash provided by operating activities of $25.7 million for reasons described in Results of Operations above. |
| • | For the year ended December 31, 2010, the increase in ore on leach pads resulted in a $14.0 million use of cash compared to $27.8 million in 2009, resulting in an increase in cash provided by operating activities of $13.8 million compared to 2009. |
| • | For the year ended December 31, 2010, the Company recorded a $7.1 million increase to deferred tax assets compared to a $17.9 million increase in 2009. This resulted in a $10.8 million increase in cash provided by operating activities compared to 2009. |
| • | The Company recognized $7.0 million in depreciation and amortization expense for the year ended December 31, 2010 compared to $3.1 million in 2009, which amounted to a $3.9 million increase in cash provided by operating activities compared to 2009. |
| • | During 2009, the Company recognized a $5.2 million non-cash loss resulting in a $5.2 million decrease in cash provided by operating activities when compared to the year ended December 31, 2010. |
| • | The change in accrued liabilities and other resulted in a $4.6 million source of cash for the year ended December 31, 2010 compared to a $2.4 million source of cash in 2009. This resulted in a $2.2 million increase in cash provided by operating activities compared to 2009. |
| • | The change in accounts payable and amounts due to related parties resulted in a $2.5 million source of cash for the year ended December 31, 2010 compared to $4.3 million in 2009, resulting in a $1.8 million decrease in cash provided by operating activities. |
Cash used in investing activities
Cash used in investing activities was $37.8 million for the year ended December 31, 2010 compared to $11.1 million in 2009. The net increase of $26.7 million of cash used in investing activities is largely due to the following:
| • | For the year ended December 31, 2010, additions to plant and equipment totaled $27.2 million compared to $6.7 million of equipment purchases in 2009, resulting in an increase in cash used in investing activities of $20.5 million. For the year ended December 31, 2010 the Company’s cash purchases included $9.9 million for mobile mine equipment, $8.9 million for leach pads, $1.3 million for electrical equipment, and $3.6 million of other plant and equipment additions. |
| • | For the year ended December 31, 2010, we incurred $9.8 million in mine development costs consisting primarily of ore development drilling and related assaying costs attributable to proven and probable reserves at the Hycroft mine compared to $3.2 million of such costs incurred in 2009, which resulted in an increase in cash used in investing activities of $6.6 million. |
41
Table of Contents
Cash provided by financing activities
Cash provided by financing activities was $259.8 million for the year ended December 31, 2010 compared to $110.0 million in 2009. The net increase of $149.8 million of cash provided by financing activities is the result of the following factors:
| • | In June 2010, Allied Nevada issued 13,500,000 shares of its common stock in a public offering and we received gross proceeds of approximately $272.2 million. We incurred approximately $17.9 million of costs in connection with the offering, resulting in net proceeds of $254.3 million for the year ended December 31, 2010 compared to net proceeds of $86.4 million from an August 2009 offering. This resulted in a $168.0 million increase in cash provided by financing activities. |
| • | For the year ended December 31, 2010, the Company received $7.0 million in proceeds from the exercise of options compared to $25.9 million in proceeds from the exercise of warrants and options in 2009, resulting in an $18.9 million decrease in cash provided by financing activities. |
| • | For the year ended December 31, 2010, Allied Nevada did not borrow any funds using debt financing compared to borrowing $6.3 million from Ionic in 2009, resulting in a $6.3 million decrease in cash provided by financing activities. |
| • | For the year ended December 31, 2010, the Company did not repay any funds borrowed using debt financing compared to repaying $7.4 million in 2009, resulting in a $7.4 million increase in cash provided by operating activities. |
Year Ended December 31, 2009 Compared with Year Ended December 31, 2008
Cash used in operations
Cash used in operations was $23.8 million for the year ended December 31, 2009, compared to $30.7 million during 2008. The decrease of $6.9 million was primarily attributable to the following:
| • | In the year ended December 31, 2009, cash used to place ore on leach pads, produce precious metals inventory, and to acquire supplies inventory increased to $27.8 million, $3.7 million, and $0.3 million, respectively, compared to $2.7 million, $0.8 million, and $1.3 million, respectively, during 2008. This amounted to an increase in cash used in operations of $26.9 million. |
| • | In 2009, we did not incur an impairment of mineral interests compared to $39.0 million of non-cash impairments in 2008. The non-cash impairment in 2008 reduced net income and was reflected on the Consolidated Statement of Cash Flows as a reconciling item to arrive at cash used in operations. This resulted in a $39.0 million increase in cash used in operations. |
| • | The change in accounts payable balances resulted in a $4.3 million source of cash in the 2009 period compared to a $7.2 million source of cash in the 2008 period, resulting in a $2.9 million increase in cash used in operations. |
| • | The increase in the net deferred income tax asset resulted in an increase in cash used in operations of $17.9 million as the resulting non-cash gain was a reconciling item from net income to arrive at cash used in operations. |
| • | The above increases in cash used in operations were offset by $8.5 million net income in 2009 compared to a $79.6 million loss in 2008 and a $5.2 million non-cash loss attributable to the change in fair value of equity-linked financial instruments during 2009. |
Cash used in investing activities
Cash used in investing activities was $11.1 million during the year ended December 31, 2009 compared to $40.1million during 2008. The decrease of $29.0 million is largely due to the following:
| • | In the year ended December 31, 2009, we acquired $6.7 million of equipment compared to $26.8 million of equipment consisting primarily of the purchase of a used mining fleet during 2008, which resulted in a decrease in cash used in investing of $20.1 million. |
| • | In the year ended December 31, 2009, we incurred $3.2 million in mine development costs attributable to proven and probable reserves at the Hycroft mine compared to $8.5 million in mine development costs incurred during 2008, which resulted in a decrease in cash used in investing of $5.3 million. |
| • | During 2009, the Company established an additional $1.4 million collateral account to support an additional surety bond for the benefit of the Bureau of Land Management (BLM), which allowed the Company to resume mining operations at the Hycroft mine, compared to a $6.8 million collateral account established in 2008. This resulted in a decrease in cash used in investing of $5.4 million. |
42
Table of Contents
| • | During 2009, the Company entered into capital leases for mining equipment totaling $4.1 million compared to capital leases in 2008 totaling $3.2 million for mining equipment. These amounts are reflected as non-cash financing and investing activities on our Consolidated Statement of Cash Flows for the years ended December 31, 2009 and 2008, respectively. |
Cash provided by financing activities
The net cash provided by financing activities was $110.0 million in the year ended December 31, 2009 compared to $67.2 million during the same period of 2008. The increase of $42.8 million in cash provided by financing activities is the result of the following factors:
| • | The Company issued 11,150,000 shares of common stock through an underwriting agreement in August 2009 and 14,375,000 shares of common stock pursuant to an underwritten public offering in April 2008, which resulted in cash proceeds of $91.5 million and $74.4 million, respectively. This resulted in an increase in cash provided by financing activities of $17.1 million. |
| • | During 2009, Allied Nevada received $19.4 million proceeds from the exercise of 3,780,850 warrants and $6.5 million proceeds from the exercise of options. There were no comparable warrant exercises and the Company received $0.3 million of proceeds from the exercise of options during 2008. This resulted in an increase in cash provided by financing activities of $25.6 million. |
| • | During the year ended December 31, 2009, Allied Nevada borrowed $6.3 million from Ionic pursuant to a 2009 Credit Agreement and repaid $7.5 million, including deferred loan costs. During the year ended December 31, 2008, Allied Nevada borrowed $9.7 million from Ionic pursuant to a 2008 Credit Agreement and repaid $11.8 million, including deferred loan costs. |
Liquidity and capital resources
Based upon our current operational assumptions and mine plans, we believe our cash on hand, anticipated operating cash flow from the Hycroft Mine, proceeds from the potential sale of mineral interests and advanced minimum royalty payments, if any, and the proceeds from exercise of stock options will be more than sufficient to meet our liquidity needs and fund the planned capital expenditures for the next year.
Capital expenditures in 2011 are expected to total approximately $110 million. Significant capital projects include the following: expansion of the mobile equipment fleet at Hycroft with additional 320-ton haul trucks and larger capacity shovels ($53 million); support building improvements, increased process plant capacity modifications and ongoing leach pad expansion at Hycroft ($22 million); capitalized stripping and drilling ($9 million); and other capitalized spending ($26 million). To the extent we are required to raise capital through future debt or equity offerings, our ability to do so will be a function of macroeconomic conditions, future gold prices, our operational performance and energy costs. Such additional financing may not be available when needed, or if available, the terms of such financing may not be favorable to us and, if raised by offering equity securities, may involve substantial dilution to existing shareholders.
At December 31, 2010, our total assets were $567.4 million compared to $252.4 million at December 31, 2009. The increase in total assets is primarily attributable to the $254.3 million raised in the June 2010 offering, $34.1 million of net income, and $7.0 million in proceeds received from the exercise of stock options.
At December 31, 2010, working capital was $388.8 million compared to working capital of $125.1 million at December 31, 2009. The increase in working capital is primarily attributable to a $246.2 million increase in cash and cash equivalents and a $15.2 million increase in ore on leach pads. Cash and cash equivalents increased by $246.2 for the reasons described in Cash provided by operations and financing activities and cash used in investing activities for the year ended December 31, 2010 compared with year ended December 31, 2009 above. The increase in ore on leachpads is attributable to a 5,125 ounce increase in the estimated recoverable gold ounces on the pad from 72,140 ounces to 77,265 ounces and a $165 increase in the weighted average cost per gold ounce from $473 to approximately $639 per gold ounce. The increase in inventories, prepaids and other, and current deferred tax assets were offset by increases in accounts payable and current capital lease obligations balances.
At December 31, 2010, we had cash and cash equivalents totaling $337.8 million. All cash equivalents were invested in high quality short-term money market instruments, including government securities, bankers’ acceptances, bank notes, certificates of deposit, commercial paper and repurchase agreements of domestic and foreign issuers. At December 31, 2010, we had no funds invested in asset-backed commercial paper.
At December 31, 2010, the Company has no lines of credit in place.
Off-Balance Sheet Arrangements
Allied Nevada has no off-balance sheet arrangements.
43
Table of Contents
Contractual Obligations
Allied Nevada’s contractual obligations at December 31, 2010 are summarized as follows (in thousands):
| Payments Due by Period | ||||||||||||||||||||
| Less than | 1 – 3 | 3 – 5 | More than | |||||||||||||||||
| Contractual Obligations |
Total | 1 year | Years | Years | 5 Years | |||||||||||||||
| Capital lease obligations |
$ | 16,264 | $ | 3,989 | $ | 7,734 | $ | 4,541 | $ | — | ||||||||||
| Operating lease obligations |
586 | 179 | 381 | 26 | — | |||||||||||||||
| Remediation and reclamation obligations (1) |
11,047 | 463 | 654 | 606 | 9,324 | |||||||||||||||
| Property option and claim maintenance obligations |
9,885 | 1,399 | 5,258 | 2,628 | 600 | |||||||||||||||
| Purchase obligations (2) |
— | — | — | — | — | |||||||||||||||
| Total Commitments |
$ | 37,782 | $ | 6,030 | $ | 14,027 | $ | 7,801 | $ | 9,924 | ||||||||||
| (1) | Mining operations are subject to extensive environmental regulations in the jurisdictions in which they are conducted. Pursuant to these environmental regulations, the Company is required, upon cessation of operations, to reclaim and remediate the lands that operations have disturbed. The estimated undiscounted cash outflows of these remediation and reclamation obligations are reflected here. For more information regarding remediation and reclamation liabilities see Note 13 to the Consolidated Financial Statements. |
| (2) | Purchase obligations are not recorded in the Consolidated Financial Statements. Purchase obligations represent obligations for purchase of materials and supplies and drilling services. |
New Accounting Pronouncements
Fair Value Accounting
In January 2010, the ASC guidance for fair value measurements and disclosure was updated to require additional disclosures related to: i) transfers in and out of level 1 and 2 fair value measurements and ii) enhanced detail in the level 3 reconciliation. The guidance was amended to provide clarity about: i) the level of disaggregation required for assets and liabilities and ii) the disclosures required for inputs and valuation techniques used to measure fair value for both recurring and nonrecurring measurements that fall in either level 2 or level 3. The updated guidance is effective for the Company’s fiscal year beginning January 1, 2010, with the exception of the level 3 disaggregation which is effective for the Company’s fiscal year beginning January 1, 2011. The adoption of this guidance did not have an impact on the Company’s consolidated financial position, results of operations, or cash flows.
Subsequent Events
Approval of Reclamation Cost Estimate
On February 17, 2011, we received a notification from the Bureau of Land Management (“BLM”) of a revised total reclamation cost estimate of $20.6 million to expand mining operations and address exploration disturbance at the Hycroft Mine. In March the Company plans to increase its surety bond for the benefit of the BLM by $3.9 million. This surety bond will be collateralized by restricted cash.
44
Table of Contents
| Item 7A. | Quantitative and Qualitative Disclosures About Market Risk |
Allied Nevada is currently engaged in the operation of the Hycroft Mine and the evaluation, acquisition, and advancement of gold exploration and development projects in Nevada. The value of our properties is related to gold price and changes in the price of gold will affect our ability to generate revenue from our portfolio of gold projects.
Gold prices may fluctuate widely from time to time and are affected by numerous factors, including the following: expectations with respect to the rate of inflation, exchange rates, interest rates, global and regional political and economic circumstances and governmental policies, including those with respect to gold holdings by central banks. The demand for, and supply of, gold affect gold prices, but not necessarily in the same manner as demand and supply affect the prices of other commodities. The supply of gold consists of a combination of new mine production and existing stocks of bullion and fabricated gold held by governments, public and private financial institutions, industrial organizations and private individuals. The demand for gold primarily consists of jewelry and investments. Additionally, hedging activities by producers, consumers, financial institutions and individuals can affect gold supply and demand. While gold can be readily sold on numerous markets throughout the world, its market value cannot be predicted for any particular time.
Although Allied Nevada has no debt outstanding, during 2010 the Company entered into four capital lease agreements for mine equipment as described in Note 12 to the Consolidated Financial Statements. Each capital lease has a 60 month term at a fixed lease payment. As of December 31, 2010, we had a balance of cash and cash equivalents of $337.8 million. If and to the extent that these funds were invested in interest bearing instruments during the entire year ended December 31, 2010, a hypothetical 1% decrease in the rate of interest earned on these funds would affect our income for the year ended December 31, 2010 by approximately $0.1 million, which is the amount of interest income earned in 2010, as the Company’s actual rate of interest earned was less than 1% per annum. Additionally, we do not have any investment in debt instruments other than highly liquid short-term investments. Accordingly, we consider our interest rate risk exposure to be insignificant at this time.
Allied Nevada is not a party to any market risk sensitive investments, as such term is defined in Item 305 of Regulation S-K, promulgated under the Exchange Act.
45
Table of Contents
| Item 8. | Financial Statements and Supplementary Data |
INDEX TO FINANCIAL STATEMENTS
| Page | ||||
| Consolidated Financial Statements: |
||||
| 47 | ||||
| Management’s Report on Internal Control over Financial Reporting |
48 | |||
| 49 | ||||
| Consolidated Statements of Income (Loss) for the Years Ended December 31, 2010, 2009, and 2008 |
50 | |||
| Consolidated Statements of Cash Flows for the Years Ended December 31, 2010, 2009 and 2008 |
51 | |||
| 52 | ||||
| 53 | ||||
46
Table of Contents
Report of Independent Registered Public Accounting Firm
Board of Directors and Stockholders
Allied Nevada Gold Corp.
Reno, Nevada
We have audited the accompanying consolidated balance sheets of Allied Nevada Gold Corp. and subsidiaries (collectively, the “Company,”) as of December 31, 2010 and 2009, and the related consolidated statements of income (loss), shareholders’ equity, and cash flows for the years ended December 31, 2010, December 31, 2009, and December 31, 2008. We also have audited the Allied Nevada Gold Corp.’s internal control over financial reporting as of December 31, 2010, based upon the criteria established in Internal Control – Integrated Framework, issued by the Committee of Sponsoring Organizations of the Treadway Commission (“COSO”). Allied Nevada Gold Corp.’s management is responsible for these financial statements and for maintaining effective internal control over financial reporting, included in the accompanying Management Report on Internal Control Over Financial Reporting. Our responsibility is to express an opinion on these financial statements and an opinion on the Company’s internal control over financial reporting, based on our audits.
We conducted our audits in accordance with standards of the Public Company Accounting Oversight Board (United States). Those standards require that we plan and perform our audits to obtain reasonable assurance about whether the financial statements are free of material misstatement and whether effective internal control over financial reporting was maintained in all material respects. Our audits of the financial statements included examining, on a test basis, evidence supporting the amounts and disclosures in the financial statements. An audit also includes assessing the accounting principles used and significant estimates made by management, as well as evaluating the overall financial statement presentation. Our audit of internal control over financial reporting included obtaining an understanding of internal control over financial reporting, assessing the risk that a material weakness exists, and testing and evaluating the design and operating effectiveness of internal control, based on the assessed risk. We believe that our audits provide a reasonable basis for our opinions.
A company’s internal control over financial reporting is a process designed to provide reasonable assurance regarding the reliability of financial reporting and the preparation of financial statements for external purposes in accordance with generally accepted accounting principles. A company’s internal control over financial reporting includes those policies and procedures that (1) pertain to the maintenance of records that, in reasonable detail, accurately and fairly reflect the transactions and dispositions of the assets of the Company; (2) provide reasonable assurance that transactions are recorded as necessary to permit accounting principles, and that receipts and expenditures of the Company are being made only in accordance with authorizations of management and directors of the Company; and (3) provide reasonable assurance regarding prevention or timely detection of unauthorized acquisition, use, or disposition of the Company’s assets that could have a material effect on the financial statements.
Because of its inherent limitations, internal control over financial reporting may not prevent or detect misstatements. Also, projections of any evaluation of effectiveness to future periods are subject to the risk that controls may become inadequate because of changes in conditions, or that the degree of compliance with the policies or procedures may deteriorate.
In our opinion, the accompanying consolidated financial statements referred to above present fairly, in all material respects, the financial position of Allied Nevada Gold Corp. and subsidiaries as of December 31, 2010 and 2009, and the results of its operations and its cash flows for the years ended December 31, 2010, December 31, 2009, and December 31, 2008, in conformity with accounting principles generally accepted in the United States of America. Also, in our opinion, Allied Nevada Gold Corp. maintained, in all material respects, effective internal control over financial reporting as of December 31, 2010, based on criteria established in Internal Control – Integrated Framework issued by the Committee of Sponsoring Organizations of the Treadway Commission (“COSO”).
/s/ Ehrhardt Keefe Steiner & Hottman PC
February 25, 2011
Denver, Colorado
47
Table of Contents
Management’s Report on Internal Control over Financial Reporting
The Company’s management is responsible for establishing and maintaining adequate internal control over financial reporting as defined in Rule 13a-15(f) under the Exchange Act. Our internal control over financial reporting is a process designed to provide reasonable assurance regarding the reliability of financial reporting and the preparation of financial statements for external purposes in accordance with accounting principles generally accepted in the United States of America. Because of its inherent limitations, internal control over financial reporting may not prevent or detect misstatements. Also, projections of any evaluation of effectiveness to future periods are subject to the risk that controls may become inadequate because of changes in conditions, or that the degree of compliance with the policies or procedures may deteriorate.
The Company’s management, with the participation of the Company’s Chief Executive Officer and Chief Financial Officer, assessed the effectiveness of the Company’s internal control over financial reporting as of December 31, 2010. In making the assessment, the Company’s management, with the participation of the Company’s Chief Executive Officer and Chief Financial Officer, used the criteria set forth by the Committee of Sponsoring Organizations of the Treadway Commission in “Internal Control-Integrated Framework.” Based on that assessment, the Company’s management, with the participation of the Company’s Chief Executive Officer and Chief Financial Officer, concluded that, as of December 31, 2010, the Company’s internal control over financial reporting was effective based on such criteria.
The effectiveness of the Company’s internal control over financial reporting as of December 31, 2010 has been audited by Ehrhardt Keefe Steiner & Hottman PC, an independent registered public accounting firm, as stated in their report, which is included herein.
| /s/ Scott A. Caldwell |
/s/ Hal D. Kirby | |||
| Scott A. Caldwell |
Hal D. Kirby | |||
| President and Chief Executive Officer |
Executive Vice President and Chief Financial Officer | |||
| February 25, 2011 |
48
Table of Contents
ALLIED NEVADA GOLD CORP.
(US dollars in thousands, except share amounts)
| December 31, | ||||||||
| 2010 | 2009 | |||||||
| Assets: |
||||||||
| Cash and cash equivalents |
$ | 337,829 | $ | 91,581 | ||||
| Inventories - Note 4 |
9,978 | 6,773 | ||||||
| Ore on leachpads - Note 5 |
49,357 | 34,179 | ||||||
| Prepaids and other |
7,405 | 3,911 | ||||||
| Deferred tax asset, current portion - Note 6 |
4,655 | 4,344 | ||||||
| Current assets |
409,224 | 140,788 | ||||||
| Restricted cash - Note 7 |
15,020 | 14,066 | ||||||
| Plant and equipment, net - Note 8 |
66,081 | 35,367 | ||||||
| Mine development costs - Note 9 |
18,874 | 10,389 | ||||||
| Reclamation premium and asset retirement cost asset |
2,292 | 2,431 | ||||||
| Mineral properties - Note 10 |
35,522 | 35,845 | ||||||
| Deferred tax asset, non-current portion - Note 6 |
20,339 | 13,539 | ||||||
| Total assets |
$ | 567,352 | $ | 252,425 | ||||
| Liabilities: |
||||||||
| Accounts payable |
$ | 14,924 | $ | 12,414 | ||||
| Amounts due to related parties - Note 11 |
7 | 28 | ||||||
| Accrued liabilities and other - Note 17 |
1,732 | 1,476 | ||||||
| Capital lease obligations, current portion - Note 12 |
3,215 | 1,298 | ||||||
| Asset retirement obligation, current portion - Note 13 |
463 | 476 | ||||||
| Current liabilities |
20,341 | 15,692 | ||||||
| Capital lease obligations, non-current portion - Note 12 |
11,104 | 4,700 | ||||||
| Asset retirement obligation, non-current portion - Note 13 |
6,303 | 6,167 | ||||||
| Other accrued liabilities - Note 14 |
6,850 | 2,686 | ||||||
| Total liabilities |
44,598 | 29,245 | ||||||
| Commitments and Contingencies - Note 23 |
||||||||
| Shareholders’ Equity: |
||||||||
| Common stock - Note 16 |
89 | 74 | ||||||
| Additional paid-in-capital |
583,354 | 317,923 | ||||||
| Accumulated deficit |
(60,689 | ) | (94,817 | ) | ||||
| Total shareholders’ equity |
522,754 | 223,180 | ||||||
| Total liabilities and shareholders’ equity |
$ | 567,352 | $ | 252,425 | ||||
The accompanying notes are an integral part of these statements.
49
Table of Contents
ALLIED NEVADA GOLD CORP.
CONSOLIDATED STATEMENTS OF INCOME (LOSS)
(US dollars in thousands, except per share amounts)
| Years Ended December 31, | ||||||||||||
| 2010 | 2009 | 2008 | ||||||||||
| Revenue: |
||||||||||||
| Gold sales |
$ | 126,088 | $ | 42,398 | $ | — | ||||||
| Silver sales |
4,842 | 806 | — | |||||||||
| 130,930 | 43,204 | — | ||||||||||
| Operating expenses: |
||||||||||||
| Cost of sales (excludes depreciation, amortization, and accretion) |
47,646 | 17,411 | — | |||||||||
| 83,284 | 25,793 | — | ||||||||||
| Stripping costs |
10,067 | 8,255 | — | |||||||||
| Mine start-up costs |
— | — | 12,028 | |||||||||
| Depreciation and amortization |
6,972 | 3,132 | 1,587 | |||||||||
| Exploration and land holding costs |
22,502 | 5,554 | 16,658 | |||||||||
| Impairment of mineral properties - Note 10 |
— | — | 38,970 | |||||||||
| Accretion - Note 13 |
442 | 394 | 411 | |||||||||
| Corporate general and administrative |
19,766 | 12,355 | 9,584 | |||||||||
| Income (loss) from operations |
23,535 | (3,897 | ) | (79,238 | ) | |||||||
| Interest income |
145 | 49 | 932 | |||||||||
| Interest expense - Note 18 |
— | (1,030 | ) | (1,876 | ) | |||||||
| Loss due to change in value of equity-linked financial instruments - Note 15 |
— | (5,152 | ) | — | ||||||||
| Net foreign exchange gain (loss) |
3,067 | 536 | (267 | ) | ||||||||
| Other income |
269 | 62 | 808 | |||||||||
| Income (loss) before income taxes |
27,016 | (9,432 | ) | (79,641 | ) | |||||||
| Income tax benefit - Note 6 |
7,112 | 17,883 | — | |||||||||
| Net income (loss) |
$ | 34,128 | $ | 8,451 | $ | (79,641 | ) | |||||
| Earnings (loss) per share: |
||||||||||||
| Basic: |
||||||||||||
| Weighted average number of shares outstanding |
82,797,199 | 63,850,230 | 53,469,516 | |||||||||
| Income (loss) per share - Note 22 |
$ | 0.41 | $ | 0.13 | $ | (1.49 | ) | |||||
| Diluted: |
||||||||||||
| Weighted average number of shares outstanding |
84,093,633 | 65,440,954 | 53,469,516 | |||||||||
| Income (loss) per share - Note 22 |
$ | 0.41 | $ | 0.13 | $ | (1.49 | ) | |||||
The accompanying notes are an integral part of these statements.
50
Table of Contents
ALLIED NEVADA GOLD CORP.
CONSOLIDATED STATEMENTS OF CASH FLOWS
(US dollars in thousands)
| Years Ended December 31, | ||||||||||||
| 2010 | 2009 | 2008 | ||||||||||
| Cash flows from operating activities: |
||||||||||||
| Net income (loss) |
$ | 34,128 | $ | 8,451 | $ | (79,641 | ) | |||||
| Adjustments to reconcile net income (loss) for the period to net cash provided by (used in) operating activites: |
||||||||||||
| Depreciation and amortization |
6,972 | 3,132 | 1,587 | |||||||||
| Amortization of deferred loan costs |
— | 87 | 1,748 | |||||||||
| Impairment of mineral interests |
— | — | 38,970 | |||||||||
| Accretion |
442 | 394 | 411 | |||||||||
| Stock-based compensation |
4,092 | 3,776 | 3,938 | |||||||||
| Foreign exchange loss |
— | 1,018 | 313 | |||||||||
| Gain (loss) on disposal of assets |
— | 92 | (809 | ) | ||||||||
| Loss due to change in fair value of equity-linked financial instruments |
— | 5,152 | — | |||||||||
| Gain on recognition of AMRs |
(269 | ) | (152 | ) | — | |||||||
| Deferred income tax benefit |
(7,111 | ) | (17,883 | ) | — | |||||||
| Change in operating assets and liabilities: |
||||||||||||
| Inventories |
(3,035 | ) | (3,992 | ) | (2,098 | ) | ||||||
| Ore on leach pads |
(14,008 | ) | (27,778 | ) | (2,721 | ) | ||||||
| Prepaids and other |
(3,493 | ) | (2,673 | ) | (170 | ) | ||||||
| Reclamation expenditures |
(470 | ) | (167 | ) | — | |||||||
| Accounts payable and amounts due to related parties |
2,490 | 4,307 | 7,172 | |||||||||
| Accrued liabilities and other |
4,557 | 2,419 | 586 | |||||||||
| Net cash provided by (used in) operating activities |
24,295 | (23,817 | ) | (30,714 | ) | |||||||
| Cash flows from investing activities: |
||||||||||||
| Additions to plant and equipment |
(27,209 | ) | (6,664 | ) | (26,803 | ) | ||||||
| Additions to mine development costs |
(9,816 | ) | (3,210 | ) | (8,496 | ) | ||||||
| Increase in restricted cash |
(954 | ) | (1,429 | ) | (7,051 | ) | ||||||
| Proceeds from advance minimum royalties |
131 | 200 | 634 | |||||||||
| Proceeds on disposal of mineral properties |
— | — | 1,625 | |||||||||
| Net cash used in investing activities |
(37,848 | ) | (11,103 | ) | (40,091 | ) | ||||||
| Cash flows from financing activities: |
||||||||||||
| Proceeds on issuance of common stock |
279,240 | 117,388 | 74,724 | |||||||||
| Share issuance costs |
(17,886 | ) | (5,193 | ) | (5,171 | ) | ||||||
| Proceeds from term loan |
— | 6,348 | 9,745 | |||||||||
| Repayment of term loan |
— | (7,366 | ) | (10,058 | ) | |||||||
| Payment of loan costs |
— | (87 | ) | (1,748 | ) | |||||||
| Repayments of principal on capital lease agreements |
(1,553 | ) | (1,100 | ) | (281 | ) | ||||||
| Net cash provided by financing activities |
259,801 | 109,990 | 67,211 | |||||||||
| Net increase (decrease) in cash and cash equivalents |
246,248 | 75,070 | (3,594 | ) | ||||||||
| Cash and cash equivalents, beginning of year |
91,581 | 16,511 | 20,105 | |||||||||
| Cash and cash equivalents, end of year |
$ | 337,829 | $ | 91,581 | $ | 16,511 | ||||||
| Supplemental cash flow disclosures: |
||||||||||||
| Cash paid for interest |
$ | 440 | $ | 1,050 | $ | 2,075 | ||||||
| Cash paid for income taxes |
800 | — | — | |||||||||
| Non-cash financing and investing activities |
||||||||||||
| Shares issued in satisfaction of liability for equity-linked financial instruments |
— | 9,484 | — | |||||||||
| Mining equipment acquired by capital lease |
9,873 | 4,105 | 3,241 | |||||||||
The accompanying notes are an integral part of these statements.
51
Table of Contents
ALLIED NEVADA GOLD CORP.
CONSOLIDATED STATEMENTS OF SHAREHOLDERS’ EQUITY
(US dollars in thousands, except share amounts)
| Common Stock | Additional Paid-in Capital |
Accumulated Deficit |
Total Shareholders’ Equity |
|||||||||||||||||
| Shares | Amount | |||||||||||||||||||
| Balance, December 31, 2007 |
42,842,594 | $ | 43 | $ | 121,904 | $ | (22,191 | ) | $ | 99,756 | ||||||||||
| Shares issued in public offering |
14,375,000 | 14 | 69,230 | — | 69,244 | |||||||||||||||
| Shares issued under warrant exercises |
114,850 | — | — | — | — | |||||||||||||||
| Shares issued under stock option plans |
100,700 | — | 277 | — | 277 | |||||||||||||||
| Stock based compensation |
— | — | 3,938 | — | 3,938 | |||||||||||||||
| Stock option plan shares subscribed |
— | — | 32 | — | 32 | |||||||||||||||
| Net loss |
— | — | — | (79,641 | ) | (79,641 | ) | |||||||||||||
| Balance, December 31, 2008 |
57,433,144 | $ | 57 | $ | 195,381 | $ | (101,832 | ) | $ | 93,606 | ||||||||||
| Shares issued under warrant exercises |
3,780,850 | 4 | 28,835 | — | 28,839 | |||||||||||||||
| Cumulative effect related to the adoption of ASC |
— | — | (2,896 | ) | (1,436 | ) | (4,332 | ) | ||||||||||||
| Shares issued under stock option plans |
1,461,273 | 2 | 6,445 | — | 6,447 | |||||||||||||||
| Shares issued in public offering |
11,150,000 | 11 | 91,499 | — | 91,510 | |||||||||||||||
| Share issuance costs |
— | — | (5,193 | ) | — | (5,193 | ) | |||||||||||||
| Stock-based compensation and |
||||||||||||||||||||
| RSU plan share issuances |
12,000 | — | 3,776 | — | 3,776 | |||||||||||||||
| Stock option plan shares subscribed |
— | — | 76 | — | 76 | |||||||||||||||
| Net income |
— | — | — | 8,451 | 8,451 | |||||||||||||||
| Balance, December 31, 2009 |
73,837,267 | $ | 74 | $ | 317,923 | $ | (94,817 | ) | $ | 223,180 | ||||||||||
| Shares issued under stock option plans |
1,471,623 | 1 | 7,042 | — | 7,043 | |||||||||||||||
| Shares issued in public offering |
13,500,000 | 14 | 272,183 | — | 272,197 | |||||||||||||||
| Share issuance costs |
— | — | (17,886 | ) | — | (17,886 | ) | |||||||||||||
| Stock-based compensation and |
||||||||||||||||||||
| RSU plan share issuances |
150,099 | — | 4,092 | — | 4,092 | |||||||||||||||
| Net income |
— | — | 34,128 | 34,128 | ||||||||||||||||
| Balance, December 31, 2010 |
88,958,989 | $ | 89 | $ | 583,354 | $ | (60,689 | ) | $ | 522,754 | ||||||||||
The accompanying notes are an integral part of these statements.
52
Table of Contents
ALLIED NEVADA GOLD CORP.
Notes to Consolidated Financial Statements
1. Basis of Presentation and Nature of Operations
The Consolidated Financial Statements of Allied Nevada Gold Corp. and its subsidiaries (collectively, “Allied Nevada” or the “Company”), have been prepared in accordance with generally accepted accounting principles in the United States. The results of operations are not necessarily indicative of the operating results of future years.
Allied Nevada operates in the gold mining industry and is engaged in the mining, evaluation, acquisition, and advancement of gold exploration and development projects. Allied Nevada’s Operating Property, the Hycroft Mine, and its Advanced Exploration and Other Exploration Properties are located in the State of Nevada.
2. Summary of Significant Accounting Policies
Use of Estimates
The preparation of the Company’s Consolidated Financial Statements requires management to make estimates and assumptions that affect the reported amounts of assets and liabilities and the related disclosure of contingent assets and liabilities at the date of the Consolidated Financial Statements and the reported amounts of expenses during the reporting period. The more significant areas requiring the use of management estimates and assumptions relate to mineral reserves that are the basis for future cash flow estimates utilized in impairment calculations and units of production amortization calculations; environmental, reclamation and closure obligations; estimates of fair value for asset impairments; estimates of recoverable gold in leach pad inventories; net realizable value of ore on leach pads; and the valuation allowances for deferred tax assets. The Company bases its estimates on various assumptions that are believed to be reasonable under the circumstances. Accordingly, actual results may differ significantly from these estimates under different assumptions or conditions.
Principles of Consolidation
The Consolidated Financial Statements include the accounts of Allied Nevada Gold Corp. and its wholly-owned subsidiaries. All significant intercompany balances and transactions have been eliminated.
Cash and Cash Equivalents
Cash and cash equivalents consist of all cash balances and highly liquid investments with an original maturity of three months or less. Because of the short maturity of these investments, the carrying amounts approximate their fair value. Cash and cash equivalents are invested in a highly liquid money market fund. Restricted cash is excluded from cash and cash equivalents and is included in other current and long-term assets.
Ore on Leach Pads and Inventories
As described below, costs that are incurred in or benefit the productive process are accumulated as ore on leach pads and inventories. Ore on leach pads and inventories are carried at the lower of average cost or net realizable value. Net realizable value represents the estimated future sales price of the product based on current metals prices, less the estimated costs to complete production and bring the product to sale.
The recovery of gold from the Hycroft Mine’s oxide ore is accomplished through the heap leaching process. Under this method, oxide ore is placed on leach pads where it is treated with a chemical solution, which dissolves the gold contained in the ore. The resulting “pregnant” solution is further processed in a plant where doré is produced. Costs are added to ore on leach pads based on current mining and processing costs, including applicable depreciation, depletion and amortization relating to mining and processing operations. Costs are removed from ore on leach pads as ounces are recovered based on the average cost per estimated recoverable ounce of gold on the leach pad.
The estimates of recoverable gold on the leach pads are calculated from the quantities of ore placed on the leach pads (measured in tons), the grade of ore placed on the leach pads (based on assay data), a recovery percentage (based on ore type) , and the processing method (crushed ore or run of mine ore).
Although we expect to reconcile the quantities of recoverable gold placed on the leach pads by comparing the grades of ore placed on pads to the quantities of gold actually recovered (metallurgical balancing), the nature of the leaching process inherently limits the ability to precisely monitor inventory levels. As a result, we expect the metallurgical balancing process will be constantly monitored and estimates will be refined based on actual results over time. Variations between actual and estimated quantities resulting from changes in assumptions and estimates that do not result in write-downs to net realizable value will be accounted for on a prospective basis.
53
Table of Contents
ALLIED NEVADA GOLD CORP.
Notes to Consolidated Financial Statements—(Continued)
In-process Inventory
In-process inventories represent materials that are currently in the process of being converted to a saleable product. Conversion processes currently being used by the Company include a Merrill-Crowe zinc-precipitation process (“Merrill-Crowe process”) and a Carbon in Column solution recovery process (“CIC process”). In-process material is measured based on assays of the material fed into the process and the projected recoveries of the respective plants. In-process inventories are valued at the average cost of the material fed into the process attributable to the source material coming from the leach pads plus the in-process conversion costs, including applicable depreciation relating to the process facilities incurred to that point in the process.
Precious Metals Inventory
Precious metals inventories include doré and both gold and silver bullion. Precious metals that result from the Company’s mining and processing activities are valued at the average cost of the respective in-process inventories incurred prior to the refining process.
Materials and Supplies Inventory
Materials and supplies are valued at the lower of average cost or net realizable value. Cost includes applicable taxes and freight.
Plant and Equipment
Expenditures for new facilities or equipment and expenditures that extend the useful lives or expand the production capacity of existing facilities or equipment are capitalized and depreciated using the straight-line or units of production method at rates sufficient to depreciate such costs over the estimated productive lives of such facilities based on proven and probable reserves.
Planned major maintenance activities are accounted for using the deferral method. Under the deferral method, applicable costs incurred are deferred and charged to expense on a straight-line basis over the period to the next estimated planned major maintenance, which we estimate to be a period of twelve months based on frequency of such activities for our mining equipment. The activities associated with such planned major maintenance cannot be performed while the equipment is in service and, as such, are completed during a planned major maintenance activity. The costs deferred are not otherwise routinely performed to maintain the intended operating capability of the equipment. Repairs and maintenance activities are charged to expense as incurred.
Mine Development and Stripping Costs
Mine development costs consist primarily of the cost of removing overburden and waste materials (“stripping costs”) incurred prior to production as defined in Accounting Standards Codification 930-330-20, and development drilling and related assaying costs to delineate an ore body. The above costs incurred before mineralization is classified as proven and probable reserves are expensed as incurred.
Capitalization of mine development costs, that meet the definition of an asset, begins once mineralization is classified as proven and probable. The cost of removing overburden and waste materials to access proven and probable reserves prior to the production phase of a mine are referred to as “pre-stripping costs” and are capitalized during the development of an open pit mine. Where multiple open pits exist using common processing facilities, pre-stripping costs are capitalized at each pit. Normal stripping costs are included as a component of inventory. Stripping costs in excess of those considered to be normal are expensed as incurred.
Drilling and related costs are capitalized for an ore body where proven and probable reserves exist and the activities are directed at obtaining additional information on the ore body or converting non-reserve mineralization to proven and probable reserves. All other drilling costs are expensed as incurred. Drilling costs incurred during the production phase for ore control are allocated to inventory costs and then included as a component of cost of sales.
Mine development costs are amortized using the units-of-production (“UOP”) method based upon projected recoverable ounces in proven and probable reserves. Projected recoverable ounces are determined by the Company based upon its proven and probable reserves and estimated metal recovery associated with those reserves.
54
Table of Contents
ALLIED NEVADA GOLD CORP.
Notes to Consolidated Financial Statements—(Continued)
Mineral Properties
Mineral property acquisition costs are recorded at cost and are deferred until the viability of the property is determined. We currently have one Operating Property, the Hycroft Mine (“Hycroft Mine”), which is located approximately 54 miles west of Winnemucca, Nevada. Exploration, mineral property evaluation, option payments, related acquisition costs for mineral properties acquired under an option agreement, general overhead, administrative and holding costs to maintain a property on a care and maintenance basis are expensed in the period they are incurred. When proven and probable reserves are determined for a property, subsequent development costs on the property are capitalized. Once a property is in the production phase, capitalized development costs are depleted on the units of production basis determined by the proven and probable reserves for that project.
Advanced minimum royalty (“AMR”) payments are made by the mining operators on certain mineral interests to the Company prior to the commencement of commercial production on the property under lease. After the commencement of commercial production, the mining operator recovers these payments out of production royalty payments due to the Company. Upon receipt, these payments are initially recorded by the Company as deferred income. The related income is recognized when the lessee’s right to offset the AMR against future royalty payments expires or is forfeited upon releasing the mineral interests back to Allied Nevada.
The Company reviews the cost of mineral properties for impairment whenever events and circumstances indicate that a decline in recoverability of their carrying value may have occurred but in any event not less than annually. Where applicable, management estimates the expected future cash flows of mineral properties and compares such future cash flows to the carrying amount of the mineral properties to determine if the carrying amount is recoverable. If the carrying amount exceeds the estimated undiscounted future net cash flows, the Company will adjust the carrying amount of such mineral properties to fair value. Other factors used to determine fair value include, but are not limited to, estimates of land value of Other Exploration Properties, the value of unproven acreage, the value of advanced minimum royalty agreements, and a discount rate commensurate with the risk associated with realizing the expected cash flows projected. There were no impairments to the carrying value of mineral properties in 2010 or 2009. In 2008, we recognized a mineral property impairment of $39.0 million.
Although the Company has taken steps to verify title to mineral properties in which it has an interest, these procedures do not guarantee the Company’s title. Such properties may be subject to prior undetected agreements or transfers and title may be affected by such defects.
Long-lived Assets
The Company reviews and evaluates its long-lived assets for impairment annually, and at interim periods if events or changes in circumstances indicate that the related carrying amounts may not be recoverable, in accordance with Accounting Standards Codification 360-10-35 regarding subsequent measurement of long-lived assets. An impairment is considered if the total estimated future cash flows on an undiscounted basis are less than the carrying amount of the assets. An impairment loss is measured and recorded based on the excess carrying value of the impaired assets over fair value. The Company analyzes future discounted cash flows to determine the fair value of its mineral properties. Future cash flows are estimated based on quantities of recoverable minerals, expected gold and other commodity prices (considering current and historical prices, price trends and related factors), production levels and operating costs of production and capital, all based on life-of-mine plans. The term “recoverable minerals” refers to the estimated amount of gold or other commodities that will be obtained after taking into account losses during ore processing and treatment. Estimates of recoverable minerals from such mineral interests are risk adjusted based on management’s relative confidence in such materials. In estimating future cash flows, assets are grouped at the lowest level for which there are identifiable cash flows that are largely independent of future cash flows from other asset groups. The Company’s estimates of future cash flows are based on numerous assumptions and it is possible that actual future cash flows will be significantly different than the estimates, as actual future quantities of recoverable minerals, gold and other commodity prices, production levels and operating costs of production and capital are each subject to significant risks and uncertainties. There were no impairments to long-lived assets in 2010, 2009, or 2008.
Assets under Lease
Assets under lease which in substance transfer the risks and benefits of ownership of the assets to the Company are capitalized under fixed assets. The assets and the corresponding lease obligations are recorded at the lower of present value of the minimum lease payments or the fair value of the leased assets at the beginning of the lease terms. Such leased assets are subject to depreciation consistent with that for depreciable assets which are owned. Leases which do not meet such criteria are classified as operating leases and the related rentals are charged to the income statement as incurred.
55
Table of Contents
ALLIED NEVADA GOLD CORP.
Notes to Consolidated Financial Statements—(Continued)
Reclamation and Remediation Costs (Asset Retirement Obligations)
Reclamation costs are allocated to expense over the life of the related assets and are periodically adjusted to reflect changes in the estimated present value resulting from revisions to the estimates of either the timing or amount of the reclamation and abandonment costs. Such costs include care and maintenance, removal of mining infrastructure, covering disturbed areas, and revegetation of the land. The asset retirement obligation is based on when the spending for an existing environmental disturbance and activity to date will occur. The Company reviews, on an annual basis, unless otherwise deemed necessary, its asset retirement obligation in accordance with Accounting Standards Codification 410, “Asset Retirement and Environmental Obligations”.
In addition, the related asset retirement costs and premiums are capitalized and amortized on a units of production basis. These typically arise from insurance premiums that are paid which enable the Company to acquire the necessary reclamation bonds, required by the Bureau of Land Management (“BLM”) in order to continue mining operations; or changes in estimated cash flows resulting from the Company’s annual review of the asset retirement obligation.
Sales
The Company recognizes revenue on gold and silver sales when persuasive evidence of an arrangement exists, the price is fixed or determinable, the metal is delivered, the title has been transferred to the customer, and collectability is reasonably assured. The Company sold 93% of its gold and silver to one customer during 2010.
Income Taxes
The Company accounts for income taxes using the liability method, recognizing certain temporary differences between the financial reporting basis of the Company’s liabilities and assets and the related income tax basis for such liabilities and assets. This method generates either a net deferred income tax liability or asset for the Company, as measured by the statutory tax rates in effect. The Company derives its deferred income tax charge or benefit by recording the change in either the net deferred income tax liability or asset balance for the year.
The Company’s deferred income tax assets include certain future tax benefits. The Company records a valuation allowance against any portion of those deferred income tax assets when it believes, based on the weight of available evidence, it is more likely than not that some portion or all of the deferred income tax asset will not be realized.
Stock-Based Compensation
The Company accounts for stock-based compensation in accordance with Accounting Standards Codification 718, “Stock Compensation” (“ASC 718”), which requires companies to recognize compensation expense for share-based payments based on the estimated fair value of the awards. ASC 718 also requires tax benefits relating to the deductibility of increases in the value of equity instruments issued under share-based compensation arrangements that are not included in costs applicable to sales (“excess tax benefits”) to be presented as financing cash inflows in the Statement of Cash Flows.
Income (loss) Per Share
Basic income (loss) per share amounts are calculated by using the weighted-average number of common shares outstanding during the year. Diluted income per share amounts reflect the potential dilution that could occur if securities or other contracts that may require the issuance of common shares in the future were converted unless their inclusion would be anti-dilutive. As the Company incurred a net loss in 2008, potential shares to be issued from the assumed exercise of options, warrants, and restricted shares were not included in the computation of diluted earnings per share in 2008, since their result would have been anti-dilutive.
Concentration of Risk
The Company is engaged in the production of gold at its sole operating property, the Hycroft Mine. Accordingly, it expects the principal source of future revenue to be the sale of gold. A significant and sustained decrease in the price of gold from current levels could have a material and negative impact on the Company’s business, financial condition and results of operations.
The Company has placed nearly all of its cash investments with a single high quality financial institution. All cash equivalents were invested in high quality short-term money market instruments, including government securities, bankers’ acceptances, bank notes, certificates of deposit, commercial paper and repurchase agreements of domestic and foreign issuers. At December 31, 2010 and 2009, respectively, we had no funds invested in asset-backed commercial paper. The Company has not experienced any losses on its cash investments.
56
Table of Contents
ALLIED NEVADA GOLD CORP.
Notes to Consolidated Financial Statements—(Continued)
The Company currently has one operating property, the Hycroft Mine. The Company does not carry business interruption insurance relating to the Hycroft Mine. Accordingly, loss of production at the Hycroft Mine could produce a near-term severe impact to Allied Nevada. Additionally, not all risks that could result in cessation of operations are insurable.
All of the Company’s properties are located in the State of Nevada. Any significant changes to the BLM regulations could have a negative impact on the Company’s financial position.
3. New Accounting Pronouncements
Fair Value Accounting
In January 2010, the ASC guidance for fair value measurements and disclosure was updated to require additional disclosures related to: i) transfers in and out of level 1 and 2 fair value measurements and ii) enhanced detail in the level 3 reconciliation. The guidance was amended to provide clarity about: i) the level of disaggregation required for assets and liabilities and ii) the disclosures required for inputs and valuation techniques used to measure fair value for both recurring and nonrecurring measurements that fall in either level 2 or level 3. The updated guidance is effective for the Company’s fiscal year beginning January 1, 2010, with the exception of the level 3 disaggregation which is effective for the Company’s fiscal year beginning January 1, 2011. The adoption of this guidance did not have an impact on the Company’s consolidated financial position, results of operations, or cash flows.
4. Inventories
The following table summarizes the components of inventories (in thousands):
| December 31, | ||||||||
| 2010 | 2009 | |||||||
| In-process inventory |
$ | 6,159 | $ | 5,039 | ||||
| Precious metals inventory |
310 | 21 | ||||||
| Materials and supplies inventory |
3,509 | 1,713 | ||||||
| $ | 9,978 | $ | 6,773 | |||||
In-process inventory and precious metals are carried at the lower of average cost or net realizable value. Cost includes mining and process costs including mine site overhead and depreciation and amortization relating to mining and process operations. Normal stripping costs during the production phase are also included as a component of inventory. Stripping costs in excess of those considered normal are expensed as incurred. Net realizable value represents the estimated future sales price of the product based on current metals prices, less estimated costs to complete production and bring the product to sale.
Materials and supplies are valued at the lower of average cost or net realizable value. Cost includes applicable taxes and freight.
5. Ore on leach pads
The following table summarizes ore on leach pads and estimated recoverable ounces:
| December 31, | ||||||||
| 2010 | 2009 | |||||||
| Ore on leach pads (in thousands) |
$ | 49,357 | $ | 34,179 | ||||
| Estimated recoverable ounces |
77,265 | 72,140 | ||||||
Ore on leach pads is carried at the lower of average cost or net realizable value. Cost includes mining and process costs including mine site overhead and depreciation and amortization relating to mining and process operations. Normal stripping costs are also included as a component of ore on leach pads. Stripping costs in excess of those considered normal are expensed as incurred. Costs are removed from ore on leach pads as ounces are recovered based on the average cost per estimated recoverable ounce of gold on the leach pad.
57
Table of Contents
ALLIED NEVADA GOLD CORP.
Notes to Consolidated Financial Statements—(Continued)
6. Income Taxes
The Company’s income (loss) before income taxes is as follows (thousands):
| December 31, | ||||||||||||
| 2010 | 2009 | 2008 | ||||||||||
| United States |
$ | 27,016 | $ | (9,432 | ) | $ | (79,641 | ) | ||||
| Total income (loss) before income taxes |
27,016 | (9,432 | ) | (79,641 | ) | |||||||
The components of the Company’s provision (benefit) for income taxes are as follows (in thousands):
| December 31, | ||||||||||||
| 2010 | 2009 | 2008 | ||||||||||
| Current: |
||||||||||||
| Federal |
$ | — | $ | — | $ | — | ||||||
| Deferred: |
||||||||||||
| Federal |
4,354 | (1,490 | ) | (27,730 | ) | |||||||
| Change in valuation allowance |
(11,466 | ) | (16,393 | ) | 27,730 | |||||||
| Total provision (benefit) for income taxes |
$ | (7,112 | ) | $ | (17,883 | ) | $ | — | ||||
Net deferred taxes assets are attributable to the following (in thousands):
| December 31, | ||||||||
| 2010 | 2009 | |||||||
| Current deferred tax assets |
||||||||
| Unrealized gains and other |
$ | 275 | $ | 454 | ||||
| Net operating loss |
6,970 | 9,856 | ||||||
| Total current deferred tax assets |
7,245 | 10,310 | ||||||
| Valuation allowance |
(2,590 | ) | (5,966 | ) | ||||
| Net current deferred tax assets |
4,655 | 4,344 | ||||||
| Non-current deferred tax assets |
||||||||
| Property - tax basis in excess of book |
19,638 | 15,900 | ||||||
| Stock-based compensation |
5,358 | 3,819 | ||||||
| Net operating loss |
4,290 | 11,558 | ||||||
| Accrued reclamation |
2,369 | 2,137 | ||||||
| Other |
— | 118 | ||||||
| Total non-current deferred tax assets |
31,655 | 33,532 | ||||||
| Non-current deferred tax liabilities |
||||||||
| Other |
— | (588 | ) | |||||
| Total non-current deferred tax liabilities |
— | (588 | ) | |||||
| Net non-current deferred tax assets |
31,655 | 32,944 | ||||||
| Valuation allowance |
(11,316 | ) | (19,405 | ) | ||||
| Total |
20,339 | 13,539 | ||||||
| Total net deferred tax assets |
$ | 24,994 | $ | 17,883 | ||||
58
Table of Contents
ALLIED NEVADA GOLD CORP.
Notes to Consolidated Financial Statements—(Continued)
A reconciliation of income taxes computed at the United States Federal statutory tax rate to income tax expense follows (in thousands):
| Years ended December 31, | ||||||||||||||||||||||||
| 2010 | 2009 | 2008 | ||||||||||||||||||||||
| Amount | % of Pretax Income |
Amount | % of Pretax Income |
Amount | % of Pretax Income |
|||||||||||||||||||
| Income taxed at statutory rates-(Benefit) |
$ | 9,456 | 35.00 | % | $ | (3,301 | ) | (35.00 | )% | $ | (27,874 | ) | (35.00 | )% | ||||||||||
| Permanent differences |
12 | 0.04 | % | 1,811 | (19.21 | )% | 8 | 0.01 | % | |||||||||||||||
| Percentage depletion |
(3,672 | ) | (13.59 | )% | — | — | — | — | ||||||||||||||||
| Adjustment to tax basis of reclamation asset |
(765 | ) | (2.83 | )% | — | — | — | — | ||||||||||||||||
| Other |
(677 | ) | (2.51 | )% | — | — | 136 | 0.17 | % | |||||||||||||||
| Change in valuation allowance |
(11,466 | ) | (42.44 | )% | (16,393 | ) | 173.81 | % | 27,730 | 34.82 | % | |||||||||||||
| Income tax provision (benefit) |
$ | (7,112 | ) | (26.33 | )% | $ | (17,883 | ) | 189.60 | % | $ | — | — | |||||||||||
The Company has net operating loss carryovers as of December 31, 2010 of $58.9 million for federal income tax purposes and $32.2 million for financial statement purposes. The difference of $26.7 million relates to tax deductions for stock based compensation in excess of financial statement compensation expense. The benefit of these excess tax deductions will not be credited to additional paid in capital for financial statement purposes until the related deductions reduce taxes payable. The net operating loss carryovers may be carried back two years and forward twenty years from the year the net operating loss was generated. The net operating losses will expire in varying amounts from 2011 to 2029.
The Company provided a valuation allowance against its net deferred tax assets of $13.9 million as of December 31, 2010, since it cannot conclude that it is more likely than not that $13.9 million of the net deferred tax assets will be fully realized on future income tax returns. The ultimate realization of deferred tax assets is dependent upon the generation of future taxable income during the periods in which those temporary differences become deductible. Management considers the scheduled reversal of deferred tax liabilities, available taxes in carryback periods, projected future taxable income projections and tax planning strategies in making this assessment. The Company released $11.5 million and $16.4 million of its valuation allowance for the years ended December 31, 2010 and 2009, respectively, based on its future taxable income and ability to utilize its net operating loss carryforwards. The Company will continue to evaluate whether the remaining valuation allowance is needed in future reporting periods.
On January 1, 2007, the Company adopted Financial Accounting Standards Board ASC 740-10-25 (formerly known as FIN 48), “Accounting for Uncertainty in Income Taxes”. The Company believes that the tax positions taken in the Company’s tax returns satisfy the more-likely-than-not threshold for benefit recognition. Furthermore, a review of the Company’s trial balances suggests that the Company has appropriately addressed the material book-tax differences. The Company is confident that the amounts claimed (or expected to be claimed) in the tax returns reflect the largest amount of such benefits that are greater than fifty percent likely of being realized upon ultimate settlement. Accordingly, no ASC 740-10-25 liabilities have been recorded by the Company as a result of ASC 740-10-25. Any potential adjustments for uncertain tax positions would be reclassified between deferred tax asset—NOL and another deferred tax asset. No penalty or interest would be recorded as the Company is not currently, and has not in the past, been in a taxable income position after the deduction for net operating losses. The Company’s policy is to recognize interest and penalties, if any, related to uncertain tax positions in general and administrative expenses. Neither interest nor penalties related to uncertain tax positions were accrued at December 31, 2010.
With limited exception, the Company is no longer subject to U.S. federal income tax audits by taxing authorities for years through 2006.
7. Restricted Cash
The Company has entered into an insurance-backed financial assurance program which includes a mine reclamation policy and a pollution legal liability policy for the Hycroft Mine. As part of the policy, the Company paid an insurance premium and deposited funds in a commutation account used to reimburse reclamation costs and indemnity claims paid by the Company. The insurance policy will cover reclamation costs in the event the Company defaults on payment of its reclamation costs. The insurance premium is being amortized over 14 years and the unamortized reclamation premium cost balance at December 31, 2010 and 2009 was $0.8 million and $0.9 million, respectively.
59
Table of Contents
ALLIED NEVADA GOLD CORP.
Notes to Consolidated Financial Statements—(Continued)
In February 2010 and September 2009, the Company increased collateral account balances to support additional surety bonds for the benefit of the Bureau of Land Management (BLM). These additional surety bonds allowed the Company to continue operations at the Hycroft Mine.
Changes in the Company’s restricted cash are as follows (in thousands):
| 2010 | 2009 | |||||||
| Balance, beginning of year |
$ | 14,066 | $ | 12,637 | ||||
| Additions |
908 | 1,390 | ||||||
| Interest |
46 | 39 | ||||||
| Balance, end of year |
$ | 15,020 | $ | 14,066 | ||||
8. Plant and Equipment
Plant and equipment consist of the following (in thousands):
| Depreciable life or method | December 31, | |||||||||
| 2010 | 2009 | |||||||||
| Equipment |
3 - 10 years | $ | 59,965 | $ | 38,395 | |||||
| Buildings and leasehold improvements |
3 - 10 years | 4,410 | 3,895 | |||||||
| Leach pads |
Units of Production | 19,094 | 3,120 | |||||||
| Furniture, fixtures, and office equipment |
2 - 3 years | 1,049 | 589 | |||||||
| Vehicles |
3 - 5 years | 1,447 | 952 | |||||||
| Construction in progress and other |
3,981 | 5,933 | ||||||||
| 89,946 | 52,884 | |||||||||
| Less: accumulated depreciation |
(23,865 | ) | (17,517 | ) | ||||||
| $ | 66,081 | $ | 35,367 | |||||||
Depreciation expense for the years ended December 31, 2010, 2009, and 2008 totaled $5.4 million, $4.1 million, and $1.4 million, respectively.
Construction in progress consists of capital items which are not yet completed and placed in service. Construction in progress at December 31, 2010 primarily consists of $1.3 million in expenditures for electrical equipment, $0.6 million in expenditures for ponds, $0.8 million in expenditures for equipment, and $1.3 million in expenditures for other capital items.
Allied Nevada depreciates its assets primarily using a straight-line basis over the useful lives of the assets ranging from two to ten years. The leach pads are depreciated on a units-of-production method based upon estimated recoverable ounces from proven and probable reserves.
60
Table of Contents
ALLIED NEVADA GOLD CORP.
Notes to Consolidated Financial Statements—(Continued)
9. Mine Development Costs
The following table reflects the changes in mine development costs (in thousands):
| Years ended December 31, | ||||||||
| 2010 | 2009 | |||||||
| Balance, beginning of year |
$ | 10,389 | $ | 8,827 | ||||
| Additions: |
||||||||
| Mine development drilling and assaying |
6,667 | 3,082 | ||||||
| Capitalized interest |
— | 107 | ||||||
| EIS study and engineering costs |
3,148 | 22 | ||||||
| Amortization |
(1,330 | ) | (1,649 | ) | ||||
| Balance, end of year |
$ | 18,874 | $ | 10,389 | ||||
Mine development costs are amortized using the units-of-production method based upon estimated recoverable gold ounces from proven and probable reserves.
10. Mineral Properties
The following table summarizes the Company’s mineral properties and changes during the periods (in thousands):
| Years ended December 31, | ||||||||
| 2010 | 2009 | |||||||
| Balance, beginning of year |
$ | 35,845 | $ | 36,583 | ||||
| Amortization - royalty rights |
(323 | ) | (649 | ) | ||||
| Sales and other |
— | (89 | ) | |||||
| Balance, end of year |
$ | 35,522 | $ | 35,845 | ||||
The recoverability of the carrying values of the Company’s mineral properties is dependent upon the successful start-up and commercial production from, or sale, or lease of, these properties and upon economic reserves being discovered or developed on the properties. The Company believes that the fair value of its mineral properties exceeds the carrying value; however, events and circumstances beyond the control of management may mean that a write-down in the carrying values of the Company’s properties may be required in the future as a result of evaluation of gold mineralized material and application of a ceiling test which is based on estimates of gold mineralized material, exploration land values, future advanced minimum royalty payments and gold prices. Royalty rights of $3.5 million are amortized using the units-of-production method based upon estimated recoverable gold ounces from proven and probable reserves at the Hycroft Mine.
The following table reflects changes to the Company’s significant properties during the periods (in thousands):
| 2010 | 2009 | |||||||||||||||||||
| December 31, | Sales and other |
December 31, | Sales and other |
January 1, | ||||||||||||||||
| Pony Creek/Elliot Dome |
$ | 12,342 | $ | — | $ | 12,342 | $ | — | $ | 12,342 | ||||||||||
| Hycroft Royalty |
2,528 | (323 | ) | 2,851 | (649 | ) | 3,500 | |||||||||||||
| Maverick Springs |
1,682 | — | 1,682 | — | 1,682 | |||||||||||||||
| Mountain View |
303 | — | 303 | — | 303 | |||||||||||||||
| Hasbrouck/Three Hills |
259 | — | 259 | — | 259 | |||||||||||||||
| Wildcat |
218 | — | 218 | — | 218 | |||||||||||||||
| All other properties |
18,190 | — | 18,190 | (89 | ) | 18,279 | ||||||||||||||
| $ | 35,522 | $ | (323 | ) | $ | 35,845 | $ | (738 | ) | $ | 36,583 | |||||||||
There were no mineral property impairments in 2010 or 2009. In 2008, we recognized a mineral property impairment of $39.0 million. The 2008 impairment resulted primarily from adverse changes in our valuation assumptions from 2007. The changes to the valuation assumptions included: (i) a significantly lower price for a resource ounce of gold mineralization, (ii) a significantly lower
61
Table of Contents
ALLIED NEVADA GOLD CORP.
Notes to Consolidated Financial Statements—(Continued)
price per acre of exploration properties without established reserves or resources, and (iii) based upon our experience with properties subject to lease agreements we have reduced the value assigned for the present value of Advanced Minimum Royalties (“AMRs”) and Net Smelter Returns (“NSRs”) based upon an increased likelihood of the lessee defaulting in payment of either required AMRs or NSRs and returning the properties to the Company. The valuation assumptions changed due to the challenging economic environment and difficulty in raising exploration capital.
11. Related Party Transactions
Sierra Partners Consulting Agreement
Allied Nevada had an Investor Relations Services Agreement with Sierra Partners II LLC (“Sierra”) to assist the Company with its investor relations program and to provide consulting and advisory services regarding the North American investor market. Under terms of the agreement, Sierra received a monthly retainer of $5,000 and reimbursement of reasonable out of pocket fees and expenses. The agreement expired on December 31, 2008 and was renewed in January 2009 on a month-to-month basis. W. Durand Eppler, who was an Allied Nevada director until June 17, 2009, currently serves as President of, and is a partner of, Sierra and, as a result, benefited from this transaction to the extent of his interest in Sierra. For the years ended December 31, 2009 and 2008, Allied Nevada has paid Sierra approximately and $91,000 and $94,000, respectively. At December 31, 2009, $5,000 was due to Sierra.
Provision of Legal Services
Cameron Mingay, an Allied Nevada director who was appointed as an Allied Nevada Director in March 2007, is a partner at Cassels Brock & Blackwell LLP (“Cassels Brock”) of Toronto, Ontario, Canada, which since June 2007 has served as outside counsel to Allied Nevada in connection with Canadian corporate and securities law matters. Allied Nevada has paid Cassels Brock an aggregate of approximately $294,000, $320,000, and $588,000 for legal services rendered during the years ended December 31, 2010, 2009, and 2008, respectively. In addition, approximately $7,000 and $23,000 were owed to Cassels Brock at December 31, 2010 and 2009, respectively.
Ionic Credit Facility
As described in Note 18, the Company entered into a Credit Agreement in March 2009 with Ionic Capital Corp. (Ionic). Robert Buchan, Executive Chairman of Allied Nevada’s Board of Directors, as disclosed to the Board of Directors, participated as an investor in the Credit Facility.
During 2009, the Company paid interest expense of $0.7 million on the March 2009 Credit Agreement. Additionally, the Company incurred loan costs totaling $0.1 million, which were fully expensed when the Company voluntarily repaid the amounts then outstanding on the Credit Agreement at the end of September 2009.
Allied Nevada paid $42,000 to Ionic for interest on a March 2008 Credit Agreement and approximately $1.7 million for a standby and structuring fee, a drawdown fee, and other loan related costs for the year ended December 31, 2008. At the end of May 2008, the Company voluntarily repaid all amounts then outstanding on the March 2008 Credit Agreement.
12. Capital Leases
Assets under capital lease are included in Plant and equipment (Note 8) and are summarized as follows (in thousands):
| December 31, | ||||||||
| 2010 | 2009 | |||||||
| Mine equipment |
$ | 17,212 | $ | 7,842 | ||||
| Less: accumulated depreciation |
(2,471 | ) | (1,132 | ) | ||||
| Net assets under capital leases |
$ | 14,741 | $ | 6,710 | ||||
During the year ended December 31, 2010, the Company entered into four additional capital leases for two dozers and two haul trucks, which have been included in mine equipment. During the year ended December 31, 2009, the Company entered into three additional capital leases including a haul truck and water truck, which have been included in mine equipment, and a backhoe loader which has been included in exploration equipment. The Company now has ten capital leases for mine equipment, most of which have 60-month terms. A 12-month renewal period is included in the 60-month term for one of our capital leases as the Company fully intends to exercise the renewal option. The weighted average implicit interest rate for these capital leases is approximately six percent.
62
Table of Contents
ALLIED NEVADA GOLD CORP.
Notes to Consolidated Financial Statements—(Continued)
Pursuant to Accounting Standards Codification 835-20, “Capitalization of Interest Costs” (“ASC 835-20”), $0.4 million of interest expense from capital leases was capitalized during the year ended December 31, 2010. No interest expense from capital leases was capitalized during the year ended December 31, 2009.
The following table reflects the future minimum lease payments under capital leases as of December 31, 2010 (in thousands):
| Fiscal Year |
Minimum Lease Payments |
|||
| 2011 |
$ | 3,989 | ||
| 2012 |
3,993 | |||
| 2013 |
3,741 | |||
| 2014 |
2,931 | |||
| 2015 |
1,610 | |||
| Less: interest |
(1,945 | ) | ||
| Net minimum lease payments under capital leases |
14,319 | |||
| Less: current portion |
(3,215 | ) | ||
| Long-term portion of net minimum lease payments |
$ | 11,104 | ||
13. Asset Retirement Obligation
Reclamation obligations are secured by surety bonds or irrevocable standby letters of credit in amounts determined by applicable federal and state regulatory agencies. These surety bonds and irrevocable standby letters of credit are in turn secured by cash collateral (Note 7).
The Company’s mining and exploration activities are subject to various federal and state laws and regulations governing the protection of the environment. These laws and regulations are continually changing and are generally becoming more restrictive. The Company conducts its operations to protect public health and the environment and believes its operations are in compliance with applicable laws and regulations in all material respects. The Company has made, and expects to make in the future, expenditures to comply with such laws and regulations, but cannot predict the full amount of such future expenditures. Estimated future reclamation costs are based principally on legal and regulatory requirements.
Changes to the Company’s asset retirement obligation are summarized below (in thousands):
| Years ended December 31, | ||||||||
| 2010 | 2009 | |||||||
| Balance, beginning of year |
$ | 6,643 | $ | 5,833 | ||||
| Accretion |
442 | 394 | ||||||
| Reclamation expenditures |
(469 | ) | (167 | ) | ||||
| Additions/changes in estimate |
150 | 583 | ||||||
| Balance, end of year |
6,766 | 6,643 | ||||||
| Less: current portion |
(463 | ) | (476 | ) | ||||
| Long-term portion |
$ | 6,303 | $ | 6,167 | ||||
Reclamation expenditures for the year ended December 31, 2010 of $0.5 million related primarily to demolition and clean-up costs of the Crofoot refinery together with engineering costs for closure of the Crofoot leach pad. Reclamation expenditures for the year ended December 31, 2009 of $0.2 million consisted primarily of engineering costs for closure of the Crofoot leach pad.
14. Other Accrued Liabilities
As of December 31, 2010, other accrued liabilities totaled $6.9 million, of which $6.3 million was for the Company’s Deferred Phantom Unit Plan (the “DPU Plan”). As of December 31, 2009, other accrued liabilities totaled $2.7 million, of which $2.0 million was for the Company’s DPU Plan.
63
Table of Contents
ALLIED NEVADA GOLD CORP.
Notes to Consolidated Financial Statements—(Continued)
The DPU Plan was adopted by the Board of Directors in April 2009. Under the DPU Plan, directors receive a portion of their annual retainer in DPUs quarterly. Each DPU has the same value as one Allied Nevada common share. DPUs must be retained until the director leaves the Board, at which time the cash value of the DPU will be paid out. In the event dividends are declared and paid, additional DPUs would be credited to reflect dividends paid on Allied Nevada’s common shares.
The following table summarizes the number of the Company’s DPUs and changes during the periods:
| Year ended December 31, | ||||||||
| 2010 | 2009 | |||||||
| Outstanding, beginning of year |
131,250 | — | ||||||
| Granted |
106,750 | 131,250 | ||||||
| Outstanding, end of period |
238,000 | 131,250 | ||||||
DPUs are recorded at fair value on the quarterly award date and are adjusted for changes in fair value. The fair value of amounts granted each period, together with the change in fair value, is expensed. DPU expense recognized during the years ended December 31, 2010 and 2009 totaled $4.3 million and $2.0 million, respectively. The aggregate fair value of the DPUs outstanding at December 31, 2010 and 2009 totaled $6.3 million and $2.0 million, respectively, and the related liabilities are classified as “Other accrued liabilities” in the Consolidated Balance Sheet.
15. Equity-Linked Financial Instruments
The Company adopted Accounting Standards Codification 815-40, “Derivatives and Hedging – Contracts in Entity’s Own Equity” (“ASC 815-40”) on January 1, 2009. ASC 815-40 provides that equity-linked financial instruments denominated in a currency other than the issuers’ functional currency are not considered indexed to an entity’s own stock and must be accounted for as a derivative, in accordance with ASC 815, “Derivatives and Hedging”. The Company previously issued 3,696,000 warrants to purchase the Company’s common stock for an exercise price of CDN$5.75 per share that are subject to the guidance in ASC 815-40, all of which were exercised by or expired on July 16, 2009. ASC 815-40 required recognition of the cumulative effect of a change in accounting principle to the opening balance of our accumulated deficit, additional paid in capital, and liability for equity-linked financial instruments as indicated in the table below (in thousands):
| Balance January 1, 2009 | Cumulative effect of change in accounting principle |
|||||||||||
| As reported | As computed under ASC 815-40 |
|||||||||||
| Liability for equity-linked financial instruments |
$ | — | $ | 4,332 | $ | 4,332 | ||||||
| Additional paid-in-capital |
195,381 | 192,485 | (2,896 | ) | ||||||||
| Accumulated deficit |
(101,832 | ) | (103,268 | ) | (1,436 | ) | ||||||
The value of warrants classified as equity-linked financial instruments was calculated using a binomial pricing model.
Changes in the Company’s liability for equity-linked financial instruments are summarized below (in thousands):
| Year ended December 31, | ||||||||
| 2010 | 2009 | |||||||
| Balance, beginning of year |
— | $ | 4,332 | 1 | ||||
| Non-cash (gain) loss due to change in value |
— | 5,167 | ||||||
| Warrants exercised |
— | (9,484 | ) | |||||
| Gain due to cancellation of warrants |
— | (15 | ) | |||||
| Balance, end of year |
$ | — | $ | — | ||||
| 1 | As restated |
64
Table of Contents
ALLIED NEVADA GOLD CORP.
Notes to Consolidated Financial Statements—(Continued)
16. Shareholders’ Equity
Common Stock
The authorized share capital of Allied Nevada consists of 100,000,000 shares of common stock with a par value of $0.001 per share. As of December 31, 2010 and 2009 there were 88,958,989 and 73,837,267 shares of common stock issued and outstanding, respectively.
June 2010 Public Offering
In order to satisfy capital needs of the accelerated mine plan at Hycroft, fund exploration programs, and complete a sulfide mineralization feasibility study, the Company sold and issued 13,500,000 shares of common stock in a public offering in June 2010, which resulted in gross cash proceeds of CDN$283.5 million or approximately $272.2 million based upon the U.S./Canadian dollar exchange rate on the closing date. Aggregate net cash proceeds from the common shares issued pursuant to the public offering were approximately $254.3 million.
August 2009 Public Offering
In order to expand the exploration drilling program in 2009, the Company sold and issued 11,150,000 shares of common stock through an underwriting agreement in August 2009, which resulted in gross cash proceeds of CDN$100.4 million or approximately $96.7 million based upon the U.S./Canadian dollar exchange rate on the closing date. Aggregate net cash proceeds from the common shares issued pursuant to the public offering were approximately $91.5 million.
April 2008 Initial Public Offering
In April 2008, Allied Nevada completed a public offering of its common stock. The Company sold and issued 12,500,000 common shares and received total gross proceeds of CDN$65.6 million or approximately $64.6 million based upon the U.S./Canadian dollar exchange rate on the closing date. Later in April 18, 2008, Allied Nevada sold and issued an additional 1,875,000 common shares and received total gross proceeds of CDN$9.8 million or approximately $9.8 million based upon U.S./Canadian exchange rate on the closing date pursuant to an over-allotment option exercised by the Company’s underwriters. Aggregate net cash proceeds from the common shares issued pursuant to the public offering and exercise of over-allotment option were approximately $69.2 million. Officers and directors of Allied Nevada subscribed for an aggregate of CDN$2.8 million as follows:
| Shares | CDN$ (in 000s) |
|||||||||
| Buchan Family Foundation1 |
500,000 | $ | 2,625 | |||||||
| Scott Caldwell |
President, Chief Executive Officer, and Director |
25,000 | 131 | |||||||
| Hal Kirby |
Vice President and Chief Financial Officer |
10,000 | 53 | |||||||
| 535,000 | $ | 2,809 | ||||||||
Allied Nevada’s 2007 Stock Option Plan and Valuation of Stock Options
The Company’s 2007 Stock Option Plan and the Company’s Restricted Share Plan (the “RSU Plan”) (collectively, the “Plans”) permit 5,700,000 shares of common stock under the 2007 Stock Option Plan and 1,200,000 shares of common stock under the RSU Plan to be made available for grant or award under the Plans. This number is reduced by (i) the number of shares of common stock subject to restricted share rights granted and outstanding under the RSU Plan, (ii) the number of shares of common stock subject to options granted and outstanding under the Company’s 2007 Stock Option Plan, (iii) the number of shares of common stock issued upon the exercise of restricted share rights under the RSU Plan, and (iv) the number of shares of common stock issued from time to time under the 2007 Stock Option Plan.
| 1 | Robert Buchan, Executive Chairman – is an officer and director of the Buchan Family Foundation |
65
Table of Contents
ALLIED NEVADA GOLD CORP.
Notes to Consolidated Financial Statements—(Continued)
The table below is a summary of the 2007 Stock Option Plan and activity during the following periods:
| Years ended December 31, | ||||||||||||||||||||||||
| 2010 | 2009 | 2008 | ||||||||||||||||||||||
| Number of Stock Options |
Weighted Average Exercise Price |
Number of Stock Options |
Weighted Average Exercise Price |
Number
of Stock Options |
Weighted Average Exercise Price |
|||||||||||||||||||
| Outstanding, beginning of year |
2,358,143 | $ | 4.80 | 3,928,600 | $ | 4.76 | 2,815,000 | $ | 4.34 | |||||||||||||||
| Granted |
— | — | — | — | 1,137,500 | 5.78 | ||||||||||||||||||
| Canceled/forfeited |
— | — | (324,434 | ) | 4.65 | — | — | |||||||||||||||||
| Exercised |
(1,426,213 | ) | 4.86 | (1,246,023 | ) | 4.71 | (23,900 | ) | 4.30 | |||||||||||||||
| Outstanding, end of year |
931,930 | 4.71 | 2,358,143 | 4.80 | 3,928,600 | 4.76 | ||||||||||||||||||
| Exercisable, end of year |
870,929 | $ | 4.68 | 1,106,298 | $ | 4.82 | 1,291,255 | $ | 4.74 | |||||||||||||||
At December 31, 2010, 2009, and 2008 there was approximately $0.1 million, $1.6 million, and $5.1 million, respectively, of unrecognized stock-based compensation cost relating to outstanding nonvested options. During 2009, 12,000 stock options were exercised in December and issued in January 2010. These shares are classified as Share Capital Subscribed in the Consolidated Statement of Shareholders’ Equity.
At December 31, 2010, 2009, and 2008 the weighted-average remaining contractual term for outstanding options was 5.3 years, 6.0 years, and 7.3 years, respectively. At December 31, 2010, 2009, and 2008 the weighted-average remaining contractual term for exercisable options was 5.5 years, 6.1 years, and 7.4 years, respectively. The aggregate intrinsic value for all outstanding options was $20.1 million, $24.2 million, and $2.1 million at December 31, 2010, 2009, and 2008, respectively. The aggregate intrinsic value for all exercisable options was $18.8 million, $11.4 million, and $0.7 million at December 31, 2010, 2009, and 2008, respectively. During 2010, the total intrinsic value of options exercised, the total fair value of shares vested during the year, and the total compensation cost recognized in income totaled $21.1 million, $31.3 million, and $1.6 million, respectively. During 2009, the total intrinsic value of options exercised, the total fair value of shares vested during the year, and the total compensation cost recognized in income totaled $6.5 million, $18.0 million, and $3.5 million, respectively. During 2008, the total intrinsic value of options exercised, the total fair value of shares vested during the year, and the total compensation cost recognized in income totaled $0.1 million, $6.7 million, and $3.9 million, respectively.
The exercise prices of option grants are equal to the closing price of the Company’s common stock on the NYSE Amex on the grant date pursuant to the terms of the 2007 Stock Option Plan. Options granted under the 2007 Stock Option Plan are five or ten year non-qualified options and vest in equal one-third installments over two to three years, until fully vested on either the second or third anniversary of the grant date.
No options were granted for the years ended December 31, 2010 or 2009.
A binomial option pricing model was used to determine the value of the options granted in 2008 pursuant to the terms of the 2007 Stock Option Plan. The 2008 options granted were valued based upon an assumption that suboptimal exercise of the options is expected to occur when the market price reaches twice the exercise price. The estimated forfeiture rate for the 2008 option grants was increased from 3.00% to 5.00% beginning in 2009. The risk-free interest rates used for options granted in 2008 was between 2.2% and 3.7%.
Description of the Restricted Share Plan
See description of “Allied Nevada 2007 Stock Option Plan and Valuation of Stock Options” for the number of shares of common stock that are reserved for issuance under the RSU Plan. A Restricted Share Unit (“RSU”) is granted subject to a restricted period (“Restricted Period”) as determined by the Compensation Committee upon grant. An RSU is exercised automatically and a share of Allied Nevada common stock is issued for no additional consideration on the later of the end of a Restricted Period and in the case of Canadian residents, a date determined by the eligible participant that is after the Restricted Period and before a participant’s retirement date or termination date (a “Deferred Payment Date”).
66
Table of Contents
ALLIED NEVADA GOLD CORP.
Notes to Consolidated Financial Statements—(Continued)
| Years ended December 31, | ||||||||||||||||||||||||
| 2010 | 2009 | 2008 | ||||||||||||||||||||||
| Number of RSUs |
Weighted Average Grant-Date Fair Value |
Number of RSUs |
Weighted Average Grant-Date Fair Value |
Number of RSUs |
Weighted Average Grant-Date Fair Value |
|||||||||||||||||||
| Outstanding, beginning of year |
827,500 | $ | 6.64 | 336,000 | $ | 4.32 | 300,000 | $ | 4.35 | |||||||||||||||
| Granted |
389,400 | 16.83 | 509,500 | 8.09 | 36,000 | 4.13 | ||||||||||||||||||
| Exercised |
(150,099 | ) | 7.28 | (12,000 | ) | 4.13 | — | — | ||||||||||||||||
| Canceled/expired |
(108,900 | ) | 8.90 | (6,000 | ) | 5.78 | — | — | ||||||||||||||||
| Outstanding, end of year |
957,901 | 10.42 | 827,500 | 6.64 | 336,000 | 4.32 | ||||||||||||||||||
| Vested, end of year |
300,000 | $ | 4.35 | 212,000 | $ | 4.34 | 112,000 | $ | 4.32 | |||||||||||||||
RSUs
For the years ended December 31, 2010, 2009, and 2008, 236,200, 166,000, and 36,000 RSUs, respectively, were granted that vest in equal one-third installments over three years. The estimated forfeiture rate for the 2010, 2009, and 2008 RSUs granted that vest in equal one third installments over three years was 5%.
Performance RSUs
For the years ended December 31, 2010 and 2009, 153, 200 and 343,500 RSUs, respectively, were granted, which vest over three years, that are subject to performance based vesting criteria determined in advance for each year by the Compensation Committee of the Board of Directors. The 2010 measures were based upon gold production, cost of sales per gold ounce sold1, and a discretionary component. The 2009 measures were based upon ounces of gold sold, cost of goods sold, operating cash flow, resource growth, and resource conversion. Consequently, the number of RSUs that vest may be lower than the number of RSUs granted. The estimated forfeiture rate for 2010 and 2009 RSUs granted that are subject to performance based vesting was 20%. There were no RSUs granted in 2008 that are subject to performance based vesting.
At December 31, 2010, 2009, and 2008, the weighted-average remaining restricted period for nonvested RSUs was 2.0 years, 1.5 years, and 1.5 years, respectively.
The RSU values are based upon the fair value of the Company’s stock on the date of grant, less estimated forfeitures. The restricted share units are expensed over the requisite service periods. The total stock-based compensation expense recognized under the RSU Plan during the years ended December 31, 2010, 2009, and 2008, was $2.5 million, $1.0 million, and $0.5 million, respectively. At December 31, 2010, 2009, and 2008 there was approximately $7.1 million, $3.8 million, and $1.0 of unrecognized stock-based compensation cost relating to outstanding restricted share units, respectively.
The table below provides costs and associated values for RSUs granted pursuant to the Restricted Share Plan:
| Years ended December 31, | ||||||||||||
| 2010 | 2009 | 2008 | ||||||||||
| Weighted-average contractual term |
3 years | 3 years | 2 years | |||||||||
| Weighted-average estimated forfeiture rate |
10.90 | % | 11.23 | % | 3.00 | % | ||||||
| Total intrinsic value of RSUs exercised (millions) |
$ | 2.8 | $ | 0.1 | $ | — | ||||||
| Total fair value of shares vested during the year (millions) |
$ | 3.6 | $ | 1.7 | $ | 0.6 | ||||||
Description of the Special Stock Option Plan
The Special Stock Option Plan (the “Special Plan”), also adopted by the Board of Directors in February 2007, governs the grant of stock options (the “Special Options”) to purchase shares of Allied Nevada common stock (the “Shares”), pursuant to Vista’s 2007 transfer of mining properties and related assets to Allied Nevada in exchange for Special Options. The Special Options were granted
| 1 | The terms “cost of sales per ounce of gold sold” and “cost of sales, net of byproduct credits” are non-GAAP financial measures. Please see the section on “Non-GAAP Measures” in this MD&A. |
67
Table of Contents
ALLIED NEVADA GOLD CORP.
Notes to Consolidated Financial Statements—(Continued)
to holders of options to purchase common shares of Vista (the “Vista Options”) under Vista’s Stock Option Plan as of the closing of the Arrangement Agreement. Under the Special Plan, holders of Vista Options exchanged their Vista Options for new options to purchase common shares in the capital of Vista and the Special Options issuable under the Special Plan.
The table below is a summary of changes in the Special Stock Option Plan for the periods indicated:
| Years ended December 31, | ||||||||||||||||||||||||
| 2010 | 2009 | 2008 | ||||||||||||||||||||||
| Number of Special Options |
Weighted Average Exercise Price |
Number of Special Options |
Weighted Average Exercise Price |
Number of Special Options |
Weighted Average Exercise Price |
|||||||||||||||||||
| Outstanding, beginning of year |
60,138 | $ | 4.41 | 290,728 | $ | 3.23 | 427,670 | $ | 2.98 | |||||||||||||||
| Canceled/expired |
— | — | (16,705 | ) | 2.32 | (46,777 | ) | 2.57 | ||||||||||||||||
| Exercised |
(33,410 | ) | 3.86 | (213,885 | ) | 3.04 | (90,165 | ) | 2.28 | |||||||||||||||
| Outstanding, end of year |
26,728 | 5.28 | 60,138 | 4.41 | 290,728 | 3.23 | ||||||||||||||||||
| Exercisable, end of year |
26,728 | $ | 5.28 | 60,138 | $ | 4.41 | 290,728 | $ | 3.23 | |||||||||||||||
At December 31, 2010, 2009, and 2008 all options outstanding under the Special Option Plan were exercisable and had a weighted-average remaining contractual term of 0.6 years, 1.4 years, and 1.7 years respectively. The total intrinsic value of Special Options exercised during the years ended December 31, 2010, 2009, and 2008 totaled $0.6 million, $1.4 million, and $0.2 million, respectively.
Warrants
The table below is a summary of changes in the Company’s warrants for the periods indicated:
| Years ended December 31, | ||||||||||||
| 2010 | 2009 | 2008 | ||||||||||
| Outstanding warrants, beginning of year |
— | 3,785,850 | 3,785,850 | |||||||||
| Granted |
— | — | — | |||||||||
| Exercised |
— | (3,780,850 | ) | — | ||||||||
| Canceled/expired |
— | (5,000 | ) | — | ||||||||
| Outstanding warrants, end of year |
— | — | 3,785,850 | |||||||||
As part of a private placement on July 16, 2007, the Company sold and issued 3,696,000 units, each consisting of one share of the Company’s common stock and common share purchase warrant. The common share purchase warrants entitled the holder thereof to acquire one share of common stock within a two-year exercise period at a CDN$5.75 exercise price. During 2009, prior to the warrants’ expiration date of July 16, 2009, the Company received proceeds of $19.4 million based on the US/Canadian dollar exchange rate on the exercise dates.
Preferred Stock
The authorized share capital of Allied Nevada includes 10 million shares of undesignated preferred stock with a par value of $0.001 per share. As of December 31, 2010, no shares of preferred stock have been issued.
68
Table of Contents
ALLIED NEVADA GOLD CORP.
Notes to Consolidated Financial Statements—(Continued)
17. Supplemental Balance Sheet Disclosure
The following table presents the balance sheet items that represent greater than 5% of total current liabilities (in thousands):
| December 31, | ||||||||
| 2010 | 2009 | |||||||
| Accrued liabilities and other |
||||||||
| Accrued compensation |
$ | 1,068 | $ | 657 | ||||
| Employment taxes payable |
415 | 471 | ||||||
| Other |
249 | 348 | ||||||
| Total accrued liabilities and other |
$ | 1,732 | $ | 1,476 | ||||
18. Term Loan
In March 2009, the Company entered into a credit agreement (the “Credit Agreement”) with Ionic Capital Corp. (“Ionic”), to borrow CDN$8.0 million. The Credit Agreement was secured by the Company’s mining fleet. Amounts borrowed under the Loan Facility were only to be used by the Company’s wholly-owned subsidiary, Hycroft Resources & Development, Inc. for its general working capital purposes and repayment was due by September 2010. Amounts borrowed under the Credit Agreement could be prepaid in full without penalty, subject to a minimum two month advance written notice of the Company’s intent to prepay. The Credit Agreement included covenants which limited or restricted the Company’s ability to incur additional debt, grant additional liens, pay dividends, redeem or purchase the Company’s own shares, guarantee obligations, or sell assets. In September 2009, the Company voluntarily repaid all amounts then outstanding on the Credit Agreement of approximately $7.4 million.
Interest rates on borrowings were fifteen percent per annum compounded monthly. During 2009, the Company recognized interest expense of $0.7 million on the Credit Agreement. Additionally, the Company incurred loan costs totaling $0.1 million, which were fully expensed when the Company voluntarily repaid the amounts then outstanding on the Credit Agreement. For the year ended December 31, 2009, $0.1 million in interest costs incurred on the Credit Agreement were capitalized and allocated to certain “qualifying assets” pursuant to Accounting Standards Codification 835-20, “Capitalization of Interest Costs” (“ASC 835-20”), and are included in Plant and Equipment (Note 8).
During the year ended December 31, 2010, the Company recognized interest expense of $1.8 million from a credit agreement with Ionic. The Company borrowed a total of CDN$10.0 million, all of which was repaid by May of 2008.
19. Segment Information
Allied Nevada is engaged in the evaluation, acquisition, exploration and advancement of gold exploration and development projects in Nevada. The Company identifies its reportable segments as those consolidated mining operations or functional groups that represent more than 10% of the combined revenue, profit or loss or total assets of all reported operating segments. Consolidated mining operations or functional groups not meeting this threshold are aggregated at the corporate level for segment reporting purposes. Intercompany revenue and expense amounts have been eliminated within each segment in order to report on the basis that management uses internally for evaluating segment performance. As of December 31, 2010, the Company identified Hycroft, Exploration, and Corporate as its identifiable segments. Segment information as of and for the years ended December 31, 2010, 2009, and 2008, are as follows:
| Hycroft | Corporate | |||||||||||||||
| As of and for the years ended December 31, |
Mine | Exploration | and Other | Total | ||||||||||||
| 2010 |
||||||||||||||||
| Sales |
$ | 130,930 | $ | — | $ | — | $ | 130,930 | ||||||||
| Income (loss) from operations |
65,961 | (22,502 | ) | (19,924 | ) | 23,535 | ||||||||||
| Interest income |
45 | — | 100 | 145 | ||||||||||||
| Interest expense |
— | — | — | — | ||||||||||||
| Gain on foreign exchange |
— | — | 3,067 | 3,067 | ||||||||||||
| Other income |
— | 269 | — | 269 | ||||||||||||
| Income (loss) before taxes |
66,006 | (22,233 | ) | (16,757 | ) | 27,016 | ||||||||||
| Total assets |
181,882 | 34,101 | 351,369 | 567,352 | ||||||||||||
| Capital expenditures |
36,575 | 97 | 353 | 37,025 | ||||||||||||
| 2009 |
||||||||||||||||
| Sales |
$ | 43,204 | $ | — | $ | — | $ | 43,204 | ||||||||
| Income (loss) from operations |
14,121 | (5,554 | ) | (12,464 | ) | (3,897 | ) | |||||||||
| Interest income |
39 | — | 10 | 49 | ||||||||||||
| Interest expense |
(1,030 | ) | — | — | (1,030 | ) | ||||||||||
| Loss due to change in value of equity-linked financial instruments |
— | — | (5,152 | ) | (5,152 | ) | ||||||||||
| Gain (loss) on foreign exchange |
(1,018 | ) | — | 1,554 | 536 | |||||||||||
| Other income |
— | 62 | — | 62 | ||||||||||||
| Income (loss) before taxes |
12,112 | (5,492 | ) | (16,052 | ) | (9,432 | ) | |||||||||
| Total assets |
113,998 | 33,922 | 104,505 | 252,425 | ||||||||||||
| Capital expenditures |
5,772 | 118 | 183 | 6,073 | ||||||||||||
| 2008 |
||||||||||||||||
| Total costs and expenses |
$ | (14,549 | ) | $ | (54,164 | ) | $ | (10,525 | ) | $ | (79,238 | ) | ||||
| Interest income |
— | — | 932 | 932 | ||||||||||||
| Interest expense |
(1,876 | ) | — | — | (1,876 | ) | ||||||||||
| Gain (loss) on foreign exchange |
(313 | ) | — | 46 | (267 | ) | ||||||||||
| Other income (expense) |
— | 809 | (1 | ) | 808 | |||||||||||
| Net Loss |
(16,738 | ) | (53,355 | ) | (9,548 | ) | (79,641 | ) | ||||||||
| Total assets |
61,739 | 33,864 | 16,656 | 112,259 | ||||||||||||
| Capital expenditures |
30,020 | — | 77 | 30,097 | ||||||||||||
69
Table of Contents
ALLIED NEVADA GOLD CORP.
Notes to Consolidated Financial Statements—(Continued)
20. Fair Value Measurements
The Company’s financial instruments, including cash and cash equivalents and accounts payable are carried at cost, which approximates fair value due to the short-term maturity of these instruments.
As defined in ASC 820, fair value is the price that would be received to sell an asset or paid to transfer a liability in an orderly transaction between market participants at a measurement date (exit price). The Company uses market data or assumptions that market participants would use in pricing the asset or liability, including assumptions about risk. These inputs can be readily observable, market corroborated or generally unobservable. The Company primarily applies the market and income approaches for recurring fair value measurements and utilizes the best available information. ASC 820 establishes a fair value hierarchy that prioritizes the inputs used to measure fair value. The hierarchy gives the highest priority to unadjusted quoted prices in active markets for identical assets or liabilities (Level 1 measurements) and the lowest priority to unobservable inputs (Level 3 measurements) as follows:
Level 1 – Quoted prices are available in active markets for identical assets or liabilities as of the reporting date. Active markets are those in which transactions for the asset or liability occur in sufficient frequency and volume to provide pricing information on an ongoing basis. As of and for the years ended December 31, 2010 and 2009, the Company did not have any assets or liabilities measured under a level 1 fair value hierarchy.
Level 2 – Pricing inputs are other than quoted prices in active markets included in Level 1, which are either directly or indirectly observable as of the reporting date. Level 2 includes those financial instruments that are valued using models or other valuation methodologies. These models are primarily industry-standard models that consider various assumptions, including quoted forward prices for commodities, time value, volatility factors and current market and contractual prices for the underlying instruments, as well as other relevant economic measures. Substantially all of these assumptions are observable in the marketplace throughout the full term of the instrument, can be derived from observable data or are supported by observable levels at which transactions are executed in the marketplace. As of and for the years ended December 31, 2010 and 2009, the Company did not have any assets or liabilities measured under a level 2 fair value hierarchy.
70
Table of Contents
ALLIED NEVADA GOLD CORP.
Notes to Consolidated Financial Statements—(Continued)
Level 3 – Pricing inputs include significant inputs that are generally less observable than objective sources. These inputs may be used with internally developed methodologies that result in management’s best estimate of fair value. At each balance sheet date, the Company performs an analysis of all instruments subject to ASC 820 and includes in Level 3 all of those whose fair value is based on significant unobservable inputs. As of and for the year ended December 31, 2010, the Company did not have any assets or liabilities measured under a level 3 fair value hierarchy.
The following table sets forth by level within the fair value hierarchy the Company’s financial assets and financial liabilities that were accounted for at fair value on a recurring basis as of December 31, 2009. As required by ASC 820, financial assets and financial liabilities are classified in their entirety based on the lowest level of input that is significant to the fair value measurement. The Company’s assessment of the significance of a particular input to the fair value measurement requires judgment and may affect the valuation of assets and liabilities and their placement within the fair value hierarchy levels.
| Year ended December 31, 2009 | ||||||||||||||||
| Level 1 | Level 2 | Level 3 | Total | |||||||||||||
| Liabilities |
||||||||||||||||
| Equity-linked financial instruments (Note 15): |
||||||||||||||||
| Balance, beginning of year |
$ | — | $ | — | $ | 4,332 | $ | 4,332 | 1 | |||||||
| Non-cash (gain) loss due to change in value |
— | — | 5,167 | 5,167 | ||||||||||||
| Warrants exercised |
— | — | (9,484 | ) | (9,484 | ) | ||||||||||
| Gain due to cancellation of warrants |
— | — | (15 | ) | (15 | ) | ||||||||||
| Balance, end of year |
$ | — | $ | — | $ | — | $ | — | ||||||||
21. Quarterly Financial Information (Unaudited)
Summarized quarterly results for the years ended December 31, 2010, 2009, and 2008 are as follows (in thousands, except per share amounts):
| Quarters | ||||||||||||||||
| Year ended December 31, 2010 |
First | Second | Third | Fourth | ||||||||||||
| Net sales |
$ | 23,459 | $ | 37,112 | $ | 38,872 | $ | 31,487 | ||||||||
| Gross profit |
14,692 | 23,877 | 24,826 | 19,889 | ||||||||||||
| Net income |
3,654 | 20,790 | 3,059 | 6,625 | ||||||||||||
| Basic net income per share |
0.05 | 0.26 | 0.03 | 0.07 | ||||||||||||
| Diluted net income per share |
0.05 | 0.26 | 0.03 | 0.07 | ||||||||||||
| Year ended December 31, 2009 |
||||||||||||||||
| Net sales |
$ | 3,204 | $ | 3,814 | $ | 19,997 | $ | 16,189 | ||||||||
| Gross profit |
1,096 | 2,174 | 12,193 | 10,330 | ||||||||||||
| Net income (loss) |
(7,580 | ) | (6,870 | ) | 5,134 | 17,767 | ||||||||||
| Basic net income (loss) per share |
(0.13 | ) | (0.12 | ) | 0.08 | 0.24 | ||||||||||
| Diluted net income (loss) per share |
(0.13 | ) | (0.12 | ) | 0.08 | 0.24 | ||||||||||
| Year ended December 31, 2008 |
||||||||||||||||
| Net income (loss) |
$ | (6,870 | ) | $ | (9,858 | ) | $ | (9,747 | ) | $ | (53,167 | ) | ||||
| Basic and diluted net loss per share |
(0.16 | ) | (0.18 | ) | (0.17 | ) | (0.92 | ) | ||||||||
| 1 | As restated |
71
Table of Contents
ALLIED NEVADA GOLD CORP.
Notes to Consolidated Financial Statements—(Continued)
22. Income (Loss) Per Share
The following table sets forth the computation of basic and diluted income (loss) per share (in thousands, except per share amounts).
| Years ended December 31, | ||||||||||||
| 2010 | 2009 | 2008 | ||||||||||
| Net income (loss) available to common shareholders |
$ | 34,128 | $ | 8,451 | $ | (79,641 | ) | |||||
| Basic: |
||||||||||||
| Weighted average number of shares outstanding |
82,797 | 63,850 | 53,470 | |||||||||
| Income (loss) per share |
0.41 | 0.13 | (1.49 | ) | ||||||||
| Diluted: |
||||||||||||
| Weighted average number of shares outstanding |
84,094 | 65,441 | 53,470 | |||||||||
| Income (loss) per share |
0.41 | 0.13 | (1.49 | ) | ||||||||
The computation of the 2010 and 2009 basic income per share includes within the weighted average number of shares outstanding at yearend a total of 300,000 and 212,000 vested restricted share units that were not issued as of December 31, 2010 and 2009, respectively.
The computation of 2010 diluted income per share includes within the weighted average number of shares outstanding at December 31, 2010 a total of 931,930 outstanding options granted under the Allied Nevada Stock Option Plan, 26,728 outstanding options granted under the Allied Nevada Special Stock Option plan , and 957,901 outstanding unvested restricted share units.
The computation of 2009 diluted income per share includes within the weighted average number of shares outstanding at December 31, 2009 a total of 2,358,143 outstanding options granted under the Allied Nevada Stock Option Plan, 60,138 outstanding options granted under the Allied Nevada Special Stock Option plan, and 827,500 outstanding unvested restricted share units.
For the year ended December 31, 2008, there were 3,785,850 outstanding warrants, 3,928,600 outstanding options granted under the Allied Nevada Stock Option Plan, 290,728 outstanding options granted under the Allied Nevada Special Stock Option plan, and 336,000 outstanding restricted share units that were not included in diluted loss per share because inclusion would have been anti-dilutive. The weighted average number of shares outstanding at December 31, 2008 includes 100,000 vested restricted share units that were not issued as of December 31, 2008.
23. Contingencies and Commitments
The Company is from time to time involved in various legal proceedings related to its business. Management does not believe that adverse decisions are likely in any pending or threatened proceeding, or that amounts that may be required to be paid by reason thereof will have a material adverse effect on the Company’s financial condition, results of operations, or cash flows.
24. Employee Benefit Plan
Effective June 1, 2008, the Company adopted a retirement savings plan. The Allied Nevada Gold Corp. 401(k) Plan (the “Plan”) is a defined contribution plan and covers all salaried employees of the Company. The Plan is subject to the provisions of the Employee Retirement Income Security Act of 1974, as amended, and Section 401 (k) of the Internal Revenue Code.
The assets of the Plan are held and the related investments are executed by the Plan’s trustee. Participants in the Plan have investment alternatives in which to place their funds and may place their fund in one or more of these investment alternatives. Administrative fees are paid by the Company on behalf of the Plan. The Plan provides for annual discretionary contributions by the Company. For the years ended December 31, 2010, 2009 and 2008, Company contributions totaled $0.3, $0.3 million and $0.1 million, respectively.
72
Table of Contents
ALLIED NEVADA GOLD CORP.
Notes to Consolidated Financial Statements—(Continued)
25. Subsequent Events
Approval of Reclamation Cost Estimate
On February 17, 2011, we received a notification from the Bureau of Land Management (“BLM”) of a revised total reclamation cost estimate of $20.6 million to expand mining operations and address exploration disturbance at the Hycroft Mine. In March the Company plans to increase its surety bond for the benefit of the BLM by $3.9 million. This surety bond will be collateralized by restricted cash.
73
Table of Contents
| Item 9. | Changes in and Disagreements With Accountants on Accounting and Financial Disclosure |
None.
| Item 9A. | Controls and Procedures |
| A. | Evaluation of Disclosure Controls and Procedures. The principal executive officer and principal financial officer, with the supervision and participation of management, have evaluated the effectiveness of Allied Nevada’s disclosure controls and procedures (as defined in Rule 13a-15(e) under the Securities Exchange Act of 1934, as amended (the “Exchange Act”) as of December 31, 2010. Based on the evaluation, the principal executive officer and principal financial officer concluded that the disclosure controls and procedures in place are effective to ensure that information required to be disclosed by Allied Nevada, including consolidated subsidiaries, in reports that Allied Nevada files or submits under the Exchange Act, is recorded, processed, summarized and reported in accordance with applicable time periods specified by the Securities and Exchange Commission rules and forms. Disclosure controls and procedures include, without limitation, controls and procedures designed to ensure that information required to be disclosed by the Company in reports that it files or submits under the Exchange Act is accumulated and communicated to the Company’s management, including its principal executive and financial officers, or persons performing similar functions, as appropriate, to allow timely decisions regarding required disclosure. |
| B. | Management’s Annual Report on Internal Control over Financial Reporting |
Allied Nevada’s management is responsible for establishing and maintaining adequate internal control over financial reporting. Internal control over financial reporting is defined in Rule 13a-15(f) and Rule 15d-15(f) promulgated under the Exchange Act as a process designed by, or under the supervision of, the Company’s principal executive and principal financial officers, or persons performing similar functions, and effected by the Company’s Board of Directors, management and other personnel, to provide reasonable assurance regarding the reliability of financial reporting and the preparation of financial statements for external purposes in accordance with generally accepted accounting principles. The Company’s internal control over financial reporting includes those policies and procedures that:
| • | pertain to the maintenance of records that, in reasonable detail, accurately and fairly reflect the transactions and dispositions of the assets of the Company; |
| • | provide reasonable assurance that transactions are recorded as necessary to permit preparation of financial statements in accordance with generally accepted accounting principles, and that receipts and expenditures of the Company are being made only in accordance with authorizations of management and directors of the Company; and |
| • | provide reasonable assurance regarding prevention or timely detection of unauthorized acquisition, use or disposition of the Company’s assets that could have a material effect on the financial statements. |
The Company’s management, with the participation of the Company’s principal executive officer and principal financial officer, assessed the effectiveness of the Company’s internal control over financial reporting as of December 31, 2010. In making this assessment, it used the criteria set forth in the Internal Control-Integrated Framework issued by the Committee of Sponsoring Organizations of the Treadway Commission (COSO). Based on such assessment, the Company’s management, with the participation of the Company’s principal executive officer and principal financial officer, concluded that, as of December 31, 2010, the Company’s internal control over financial reporting was effective based on such criteria. The Company’s independent registered public accounting firm has issued an attestation report on the Company’s internal control over financial reporting as of December 31, 2010, which appears on page 47.
| C. | Changes in Internal Controls. There has been no change in Allied Nevada’s internal control over financial reporting during the year ended December 31, 2010 that has materially affected, or is reasonably likely to materially affect, Allied Nevada’s internal control over financial reporting. |
| Item 9B. | Other Information |
None.
74
Table of Contents
| Item 10. | Directors, Executive Officer and Corporate Governance |
The information required by Items 401, 405, 406, and 407(c)(3), (d)4) and (d)(5) of Regulation S-K will be contained in the Company’s 2011 Proxy Statement, to be filed with the SEC within 120 days following the end of the Company’s fiscal year ended December 31, 2010 (the “2011 Proxy Statement”) and is hereby incorporated by reference thereto.
| Item 11. | Executive Compensation |
The information required by Item 402 and paragraph (e)(4) and (e)(5) of Item 407 of Regulation S-K will be contained in the Company’s 2011 Proxy Statement, to be filed with the SEC within 120 days following the end of the Company’s fiscal year ended December 31, 2010 (the “2011 Proxy Statement”) and is hereby incorporated by reference thereto.
| Item 12. | Security Ownership of Certain Beneficial Owners and Management and Related Stockholder Matters |
The information required by Item 201(d) and Item 403 of Regulation S-K will be contained in the Company’s 2011 Proxy Statement, to be filed with the SEC within 120 days following the end of the Company’s fiscal year ended December 31, 2010 (the “2011 Proxy Statement”) and is hereby incorporated by reference thereto.
| Item 13. | Certain Relationships and Related Transactions, and Director Independence |
The information required by Item 404 and Item 407(a) of Regulation S-K will be contained in the Company’s 2011 Proxy Statement, to be filed with the SEC within 120 days following the end of the Company’s fiscal year ended December 31, 2010 (the “2011 Proxy Statement”) and is hereby incorporated by reference thereto.
| Item 14. | Principal Accounting Fees and Services |
The information required by Item 9(e) of Schedule 14A will be contained in the Company’s 2011 Proxy Statement, to be filed with the SEC within 120 days following the end of the Company’s fiscal year ended December 31, 2010 (the “2011 Proxy Statement”) and is hereby incorporated by reference thereto.
75
Table of Contents
| Item 15. | Exhibits, Financial Statement Schedules |
(a)(1) Financial Statements
Audited Consolidated Financial Statements for the Years Ended December 31, 2010, 2009 and 2008 of Allied Nevada Gold Corp.
Reports of Independent Auditor
Consolidated Balance Sheets
Consolidated Statements of Income (Loss)
Consolidated Statements of Cash Flows
Consolidated Statements of Shareholders’ Equity
Notes to Consolidated Financial Statements
(a)(2) Financial Statement Schedules
Schedule II – Valuation and Qualifying Accounts
| Balance at | Charged to | |||||||||||||||||||
| beginning of | costs and | Charged to | Balance at | |||||||||||||||||
| Description |
period | expenses | other accounts | Deductions | end of period | |||||||||||||||
| (in thousands) | ||||||||||||||||||||
| Year ended December 31, 2008 |
||||||||||||||||||||
| Valuation allowance deferred tax assets |
$ | 14,033 | $ | — | $ | 27,731 | $ | — | $ | 41,764 | ||||||||||
| Year ended December 31, 2009 |
||||||||||||||||||||
| Valuation allowance deferred tax assets |
41,764 | — | (16,393 | ) | — | 25,371 | ||||||||||||||
| Year ended December 31, 2010 |
||||||||||||||||||||
| Valuation allowance deferred tax assets |
25,371 | — | (11,466 | ) | — | 13,905 | ||||||||||||||
(a)(3) The information required by this item is set forth on the exhibit index that follows the signature page of this report.
76
Table of Contents
Pursuant to the requirements of Section 13 or 15(d) of the Securities Exchange Act of 1934, the Registrant has duly caused this report to be signed on its behalf by the undersigned, thereunto duly authorized.
| ALLIED NEVADA GOLD CORP. | ||||
| Registrant | ||||
| Date: February 25, 2011 | By: | /S/ SCOTT A. CALDWELL | ||
| Scott A. Caldwell | ||||
| President and Chief Executive Officer | ||||
Pursuant to the requirements of the Securities Exchange Act of 1934, this report has been signed below by the following persons on behalf of the registrant and in the capacities and on the dates indicated.
| Signature |
Title |
Date | ||
| /S/ SCOTT A. CALDWELL |
President, Chief Executive Officer and Director (Principal Executive Officer) |
February 25, 2011 | ||
| Scott A. Caldwell | ||||
| /S/ HAL D. KIRBY |
Executive Vice President and Chief Financial Officer (Principal Financial and Accounting Officer) |
February 25, 2011 | ||
| Hal D. Kirby | ||||
| * |
Executive Chairman and Director |
February 25, 2011 | ||
| Robert M. Buchan | ||||
| * |
Director |
February 25, 2011 | ||
| John W. Ivany | ||||
| * |
Director |
February 25, 2011 | ||
| Cameron A. Mingay |
||||
| * |
Director |
February 25, 2011 | ||
| Terry M. Palmer |
||||
| * |
Director |
February 25, 2011 | ||
| Carl Pescio | ||||
| * |
Director |
February 25, 2011 | ||
| D. Bruce Sinclair |
||||
| * |
Director |
February 25, 2011 | ||
| Robert G. Wardell |
||||
| *By: |
/S/ SCOTT A. CALDWELL | |
| Scott A. Caldwell | ||
| Attorney-in-Fact | ||
77
Table of Contents
(b) Index to Exhibits
| Exhibit Number |
Description of Document | |
| 2.1(1) | Arrangement and Merger Agreement dated as of September 22, 2006, between Vista Gold Corp., Allied Nevada Gold Corp., Carl Pescio and Janet Pescio | |
| 2.2(2) | Amendment to Arrangement and Merger Agreement dated as of May 8, 2007, among Vista Gold Corp., Allied Nevada Gold Corp., Carl Pescio and Janet Pescio | |
| 3.1(1) | Certificate of Incorporation of the Registrant, dated September 14, 2006 | |
| 3.2(1) | By-laws of the Registrant, dated September 22, 2006 | |
| 10.1(3) | Form of Allied Nevada Gold Corp. Indemnification Agreement entered into between Allied Nevada Gold Corp. and the directors and officers parties thereto | |
| 10.2(3) | Allied Nevada Gold Corp. Special Stock Option Plan | |
| 10.3(4) | Allied Nevada Gold Corp. 2007 Stock Option Plan, as amended and restated June 17, 2009 | |
| 10.4(4) | Allied Nevada Gold Corp. Restricted Share Plan, as amended and restated June 17, 2009 | |
| 10.5(4) | Form of Restricted Share Right Grant Letter under the Allied Nevada Gold Corp. Restricted Share Plan | |
| 10.6(5) | Employment Agreement, dated as of January 11, 2008, between Allied Nevada Gold Corp. and Scott A. Caldwell | |
| 10.7(6) | Addendum No. 1 to Employment Agreement between Allied Nevada Gold Corp. and Scott A. Caldwell, dated December 29, 2008 | |
| 10.8(5) | Employment Agreement, dated as of January 11, 2008, between Allied Nevada Gold Corp. and Hal D. Kirby | |
| 10.9(6) | Addendum No. 1 to Employment Agreement between Allied Nevada Gold Corp. and Hal D. Kirby, dated December 29, 2008 | |
| 10.10 | Employment Agreement, dated as of October 15, 2010, between Allied Nevada Gold Corp. and David Hill | |
| 10.11(7) | Employment Agreement, dated as of March 16, 2009, between Allied Nevada Gold Corp. and Warren Woods | |
| 10.12(7) | Employment Agreement, dated as of October 9, 2008, between Allied Nevada Gold Corp. and David Flint | |
| 10.13 | Employment Agreement, dated as of October 15, 2010, between Allied Nevada Gold Corp. and Scott Anderson | |
| 10.14(7) | Employment Agreement, dated as of January 1, 2009, between Allied Nevada Gold Corp. and Steven Gill | |
| 10.15 | Employment Agreement, dated as of October 15, 2010, between Allied Nevada Gold Corp. and Deborah Lassiter | |
| 10.16 | Employment Agreement, dated as of October 15, 2010, between Allied Nevada Gold Corp. and Theresa Thom | |
| 10.17(8) | Letter Agreement between Allied Nevada Gold Corp. and James M. Doyle, effective as of March 31, 2010 | |
| 10.18(9) | Credit Agreement, dated March 30, 2009, between Ionic Capital Corp., Allied Nevada Gold Corp. and Hycroft Resources & Development, Inc. | |
| 21(10) | Subsidiaries of the Registrant | |
| 23.1 | Consent of Ehrhardt Keefe Steiner & Hottman PC, independent registered public accounting firm | |
| 23.2 | Consent of Scott E. Wilson Consulting, Inc. | |
| 24.1 | Power of Attorney | |
| 31.1 | Certification of Chief Executive Officer pursuant to Rule 13a-14(a) under the Securities Exchange Act of 1934, as amended | |
| 31.2 | Certification of Chief Financial Officer pursuant to Rule 13a-14(a) under the Securities Exchange Act of 1934, as amended | |
| 32.1 | Certification of Chief Executive Officer pursuant to 18 U.S.C. Section 1350, as adopted pursuant to Section 906 of the Sarbanes-Oxley Act of 2002 | |
| 32.2 | Certification of Chief Financial Officer pursuant to 18 U.S.C. Section 1350, as adopted pursuant to Section 906 of the Sarbanes-Oxley Act of 2002 | |
| (1) | Incorporated by reference to the Registrant’s Registration Statement on Form 10, filed January 12, 2007. |
| (2) | Incorporated by reference to the Registrant’s Current Report on Form 8-K, filed May 16, 2007. |
| (3) | Incorporated by reference to Amendment No. 1 to the Registrant’s Registration Statement on Form 10, filed February 20, 2007. |
| (4) | Incorporated by reference to the Registrant’s Definitive Proxy Statement filed on May 15, 2009. |
| (5) | Incorporated by reference to the Registrant’s Current Report on Form 8-K, filed January 15, 2008. |
| (6) | Incorporated by reference to the Registrant’s Current Report on Form 8-K, filed December 31, 2008. |
| (7) | Incorporated by reference to the Registration’s Quarterly Report on Form 10-Q, filed May 10, 2010. |
| (8) | Incorporated by reference to the Registrant’s Current Report on Form 8-K, filed April 5, 2010. |
| (9) | Incorporated by reference to the Registrant’s Current Report on Form 8-K, filed April 3, 2009. |
| (10) | Incorporated by reference to the Registrant’s Annual Report on Form 10-K, filed March 12, 2010. |
78