Attached files
Table of Contents
UNITED STATES
SECURITIES AND EXCHANGE COMMISSION
Washington, D.C. 20549
Form 10-K
(Mark One)
| x | ANNUAL REPORT PURSUANT TO SECTION 13 OR 15(d) OF THE SECURITIES EXCHANGE ACT OF 1934 |
For the fiscal year ended December 31, 2010
OR
| ¨ | TRANSITION REPORT PURSUANT TO SECTION 13 OR 15(d) OF THE SECURITIES EXCHANGE ACT OF 1934 |
For the transition period from to
Commission file number 1-31234
WESTWOOD HOLDINGS GROUP, INC.
(Exact name of registrant as specified in its charter)
| Delaware | 75-2969997 | |
| (State or other jurisdiction of incorporation or organization) |
(I.R.S. Employer Identification No.) |
| 200 Crescent Court, Suite 1200 Dallas, Texas 75201 |
75201 | |
| (Address of principal executive offices) | (Zip Code) |
Registrant’s telephone number, including area code: (214) 756-6900
SECURITIES REGISTERED PURSUANT TO SECTION 12(b) OF THE ACT:
| Title of each class: |
Name of each exchange on which registered: | |
| Common Stock, par value $0.01 per share |
New York Stock Exchange |
SECURITIES REGISTERED PURSUANT TO SECTION 12(g) OF THE ACT: None
Indicate by check mark if registrant is a well-known seasoned issuer, as defined in Rule 405 of the Securities Act. Yes ¨ No x
Indicate by check mark if the registrant is not required to file reports pursuant to Section 13 or Section 15(d) of the Exchange Act. Yes ¨ No x
Indicate by check mark whether the registrant (1) has filed all reports required to be filed by Section 13 or 15(d) of the Securities Exchange Act of 1934 during the preceding 12 months (or for such shorter period that the registrant was required to file such reports), and (2) has been subject to such filing requirements for the past 90 days. Yes x No ¨
Indicate by check mark whether the registrant has submitted electronically and posted on its corporate Web site, if any, every Interactive Data File required to be submitted and posted pursuant to Rule 405 of Regulation S-T during the preceding 12 months (or for such shorter period that the registrant was required to submit and post such files). Yes ¨ No ¨
Indicate by check mark if disclosure of delinquent filers pursuant to Item 405 of Regulation S-K is not contained herein, and will not be contained, to the best of registrant’s knowledge, in definitive proxy or information statements incorporated by reference in Part III of this Form 10-K or any amendment to this Form 10-K. ¨
Indicate by check mark whether the registrant is a large accelerated filer, an accelerated filer, a non-accelerated filer, or a smaller reporting company. See the definitions of “large accelerated filer”, “accelerated filer” and “smaller reporting company” in Rule 12b-2 of the Exchange Act. (Check one):
| Large accelerated filer | ¨ | Accelerated filer | x | |||
| Non-accelerated filer | ¨ | Smaller reporting company | ¨ | |||
Indicate by check mark whether the registrant is a shell company (as defined in Rule 12b-2 of the Exchange Act). Yes ¨ No x
The aggregate market value on June 30, 2010 of the voting and non-voting common equity held by non-affiliates of the registrant was $205,895,000. For purposes of this calculation, the registrant has assumed that stockholders that are not officers or directors of the registrant are not affiliates of the registrant.
The number of shares of registrant’s Common Stock, par value $0.01 per share, outstanding as of February 23, 2011: 7,786,511.
DOCUMENTS INCORPORATED BY REFERENCE
Selected portions of the registrant’s definitive Proxy Statement for the 2011 Annual Meeting of Stockholders are incorporated by reference into Part III hereof.
Table of Contents
Index
Table of Contents
PART I
| Item 1. | Business. |
Unless the context otherwise requires, the term “we,” “us,” “our,” “Westwood,” or “Westwood Holdings Group” when used in this Form 10-K (“Report”) and in the Annual Report to the Stockholders refers to Westwood Holdings Group, Inc., a Delaware corporation, and its consolidated subsidiaries and predecessors taken as a whole. This Report contains some forward-looking statements within the meaning of the federal securities laws. Actual results and the timing of some events could differ materially from those projected in or contemplated by the forward-looking statements due to a number of factors, including without limitation those set forth under “Item 7. Management’s Discussion and Analysis of Financial Condition and Results of Operations” and “Item 1A. Risk Factors”.
General
We manage investment assets and provide services for our clients through our two subsidiaries, Westwood Management Corp. (“Westwood Management”) and Westwood Trust. Westwood Management provides investment advisory services to corporate retirement plans, public retirement plans, endowments and foundations, a family of mutual funds, which we call the WHG Funds, other mutual funds, individuals and clients of Westwood Trust. Westwood Trust provides trust and custodial services and participation in common trust funds that it sponsors to institutions and high net worth individuals. Our revenues are generally derived from fees based on a percentage of assets under management and at December 31, 2010, Westwood Management and Westwood Trust collectively managed assets valued at approximately $12.5 billion. We have been providing investment advisory services since 1983 and, according to recognized industry sources, including Morningstar, Inc., our principal asset classes rank at or above the median in performance within their peer groups when measured over multi-year periods of ten years and longer.
The core of our business is dependent on client relationships. We believe that, in addition to investment performance, client service is paramount in the asset management business. Accordingly, a major focus of our business strategy is to continue building strong relationships with clients to enhance our ability to anticipate their needs and satisfy their investment objectives. Our team approach is designed to result in efficient, responsive service for our clients. Our future success is dependent to a significant degree on both investment performance and our ability to provide attentive client service.
We were incorporated under the laws of the State of Delaware on December 12, 2001. We are an independent public company and our common stock is listed on the New York Stock Exchange under the ticker symbol “WHG.” We are a holding company whose principal assets consist of the capital stock of Westwood Management and Westwood Trust.
One of the priorities on which we have focused since 2002 is building a foundation in terms of personnel and infrastructure to support a potentially much larger business. We have also developed products that we believe will be desirable within our target institutional, private wealth and mutual fund markets. The costs of developing new products and building the organization can result in incurring expenses before material offsetting revenue is realized. We believe that the business foundation and appropriate products are now in place and in recent years we have been taking these products to our served markets. A high level of interest in these products has been demonstrated by investors in our target markets and we hope this increased level of interest will generate new revenue streams.
Available Information
We maintain a website at www.westwoodgroup.com. Information contained on, or connected to, our website is not incorporated by reference into this Form 10-K and should not be considered part of this report or any other filing that we make with the Securities and Exchange Commission (“SEC”). All filings made by us with the SEC, including our annual report on Form 10-K, quarterly reports on Form 10-Q, current reports on Form 8-K and any amendments to those reports filed or furnished pursuant to Sections 13(a) or 15(d) of the Securities Exchange Act of 1934, as amended, are available free of charge on our website. Additionally, our Code of Business Conduct and Ethics, our Corporate Governance Guidelines and our Audit Committee, Compensation Committee and Governance/Nominating Committee Charters are available without charge on our website. Stockholders also may obtain print copies of these documents free of charge by submitting a written request to William R. Hardcastle, Jr. at the address set forth in the front of this Report. The public may read and copy any materials that we file with the SEC at the SEC’s Public Reference Room at 100 F Street, N.E., Washington DC 20549. The public may obtain information on the operation of the Public Reference Room by calling the SEC at 1-800-SEC-0330. Also, the SEC maintains an internet website that contains reports, proxy and information statements, and other information regarding issuers, including Westwood Holdings Group, Inc. that file electronically with the SEC. The public can obtain any document we file with the SEC at www.sec.gov.
1
Table of Contents
Westwood Management
General
Westwood Management provides investment advisory services to large institutions, including corporate retirement plans, public retirement plans, endowments and foundations, having at least $10 – $25 million in investable assets, depending on the asset class. Westwood Management also provides advisory services to individuals and the WHG Funds and subadvisory services to other mutual funds. Our overall investment philosophy is determined by a team of professionals including our chief investment officer, Susan M. Byrne, and, with respect to the bulk of assets under management, consists of a value-oriented approach focused on achieving a superior, risk-adjusted return by investing in companies generating high levels of free cash flow with strong balance sheets and positioned for growth but not fully recognized as such in the marketplace. This investment approach is designed to preserve capital during unfavorable periods and provide superior real returns over the long term. Ms. Byrne has over 40 years of investment experience. Westwood Management’s investment advisory team consists of a number of investment management, research and trading professionals with substantial investment management experience. The continuity of the team and its years of experience are critical elements in successfully managing investments.
Managed Asset Classes
Asset Management. We offer a broad range of investment asset classes allowing us to serve various types of clients and varying investment objectives. Over 40% of our assets under management are invested in our LargeCap Value asset class. The following sets forth the principal asset classes currently managed by Westwood Management:
LargeCap Value: Investments in equity securities of approximately 45-60 well-seasoned companies with market capitalizations generally over $5 billion. This portfolio is invested in companies where we expect that future profitability, driven by operational improvements, will be higher than expectations reflected in current share prices.
Dividend Growth: Investments in equity securities of approximately 40-60 high quality companies with market capitalizations generally over $1 billion. This portfolio is invested in companies of which at least 80% pay a dividend and whose prospects for dividend growth are strong. The Dividend Growth strategy combines quantitative and fundamental research to create a diversified portfolio with companies that we believe can create value for shareholders.
MidCap Value: Investments in equity securities of approximately 50-70 companies with market capitalizations between $4 billion and $20 billion. Similar to the LargeCap Value asset class, we seek to discover operational improvements that are driving earnings growth within mid-size companies that can be purchased inexpensively.
SMidCap Plus+: Investments in equity securities of approximately 45-65 companies with market capitalizations between $2 billion and $15 billion. Similar to our other value-oriented asset classes, we seek to discover operational improvements that are driving earnings growth within small to mid-size companies that can be purchased inexpensively.
SMidCap Value: Investments in equity securities of approximately 45-65 companies with market capitalizations between $100 million and $10 billion. Similar to our other value-oriented asset classes, we seek to discover operational improvements that are driving earnings growth within small to mid-size companies that can be purchased inexpensively.
2
Table of Contents
SmallCap Value: Investments in equity securities of approximately 50-70 companies with market capitalizations between $100 million and $2.5 billion. Similar to our other value-oriented asset classes, we seek to invest in high quality companies whose earnings growth is driven by operational improvements not yet fully recognized by the market. This asset class reached its asset capacity in 2010 and is now closed to new investors.
AllCap Value: Investments in equity securities of approximately 60-80 well-seasoned companies. The portfolio is generally comprised of the best ideas within all market capitalizations above $100 million. Similar to our other value-oriented asset classes, we seek to invest in companies across a broad range of market capitalizations where we expect that future profitability, driven by operational improvements, will be higher than expectations currently reflected in share prices.
LargeCap Enhanced: Investments in equity securities of approximately 75-100 long and 20-30 short, well-seasoned companies with market capitalizations above $3 billion. Using fundamental research with a quantitative screening overlay, this portfolio is invested in companies where we expect that future profitability, driven by operational improvements, will be higher than expectations reflected in current share prices and also shorts companies where we expect that future profitability is below what is reflected in current share prices.
Balanced: Investments in a combination of equity and fixed income securities, designed to provide both growth opportunities and income, while also emphasizing asset preservation in “down” markets. Westwood Management applies its expertise in dynamic asset allocation and security selection decisions in carrying out this balanced strategy approach.
Income Opportunity: Investments in dividend-paying common stocks, straight and convertible preferred stock, master limited partnerships, REITs and selected debt instruments. This portfolio’s strategy focuses on companies with strong and improving cash flow sufficient to support a sustainable or rising income stream for investors. This asset class is targeted towards investors seeking low volatility and high current income through dividend-paying and/or interest-bearing securities.
Master Limited Partnerships (“MLPs”): Investments include MLPs (including limited partnerships, “LPs,” and general partnerships, “GPs”), securities of tanker and other marine shipping companies and other securities. Within these types of securities, the portfolio focuses on companies that, over time, exhibit higher dividend yields, stable and predictable cash flows, low correlations to other asset classes, and growth opportunities.
Core/Intermediate Fixed Income: Investments in high-grade, intermediate term corporate and government bonds. We seek to add value to client portfolios through yield curve positioning and investing in debt instruments with improving credit quality potential.
Each asset class consists of a portfolio of equity and/or fixed income securities selected by Westwood Management’s portfolio teams and chosen to best provide the long term returns consistent with Westwood Management’s investment philosophy. Our portfolio teams make decisions for all of Westwood Management’s asset classes in accordance with the investment objectives and policies of such asset classes, including determining when and which securities to purchase and sell.
We employ a value-oriented approach in managing our equity asset classes. The common thread that permeates our investment strategies is our focus on a disciplined approach to controlling risk and, whenever possible, preserving the core value of our clients’ assets. Our value-oriented asset classes place a greater emphasis on identifying companies where earnings result from actual operational improvements rather than from improvements derived from financial statement adjustments. The overriding objective of this strategy is to prevent the loss of the core value of client assets, even at the cost of potentially higher returns. Through investments in companies that exhibit these characteristics, Westwood Management seeks to demonstrate consistently superior performance relative to our industry peers and relevant benchmark indices.
3
Table of Contents
More than half of our assets under management are invested in equity securities of companies with large market capitalizations. When measured over multi-year periods of ten years and longer, Westwood Management’s principal asset classes have consistently ranked above the median within peer group performance rankings according to recognized industry sources, including Morningstar, Inc.
Our ability to grow assets under management is primarily dependent on our competitive long-term performance record, building strong relationships with investment consulting firms as well as our ability to develop new client relationships. We continually look for opportunities to expand our assets under management by growing our existing asset classes and developing new portfolios focusing on investment areas not part of our current asset classes under management. We primarily intend to grow our asset classes internally but may consider acquiring new asset classes from third parties, as discussed under “—Growth Strategy” below. Our growth strategy provides clients with more investment opportunities and diversifies our assets under management, thereby reducing risk in any one area of investment and increasing our competitive ability to attract new clients.
Advisory and Subadvisory Service Agreements
Westwood Management manages client accounts under investment advisory and subadvisory agreements. Typical within the asset management industry, such agreements are usually terminable upon short notice and provide for compensation based on the market value of the client’s assets under management. Westwood Management’s advisory fees are paid quarterly in advance based on assets under management on the last day of the preceding quarter, quarterly in arrears based on assets under management on the last day of the previous quarter, or are based on a daily or monthly analysis of assets under management for the stated period. A limited number of our clients have a performance-based fee component in their contract, which generates additional revenues if we outperform a specified index over a specific period of time. We record revenue for performance-based fees at the end of the measurement period. Revenue from advance payments is deferred and recognized over the period that services are performed. Pursuant to these agreements, Westwood Management provides overall investment management services, including directing investments in conformity with the investment objectives and restrictions established by clients. Unless otherwise directed in writing by clients, Westwood Management has the authority to vote all proxies with respect to client assets.
Westwood Management is also a party to subadvisory agreements with other investment advisors under which it performs substantially the same services as it does under its advisory agreements. However, the investment strategy adopted for a particular client is subject to supervision and review by the client. Our subadvisory fees are computed based upon the daily net assets of the client and are payable on a monthly basis. As with our advisory agreements, these agreements are terminable upon short notice.
Under our subadvisory agreement with Teton Advisors, Inc. (formerly Gabelli Advisers, Inc.), Westwood Management provides investment advisory services to the GAMCO Westwood Funds family of mutual funds. Westwood Management owns shares of Class A Common Stock representing a 15.3% economic interest in Teton Advisors, Inc., an affiliate of GAMCO Investors, Inc. Based on SEC filings, we believe that GAMCO Investors, Inc. owned 13.2% of our common stock as of December 31, 2010. Westwood Management received subadvisory payments from Teton Advisors, Inc. of $573,000, $617,000 and $784,000 for the twelve months ended December 31, 2010, 2009 and 2008, respectively.
While Westwood Management provides subadvisory services with respect to the Westwood Funds family of funds, Westwood Management provides investment advisory services directly to the WHG Funds family of mutual funds, which includes the WHG SMidCap Fund, the WHG Income Opportunity Fund, the WHG LargeCap Value Fund, the WHG Balanced Fund and the WHG SmallCap Value Fund. As of December 31, 2010, the WHG Funds had assets under management of $902 million. Effective February 7, 2011, the McCarthy Multi-Cap Stock Fund, which had assets under management of $68 million as of December 31, 2010, was reorganized into the WHG Dividend Growth Fund. “WHG Funds” represent the family of institutional mutual funds for which Westwood Management serves as advisor. “Westwood Funds” represent the family of mutual funds for which Westwood Management serves as subadvisor.
4
Table of Contents
One of our largest clients in terms of assets paid us both asset-based and performance-based advisory fees in 2008. Due to a significant performance fee earned in 2008, this client accounted for 19.5% of our fee revenues in 2008; however, this client did not pay us a performance fee in 2010 or 2009 and accounted for less than 1% of our revenues for the years ended December 31, 2010 and 2009. Our four largest clients accounted for approximately 12.2% of our fee revenues for the year ended December 31, 2010. The loss of some or all of these large clients or failure to deliver the investment performance necessary to earn a performance fee could have a material adverse affect on our business and our results of operations.
Westwood Trust
General
Westwood Trust provides trust and custodial services and participation in common trust funds that it sponsors to institutions and high net worth individuals generally having at least $1 million in assets under management. Westwood Trust seeks to define and improve the risk/return profile of the client’s investment portfolio by complementing or enhancing existing investment strategies. Westwood Trust provides back office services to its clients, including tax reporting, distribution of income to beneficiaries, preparation of account statements and attending to the special needs of particular trusts, and also serves as trustee for tax and estate-planning purposes and for special needs trusts. Westwood Trust is chartered and regulated by the Texas Department of Banking.
Westwood Trust primarily provides services for employee benefit trusts and personal trusts. Employee benefit trusts include retirement plans of businesses to benefit their employees, such as defined contribution plans, pensions and profit sharing plans. Westwood Trust may also be appointed as a trustee and may provide administrative support for these plans, as well as investment advisory and custodial services. Personal trusts are developed to achieve a number of different objectives, and Westwood Trust acts as trustee to these trusts and assists them in developing tax-efficient trust portfolios. The fees charged by Westwood Trust are separately negotiated with each client and are based on the complexity of the operations of the trust and the amount of assets under management.
Services
Westwood Trust undertakes a fiduciary responsibility toward the management of each client’s assets and utilizes a consultative asset allocation approach. This approach involves Westwood Trust examining the client’s financial situation, including the client’s current portfolio of investments, and advising the client on ways in which it can enhance its investment returns and financial position. Westwood Trust also provides custodial services, safekeeping and accounting services.
Common Trust Funds
Westwood Trust sponsors a number of common trust funds in which client assets are commingled to achieve economies of scale. Westwood Trust’s common trust funds fall within two basic categories: personal trusts and employee benefit trusts. Westwood Trust sponsors common trust funds for most of the asset classes managed by Westwood Management. Westwood Trust also engages third party subadvisors for some common trust funds, such as our Growth Equity, International Equity and High Yield Bond common trust funds.
Enhanced Balanced Portfolios
Westwood Trust is a strong proponent of asset class diversification and offers its clients the ability to diversify among multiple different asset classes. Westwood Trust Enhanced Balanced ™ portfolios seek to combine these asset classes into a customizable portfolio for clients seeking to maximize return for a given level of risk. Periodic adjustments are made to asset class weightings in Enhanced Balanced ™ portfolios based on historical returns, risk and correlation data, as well as on an analysis of our capital markets outlook.
5
Table of Contents
Distribution Channels
We market our services through several distribution channels that allow us to expand the reach of our investment advisory services. These channels enable us to leverage existing distribution infrastructure and capabilities of other financial services firms and intermediaries while focusing on our core competency of developing and managing investment asset classes.
Institutional Investment Consultants
Investment management consulting firms serve as gatekeepers to many corporate retirement plans, public retirement plans, endowments and foundations, which represent Westwood’s primary client target markets. Consultants provide guidance to their clients in setting asset allocation strategy, as well as creating investment policies. Consultants also make recommendations for investment firms they believe can best meet their client’s investment objectives. We have established strong relationships with many national and regional investment consulting firms, which has resulted in our being considered and hired by many of their clients. Continuing to enhance our existing consulting firm relationships, as well as forging new relationships, serves to increase the awareness of our services in both the consultant community and their underlying institutional client base.
Subadvisory Relationships
Our subadvisory relationships allow us to extend the reach of our investment management services to clients of other investment companies with broad, established distribution capabilities. In subadvisory arrangements, our client is typically the investment company through which our services are offered to investors. In these subadvisory arrangements, our investment advisory services are typically made available through mutual fund offerings. The investment company that sponsors the mutual fund is responsible for marketing, distribution, operations and accounting related to these funds.
Managed Accounts
Managed accounts are similar in some respects to subadvisory relationships in that a third-party financial institution, such as a brokerage firm or turnkey asset management program provider, handles distribution to the end client. The end client in a managed account is typically a high net worth individual or small institution. In these arrangements, the third party financial institution is responsible to the end client for client service, operations and accounting.
Growth Strategy
We believe that we have established a strong platform to support future growth, deriving our strength in large part from the experience and capabilities of our management team and skilled investment professionals. We believe that this focused, stable team has contributed significantly to our solid investment performance, superior client service and a growing array of asset classes. We believe that opportunities for future growth may come from our ability to:
| • | generate growth from new and existing clients and consultant relationships |
| • | attract and retain key employees |
| • | grow assets in our additional asset classes |
| • | foster continued growth of the Westwood Trust platform |
| • | foster expanded distribution via mutual funds |
| • | pursue strategic acquisitions and alliances |
| • | continue to strengthen our brand name. |
Generate growth from new and existing clients and consultant relationships. As our primary business objective, we intend to maintain and enhance existing relationships with clients and investment consultants by continuing to provide solid investment performance and high quality customer service to existing relationships. Additionally, we intend to pursue growth through targeted sales and marketing efforts that emphasize our investment performance and superior client service. New institutional client accounts are generally derived through investment consultants and we have been successful in developing solid long-term relationships with many national and regional investment consultants. We believe that the familiarity with our firm, our people and our processes that we have built in consultant and client relationships is a key factor in being considered for new client investment mandates.
6
Table of Contents
Attract and retain key employees. In order to achieve our performance and client relationship objectives, we must be able to retain and attract talented investment professionals. We believe that we have created a workplace environment in which motivated, performance-driven, and client-oriented individuals thrive. As a public company, we are able to offer our employees a compensation program that includes strong equity incentives such that their success will be closely tied to the success of our clients and stockholders. We believe that these factors are critical ingredients in maintaining a stable, client-focused environment and accordingly we have built a firm that we believe can support significant future growth.
Grow assets in our additional asset classes. LargeCap Value is our flagship product and we believe it has significant capacity to attract additional assets; however, we continue to develop additional asset classes in response to client needs and the opportunities we identify in the marketplace. We believe these additional asset classes provide opportunities for us to grow our assets under management. For instance, we have achieved meaningful growth in assets in our SMidCap Value product since we began marketing this asset class to institutions in 2004. As a result of this growth, the SMidCap Value asset class was closed to new investors in 2010. The WHG SMidCap mutual fund remains open to existing shareholders only. In July 2010 we launched the SMidCap Plus+ product, which is managed by the same team responsible for the SMidCap product. We believe SMidCap Plus+ will be an attractive investment alternative to clients looking to invest in small to mid size companies. We are also marketing other asset classes that we have developed in recent years. We began marketing SmallCap Value to institutions in 2007 and it has completed the approval process at many investment consulting firms, winning several institutional mandates. Our AllCap product has been receiving increased interest and has been awarded several institutional mandates in the last two years. Assets in our Income Opportunity product grew substantially in 2010 with strong interest from our private wealth and mutual fund channels. In 2007, we launched an MLP portfolio in response to the needs of an existing client. We believe that we have the team in place to support these products in our target institutional, private wealth and mutual fund markets. If we continue to deliver strong performance, we believe that demand for these asset classes can provide meaningful growth in our assets under management.
Foster continued growth of the Westwood Trust platform. Westwood Trust has experienced solid growth in serving small-to medium-sized institutions and high net worth individuals. We see continued interest from clients and prospects in our diversified, highly attentive service model. A significant percentage of new asset growth at Westwood Trust stems from referrals and additional assets from existing clients. We believe the continued acceptance of our Enhanced Balanced ™ product, which offers diversified exposure to multiple asset classes in a tax efficient, comprehensive solution for clients, provides opportunities for future growth. Our recent acquisition of McCarthy Group Advisors in Omaha, Nebraska enables us to introduce Westwood Trust products and services to a new market, which we believe offers attractive growth opportunities.
Foster expanded distribution via mutual funds. The WHG Funds consist of WHG SMidCap (WHGMX), WHG Income Opportunity (WHGIX), WHG LargeCap Value (WHGLX), WHG Balanced (WHGBX) and WHG SmallCap Value (WHGSX), which were launched from 2005 through 2007. In addition, the WHG Dividend Growth Fund (WHGDX) was launched in February 2011 subsequent to the reorganization of the McCarthy Multi-Cap Stock Fund. The WHG SMidCap Fund was closed to new investors in January 2011. Also in January 2011, we filed a registration statement for the WHG SMidCap Plus+ Fund, which we expect to be available later in 2011. The WHG Funds, which mirror our institutional strategies, offer capped expense ratios and are available in an institutional share class for all funds. In December 2007 we launched an A share for WHG LargeCap Value and WHG Income Opportunity in order to target No Transaction Fee (“NTF”) mutual fund supermarket platforms and the broker/dealer marketplace. In 2009 we reduced the expense cap for WHG Income Opportunity and WHG Balanced in order to increase their appeal to investors. We believe that access to our asset classes via an institutional mutual fund vehicle will present an attractive offering for certain segments of institutional investors, including 401(k) plans.
Pursue strategic acquisitions and alliances. We will carefully evaluate strategic acquisition, joint venture and alliance opportunities. We may express an interest in pursuing acquisitions of asset management firms, mutual funds, or trust companies having assets where we have expertise or that appear appropriate as a means of expanding our range of asset classes or services or expanding our distribution capabilities. By acquiring investment firms that successfully manage asset classes beyond our current expertise we can increase opportunities to attract new clients and provide existing clients with an even more diversified range of asset classes. We may also consider entering into alliances with other financial services firms to allow us to leverage our core competency of developing superior investment products in combination with alliance partners that could provide us with enhanced distribution capabilities or provide our clients with access to additional service offerings.
7
Table of Contents
Continue strengthening our brand name. We believe that the strength of our brand name has been a key component to our successful long-term participation in the investment industry and will be instrumental to our future success. We have developed our strong brand name largely through high profile coverage in investment publications and electronic media. A number of our investment professionals, including Susan Byrne, David Spika, Mark Freeman and Ragen Stienke, are visible in print and electronic media, which we believe enhances our brand name. We will continue to look for creative ways to strengthen our brand name and reputation in our target client markets.
Competition
We are subject to substantial and growing competition in all aspects of our business. Barriers to entry to the asset management business are relatively low, and we believe that we will face a growing number of competitors. Although no one company dominates the asset management industry, many companies are larger, better known and have greater resources than our company.
Further, we compete with other asset management firms on the basis of asset classes offered, the investment performance of those asset classes in absolute terms and relative to peer group performance, quality of service, fees charged, the level and type of compensation offered to key employees, and the manner in which asset classes are marketed. Many of our competitors offer more asset classes and services and have substantially greater assets under management.
We compete against numerous investment dealers, banks, insurance companies and others that sell equity funds, taxable income funds, tax-free investments and other investment products. In addition, the allocation of assets by many investors from active equity investment to index funds, fixed income or similar asset classes has enhanced the ability of firms offering non-equity asset classes and passive equity management to compete with us effectively. In short, our competitive landscape is intense and dynamic and there can be no assurance that we will be able to compete effectively in the future as an independent company.
Additionally, most prospective clients perform a thorough review of an investment manager’s background, investment policies and performance before committing assets to that manager. In many cases, prospective clients invite a number of competing firms to make presentations. The process of obtaining a new client typically takes twelve to eighteen months from the time of the initial contact. While we have achieved a high degree of success in competing successfully for new clients, it is a process to which we must continue to dedicate significant resources over an extended period, with no certainty of success.
Regulation
Westwood Management
Virtually all aspects of our business are subject to federal and state laws and regulations. These laws and regulations are primarily intended to protect investment advisory clients and stockholders of registered investment advisers. Under such laws and regulations, agencies that regulate investment advisers have broad administrative powers, including the power to limit, restrict or prohibit advisers from carrying on their business in the event that they fail to comply with such laws and regulations. In such event, possible sanctions that may be imposed include suspension of individual employees, limitations on engaging in certain lines of business for specified periods of time, revocation of investment adviser and other registrations, censures and fines. We believe that we are in substantial compliance with all material laws and regulations.
8
Table of Contents
Our business is subject to regulation at both federal and state levels by the SEC and other regulatory bodies. Westwood Management is registered with the SEC under the Investment Advisers Act of 1940 and under the laws of various states. As a registered investment adviser, Westwood Management is regulated and subject to examination by the SEC. The Investment Advisers Act imposes numerous obligations on registered investment advisers, including fiduciary duties, record keeping requirements, operational requirements, marketing requirements and disclosure obligations. Westwood Management also acts as adviser to a family of mutual funds, the WHG Funds, which are registered with the SEC under the Investment Company Act of 1940. As adviser to a registered investment company, Westwood Management must comply with the requirements of the Investment Company Act and related regulations. The Investment Company Act imposes numerous obligations on registered investment companies, including requirements relating to operations, fees charged, sales, accounting, record-keeping, disclosure, governance and restrictions on transactions with affiliates. Under the rules and regulations of the SEC promulgated pursuant to the federal securities laws, we are subject to periodic examination by the SEC. The SEC is authorized to institute proceedings and impose sanctions for violations of the Investment Advisers Act and the Investment Company Act, ranging from censure to termination of an investment adviser’s registration. The failure of Westwood Management to comply with the requirements of the SEC could have a material adverse effect on Westwood. We must also comply with anti-money laundering laws and regulations, including the USA PATRIOT Act of 2001, as subsequently amended and reauthorized. We believe that we are in substantial compliance with the requirements of the regulations under the Investment Advisers Act, the Investment Company Act and the USA PATRIOT Act.
Westwood Trust
Westwood Trust operates in a highly regulated environment and is subject to extensive supervision and examination. As a Texas chartered trust company, Westwood Trust is subject to the Texas Finance Code (the “Finance Code”), the rules and regulations promulgated under the Finance Code and supervision by the Texas Department of Banking. These laws are intended primarily for the protection of Westwood Trust’s clients and creditors, rather than for the benefit of investors. The Finance Code provides for and regulates a variety of matters, such as:
| • | minimum capital maintenance requirements |
| • | restrictions on dividends |
| • | restrictions on investments of restricted capital |
| • | lending and borrowing limitations |
| • | prohibitions against engaging in certain activities |
| • | periodic examinations by the office of the Texas Department of Banking Commissioner |
| • | furnishing periodic financial statements to the Texas Department of Banking Commissioner |
| • | fiduciary record-keeping requirements |
| • | prior regulatory approval for certain corporate events (such as mergers, sale/purchase of all or substantially all of the assets and transactions transferring control of a trust company). |
The Finance Code also gives the Banking Commissioner broad regulatory powers (including penalties and civil and administrative actions) if the trust company violates certain provisions of the Finance Code or conservatorship or closure if Westwood Trust is determined to be in a “hazardous condition” (as defined by law). Westwood Trust’s failure to comply with the Finance Code could have a material adverse effect on Westwood.
Westwood Trust is limited by the Finance Code in the payment of dividends to undivided profits which is described as that part of equity capital equal to the balance of net profits, income, gains, and losses since its formation date minus subsequent distributions to stockholders and transfers to surplus or capital under share dividends or appropriate board resolutions. At the discretion of its board of directors, Westwood Trust has made quarterly and special dividend payments to Westwood Holdings Group out of undivided profits.
Employee Retirement Income Security Act of 1974
We are subject to the Employee Retirement Income Security Act of 1974, as amended (“ERISA”), and to the related regulations, insofar as we are a “fiduciary” under ERISA with respect to some clients. ERISA and applicable provisions of the Internal Revenue Code impose certain duties on persons who are fiduciaries under ERISA or who provide services to ERISA plan clients and prohibit certain transactions involving ERISA plan clients. Our failure to comply with these requirements could have a material adverse effect.
9
Table of Contents
Employees
At December 31, 2010, we had 77 full-time employees, including 29 investment management, research and trading professionals, 26 marketing and client service professionals, and 22 operations and business management professionals. No employees are represented by a labor union and we believe our employee relations to be good.
Segment information
For information about our operating segments, Westwood Management and Westwood Trust, please see footnote 13 “Segment Reporting” in the financial statements accompanying this Report.
10
Table of Contents
| Item 1A. | Risk Factors |
We believe these represent the material risks currently facing our business. Our business, financial condition or results of operations could be materially adversely affected by these risks. The trading price of our common stock could decline due to any of these risks, and you may lose all or part of your investment. You should carefully consider the risks described below before making an investment decision. You should also refer to the other information included or incorporated by reference in this Report, including our financial statements and related notes.
Poor investment performance of assets managed by us could adversely affect our results of operations.
Because we compete with many asset management firms on the basis of asset classes offered and the investment performance of those asset classes, our success is dependent to a significant extent on the investment performance of the assets that we manage. Because our revenue is primarily generated from fees derived as a percentage of assets under management, poor performance tends to result in the loss or reduction of client accounts, which correspondingly decreases revenues. Underperformance relative to peer groups for our various asset classes could adversely affect our results of operations, especially if such underperformance continues for a lengthy period of time.
Some management employees are considered critical to our success, and our inability to attract and retain key employees could compromise our future success.
We believe that our future success will depend to a significant extent upon the services of our executive officers, particularly Susan M. Byrne, our Chairman of the Board and Chief Investment Officer, and Brian O. Casey, our President and Chief Executive Officer. As with other asset management businesses, our future performance depends to a significant degree upon the continued contributions of these and other key officers, investment professionals, marketing, client service and management personnel. There is substantial competition for skilled personnel and the loss of key employees or our failure to attract, retain and motivate qualified personnel, could negatively impact our business, financial condition, results of operations and future prospects.
Our revenues are dependent upon the performance of the securities markets and negative performance of the securities markets could reduce our revenues.
Our results of operations are affected by many economic factors, including the performance of the securities markets. Negative performance within the securities markets or short-term volatility within the securities markets could result in investors withdrawing assets, decreasing their rates of investment or shifting assets to cash or other asset classes that we do not manage, all of which could reduce our revenues. Because most of our revenues are based on the value of assets under management, a decline in the value of those assets would also adversely affect our revenues. In addition, in periods of slowing growth or declining revenues, profits and profit margins are adversely affected because certain expenses remain relatively fixed.
In particular, a significant amount of our assets under management is invested in equity securities of companies with large market capitalizations. As a consequence, we are particularly susceptible to the volatility associated with changes in the market for large capitalization stocks. Due to this concentration, any change or reduction in such markets, including a shift of our clients’ and potential clients’ preference from investments in equity securities of large capitalization stocks to other equity or fixed income securities could have a significant negative impact on our revenues and results of operations. This negative impact could occur due to the depreciation in value of our assets under management, the election by clients to select other firms to manage their assets or the election by clients to allocate assets away from asset classes that we manage. Any of these events would result in decreased assets under management and therefore reduced revenues and a decline in results of operations.
If we are unable to realize benefits from the costs we have incurred and are continuing to incur to develop new asset classes and otherwise broaden our capabilities, our growth opportunities may be adversely affected.
We have incurred significant costs during the last several years to develop new asset classes, including SmallCap Value, AllCap Value, Income Opportunity, MidCap, LargeCap Enhanced (130/30), Global Strategic Diversification, an MLP portfolio and SMidCap Plus+, to launch new mutual funds under the WHG Funds name, and to upgrade our business infrastructure. Some costs associated with these improvements will continue to be incurred in future periods and are relatively fixed. We may not realize the benefits of these investments and in the event we are unable to do so our results of operations and growth opportunities may be adversely affected.
11
Table of Contents
Due to the substantial cost and time required to introduce new asset classes in our industry, we may not be able to successfully introduce new asset classes in a timely manner, or at all.
The development and marketing of new asset classes in our industry requires a substantial amount of time and financial resources. Our ability to market and sell a new asset class successfully depends on our financial resources, the performance results of the specific asset class, the timing of the offering and our marketing strategies. Once an asset class is developed, whether through acquisition or internal development, we must effectively market the asset class to our existing and prospective clients. This entails incurring substantial financial costs related to research on the target assets and the demand for such asset class in the market, as well as sales and marketing costs associated with attracting assets to the new asset class. In addition, our ability to sell new asset classes to our existing and prospective clients depends on our ability to meet or exceed the performance of our competitors who offer the same or similar asset classes. We may not be able to manage the assets within a given asset class profitably. Moreover, it may take years before we are able to produce the level of results that will enable us to attract clients. If we are unable to realize the benefits of the costs and expenses incurred in developing new asset classes, we may experience losses as a result of our management of these asset classes, and our ability to introduce further new asset classes and compete in our industry may be hampered.
Our business is dependent on investment advisory, subadvisory and trust agreements that are subject to termination or non-renewal. As a result, we could lose any of our clients on very short notice.
Substantially all of our revenues are derived pursuant to investment advisory, subadvisory and trust agreements with our clients. In general, either party may terminate these agreements upon 30 days’ notice. Any termination of, or failure to renew, a material number of these agreements could have a material adverse impact on us, particularly because many of our costs are relatively fixed.
A small number of clients account for a substantial portion of our business. As such, the reduction or loss of business with any of these clients could have an adverse impact on our business, financial condition and results of operations.
One of our largest clients in terms of assets paid us both asset-based and performance-based advisory fees in 2008. Due to a significant performance fee earned in 2008, this client accounted for 19.5% of our fee revenues for the year ended December 31, 2008; this client did not pay a performance fee in 2009 or 2010 and accounted for less than 1% of our revenues for the years ended December 31, 2009 and 2010. Our four largest clients accounted for approximately 12.2% of fee revenues for the year ended December 31, 2010. We are dependent to a significant degree on our ability to maintain existing relationships with these clients. There can be no assurance that we will be successful in maintaining these existing client relationships, securing additional clients or achieving the superior investment performance necessary to earn performance-based advisory fees. Any failure by us to retain one or more of these large clients or establish profitable relationships with additional clients could have a material adverse effect on our business, financial condition and results of operations.
Competitive fee pressures could reduce revenues and profit margins.
The investment management business is highly competitive and has relatively low barriers to entry. To the extent we have to compete on the basis of price, we may not be able to maintain our current fee structure. Although our investment management fees vary from product to product, we have competed primarily on the performance of our products and client service rather than on the level of our investment management fees relative to our competitors. In recent years there has been a trend toward lower fees in the investment management industry. In order to maintain our fee structure in a competitive environment, we must be able to continue to provide clients with investment returns and service that make investors willing to pay our fees. We cannot be assured that we will succeed in providing investment returns and service that will allow us to maintain our current fee structure. Fee reductions on existing or future new business could have an adverse effect on our profit margins and results of operations.
12
Table of Contents
Performance fees could have a significant effect on our revenues and results of operations.
We have performance fee agreements with a small number of our clients, which would pay us a fee if we outperform a specified index over predetermined periods of time. There can be no assurance that we will outperform relative to such indexes and the failure to do so would cause us to earn none or only part of those potential revenues, which would have a material adverse effect on our revenues and results of operations. Our revenues from performance-based fees could fluctuate significantly from one measurement period to the next, depending on how we perform relative to the indexes specified in these agreements. For example, we earned a significant performance fee in 2008, but did not earn performance fees in 2009 or 2010.
Any event that negatively affects the asset management industry in general could have a material adverse effect on us.
Any event affecting the asset management industry that results in a general decrease in assets under management or a significant general decline in the number of advisory clients or accounts could negatively impact our revenues. Our future growth and success depends in part upon the growth of the asset management industry.
Our business is subject to extensive regulation with attendant costs of compliance and serious consequences for violations.
Virtually all aspects of our business are subject to various laws and regulations including the Investment Advisers Act, the Investment Company Act, and anti-money laundering laws. These laws and regulations generally grant regulatory agencies broad administrative powers, including the power to limit or restrict us from operating our business as well as the powers to place us under conservatorship or closure in the event we fail to comply with such laws and regulations. Violations of such laws or regulations could subject us and/or our employees to disciplinary proceedings and civil or criminal liability, including revocation of licenses, censures, fines or temporary suspension, permanent barring from the conduct of business, conservatorship, or closure. Any such proceeding or liability could have a material adverse effect upon our business, financial condition, results of operations and business prospects. Due to the extensive regulations and laws to which we are subject, our management is required to devote substantial time and effort to legal and regulatory compliance issues.
In addition, the regulatory environment in which we operate is subject to change. We may be adversely affected as a result of new or revised legislation or regulations or by changes in the interpretation or enforcement of existing laws and regulations. See “ — Regulation.”
Misuse of assets and information in the possession of our investment professionals and employees could result in costly litigation and liability for us and our clients.
Our investment professionals handle a significant amount of assets along with financial and personal information for our clients. Although we have implemented a system of controls to minimize the risk of a fraudulent taking or misuse of assets and information, there can be no assurance that our controls will be adequate to prevent such fraudulent actions by our portfolio managers or employees. If our controls are ineffective in preventing the fraudulent taking or misuse of assets and information, we could be subject to costly litigation, which could consume a substantial amount of our resources, distract management from our operations, and could also result in regulatory sanctions. Additionally, any such fraudulent actions could adversely affect some clients in other ways, and these clients could seek redress against us.
Acquisitions involve inherent risks that could compromise the success of the combined business and dilute the holdings of current stockholders.
As part of our long-term business strategy, we may consider acquisitions of similar or complementary businesses. See “ — Growth Strategy.” If we are not correct when we assess the value, strengths, weaknesses, liabilities and potential profitability of acquisition candidates or if we are unsuccessful in integrating the operations of the acquired businesses, the success of the combined business could be compromised. Any future acquisitions will be accompanied by the risks commonly associated with acquisitions. These risks include, among others, potential exposure to unknown liabilities of acquired companies and to acquisition costs and expenses, the difficulty and expense of integrating the operations and personnel of the acquired companies, the potential disruption to the business of the combined company and potential diversion of management’s time and attention, the impairment of relationships with and the possible loss of key employees and clients as a result of the changes in management, potential future write-downs related to goodwill impairment in connection with acquisitions, and dilution to the stockholders of the combined company if the acquisition is made for stock of the combined company. In addition, asset classes, technologies or businesses of acquired companies may not be effectively assimilated into our business or have a positive effect on the combined company’s revenues or earnings. The combined company may also incur significant expense to complete acquisitions and to support acquired asset classes and businesses. Further, any such acquisitions may be funded with cash, debt or equity, which could have the effect of diluting the holdings or limiting the rights of stockholders. Finally, we may not be successful in identifying attractive acquisition candidates or completing acquisitions on favorable terms.
13
Table of Contents
Acquisitions executed by us were forecasted to add revenues, expenses and earnings to our business. The failure to realize these revenues and earnings could adversely impact our results of operations.
We have made two business acquisitions in the last two years. There is no guarantee that these acquisitions will yield the benefits that we forecasted due to a variety of factors, including retention of acquired clients. If these acquisitions do not yield expected benefits, our revenues and results of operations could be negatively impacted and we could be required to record an impairment against earnings for the intangible assets and goodwill acquired in these transactions.
Various factors may hinder the declaration and payment of dividends.
We have historically paid a quarterly dividend. However, payment of future dividends is subject to the discretion of our Board of Directors and various factors may prevent us from paying dividends. Such factors include our financial position, capital requirements and liquidity, the existence of a stock repurchase program, state corporate and banking law restrictions, results of operations and such other factors as our Board of Directors may consider relevant. In addition, as a holding company, our ability to pay dividends is dependent on the dividends and income we receive from our subsidiaries. Currently, our primary source of cash consists of dividends that may be received from Westwood Management or Westwood Trust. The payment of dividends by Westwood Management or Westwood Trust is subject to the discretion of their Boards of Directors and compliance with applicable laws, including, in particular, the provisions of the Texas Finance Code applicable to Westwood Trust. See “Management’s Discussion and Analysis of Financial Condition and Results of Operations.”
Our business is vulnerable to systems failures that could have a material adverse effect on our business, financial condition and results of operations.
Any delays or inaccuracies in securities pricing information or information processing could give rise to claims against us, which could have a material adverse effect on our business, financial condition and results of operations. We are highly dependent on communications and information systems and on third party vendors for securities pricing information and updates from certain software. We may suffer a systems failure or interruption, whether caused by an earthquake, fire, other natural disaster, power or telecommunications failure, unauthorized access, act of God, act of war or otherwise, and our back-up procedures and capabilities may be inadequate to eliminate the risk of extended interruptions in operations.
We may not be able to fund future capital requirements on favorable terms, if at all.
We cannot be certain that financing to fund our working capital or other cash requirements, if needed, will be available on favorable terms, if at all. Our capital requirements will vary greatly from quarter to quarter depending on, among other things, capital expenditures, fluctuations in our operating results and financing activities. If future financing is necessary, we may or may not be able to obtain financing on favorable terms, if at all. Further, any future equity financings could dilute the relative percentage ownership of then existing holders of our common stock and any future debt financings could involve restrictive covenants that limit our ability to take certain actions.
14
Table of Contents
Failure to maintain effective internal controls could have a material adverse effect on our business and stock price.
Effective internal controls are necessary to provide reliable financial reports. If we cannot provide reliable financial reports, our brand and operating results could be harmed. All internal control systems, no matter how well designed, have inherent limitations. Therefore, even systems determined to be effective can provide only reasonable assurance with respect to financial statement preparation and presentation.
We cannot be certain that the measures we take to evaluate and improve our internal controls will ensure that we implement and maintain adequate controls over our financial processes and reporting in the future. Any failure to implement required new or improved controls, or difficulties encountered in their implementation, could harm our operating results or cause us to fail to meet our reporting obligations. If we fail to maintain the adequacy of our internal controls, as such standards are modified, supplemented or amended from time to time, we may not be able to ensure that we can conclude on an ongoing basis that we have effective internal control over financial reporting in accordance with Section 404 of the Sarbanes-Oxley Act. In addition, failure to achieve and maintain an effective internal control environment could cause investors to lose confidence in our reported financial information, which could have a material adverse effect on our stock price.
Our organizational documents contain provisions that may prevent or deter another group from paying a premium over the market price to our stockholders to acquire our stock.
Our organizational documents contain provisions that require a vote of two-thirds of the shares of stock entitled to vote to remove directors for cause, establish that stockholders cannot act by written consent, and that authorize our Board of Directors to issue, without shareholder approval, blank check preferred stock. In addition, as a Delaware corporation, we are subject to Section 203 of the Delaware General Corporation Law relating to business combinations. These provisions could delay, deter or prevent a merger, consolidation, tender offer or other business combination or change of control involving us that could include a premium over the market price of our common stock that some or a majority of our stockholders might consider to be in their best interests.
We are a holding company and are dependent on the operations and funds of our subsidiaries.
We are a holding company, with no revenue generating operations and no assets other than our ownership interests in Westwood Management and Westwood Trust. Accordingly, we are dependent on the cash flow generated by these operating subsidiaries and must rely on dividends or other intercompany transfers from these operating subsidiaries to generate the funds necessary to meet our obligations.
| Item 2. | Properties. |
Westwood, Westwood Management and Westwood Trust conduct their principal operations through leased office space with approximately 21,600 square feet, expanding to 25,555 square feet in the third quarter of 2011, located in Dallas, Texas. The initial term of the lease agreement expires in November 2021. In addition, we lease office space with approximately 5,045 square feet located in Omaha, Nebraska pursuant to a lease with an initial term that expires in July 2014. We believe these facilities will be adequate to serve our currently anticipated business needs.
| Item 3. | Legal Proceedings. |
We are subject from time to time to certain claims and legal proceedings arising in the ordinary course of our business. We do not believe the outcome of these proceedings will have a material impact on our financial position, operations or cash flow.
15
Table of Contents
PART II
| Item 5. | Market for Registrant’s Common Equity, Related Stockholder Matters and Issuer Purchases of Equity Securities. |
Market Information
Our common stock has traded on the New York Stock Exchange (the “NYSE”) under the symbol “WHG” since July 1, 2002. At December 31, 2010, there were approximately 177 record holders of our common stock, although we believe that the number of beneficial owners of our common stock is substantially greater. The table below sets forth the high and low sale prices for the common stock, as reported by the NYSE for the periods indicated.
| High | Low | |||||||
| 2010 |
||||||||
| Fourth Quarter |
$ | 40.65 | $ | 33.19 | ||||
| Third Quarter |
39.00 | 28.49 | ||||||
| Second Quarter |
40.56 | 33.84 | ||||||
| First Quarter |
40.48 | 34.10 | ||||||
| 2009 |
||||||||
| Fourth Quarter |
$ | 40.60 | $ | 33.35 | ||||
| Third Quarter |
42.28 | 33.50 | ||||||
| Second Quarter |
44.44 | 37.28 | ||||||
| First Quarter |
42.92 | 24.12 | ||||||
Dividends
We have declared a cash dividend on our common stock for each quarter since the date that our common stock was first publicly traded. The table below sets forth the dividends declared for the periods indicated.
| Dividend per share of common stock |
||||||||
| Regular | Special | |||||||
| 2010 |
||||||||
| Fourth Quarter |
$ | 0.33 | $ | 0.33 | ||||
| Third Quarter |
0.33 | |||||||
| Second Quarter |
0.33 | |||||||
| First Quarter |
0.33 | |||||||
| 2009 |
||||||||
| Fourth Quarter |
$ | 0.33 | ||||||
| Third Quarter |
0.30 | |||||||
| Second Quarter |
0.30 | |||||||
| First Quarter |
0.30 | |||||||
In addition, on February 3, 2011 we declared a quarterly cash dividend of $0.35 per share on our common stock payable on April 1, 2011 to stockholders of record on March 15, 2011. We currently intend to continue paying cash dividends in such amounts as our Board of Directors determines are appropriate. Any future payment of cash dividends will be at the discretion of the Board of Directors and subject to limitations under the Delaware General Corporation Law.
Westwood Holdings Group, Inc. is the sole stockholder of both Westwood Management and Westwood Trust. Westwood Trust is limited under applicable Texas law in the payment of dividends to undivided profits which is defined as that part of equity capital equal to the balance of net profits, income, gains, and losses since its formation date minus subsequent distributions to stockholders and transfers to surplus or capital under share dividends or appropriate Board of Directors’ resolutions.
16
Table of Contents
EQUITY COMPENSATION PLAN INFORMATION
The following table gives information as of December 31, 2010 about shares of our common stock that may be issued upon the exercise of options, warrants and rights under the Third Amended and Restated Westwood Holdings Group, Inc. Stock Incentive Plan, our only equity compensation plan in effect at that time. The material terms of this plan were approved by our stockholders at our 2009 Annual Meeting and are discussed in note 9 of the financial statements included in this Form 10-K.
| Plan Category |
Number of securities to be issued upon exercise of outstanding options (a) |
Weighted- average exercise price of outstanding options (b) |
Number of securities remaining available for future issuance under equity compensation plans (excluding securities reflected in column (a)) (c) |
|||||||||
| Equity compensation plans approved by security holders |
38,400 | $ | 12.90 | 331,000 | ||||||||
| Equity compensation plans not approved by security holders |
— | — | — | |||||||||
| Total |
38,400 | $ | 12.90 | 331,000 | ||||||||
17
Table of Contents
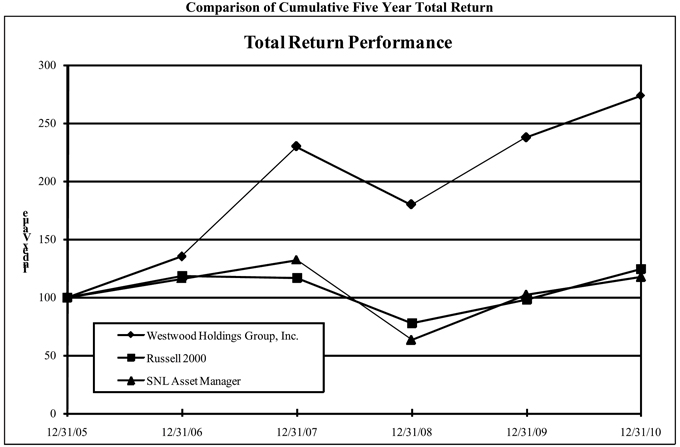
PERFORMANCE GRAPH
The following graph compares total stockholder returns of Westwood since December 31, 2005 with the total return of the Russell 2000 Index and the SNL Asset Manager Index. The SNL Asset Manager Index is a composite of 31 publicly-traded asset management companies.
| Index |
Period ended | Cumulative Five-Year Total Return |
||||||||||||||||||||||||||
| 12/31/05 | 12/31/06 | 12/31/07 | 12/31/08 | 12/31/09 | 12/31/10 | |||||||||||||||||||||||
| Westwood Holdings Group, Inc. |
$ | 100.00 | $ | 135.10 | $ | 229.47 | $ | 179.52 | $ | 237.33 | $ | 272.99 | 172.99 | % | ||||||||||||||
| Russell 2000 Index |
100.00 | 118.37 | 116.51 | 77.15 | 98.11 | 124.46 | 24.46 | |||||||||||||||||||||
| SNL Asset Manager Index |
100.00 | 115.97 | 132.01 | 62.74 | 101.78 | 117.15 | 17.15 | |||||||||||||||||||||
The total return for our stock and for each index assumes $100 invested on December 31, 2005 in our common stock, the Russell 2000 Index, and the SNL Asset Manager Index, including reinvestment of dividends. Our common stock is traded on the NYSE under the ticker symbol “WHG.”
The closing price of our common stock on the last trading day of the year ended December 31, 2010 was $39.96 per share. Historical stock price performance is not necessarily indicative of future price performance.
18
Table of Contents
| Item 6. | Selected Consolidated Financial Data. |
SELECTED CONSOLIDATED FINANCIAL DATA
The selected consolidated financial data presented below for the five years ended December 31, 2010, except Assets Under Management, is derived from our consolidated financial statements as audited by Grant Thornton LLP, independent registered public accounting firm as of and for the years ended December 31, 2010, 2009, 2008, 2007 and 2006, and should be read in conjunction with those statements. The earnings per share amounts set forth below for the years ended December 31, 2009, 2008, 2007 and 2006 were retrospectively adjusted in order to conform to the current year presentation, which uses the two-class method. For a further discussion of the two-class method please see “Note 10. EARNINGS PER SHARE” in the financial statements included in this Report. The information set forth below should be read in conjunction with “Item 1. Business” and “Item 7. Management’s Discussion and Analysis of Financial Condition and Results of Operations” included elsewhere in this Report.
| Year ended December 31, (in thousands, except per share amounts) |
||||||||||||||||||||
| 2010 | 2009 | 2008 | 2007 | 2006 | ||||||||||||||||
| Consolidated Statements of Income Data: |
||||||||||||||||||||
| Total revenues |
$ | 55,313 | $ | 42,553 | $ | 46,456 | $ | 36,292 | $ | 27,364 | ||||||||||
| Total expenses |
37,592 | 30,235 | 29,921 | 24,085 | 20,110 | |||||||||||||||
| Income before income taxes |
17,721 | 12,318 | 16,535 | 12,207 | 7,254 | |||||||||||||||
| Provision for income taxes |
6,441 | 4,423 | 5,992 | 4,263 | 2,785 | |||||||||||||||
| Income before cumulative effect of accounting change |
11,280 | 7,895 | 10,543 | 7,944 | 4,469 | |||||||||||||||
| Net income |
11,280 | 7,895 | 10,543 | 7,944 | 4,508 | |||||||||||||||
| Earnings per share before cumulative effect of change in accounting principle – basic |
$ | 1.62 | $ | 1.10 | $ | 1.53 | $ | 1.19 | $ | 0.58 | ||||||||||
| Earnings per share before cumulative effect of change in accounting principle – diluted |
$ | 1.58 | $ | 1.09 | $ | 1.52 | $ | 1.18 | $ | 0.58 | ||||||||||
| Earnings per share – basic |
$ | 1.62 | $ | 1.10 | $ | 1.53 | $ | 1.19 | $ | 0.59 | ||||||||||
| Earnings per share – diluted |
$ | 1.58 | $ | 1.09 | $ | 1.52 | $ | 1.18 | $ | 0.59 | ||||||||||
| Cash dividends declared per common share |
$ | 1.65 | $ | 1.23 | $ | 1.20 | $ | 1.15 | $ | 1.33 | ||||||||||
| As of December 31, (in thousands) |
||||||||||||||||||||
| 2010 | 2009 | 2008 | 2007 | 2006 | ||||||||||||||||
| Consolidated Balance Sheet Data: |
||||||||||||||||||||
| Cash and investments |
$ | 45,044 | $ | 45,125 | $ | 31,650 | $ | 26,704 | $ | 20,110 | ||||||||||
| Total assets |
72,628 | 59,886 | 50,847 | 39,024 | 28,722 | |||||||||||||||
| Stockholders’ equity |
60,677 | 47,218 | 38,794 | 29,346 | 22,735 | |||||||||||||||
| Assets Under Management (in millions) |
$ | 12,477 | $ | 10,174 | $ | 7,185 | $ | 7,853 | $ | 5,927 | ||||||||||
19
Table of Contents
| Item 7. | Management’s Discussion and Analysis of Financial Condition and Results of Operations. |
You should read the following discussion and analysis in conjunction with “Selected Consolidated Financial Data” included in this Report, as well as our consolidated financial statements and related notes thereto appearing elsewhere in this Report.
Forward-Looking Statements
Statements in this Report and the Annual Report to Stockholders that are not purely historical facts, including statements about our expected future financial position, results of operations or cash flows, as well as other statements including words such as “anticipate,” “believe,” “plan,” “estimate,” “expect,” “intend,” “should,” “could,” “goal,” “target,” “designed,” “on track,” “comfortable with,” “optimistic” and other similar expressions, constitute forward-looking statements within the meaning of Section 27A of the Securities Act of 1933, as amended, and Section 21E of the Securities Exchange Act of 1934, as amended. Actual results and the timing of some events could differ materially from those projected in or contemplated by the forward-looking statements due to a number of factors, including, without limitation, those set forth below:
| • | our ability to identify and market services that appeal to our customers; |
| • | the significant concentration of our revenues in four of our customers; |
| • | our relationships with investment consulting firms; |
| • | our relationships with current and potential customers; |
| • | our ability to retain qualified personnel; |
| • | our ability to develop and market new asset classes successfully; |
| • | our ability to maintain our fee structure in light of competitive fee pressures; |
| • | competition in the marketplace; |
| • | downturns in financial markets; |
| • | new legislation adversely affecting the financial services industries; |
| • | interest rates; |
| • | changes in our effective tax rate; |
| • | our ability to maintain an effective system of internal controls; and |
| • | other risks as detailed from time to time in our SEC reports. |
Additional factors that could cause our actual results to differ materially from our expectations are discussed under the section entitled “Risk Factors” and elsewhere in this Report. You should not rely unduly on these forward-looking statements, which speak only as of the date of this Report. Other unknown or unpredictable factors may cause actual results to differ materially from those projected by the forward-looking statements. Most of these factors are difficult to anticipate and may be beyond our control. Except as required by law, we are not obligated to publicly release any revisions to these forward-looking statements to reflect events or circumstances occurring after the date of this Report or to reflect the occurrence of unanticipated events.
Overview
We manage investment assets and provide services for our clients through our two subsidiaries, Westwood Management and Westwood Trust. Westwood Management provides investment advisory services to corporate retirement plans, public retirement plans, endowments and foundations, the WHG Funds, other mutual funds, individuals and clients of Westwood Trust. Westwood Trust provides trust and custodial services and participation in common trust funds that it sponsors to institutions and high net worth individuals. Our revenues are generally derived from fees based on a percentage of assets under management and at December 31, 2010 Westwood Management and Westwood Trust collectively managed assets valued at approximately $12.5 billion. We have been providing investment advisory services since 1983 and, according to recognized industry sources including Morningstar, Inc., our principal asset classes have consistently ranked above the median in performance within their peer groups when measured over multi-year periods.
One of the priorities on which we have focused since our spin-off in 2002 is to build a foundation in terms of personnel and infrastructure to support a potentially much larger business. We have also developed products that we believe will be desirable within our target institutional, private wealth and mutual fund markets. The cost of developing new products and the organization as a whole has resulted in our incurring expenses that, in some cases, do not currently have material offsetting revenue. Now we believe the foundation and the products are in place, we are taking these new products to our served markets in the belief that investors will recognize the value in these products and will generate new revenue streams for us.
20
Table of Contents
We began marketing our SMidCap Value product to institutional investment consultants in late 2004. As a result of this targeted marketing effort and strong investment performance, assets in SMidCap Value increased from $78 million at December 31, 2004 and reached its $3 billion asset capacity in 2010. Accordingly, the SMidCap Value asset class was closed to new investors in 2010. The WHG SMidCap mutual fund remains open only to existing investors. In July 2010, we launched the SMidCap Plus+ product, which is managed by the same team that manages the SMidCap product. We believe SMidCap Plus+ will be an attractive investment alternative to clients looking to invest in small to mid size companies. We continue to devote significant marketing efforts to our target markets for our LargeCap Value, SmallCap Value, AllCap Value, Income Opportunity, SMidCap Plus+ and other products.
In November 2010, we completed the acquisition of McCarthy Group Advisors, L.L.C. (McCarthy), a Nebraska limited liability company and registered investment advisor based in Omaha, Nebraska with $1.1 billion of assets under management as of December 31, 2010. McCarthy has numerous long-standing client relationships and a solid reputation within its community. This acquisition enables us to introduce Westwood Trust products and services to a new market, which we believe offers attractive growth opportunities. In addition, we expect to be able to leverage the relationships of our new Omaha office to develop institutional opportunities for Westwood Management. We also gained an additional mutual fund – the McCarthy Multi-Cap Stock Fund, with $68 million in assets under management as of December 31, 2010.
Between December 2005 and April 2007 we launched five mutual funds in the WHG Funds family. As of December 31, 2010, assets in these five funds were $902 million. In addition to the funds’ institutional share class, in December 2007 we launched an A share for WHG LargeCap Value and WHG Income Opportunity in order to target No Transaction Fee (“NTF”) mutual fund supermarket platforms and the broker/dealer marketplace. The WHG Dividend Growth Fund (WHGDX) was launched in February 2011 subsequent to the reorganization of the McCarthy Multi-Cap Stock Fund. Also in January 2011, we filed a registration statement for the WHG SMidCap Plus+ Fund, which we expect to be available later in 2011.
Revenues
We derive our revenues from investment advisory fees, trust fees, and other revenues. Our advisory fees are generated by Westwood Management, which manages client accounts under investment advisory and subadvisory agreements. Advisory fees are calculated based on a percentage of assets under management and are paid in accordance with the terms of the agreements. Westwood Management’s advisory fees are paid quarterly in advance based on assets under management on the last day of the preceding quarter, quarterly in arrears based on assets under management on the last day of the previous quarter, or are based on a daily or monthly analysis of assets under management for the stated period. Westwood Management recognizes revenues as services are rendered. A limited number of our clients have a performance-based fee component in their contract, which generates additional revenues if we outperform a specified index over a specific period of time. We record revenue for performance-based fees at the end of the measurement periods. In 2008, we recognized a performance-based fee for a client in the second quarter and a separate performance-based fee for another client in the fourth quarter. Since most of our advance paying clients’ billing periods coincide with the calendar quarter to which payment relates, the revenue related to those clients is fully recognized within the quarter. Consequently, there is not a significant amount of deferred revenue contained in our financial statements.
Our trust fees are generated by Westwood Trust pursuant to trust or custodial agreements. Trust fees are separately negotiated with each client and are generally based on a percentage of assets under management. Westwood Trust also provides trust services to a small number of clients on a fixed fee basis. Most trust fees are paid quarterly in advance and are recognized as services are rendered. Since billing periods for the majority of Westwood Trust’s advance paying clients coincide with the calendar quarter to which payment relates, related revenue is fully recognized within the quarter and consequently there is not a significant amount of deferred revenue contained in our financial statements.
21
Table of Contents
Our other revenues generally consist of interest and investment income. Although we invest most of our cash in U.S. Treasury securities, we also invest in equity and fixed income instruments and money market funds.
Assets Under Management
Assets under management increased $2.3 billion, or 23%, to $12.5 billion at December 31, 2010 compared to $10.2 billion at December 31, 2009. Quarterly average assets under management increased $2.3 billion, or 27%, to $10.7 billion for 2010 compared with $8.5 billion for 2009.
Assets under management increased $3.0 billion, or 42%, to $10.2 billion at December 31, 2009 compared to $7.2 billion at December 31, 2008. Quarterly average assets under management increased $747 million, or 10%, to $8.5 billion for 2009 compared with $7.7 billion for 2008.
The following table sets forth our assets under management as of December 31, 2010, 2009 and 2008:
| As of December 31, (in millions) |
% Change | |||||||||||||||||||||||
| 2010 | 2009 | 2008 | 2010 vs. 2009 | 2009 vs. 2008 | ||||||||||||||||||||
| Institutional |
$ | 8,359 | $ | 7,599 | $ | 5,374 | 10 | % | 41 | % | ||||||||||||||
| Private Wealth |
3,148 | 2,009 | 1,558 | 57 | 29 | |||||||||||||||||||
| Mutual Funds |
970 | 566 | 253 | 71 | 124 | |||||||||||||||||||
| Total Assets Under Management |
$ | 12,477 | $ | 10,174 | $ | 7,185 | 23 | % | 42 | % | ||||||||||||||
We have modified our assets under management disclosure to represent management’s view of our three main lines of business: institutional, private wealth and mutual funds.
| • | Institutional includes: separate accounts of corporate pension and profit sharing plans, public employee retirement funds, Taft Hartley plans, endowments, foundations and individuals; subadvisory relationships where Westwood Management provides investment management services for funds offered by other financial institutions; and managed account relationships with brokerage firms and other registered investment advisors who offer Westwood Management’s products to their customers. |
| • | Private Wealth includes assets for which Westwood Trust provides trust and custodial services and participation in common trust funds that it sponsors to institutions and high net worth individuals pursuant to trust or agency agreements. Also included are assets acquired in the McCarthy transaction representing institutional and high net worth clients for which Westwood provides investment management and advisory services. |
| • | Mutual Funds includes the WHG Funds, a family of mutual funds for which Westwood Management serves as advisor, and the McCarthy Multi-Cap Stock Fund for which Westwood Management served as the interim advisor as of December 31, 2010. On February 1, 2011, the shareholders of the McCarthy Multi-Cap Stock Fund approved the reorganization of the fund into the WHG Dividend Growth Fund. |
22
Table of Contents
Roll-Forward of Assets Under Management
| Twelve Months Ended December 31,
2010 (in millions) |
||||||||||||||||
| Institutional | Private Wealth | Mutual Funds | Total | |||||||||||||
| Beginning of period assets |
$ | 7,599 | $ | 2,009 | $ | 566 | $ | 10,174 | ||||||||
| Client flows: |
||||||||||||||||
| Inflows/new accounts |
971 | 99 | 372 | 1,442 | ||||||||||||
| Outflows/closed accounts |
(1,518 | ) | (230 | ) | (157 | ) | (1,905 | ) | ||||||||
| Net inflows/(outflows) |
(547 | ) | (131 | ) | 215 | (463 | ) | |||||||||
| Acquisition related |
— | 1,057 | 64 | 1,121 | ||||||||||||
| Market appreciation/(depreciation) |
1,307 | 213 | 125 | 1,645 | ||||||||||||
| Net change |
760 | 1,139 | 404 | 2,303 | ||||||||||||
| End of period assets |
$ | 8,359 | $ | 3,148 | $ | 970 | $ | 12,477 | ||||||||
The increase in assets under management for the twelve months ended December 31, 2010 was primarily due to market appreciation of $1.6 billion, the acquisition of $1.1 billion of assets in the McCarthy transaction and new inflows of $1.4 billion, partially offset by outflows of $1.9 billion. Inflows were driven primarily by additional inflows into the WHG Funds, institutional separate accounts and subadvisory mandates. Outflows were primarily related to rebalancing and some account closings by institutional separate account clients and outflows from subadvisory mandates and the WHG Funds.
| Twelve Months Ended December 31,
2009 (in millions) |
||||||||||||||||
| Institutional | Private Wealth | Mutual Funds | Total | |||||||||||||
| Beginning of period assets |
$ | 5,374 | $ | 1,558 | $ | 253 | $ | 7,185 | ||||||||
| Client flows: |
||||||||||||||||
| Inflows/new accounts |
1,601 | 241 | 299 | 2,141 | ||||||||||||
| Outflows/closed accounts |
(702 | ) | (117 | ) | (128 | ) | (947 | ) | ||||||||
| Net inflows/(outflows) |
899 | 124 | 171 | 1,194 | ||||||||||||
| Acquisition related |
— | — | 52 | 52 | ||||||||||||
| Market appreciation/(depreciation) |
1,326 | 327 | 90 | 1,743 | ||||||||||||
| Net change |
2,225 | 451 | 313 | 2,989 | ||||||||||||
| End of period assets |
$ | 7,599 | $ | 2,009 | $ | 566 | $ | 10,174 | ||||||||
The increase in assets under management for the twelve months ended December 31, 2009 was primarily due to new inflows of $2.1 billion and market appreciation of $1.7 billion, partially offset by outflows of $947 million. Inflows were driven primarily by new institutional separate accounts and subadvisory mandates, additional inflows into the WHG Funds, institutional separate accounts and subadvisory mandates, new private wealth accounts and inflows into existing private wealth accounts. Outflows were primarily related to rebalancing and some account closings by institutional separate account clients and outflows from subadvisory mandates and the WHG Funds.
| Twelve Months Ended December 31,
2008 (in millions) |
||||||||||||||||
| Institutional | Private Wealth | Mutual Funds | Total | |||||||||||||
| Beginning of period assets |
$ | 5,750 | $ | 1,869 | $ | 234 | $ | 7,853 | ||||||||
| Client flows: |
||||||||||||||||
| Inflows/new accounts |
2,084 | 287 | 270 | 2,641 | ||||||||||||
| Outflows/closed accounts |
(393 | ) | (84 | ) | (181 | ) | (658 | ) | ||||||||
| Net inflows/(outflows) |
1,691 | 203 | 89 | 1,983 | ||||||||||||
| Acquisition related |
— | — | — | — | ||||||||||||
| Market appreciation/(depreciation) |
(2,067 | ) | (514 | ) | (70 | ) | (2,651 | ) | ||||||||
| Net change |
(376 | ) | (311 | ) | 19 | (668 | ) | |||||||||
| End of period assets |
$ | 5,374 | $ | 1,558 | $ | 253 | $ | 7,185 | ||||||||
23
Table of Contents
The decrease in assets under management for the twelve months ended December 31, 2008 was primarily due to market depreciation of $2.7 billion and outflows of $658 million, partially offset by inflows of $2.6 billion. Inflows were driven primarily by new subadvisory mandates and institutional separate accounts, additional inflows into existing subadvisory mandates, institutional separate accounts and the WHG Funds, and new private wealth accounts. Outflows were primarily related to rebalancing by institutional separate account clients and outflows from subadvisory mandates and the WHG Funds.
Results of Operations
The following table and discussion of our results of operations is based upon data derived from our consolidated statements of income contained in our consolidated financial statements and should be read in conjunction with these statements, which are included elsewhere in this Report.
| Years ended
December 31, (in thousands) |
% Change | |||||||||||||||||||
| 2010 | 2009 | 2008 | 2010 vs. 2009 | 2009 vs. 2008 | ||||||||||||||||
| Revenues |
||||||||||||||||||||
| Advisory fees |
||||||||||||||||||||
| Asset-based |
$ | 42,153 | $ | 31,794 | $ | 26,966 | 33 | % | 18 | % | ||||||||||
| Performance-based |
— | — | 8,725 | — | (100 | ) | ||||||||||||||
| Trust fees |
12,051 | 10,304 | 11,018 | 17 | (6 | ) | ||||||||||||||
| Other revenues |
1,109 | 455 | (253 | ) | 144 | 280 | ||||||||||||||
| Total revenues |
55,313 | 42,553 | 46,456 | 30 | (8 | ) | ||||||||||||||
| Expenses |
||||||||||||||||||||
| Employee compensation and benefits |
29,001 | 23,730 | 23,209 | 22 | 2 | |||||||||||||||
| Sales and marketing |
823 | 576 | 803 | 43 | (28 | ) | ||||||||||||||
| WHG mutual funds |
662 | 600 | 384 | 10 | 56 | |||||||||||||||
| Information technology |
1,351 | 1,221 | 1,114 | 11 | 10 | |||||||||||||||
| Professional services |
2,941 | 1,531 | 1,749 | 92 | (12 | ) | ||||||||||||||
| General and administrative |
2,814 | 2,577 | 2,662 | 9 | (3 | ) | ||||||||||||||
| Total expenses |
37,592 | 30,235 | 29,921 | 24 | 1 | |||||||||||||||
| Income before income taxes |
17,721 | 12,318 | 16,535 | 44 | (26 | ) | ||||||||||||||
| Provision for income taxes |
6,441 | 4,423 | 5,992 | 46 | (26 | ) | ||||||||||||||
| Net income |
$ | 11,280 | $ | 7,895 | $ | 10,543 | 43 | % | (25 | )% | ||||||||||
Year Ended December 31, 2010 Compared to Year Ended December 31, 2009
Total Revenue. In 2010 our total revenues increased by 30% to $55.3 million compared with $42.6 million in 2009. Asset-based advisory fees increased by 33% to $42.2 million in 2010 from $31.8 million in 2009 due to higher average assets under management primarily due to market appreciation of assets. We are eligible to earn a performance fee in 2011 dependent upon out-performance in 2011, subject to an under-performance carry-forward from 2010. 2010 Trust fees increased by 17% to $12.1 million from $10.3 million in 2009 due to higher average assets under management primarily due to market appreciation of assets. Other revenues, which generally consist of interest and investment income, increased by 144% to $1.1 million in 2010 compared with $455,000 in 2009 primarily due to a $596,000 increase in realized gains and a $106,000 increase in net unrealized gains. Partially offsetting these increases was a decrease of $67,000 in interest income.
24
Table of Contents
Employee Compensation and Benefits. Employee compensation and benefits, which generally consist of salaries, incentive compensation, equity-based compensation expense and benefits, increased by 22% to $29.0 million compared with $23.7 million in 2009. This increase was primarily due to increases of $2.6 million in incentive compensation due to increased pre-tax income, $926,000 in performance-based restricted stock expense from an award granted in April 2010 that included additional shares granted at a higher market price compared to prior grants, $778,000 in additional salary expense due to salary increases for certain employees and increased headcount, $677,000 in restricted stock expense from awards granted in February 2010 at a higher market price than previous grants and $215,000 in higher 401k matching and profit sharing expense due to increased compensation. We had 77 full-time employees as of December 31, 2010 compared to 64 at December 31, 2009.
Sales and Marketing. Sales and marketing costs consist of expenses associated with our marketing efforts, including travel and entertainment, direct marketing, and advertising costs. Sales and marketing costs increased by 43% to $823,000 in 2010 compared with $576,000 in 2009. The increase is primarily the result of increased travel related to European marketing tours with subadvisory partner Pictet & Cie and increased direct marketing expenses.
WHG Mutual Funds. WHG Mutual Funds expenses generally consist of costs associated with our marketing, distribution, administration and acquisition efforts related to the WHG Funds. WHG Mutual Funds expenses increased 10% to $662,000 in 2010 compared with $600,000 in 2009. This increase is primarily due to an increase of $133,000 in expense related to recording to fair value the deferred acquisition liability from a fund acquisition we made in 2009 and an increase of $86,000 in shareholder servicing fees due to higher fund assets. Partially offsetting these increases was a net decrease in professional and legal fees due to the acquisition of the Philadelphia Fund and its reorganization into the WHG LargeCap Value Fund in 2009. In 2010 we incurred costs related to the reorganization of the McCarthy Multi-Cap Stock Fund, which was acquired in November 2010, into the WHG Dividend Growth Fund.
Information Technology. Information technology expenses are generally costs associated with proprietary investment research tools, computing hardware, software licenses, maintenance and support, telecommunications and other related costs. Information technology expense increased by 11% to $1.4 million in 2010 compared with $1.2 million in 2009. The increase is primarily due to increases of $94,000 in software maintenance and licenses and $37,000 for research tools. A $35,000 decrease in IT environment support costs partially offset these increases.
Professional Services. Professional services expenses generally consist of audit, external subadvisor expense, legal and other professional fees. Professional services expense increased by 92% to $2.9 million in 2010 compared with $1.5 million in 2009. The increase is primarily due to a $600,000 increase in advisory fees paid to external subadvisors due to growth common trust funds sponsored by Westwood Trust being temporarily invested in passive index funds in 2009, an increase of $504,000 in other professional fees related to the McCarthy acquisition completed in 2010, other growth initiatives undertaken in 2010 and an increase of $255,000 in legal fees primarily related to the McCarthy acquisition and other legal fees.
General and Administrative. General and administrative expenses generally consist of costs associated with the lease of our office space, insurance, amortization of intangible assets, office supplies, custody expense, investor relations, charitable contributions and other miscellaneous expenses. General and administrative expenses increased by 9% to $2.8 million in 2010 compared with $2.6 million in 2009. The increase is primarily due to increases of $142,000 in amortization of intangible assets acquired in acquisitions made in 2009 and 2010, $67,000 in training and seminars expense and $46,000 in research subscriptions. Partially offsetting these increases were decreases in director fee accruals and insurance expense.
Provision for Income Taxes. Provision for income taxes increased by 46% to $6.4 million in 2010 compared with $4.4 million in 2009 primarily due to higher income before taxes. The increase in the effective tax rate from 35.9% in 2009 to 36.3% in 2010 was primarily due to more taxable income in the higher federal income tax bracket.
Year Ended December 31, 2009 Compared to Year Ended December 31, 2008
Total Revenue. Our total revenues decreased by 8% to $42.6 million in 2009 compared with $46.5 million in 2008. Asset-based advisory fees increased by 18% to $31.8 million in 2009 from $27.0 million in 2008 due to higher average assets under management due to market appreciation of assets and net inflows from new clients. Performance-based advisory fees decreased to zero from $8.7 million in 2008 as no performance fees were earned in 2009. Trust fees decreased by 6% to $10.3 million in 2009 from $11.0 million in 2008 due to lower average beginning-of-quarter assets under management in 2009. The vast majority of Trust fees is billed in advance based on assets at the end of the previous quarter and were negatively impacted by sharp market declines in the fourth quarter of 2008 and the first quarter of 2009. Other revenues, which generally consist of interest and investment income, increased by 280% to $455,000 in 2009 compared with $(253,000) in 2008. Other revenues increased primarily due to a $1.6 million increase in net unrealized gains. Partially offsetting this increase were an increase of $456,000 in net realized losses and a $399,000 decrease in interest and dividend income.
25
Table of Contents
Employee Compensation and Benefits. Employee compensation and benefits increased by 2% to $23.7 million compared with $23.2 million in 2008. This increase was primarily due to an increase of $931,000 in restricted stock expense due to additional restricted stock grants in February 2009 as well as the higher market price at the time the shares were granted compared to prior grants, and an increase of $526,000 in salary expense due to salary increases for certain employees and increased headcount. These increases were partially offset by decreases of $845,000 in incentive compensation expense and $203,000 in profit sharing contributions, both due to lower pretax income. We had 64 full-time employees as of December 31, 2009 compared to 63 at December 31, 2008.
Sales and Marketing. Sales and marketing costs decreased by 28% to $576,000 in 2009 compared with $803,000 in 2008. The decrease was primarily the result of decreases in travel and entertainment costs of $135,000 and in direct marketing expense of $69,000.
WHG Mutual Funds. WHG mutual funds expenses increased 56% to $600,000 in 2009 compared with $384,000 in 2008. This increase was primarily due to a $164,000 increase in legal fees and a $40,000 increase in direct marketing expense. Legal fees were related to the reorganization of the Philadelphia Fund into the WHG LargeCap Value Fund. On November 16, 2009, we acquired the business and substantially all assets of Baxter Financial Corporation related to its management of the Philadelphia Fund. In connection with this acquisition, the Philadelphia Fund was reorganized into the WHG LargeCap Value Fund and we recorded total assets of $2.7 million and deferred liabilities of $1.7 million. A financial consideration was paid on the closing date and we are obligated to pay deferred payments twelve and twenty-four months from the transaction closing date.
Information Technology. Information technology expense increased by 10% to $1.2 million in 2009 compared with $1.1 million in 2008 primarily due to increases of $48,000 in IT environment support costs, $43,000 in software maintenance and licenses and $43,000 in data fees.
Professional Services. Professional services expense decreased by 12% to $1.5 million in 2009 compared with $1.7 million in 2008. The decrease was primarily due to a $354,000 decrease in advisory fees paid to external subadvisors due to growth common trust funds sponsored by Westwood Trust being temporarily invested in passive index funds. Increases of $73,000 in legal expense and $56,000 in other professional fees partially offset the decrease.
General and Administrative. General and administrative expenses decreased by 3% to $2.6 million in 2009 compared with $2.7 million in 2008. The decrease was primarily due to declines of $82,000 in miscellaneous expenses, $43,000 in occupancy expense and $40,000 in custody expense partially offset by an increase of $121,000 in insurance expense for higher professional liability coverage due to the requirements of certain large new clients.
Provision for Income Taxes. Provision for income taxes decreased by 26% to $4.4 million in 2009 compared with $6.0 million in 2008 primarily due to lower income before taxes. The effective tax rate was 35.9% in 2009 compared to 36.2% in 2008.
Supplemental Financial Information
As supplemental information, we are providing non-generally accepted accounting principles (“non-GAAP”) performance measures that we refer to as economic earnings and economic expenses. We provide these measures in addition to, but not as a substitute for, net income and total expenses, which are reported on a U.S. generally accepted accounting principles (“GAAP”) basis. Both our Management and Board of Directors review economic earnings and economic expenses to evaluate our ongoing performance, allocate resources and review dividend policy. We believe that these non-GAAP performance measures, while not substitutes for GAAP net income and total expenses, are useful for both management and investors to evaluate our underlying operating and financial performance and our available resources. We do not advocate that investors consider these non-GAAP measures without considering financial information prepared in accordance with GAAP.
26
Table of Contents
In calculating economic earnings, we add to net income the non-cash expense associated with equity-based compensation awards of restricted stock and stock options, amortization of intangible assets and the deferred taxes related to the tax-basis amortization of goodwill. We define economic expenses as total expenses less non-cash equity-based compensation expense and amortization of intangible assets. Although depreciation on property and equipment is a non-cash expense, we do not add it back when calculating economic earnings or deduct it when calculating economic expenses because depreciation charges represent a decline in the value of the related assets that will ultimately require replacement.
For the year ended December 31, 2010, our economic earnings increased by 33% to $20.8 million compared with $15.6 million for the year ended December 31, 2009, primarily due to a 30% increase in total revenues.
The following table provides a reconciliation of net income to economic earnings and total expenses to economic expenses for the years presented:
| (in thousands) | % Change | |||||||||||||||||||
| 2010 | 2009 | 2008 | 2010 vs. 2009 | 2009 vs. 2008 | ||||||||||||||||
| Net Income |
$ | 11,280 | $ | 7,895 | $ | 10,543 | 43 | % | (25 | )% | ||||||||||
| Add: Restricted stock expense |
9,269 | 7,666 | 6,735 | 21 | 14 | |||||||||||||||
| Add: Intangible amortization |
155 | 13 | — | 1,092 | — | |||||||||||||||
| Add: Tax benefit from goodwill amortization |
59 | 5 | — | 1,080 | — | |||||||||||||||
| Economic earnings |
$ | 20,763 | $ | 15,579 | $ | 17,278 | 33 | (10 | ) | |||||||||||
| Total expenses |
$ | 37,592 | $ | 30,235 | $ | 29,921 | 24 | 1 | ||||||||||||
| Less: Restricted stock expense |
(9,269 | ) | (7,666 | ) | (6,735 | ) | 21 | 14 | ||||||||||||
| Less: Intangible amortization |
(155 | ) | (13 | ) | — | 1,092 | — | |||||||||||||
| Economic expenses |
$ | 28,168 | $ | 22,556 | $ | 23,186 | 25 | % | (3 | )% | ||||||||||
Liquidity and Capital Resources
Historically we have funded our operations and cash requirements with cash generated from operating activities. As of December 31, 2010, we had no long-term debt. The changes in net cash provided by operating activities generally reflect the changes in earnings plus the effect of non-cash items and changes in working capital. Changes in working capital, especially accounts receivable and accounts payable, are generally the result of timing differences between collection of fees billed and payment of operating expenses.
During 2010, cash flow provided by operating activities, principally our investment advisory business, was $18.3 million compared to cash provided by operations of $10.6 million during 2009 and cash used in operations of $6.3 million during 2008. The increase of $8.4 million was primarily due to increased net income, reduced net purchases of U.S. Treasury Bills and an increase in accounts and compensation payables, partially offset by higher accounts receivable. The increase of $16.9 million from 2008 to 2009 was primarily due to reduced net purchases of U.S. Treasury Bills and lower accounts receivable. At December 31, 2010 and 2009, we had working capital of $44.1 million and $43.0 million, respectively.
Cash flow used in investing activities during 2010 was $5.7 million and was primarily related to cash paid to acquire businesses. Cash flow used in investing activities during 2009 of $1.7 million was primarily related to net sales of available-for-sale investments and cash paid to acquire a business. Cash flow used in investing activities during 2008 of $13.1 million was primarily due to the net sales of investments, partially offset by the purchase of property and equipment.
27
Table of Contents
Cash used in financing activities of $13.8 million, $9.5 million and $7.9 million during 2010, 2009 and 2008, respectively, was primarily due to the payment of cash dividends and the purchase of treasury stock, partially offset by excess tax benefits related to vested restricted shares and proceeds from the issuance of stock due to option exercises.
We had cash and investments of $45.0 million and $45.1 million at December 31, 2010 and December 31, 2009, respectively. As required by the Texas Finance Code, Westwood Trust maintains current assets in an amount equal to the required minimum restricted capital of $1.0 million, which is included in Investments in the accompanying consolidated balance sheets. We had no liabilities for borrowed money at December 31, 2010 or December 31, 2009, and our accounts payable were paid in the ordinary course of business for each of the periods then ended.
Our future liquidity and capital requirements will depend upon numerous factors, including our results of operations, the timing and magnitude of capital expenditures or strategic initiatives, our dividend policy and other business and risk factors described in this Form 10-K. We believe that current cash and short-term investment balances and cash generated from operations will be sufficient to meet the operating and capital requirements of our ordinary business operations through at least the next twelve months. However, there can be no assurance that we will not require additional financing within this time frame. The failure to raise needed capital on attractive terms, if at all, could have a material adverse effect on our business, financial condition and results of operations.
Contractual Obligations
The following table summarizes our contractual obligations as of December 31, 2010 (in thousands).
| Payments due in: | ||||||||||||||||||||
| Contractual Obligations |
Total | Less than 1 year |
1-3 years |
4-5 years |
After 5 years |
|||||||||||||||
| Operating lease obligations |
$ | 9,524 | $ | 403 | $ | 2,004 | $ | 1,798 | $ | 5,319 | ||||||||||
| Deferred acquisition liabilities |
899 | 899 | — | — | — | |||||||||||||||
| Total |
$ | 10,423 | $ | 1,302 | $ | 2,004 | $ | 1,798 | $ | 5,319 | ||||||||||
Accounting Developments
In June 2009, the Financial Accounting Standards Board (“FASB”) issued guidance under Accounting Standards Codification (“ASC”) No. 810, Consolidation (ASC 810). This new guidance established general standards of accounting and disclosures for interests in variable interest entities (“VIE”) and requires entities to review their involvement with VIEs and potential VIEs to determine the effect on their financial statements and related disclosures. This standard changes the manner in which an entity determines whether it is the primary beneficiary of a VIE, whether that VIE should be consolidated and requires additional disclosures. In February 2010, the FASB issued further guidance under ASC 810 indefinitely deferring a requirement to perform a qualitative analysis to determine whether an entity’s variable interests give it a controlling financial interest in a VIE. This deferral generally applies to the reporting entities interests in entities that have the attributes of an investment company or that apply the specialized accounting guidance for investment companies. We determined that we qualified for the deferral under this guidance.
Critical Accounting Policies and Estimates
The preparation of our consolidated financial statements in conformity with accounting principles generally accepted in the United States requires us to make estimates and assumptions that affect the reported amounts of assets and liabilities, disclosure of contingent losses and liabilities at the date of the consolidated financial statements and the reported amounts of revenues and expenses during the reporting period. In applying accounting principles, we must often make individual estimates and assumptions regarding expected outcomes or uncertainties. Our estimates, judgments and assumptions are continually evaluated based on available information and experience. Because of the use of estimates inherent in the financial reporting process, actual results could differ from those estimates. We believe the following are areas where the degree of judgment and complexity in determining amounts recorded in our consolidated financial statements make the accounting policies critical. Historically, actual results have not differed materially from estimates.
28
Table of Contents
Goodwill
During the third quarters of 2010, 2009 and 2008, we completed our annual impairment assessment as required by ASC 350 “Goodwill and Other Intangible Assets”. No impairment losses were required. We perform our annual impairment assessment as of July 1 and would reassess if circumstances indicated a potential impairment between our annual assessment dates. We assess the fair value of our business units with goodwill using a market multiple approach. We reevaluated our assessment at the end of 2010 and determined that no events occurred in the last half of 2010 that indicated that these assets should be retested for impairment.
Intangible Assets
Our intangible assets represent the acquisition date fair value of the intangible assets acquired and are reflected net of amortization. The values of these assets are comprised mostly of customer lists but also include valuations of trade names and non-compete agreements. In valuing these assets, we made significant estimates regarding the useful life, growth rates and potential attrition of the assets acquired. We periodically review our intangible assets for events or circumstances that would indicate impairment and if their carrying value exceeded fair value, we would record an impairment to remove the excess.
Restricted Stock
We have granted restricted stock to employees, non-employee directors and a non-employee consultant. We calculate compensation cost for restricted stock grants by using the fair market value of our common stock at the date of grant, the number of shares issued and an estimate of shares that will not vest due to forfeitures. This compensation cost is amortized on a straight-line basis over the applicable vesting period. The estimate of shares that will not vest due to forfeitures is based on our historical forfeiture rate and our expectation of potential forfeitures, which is dependent upon our judgment. If actual experience differs significantly from these estimates, stock based compensation expense and our results of operations could be materially affected. If forfeitures of restricted stock do not occur or are significantly less than our estimation, we would record as much as $209,000 of compensation cost in addition to what we currently expect to expense over the next two years.
Accounting for Income Taxes
Our provision for income taxes reflects the statutory tax obligations of the jurisdictions in which we operate. Significant judgment and complex calculations are used in determining our tax liability and in evaluating our tax positions. We adjust our income tax provision in the period in which we determine that actual outcomes will likely be different from our estimates. Changes in tax laws may result in a change to our tax position and effective tax rate. We classify any interest or penalties related to income taxes as a component of income tax expense.
Deferred income taxes reflect the expected future tax consequences of temporary differences between the financial statement and tax bases of our assets and liabilities as measured at enacted income tax rates. Our deferred taxes relate principally to stock-based compensation expense, which is deductible for tax purposes at the time restricted stock vests and stock options are exercised.
Valuation of Deferred Acquisition Liabilities assumed in Baxter Financial Corporation Acquisition
On November 16, 2009, we acquired the business and substantially all of the related assets of Baxter Financial Corporation related to its management of the Philadelphia Fund. In connection with this acquisition, the Philadelphia Fund was reorganized into the WHG LargeCap Value Fund. Related to this acquisition, we recorded total assets of $2.7 million and deferred liabilities of $1.7 million. We paid consideration on the closing date and on the due date of the first deferred liability in November 2010 and are obligated to pay a deferred payment twenty-four months from the transaction closing date. With the assistance of a third party valuation expert, we made assumptions to determine the values of acquired assets and the amount of the deferred liabilities we expect to pay. The settlement amount of the remaining liability could be materially different from that recorded on the acquisition date and adjusted to fair value at December 31, 2010, based on the value of assets in the acquired customer accounts as of the deferred payment dates. Any such difference would be recorded in earnings in the periods leading up to the payments.
29
Table of Contents
Significant Accounting Policies
Our significant accounting policies are summarized below.
Revenue Recognition
Investment advisory and trust fees are recognized in the period the services are provided. These fees are determined in accordance with contracts between our subsidiaries and their clients and are generally based on a percentage of assets under management. Performance-based fees may pay us an additional fee if we outperform a specified index over a specific period of time. We record revenue for performance-based fees at the end of the measurement period when the fees have been fully earned.
Accounting for Investments
We have designated our investments, other than shares of Teton Advisors, Inc. (“Teton shares”), as “trading” securities, which are recorded at market value with the related unrealized gains and losses reflected in “Other revenues” in the consolidated statements of income. Our “trading” securities, primarily U.S. Government and Government agency obligations, money market holdings and mutual fund and common trust fund shares, are valued based upon quoted market prices and, with respect to funds, the net asset value of the shares held as reported by the fund. We have designated our investments in the Teton shares as “available for sale.” The Teton shares are carried at quoted market value with a 25% discount for lack of marketability. Unrealized gains and losses on the Teton shares are recorded through other comprehensive income. Dividends and interest on all of our investments are accrued as earned.
| Item 7A. | Quantitative and Qualitative Disclosures about Market Risk. |
We invest our corporate capital in various financial instruments such as United States treasury bills, equity mutual funds and United States government agency obligations, which entail certain inherent market risks. We do not currently participate in any hedging activities, nor do we currently utilize any derivative financial instruments. The following information describes the key aspects of certain financial instruments that have market risks.
Interest Rates and Securities Markets
Our cash equivalents and other investment instruments are exposed to financial market risk due to fluctuations in interest rates, which may affect our interest income. These instruments are not entered into for trading purposes. We do not expect our interest income to be significantly affected by a sudden change in market interest rates.
The value of our assets under management is affected by changes in interest rates and fluctuations in securities markets. Since we derive a substantial portion of our revenues from investment advisory and trust fees based on the value of assets under management, our revenues may be adversely affected by changing interest rates or a decline in the prices of securities generally.
| Item 8. | Financial Statements and Supplementary Data. |
The independent registered public accounting firm’s reports and financial statements listed in the accompanying index are included in Item 15 of this Report. See Index to Financial Statements on page F-1.
| Item 9. | Changes in and Disagreements with Accountants on Accounting and Financial Disclosure. |
None.
30
Table of Contents
| Item 9A. | Controls and Procedures. |
Our disclosure controls and procedures are designed to ensure that information we are required to disclose in the reports we file or submit under the Securities Exchange Act of 1934, as amended, is recorded, processed, summarized and reported within the time periods specified in the Securities and Exchange Commission’s rules and forms. An evaluation was performed under the supervision and with the participation of our management, including our Chief Executive Officer and Chief Financial Officer, of the effectiveness of the design and operation of our disclosure controls and procedures (as defined in Rule 13a-15(e) under the Securities Exchange Act of 1934) as of the end of the period covered by this annual report. Based on this evaluation, our management, including our Chief Executive Officer and our Chief Financial Officer, concluded that, as of December 31, 2010, our disclosure controls and procedures were effective to ensure that information required to be disclosed by us in the reports we file or submit under the Securities Exchange Act of 1934, as amended, is recorded, processed, summarized and reported within the time periods specified in the Securities and Exchange Commission’s rules and forms and that such information is accumulated and communicated to management, including the Company’s Chief Executive Officer and Chief Financial Officer, as appropriate to allow timely decisions regarding required disclosure.
Please refer to Westwood Holdings Group, Inc.’s Management Assessment of Internal Control over Financial Reporting on page F-4 of this Report.
Our independent registered public accounting firm has issued an audit report on our internal control over financial reporting. This report can be found on page F-3.
For the fiscal year ended December 31, 2010, there were no changes in our internal control over financial reporting that materially affected, or are reasonably likely to materially affect, our internal control over financial reporting.
PART III
| Item 10. | Directors and Executive Officers of the Company. |
The information required by this item is or will be set forth in the definitive proxy statement relating to the 2010 Annual Meeting of Stockholders of Westwood Holdings Group, Inc., which is to be filed with the Securities and Exchange Commission pursuant to Regulation 14A under the Securities Exchange Act of 1934, as amended (the “Proxy Statement”). The Proxy Statement relates to a meeting of stockholders involving the election of directors and the portions therefrom required to be set forth in this Form 10-K by this item are incorporated herein by reference pursuant to General Instruction G(3) to Form 10-K.
| Item 11. | Executive Compensation. |
The information required by this item is or will be set forth in the Proxy Statement. The Proxy Statement relates to a meeting of stockholders involving the election of directors and the portions therefrom required to be set forth in this Form 10-K by this item are incorporated herein by reference pursuant to General Instruction G(3) to Form 10-K.
| Item 12. | Security Ownership of Certain Beneficial Owners and Management and Related Stockholder Matters. |
The information required by this item is or will be set forth in the Proxy Statement. The Proxy Statement relates to a meeting of stockholders involving the election of directors and the portions therefrom required to be set forth in this Form 10-K by this item are incorporated herein by reference pursuant to General Instruction G(3) to Form 10-K.
| Item 13. | Certain Relationships and Related Transactions, and Director Independence. |
The information required by this item is or will be set forth in the Proxy Statement. The Proxy Statement relates to a meeting of stockholders involving the election of directors and the portions therefrom required to be set forth in this Form 10-K by this item are incorporated herein by reference pursuant to General Instruction G(3) to Form 10-K.
31
Table of Contents
| Item 14. | Principal Accountant Fees and Services. |
The information required by this item is or will be set forth in the Proxy Statement. The Proxy Statement relates to a meeting of stockholders involving the election of directors and the portions therefrom required to be set forth in this Form 10-K by this item are incorporated herein by reference pursuant to General Instruction G(3) to Form 10-K.
PART IV
| Item 15. | Exhibits and Financial Statement Schedules. |
Financial Statement Schedules
The financial statements included in this Report are listed in the Index to Financial Statements on page F-1 of this Report. Schedules for which provision is made in the applicable accounting regulations of the Securities and Exchange Commission are either not required under the related instructions or are inapplicable.
Exhibits
The exhibits required to be furnished pursuant to Item 15 are listed in the Exhibit Index filed herewith, which Exhibit Index is incorporated herein by reference.
32
Table of Contents
POWER OF ATTORNEY
KNOW ALL MEN BY THESE PRESENTS that each of Westwood Holdings Group, Inc., a Delaware corporation, and the undersigned directors and officers of Westwood Holdings Group, Inc. hereby constitutes and appoints Brian O. Casey and William R. Hardcastle, Jr., or any one of them, its, his or her true and lawful attorney-in-fact and agent, for it, him or her and in its, his or her name, place and stead, in any and all capacities, with full power to act alone, to sign any and all amendments to this Report, and to file each such amendment to the Report, with all exhibits thereto, and any and all other documents in connection therewith, with the Securities and Exchange Commission, hereby granting unto said attorney-in-fact and agent full power and authority to do and perform any and all acts and things requisite and necessary to be done in and about the premises as fully to all intents and purposes as it, he or she might or could do in person, hereby ratifying and confirming all that said attorney-in-fact and agent may lawfully do or cause to be done by virtue hereof.
SIGNATURES
Pursuant to the requirements of Section 13 or 15(d) of the Securities Exchange Act of 1934, the registrant has duly caused this report to be signed on its behalf by the undersigned, thereunto duly authorized.
| WESTWOOD HOLDINGS GROUP, INC. | ||
| By: | /S/ BRIAN O. CASEY | |
| Brian O. Casey | ||
| President & Chief Executive Officer | ||
Dated: February 25, 2011
Pursuant to the requirements of the Securities Exchange Act of 1934, this report has been signed below by the following persons on behalf of the registrant and in the capacities and on the dates indicated.
| Signatures |
Title | |||
| /S/ BRIAN O. CASEY |
President & Chief Executive Officer (Principal Executive Officer) | |||
| Brian O. Casey | ||||
| /S/ WILLIAM R. HARDCASTLE, JR. |
Chief Financial Officer (Principal Financial Officer) | |||
| William R. Hardcastle, Jr. | ||||
| /S/ CRAIG WHITTEN |
Controller (Principal Accounting Officer) | |||
| Craig Whitten | ||||
| /S/ SUSAN M. BYRNE |
Chairman and Chief Investment Officer | |||
| Susan M. Byrne | ||||
| /S/ TOM C. DAVIS |
Director | |||
| Tom C. Davis | ||||
33
Table of Contents
| /S/ RICHARD M. FRANK |
Director | |||
| Richard M. Frank | ||||
| /S/ ROBERT D. MCTEER |
Director | |||
| Robert D. McTeer |
||||
| /S/ JON L. MOSLE, JR. |
Director | |||
| Jon L. Mosle, Jr. | ||||
| /S/ GEOFFREY R. NORMAN |
Director | |||
| Geoffrey R. Norman |
||||
| /S/ MARTIN J. WEILAND |
Director | |||
| Martin J. Weiland | ||||
| /S/ RAYMOND E. WOOLDRIDGE |
Director | |||
| Raymond E. Wooldridge | ||||
34
Table of Contents
| Page | ||||
| Audited Consolidated Financial Statements of Westwood Holdings Group, Inc. |
||||
| F-2 | ||||
| F-3 | ||||
| F-4 | ||||
| Consolidated Balance Sheets as of December 31, 2010 and 2009 |
F-5 | |||
| Consolidated Statements of Income for the years ended December 31, 2010, 2009 and 2008 |
F-6 | |||
| Consolidated Statements of Stockholders’ Equity for the years ended December 31, 2010, 2009 and 2008 |
F-7 | |||
| Consolidated Statements of Cash Flows for the years ended December 31, 2010, 2009 and 2008 |
F-8 | |||
| F-9 | ||||
F-1
Table of Contents
Report of Independent Registered Public Accounting Firm
Board of Directors and Shareholders
Westwood Holdings Group, Inc.
We have audited the accompanying consolidated balance sheets of Westwood Holdings Group, Inc. (a Delaware corporation) and subsidiaries (the “Company”) as of December 31, 2010 and December 31, 2009, and the related consolidated statements of income, stockholders’ equity, and cash flows each of the three years in the period ended December 31, 2010. These financial statements are the responsibility of the Company’s management. Our responsibility is to express an opinion on these financial statements based on our audits.
We conducted our audits in accordance with the standards of the Public Company Accounting Oversight Board (United States). Those standards require that we plan and perform the audit to obtain reasonable assurance about whether the financial statements are free of material misstatement. An audit includes examining, on a test basis, evidence supporting the amounts and disclosures in the financial statements. An audit also includes assessing the accounting principles used and significant estimates made by management, as well as evaluating the overall financial statement presentation. We believe that our audits provide a reasonable basis for our opinion.
In our opinion, the consolidated financial statements referred to above present fairly, in all material respects, the financial position of Westwood Holdings Group, Inc. and subsidiaries as of December 31, 2010 and 2009, and the results of their operations and their cash flows for each of the three years in the period ended December 31, 2010, in conformity with accounting principles generally accepted in the United States of America.
We also have audited, in accordance with the standards of the Public Company Accounting Oversight Board (United States), the Company’s internal control over financial reporting as of December 31, 2010, based on criteria established in Internal Control-Integrated Framework issued by the Committee of Sponsoring Organizations of the Treadway Commission (COSO) and our report dated February 25, 2011 expressed an unqualified opinion on the Company’s internal control over financial reporting.
/s/ Grant Thornton LLP
Dallas, Texas
February 25, 2011
F-2
Table of Contents
Report of Independent Registered Public Accounting Firm
Board of Directors and Shareholders
Westwood Holdings Group, Inc.
We have audited Westwood Holdings Group, Inc. (a Delaware corporation) and subsidiaries’ (the “Company”) internal control over financial reporting as of December 31, 2010, based on criteria established in Internal Control-Integrated Framework issued by the Committee of Sponsoring Organizations of the Treadway Commission (COSO). The Company’s management is responsible for maintaining effective internal control over financial reporting and for its assessment of the effectiveness of internal control over financial reporting, included in the accompanying Report of Westwood Holdings Group, Inc.’s Management Assessment of Internal Control over Financial Reporting. Our responsibility is to express an opinion on the Company’s internal control over financial reporting based on our audit. Our audit of the Company, and opinion on, the Company’s internal control over financial reporting does not include internal control over financial reporting from the asset purchase agreement with McCarthy Group Advisors, LLC (“McCarthy”), whose financial statements reflect total assets and revenues constituting 18 percent and 1 percent, respectively, of the related consolidated financial statement amounts as of and for the year ended December 31, 2010. As indicated in Management’s Report, McCarthy was acquired on November 18, 2010 and therefore, management’s assertion on the effectiveness of the Company’s internal control over financial reporting excluded internal control over financial reporting of McCarthy.
We conducted our audit in accordance with the standards of the Public Company Accounting Oversight Board (United States). Those standards require that we plan and perform the audit to obtain reasonable assurance about whether effective internal control over financial reporting was maintained in all material respects. Our audit included obtaining an understanding of internal control over financial reporting, assessing the risk that a material weakness exists, testing and evaluating the design and operating effectiveness of internal control based on the assessed risk, and performing such other procedures as we considered necessary in the circumstances. We believe that our audit provides a reasonable basis for our opinion.
A company’s internal control over financial reporting is a process designed to provide reasonable assurance regarding the reliability of financial reporting and the preparation of financial statements for external purposes in accordance with generally accepted accounting principles. A company’s internal control over financial reporting includes those policies and procedures that (1) pertain to the maintenance of records that, in reasonable detail, accurately and fairly reflect the transactions and dispositions of the assets of the company; (2) provide reasonable assurance that transactions are recorded as necessary to permit preparation of financial statements in accordance with generally accepted accounting principles, and that receipts and expenditures of the company are being made only in accordance with authorizations of management and directors of the company; and (3) provide reasonable assurance regarding prevention or timely detection of unauthorized acquisition, use, or disposition of the company’s assets that could have a material effect on the financial statements.
Because of its inherent limitations, internal control over financial reporting may not prevent or detect misstatements. Also, projections of any evaluation of effectiveness to future periods are subject to the risk that controls may become inadequate because of changes in conditions, or that the degree of compliance with the policies or procedures may deteriorate.
In our opinion, the Company maintained, in all material respects, effective internal control over financial reporting as of December 31, 2010, based on criteria established in Internal Control-Integrated Framework issued by COSO.
We also have audited, in accordance with the standards of the Public Company Accounting Oversight Board (United States), the consolidated balance sheet of the Company as of December 31, 2010, and the related consolidated statements of income, stockholders’ equity and cash flows for the year then ended, and our report dated February 25, 2011 expressed an unqualified opinion on those financial statements.
/s/ Grant Thornton LLP
Dallas, Texas
February 25, 2011
F-3
Table of Contents
REPORT OF WESTWOOD HOLDINGS GROUP, INC.’S MANAGEMENT ASSESSMENT OF INTERNAL CONTROL OVER FINANCIAL REPORTING
To the Board of Directors and Stockholders of
Westwood Holdings Group, Inc.:
The management of Westwood Holdings Group, Inc. (“Westwood”) is responsible for establishing and maintaining adequate internal control over financial reporting (as defined in Exchange Act Rules 13a-15(f) and 15d-15(f)). Westwood’s internal control system was designed to provide reasonable assurance to the company’s management and board of directors regarding the preparation and fair presentation of published financial statements.
All internal control systems, no matter how well designed, contain inherent limitations. Therefore, even those systems determined to be effective can only provide reasonable assurance with respect to financial statement preparation and presentation. Also, projections of any evaluation of the effectiveness of the internal control over financial reporting to future periods are subject to the risk that the controls may become inadequate because of changes in conditions, or that the degree of compliance with the policies or procedures may deteriorate.
The management of Westwood assessed the effectiveness of Westwood’s internal control over financial reporting as of December 31, 2010, excluding the office of McCarthy Group Advisors, LLC which was acquired in November 2010. In making this assessment, it used the criteria set forth by the Committee of Sponsoring Organizations of the Treadway Commission (COSO) in Internal Control – Integrated Framework. Based on our assessment, we believe that, as of December 31, 2010, Westwood’s internal control over financial reporting is effective based on those criteria.
Westwood’s independent registered public accounting firm has issued an audit report on our assessment of Westwood’s internal control over financial reporting. This report appears on page F-3.
| By: | /S/ BRIAN O. CASEY | |
| Brian O. Casey, President & Chief Executive Officer | ||
| /S/ WILLIAM R. HARDCASTLE, JR. | ||
| William R. Hardcastle, Jr., Chief Financial Officer | ||
February 25, 2011
Dallas, Texas
F-4
Table of Contents
WESTWOOD HOLDINGS GROUP, INC. AND SUBSIDIARIES
CONSOLIDATED BALANCE SHEETS
As of December 31, 2010 and 2009
(in thousands, except par values and share amounts)
| 2010 | 2009 | |||||||
| ASSETS | ||||||||
| Current Assets: |
||||||||
| Cash and cash equivalents |
$ | 1,744 | $ | 2,879 | ||||
| Accounts receivable |
7,348 | 6,406 | ||||||
| Investments, at fair value |
43,300 | 42,246 | ||||||
| Deferred income taxes |
2,757 | 2,187 | ||||||
| Other current assets |
733 | 625 | ||||||
| Total current assets |
55,882 | 54,343 | ||||||
| Goodwill |
11,281 | 3,915 | ||||||
| Intangible assets, net |
5,119 | 1,050 | ||||||
| Property and equipment, net of accumulated depreciation of $1,542 and $1,315 |
346 | 578 | ||||||
| Total assets |
$ | 72,628 | $ | 59,886 | ||||
| LIABILITIES AND STOCKHOLDERS’ EQUITY | ||||||||
| Current Liabilities: |
||||||||
| Accounts payable and accrued liabilities |
$ | 1,290 | $ | 995 | ||||
| Dividends payable |
— | 2,359 | ||||||
| Compensation and benefits payable |
9,369 | 6,273 | ||||||
| Income taxes payable |
173 | 823 | ||||||
| Deferred acquisition liability |
899 | 900 | ||||||
| Other current liabilities |
13 | 11 | ||||||
| Total current liabilities |
11,744 | 11,361 | ||||||
| Deferred acquisition liability |
— | 796 | ||||||
| Deferred income taxes |
117 | 238 | ||||||
| Deferred rent |
90 | 273 | ||||||
| Total long-term liabilities |
207 | 1,307 | ||||||
| Total liabilities |
11,951 | 12,668 | ||||||
| Stockholders’ Equity: |
||||||||
| Common stock, $0.01 par value, authorized 25,000,000 shares, issued 7,874,873 and outstanding 7,645,678 shares at December 31, 2010; issued 7,308,812 and outstanding 7,151,472 shares at December 31, 2009 |
79 | 73 | ||||||
| Additional paid-in capital |
65,639 | 47,741 | ||||||
| Treasury stock, at cost – 229,195 shares at December 31, 2010; 157,340 shares at December 31, 2009 |
(8,749 | ) | (6,026 | ) | ||||
| Accumulated other comprehensive income |
926 | 1,559 | ||||||
| Retained earnings |
2,782 | 3,871 | ||||||
| Total stockholders’ equity |
60,677 | 47,218 | ||||||
| Total liabilities and stockholders’ equity |
$ | 72,628 | $ | 59,886 | ||||
See notes to consolidated financial statements.
F-5
Table of Contents
WESTWOOD HOLDINGS GROUP, INC. AND SUBSIDIARIES
CONSOLIDATED STATEMENTS OF INCOME
For the Years Ended December 31, 2010, 2009 and 2008
(in thousands, except per share data)
| 2010 | 2009 | 2008 | ||||||||||
| REVENUES: |
||||||||||||
| Advisory fees |
||||||||||||
| Asset-based |
$ | 42,153 | $ | 31,794 | $ | 26,966 | ||||||
| Performance-based |
— | — | 8,725 | |||||||||
| Trust fees |
12,051 | 10,304 | 11,018 | |||||||||
| Other revenues, net |
1,109 | 455 | (253 | ) | ||||||||
| Total revenues |
55,313 | 42,553 | 46,456 | |||||||||
| EXPENSES: |
||||||||||||
| Employee compensation and benefits |
29,001 | 23,730 | 23,209 | |||||||||
| Sales and marketing |
823 | 576 | 803 | |||||||||
| WHG mutual funds |
662 | 600 | 384 | |||||||||
| Information technology |
1,351 | 1,221 | 1,114 | |||||||||
| Professional services |
2,941 | 1,531 | 1,749 | |||||||||
| General and administrative |
2,814 | 2,577 | 2,662 | |||||||||
| Total expenses |
37,592 | 30,235 | 29,921 | |||||||||
| Income before income taxes |
17,721 | 12,318 | 16,535 | |||||||||
| Provision for income taxes |
6,441 | 4,423 | 5,992 | |||||||||
| Net income |
$ | 11,280 | $ | 7,895 | $ | 10,543 | ||||||
| Earnings per share: |
||||||||||||
| Basic |
$ | 1.62 | $ | 1.10 | $ | 1.53 | ||||||
| Diluted |
$ | 1.58 | $ | 1.09 | $ | 1.52 | ||||||
See notes to consolidated financial statements.
F-6
Table of Contents
WESTWOOD HOLDINGS GROUP, INC. AND SUBSIDIARIES
CONSOLIDATED STATEMENT OF STOCKHOLDERS’ EQUITY
For the Years Ended December 31, 2010, 2009 and 2008
(in thousands, except share and per share data)
| Westwood Holdings Group, Inc. Common Stock, Par |
Additional Paid-In Capital |
Treasury Stock |
Accumulated Other Comprehensive Income |
Retained Earnings |
Total | |||||||||||||||||||||||
| Shares | Amount | |||||||||||||||||||||||||||
| BALANCE, January 1, 2008 |
6,807,408 | $ | 68 | $ | 27,770 | $ | (1,070 | ) | $ | — | $ | 2,578 | $ | 29,346 | ||||||||||||||
| Net income |
10,543 | 10,543 | ||||||||||||||||||||||||||
| Issuance of restricted stock |
192,500 | 2 | (2 | ) | — | |||||||||||||||||||||||
| Amortization of stock compensation |
6,735 | 6,735 | ||||||||||||||||||||||||||
| Tax benefit related to equity compensation |
2,699 | 2,699 | ||||||||||||||||||||||||||
| Dividends declared ($1.20 per share) |
(8,356 | ) | (8,356 | ) | ||||||||||||||||||||||||
| Stock options exercised |
19,900 | 1 | 256 | 257 | ||||||||||||||||||||||||
| Purchases of treasury stock |
(61,570 | ) | (2,430 | ) | (2,430 | ) | ||||||||||||||||||||||
| BALANCE, December 31, 2008 |
6,958,238 | $ | 71 | $ | 37,458 | $ | (3,500 | ) | $ | — | $ | 4,765 | $ | 38,794 | ||||||||||||||
| Net income |
7,895 | 7,895 | ||||||||||||||||||||||||||
| Other comprehensive income – unrealized gain on investment securities, net of $800 in taxes |
1,559 | 1,559 | ||||||||||||||||||||||||||
| Comprehensive income |
9,454 | |||||||||||||||||||||||||||
| Issuance of restricted stock |
233,150 | 2 | (2 | ) | — | |||||||||||||||||||||||
| Issuance of stock for business combination |
20,435 | — | 752 | 752 | ||||||||||||||||||||||||
| Amortization of stock compensation |
7,666 | 7,666 | ||||||||||||||||||||||||||
| Tax benefit related to equity compensation |
1,834 | 1,834 | ||||||||||||||||||||||||||
| Dividends declared ($1.23 per share) |
(8,789 | ) | (8,789 | ) | ||||||||||||||||||||||||
| Stock options exercised |
2,500 | — | 33 | 33 | ||||||||||||||||||||||||
| Purchases of treasury stock |
(62,851 | ) | (2,526 | ) | (2,526 | ) | ||||||||||||||||||||||
| BALANCE, December 31, 2009 |
7,151,472 | $ | 73 | $ | 47,741 | $ | (6,026 | ) | $ | 1,559 | $ | 3,871 | $ | 47,218 | ||||||||||||||
| Net income |
11,280 | 11,280 | ||||||||||||||||||||||||||
| Other comprehensive income – unrealized loss on investment securities, net of $(341) in taxes |
(633 | ) | (633 | ) | ||||||||||||||||||||||||
| Comprehensive income |
10,647 | |||||||||||||||||||||||||||
| Issuance of restricted stock |
368,100 | 4 | (4 | ) | — | |||||||||||||||||||||||
| Issuance of stock for business combination |
181,461 | 2 | 6,932 | 6,934 | ||||||||||||||||||||||||
| Amortization of stock compensation |
9,269 | 9,269 | ||||||||||||||||||||||||||
| Tax benefit related to equity compensation |
1,488 | 1,488 | ||||||||||||||||||||||||||
| Dividends declared ($1.65 per share) |
(12,369 | ) | (12,369 | ) | ||||||||||||||||||||||||
| Stock options exercised |
16,500 | — | 213 | 213 | ||||||||||||||||||||||||
| Purchases of treasury stock |
(71,855 | ) | (2,723 | ) | (2,723 | ) | ||||||||||||||||||||||
| BALANCE, December 31, 2010 |
7,645,678 | $ | 79 | $ | 65,639 | $ | (8,749 | ) | $ | 926 | $ | 2,782 | $ | 60,677 | ||||||||||||||
See notes to consolidated financial statements.
F-7
Table of Contents
WESTWOOD HOLDINGS GROUP, INC. AND SUBSIDIARIES
CONSOLIDATED STATEMENTS OF CASH FLOWS
For the Years Ended December 31, 2010, 2009 and 2008
(in thousands)
| 2010 | 2009 | 2008 | ||||||||||
| CASH FLOWS FROM OPERATING ACTIVITIES: |
||||||||||||
| Net income |
$ | 11,280 | $ | 7,895 | $ | 10,543 | ||||||
| Adjustments to reconcile net income to net cash provided by (used in) operating activities, net of business combinations: |
||||||||||||
| Depreciation |
274 | 241 | 232 | |||||||||
| Amortization of intangible assets |
155 | 13 | — | |||||||||
| Fair value adjustment of deferred acquisition liabilities |
156 | 23 | — | |||||||||
| Unrealized losses (gains) on investments |
(694 | ) | (588 | ) | 974 | |||||||
| Restricted stock amortization |
9,269 | 7,666 | 6,735 | |||||||||
| Deferred income taxes |
(350 | ) | (73 | ) | (978 | ) | ||||||
| Excess tax benefits from stock based compensation |
(1,026 | ) | (1,518 | ) | (2,271 | ) | ||||||
| Net purchases of investments – trading securities |
(714 | ) | (9,721 | ) | (20,256 | ) | ||||||
| Changes in operating assets and liabilities: |
||||||||||||
| Accounts receivable |
(572 | ) | 6,232 | (6,039 | ) | |||||||
| Other current assets |
(18 | ) | 76 | (47 | ) | |||||||
| Accounts payable and accrued liabilities |
(2,167 | ) | (101 | ) | 81 | |||||||
| Compensation and benefits payable |
2,343 | (779 | ) | 2,204 | ||||||||
| Income taxes payable and prepaid taxes |
838 | 1,298 | 2,553 | |||||||||
| Other liabilities |
(497 | ) | (58 | ) | (41 | ) | ||||||
| Net cash provided by (used in) operating activities |
18,277 | 10,606 | (6,310 | ) | ||||||||
| CASH FLOWS FROM INVESTING ACTIVITIES: |
||||||||||||
| Purchases of money market funds – available for sale |
(39,877 | ) | (64,984 | ) | (34,849 | ) | ||||||
| Sales of money market funds – available for sale |
39,257 | 63,597 | 48,123 | |||||||||
| Cash paid for business combination, net of cash acquired |
(4,993 | ) | (251 | ) | — | |||||||
| Purchases of property and equipment |
(49 | ) | (86 | ) | (153 | ) | ||||||
| Net cash provided by (used in) investing activities |
(5,662 | ) | (1,724 | ) | 13,121 | |||||||
| CASH FLOWS FROM FINANCING ACTIVITIES: |
||||||||||||
| Purchases of treasury stock |
(2,723 | ) | (2,526 | ) | (2,430 | ) | ||||||
| Excess tax benefits from stock based compensation |
1,026 | 1,518 | 2,271 | |||||||||
| Proceeds from exercise of stock options |
213 | 33 | 257 | |||||||||
| Cash dividends |
(12,266 | ) | (8,526 | ) | (7,971 | ) | ||||||
| Net cash used in financing activities |
(13,750 | ) | (9,501 | ) | (7,873 | ) | ||||||
| NET DECREASE IN CASH AND CASH EQUIVALENTS |
(1,135 | ) | (619 | ) | (1,062 | ) | ||||||
| Cash and cash equivalents, beginning of year |
2,879 | 3,498 | 4,560 | |||||||||
| Cash and cash equivalents, end of year |
$ | 1,744 | $ | 2,879 | $ | 3,498 | ||||||
| Supplemental cash flow information: |
||||||||||||
| Cash paid during the year for income taxes |
$ | 5,937 | $ | 3,199 | $ | 4,418 | ||||||
See notes to consolidated financial statements.
F-8
Table of Contents
WESTWOOD HOLDINGS GROUP, INC. AND SUBSIDIARIES
NOTES TO CONSOLIDATED FINANCIAL STATEMENTS
For the years ended December 31, 2010, 2009 and 2008
1. DESCRIPTION OF THE BUSINESS:
Westwood Holdings Group, Inc. (“Westwood”, “we” or “our”) was incorporated under the laws of the State of Delaware on December 12, 2001. Westwood manages investment assets and provides services for its clients through two subsidiaries, Westwood Management Corp. (“Westwood Management”) and Westwood Trust (“Westwood Trust”). Westwood Management provides investment advisory services to corporate retirement plans, public retirement plans, endowments and foundations, mutual funds, individuals and clients of Westwood Trust. Westwood Trust provides institutions and high net worth individuals with trust and custodial services and participation in common trust funds that it sponsors. Revenue is largely dependent on the total value and composition of assets under management (“AUM”). Accordingly, fluctuations in financial markets and in the composition of AUM impact revenues and results of operations.
Westwood Management is a registered investment adviser under the Investment Advisers Act of 1940. Westwood Trust is chartered and regulated by the Texas Department of Banking.
2. SUMMARY OF SIGNIFICANT ACCOUNTING POLICIES:
Basis of Presentation
The accompanying consolidated financial statements reflect all adjustments that, in the opinion of management, are necessary to present fairly our financial position as of December 31, 2010, and results of operations and cash flows for the periods presented. All such adjustments are normal and recurring in nature. The accompanying consolidated financial statements are presented using the accrual basis of accounting and have been prepared in accordance with the instructions for the presentation of annual financial information as prescribed by the Securities and Exchange Commission (“SEC”). Operating results for the periods in these financial statements are not necessarily indicative of the results for any future period. The accompanying financial statements have been prepared in accordance with U.S. generally accepted accounting principles (‘GAAP”) and include the accounts of Westwood and its subsidiaries. All significant intercompany accounts and transactions have been eliminated upon consolidation.
Use of Estimates
The preparation of consolidated financial statements in conformity with GAAP requires management to make estimates and assumptions that affect the reported amounts of assets and liabilities, the disclosure of contingent assets and liabilities at the date of the consolidated financial statements and the reported amounts of revenues and expenses during the reporting period. Actual results could differ from those estimates.
Revenue Recognition
Investment advisory and trust fees are recognized as services are provided. These fees are determined in accordance with contracts between our subsidiaries and their clients and are generally based on a percentage of assets under management. A limited number of our clients have a performance-based fee component in their contract, which would pay us an additional fee if we outperform a specified index over a specific period of time. We record revenue for performance-based fees at the end of the measurement period. Most advisory and trust fees are payable in advance or in arrears on a calendar quarterly basis. Advance payments are deferred and recognized over the periods services are performed. Since most of our advance paying clients’ billing periods coincide with the calendar quarter to which payment relates, related revenue related is fully recognized within the quarter. Consequently there is not a significant amount of deferred revenue contained in our financial statements. Deferred revenue is shown on the balance sheet under the heading of “Other current liabilities”. Other revenues generally consist of interest and investment income. These revenues are recognized as earned or as the services are performed.
F-9
Table of Contents
WESTWOOD HOLDINGS GROUP, INC. AND SUBSIDIARIES
NOTES TO CONSOLIDATED FINANCIAL STATEMENTS – (Continued)
Variable Interest Entities
A variable interest entity (VIE) is an entity in which either (a) the equity investment at risk is not sufficient to permit the entity to finance its own activities without additional financial support or (b) the voting rights of the equity investors are not proportional to their obligations to absorb expected losses or receive expected residual returns of the entity.
We have examined whether the entities in which we have an interest are VIEs and whether we qualify as the primary beneficiary of the VIEs that we identify. We have included the disclosures related to VIEs in a note to these financial statements.
Cash and Cash Equivalents
Cash and cash equivalents consist of short-term, highly liquid investments with maturities of three months or less, other than pooled investment vehicles that are considered investments.
Investments
Prior to the fourth quarter of 2010, money market securities were classified as available for sale securities. In the fourth quarter of 2010, we reevaluated our classification of investments and determined that money market securities more closely fit the trading classification and began to account for them as such. In that money market securities have no significantly fluctuating values, there was no impact on the balance sheet or income statement upon reclassification of these securities. Class A shares of Teton Advisors, Inc. (“Teton shares”) are classified as available for sale. The Teton shares are carried at quoted market value with a 25% discount for lack of marketability. Unrealized gains and losses on the Teton shares are recorded through other comprehensive income. All other marketable securities are classified as trading securities and are carried at quoted market value on the accompanying consolidated balance sheet. Net unrealized holding gains or losses on investments classified as trading securities are reflected as a component of other revenues. We measure realized gains and losses on investments using the specific identification method.
Property and Equipment
Property and equipment are stated at cost less accumulated depreciation. Depreciation of furniture and equipment is provided over the estimated useful lives of the assets (from 3 to 7 years), and depreciation on leasehold improvements is provided over the lease term using the straight-line method. We capitalize leasehold improvements, furniture and fixtures, computer hardware and most office equipment purchases. The following table reflects information about our property and equipment as of December 31, 2010 and 2009.
| 2010 | 2009 | |||||||
| Leasehold improvements cost |
$ | 411 | $ | 504 | ||||
| Leasehold improvements – accumulated depreciation |
(329 | ) | (278 | ) | ||||
| Furniture and fixtures cost |
792 | 783 | ||||||
| Furniture and fixtures – accumulated depreciation |
(693 | ) | (570 | ) | ||||
| Computer hardware and office equipment cost |
696 | 597 | ||||||
| Computer hardware and office equipment – accumulated depreciation |
(531 | ) | (458 | ) | ||||
| Net property and equipment |
$ | 346 | $ | 578 | ||||
Goodwill and Other Intangible Assets
Goodwill represents the excess of the cost of acquired assets over the fair value of the underlying identifiable assets at the date of acquisition. Goodwill is not amortized but is tested annually for impairment.
F-10
Table of Contents
WESTWOOD HOLDINGS GROUP, INC. AND SUBSIDIARIES
NOTES TO CONSOLIDATED FINANCIAL STATEMENTS – (Continued)
During the third quarters of 2010, 2009 and 2008, we completed annual goodwill impairment assessments. No impairment losses were required. We perform our annual impairment assessment as of July 1 and would reassess if circumstances indicated a potential impairment between our annual assessment dates. We assess the fair value of our business units in connection with goodwill using a market multiple approach. We reevaluated our assessment at the end of 2010 and determined that no events occurred in the last half of 2010 that indicated that these assets should be retested for impairment.
Our intangible assets represent the acquisition date fair value of the customer accounts, mutual fund assets, trade names and non-compete agreements acquired and are reflected net of amortization. In valuing these assets, we made significant estimates regarding the useful life, growth rates and potential attrition of the assets acquired. We periodically review our intangible assets for events or circumstances that would indicate impairment. If the carrying value of these assets exceeded the fair value, we would record an impairment to remove the excess. For a further discussion of our goodwill and intangible assets, please see “Note 6. ACQUISITIONS, GOODWILL AND INTANGIBLE ASSETS” of these financial statements.
Federal Income Taxes
We file a Federal income tax return as a consolidated group for Westwood and its subsidiaries. Deferred income tax assets and liabilities are determined based on the differences between the financial statement and income tax bases of assets and liabilities as measured at enacted income tax rates. Deferred income tax expense is generally the result of changes in deferred tax assets and liabilities. Deferred taxes relate primarily to stock-based compensation expense.
We do not have uncertain tax positions for any of the years presented. If an uncertain tax position should arise, we would report a liability for an unrecognized tax benefit from an uncertain tax position taken or expected to be taken on a tax return. We include penalties and interest on income based taxes in the “Provision for income taxes” line on our income statement.
Accounting Developments
In the second quarter of 2010, we adopted a new accounting standard related to the computation of earnings per share, which requires shares of unvested share-based payment awards that contain non-forfeitable rights to dividends to be treated as participating securities. This standard requires using the two-class method to compute earnings per share, which allocates a portion of net income to those shares as if they were a separate class of stock, which decreases earnings available to shares of common stock. We determined that shares of our previously issued unvested restricted stock contain non-forfeitable dividend rights and should be treated as participating securities. The retrospective impact of adopting this standard reduced basic earnings per share from $1.25 to $1.10 in 2009 and from $1.73 to $1.53 in 2008 and diluted earnings per share from $1.18 to $1.09 in 2009 and from $1.63 to $1.52 in 2008.
In June 2009, the Financial Accounting Standards Board (“FASB”) issued guidance under Accounting Standards Codification (“ASC”) No. 810, Consolidation (“ASC 810”). This new guidance established general standards of accounting for and disclosures for interests in variable interest entities (“VIE”) and requires entities to review its involvements with VIEs and potential VIEs to determine the effect on its financial statements and related disclosures. This standard changes the manner in which an entity determines whether it is the primary beneficiary of a VIE, whether that VIE should be consolidated and requires additional disclosures. In February 2010, the FASB issued further guidance under ASC 810 indefinitely deferring a requirement to perform a qualitative analysis to determine whether an entity’s variable interests give it a controlling financial interest in a VIE. This deferral generally applies to the reporting entities interests in entities that have the attributes of an investment company or that apply the specialized accounting guidance for investment companies. We determined that we qualified for the deferral under this guidance.
Stock Based Compensation
We account for stock-based compensation in accordance with ASC No. 718, Compensation-Stock Compensation (“ASC 718”). Under ASC 718, stock-based compensation expense reflects the fair value of stock-based awards measured at grant date, is recognized over the relevant service period, and is adjusted each period for anticipated forfeitures. The compensation cost recorded for these awards is based on their grant-date fair value as required by ASC 718.
F-11
Table of Contents
WESTWOOD HOLDINGS GROUP, INC. AND SUBSIDIARIES
NOTES TO CONSOLIDATED FINANCIAL STATEMENTS – (Continued)
We have issued restricted stock and stock options in accordance with our Third Amended and Restated Westwood Holdings Group, Inc. Stock Incentive Plan (the “Plan”). We valued stock options issued based upon the Black-Scholes option-pricing model and recognized this value as an expense over the periods in which the options vested. Implementation of the Black-Scholes option-pricing model required us to make certain assumptions, including expected volatility, risk-free interest rate, expected dividend yield and expected life of the options. We utilized assumptions that we believed to be most appropriate at the time of the valuation. Had we used different assumptions in the pricing model, the expense recognized for stock options may have been different than the expense recognized in our financial statements. We must also apply judgment in developing an expectation of awards of restricted stock and stock options that may be forfeited. If actual experience differs significantly from these estimates, stock-based compensation expense and our results of operations could be materially affected.
3. ACCOUNTS RECEIVABLE:
Our trade accounts receivable balances do not include any allowance for doubtful accounts nor has any bad debt expense attributable to trade receivables been recorded for the years ended December 31, 2010, 2009 and 2008. The majority of our accounts receivable balances consists of advisory and trust fees receivable from customers that we believe and have experienced to be fully collectable.
Some of our directors, executive officers and their affiliates invest their personal funds directly in accounts we manage. There were no amounts due from these accounts as of December 31, 2010 and 2009. For the years 2010, 2009 and 2008, we recorded trust fees from these accounts of $442,000, $382,000 and $407,000, respectively.
4. INVESTMENTS:
Investment balances are presented in the table below (in thousands). All of these investments are carried at fair value. Our investments in money market securities at December 31, 2009 and Teton shares for all periods presented are accounted for as available for sale securities. All other investments are accounted for as trading securities.
| Cost | Gross Unrealized Gains |
Gross Unrealized Losses |
Estimated Fair Value |
|||||||||||||
| December 31, 2010: |
||||||||||||||||
| U.S. Government and Government agency obligations |
$ | 32,774 | $ | 11 | $ | — | $ | 32,785 | ||||||||
| Funds: |
||||||||||||||||
| Money Market |
3,795 | — | — | 3,795 | ||||||||||||
| Equity – available for sale |
— | 1,425 | — | 1,425 | ||||||||||||
| Equity – trading |
4,767 | 533 | (5 | ) | 5,295 | |||||||||||
| Marketable securities |
$ | 41,336 | $ | 1,969 | $ | (5 | ) | $ | 43,300 | |||||||
| December 31, 2009: |
||||||||||||||||
| U.S. Government and Government agency obligations |
$ | 33,949 | $ | 3 | $ | — | $ | 33,952 | ||||||||
| Funds: |
||||||||||||||||
| Money Market |
3,230 | — | — | 3,230 | ||||||||||||
| Equity – available for sale |
— | 2,399 | — | 2,399 | ||||||||||||
| Equity – trading |
2,823 | 35 | (193 | ) | 2,665 | |||||||||||
| Marketable securities |
$ | 40,002 | $ | 2,437 | $ | (193 | ) | $ | 42,246 | |||||||
F-12
Table of Contents
WESTWOOD HOLDINGS GROUP, INC. AND SUBSIDIARIES
NOTES TO CONSOLIDATED FINANCIAL STATEMENTS – (Continued)
The following amounts, except for income tax amounts, are included in our income statement under the heading “Other revenues” for the years indicated (in thousands):
| 2010 | 2009 | 2008 | ||||||||||
| Realized gains |
$ | 104 | $ | 10 | $ | 12 | ||||||
| Realized losses |
(3 | ) | (505 | ) | (51 | ) | ||||||
| Net realized gains/(losses) |
101 | (495 | ) | (39 | ) | |||||||
| Income tax expense/(benefit) from gains/(losses) |
37 | (173 | ) | (14 | ) | |||||||
| Interest income—trading |
104 | 171 | 161 | |||||||||
| Interest income—available-for -sale |
— | 1 | 255 | |||||||||
| Dividend income |
189 | 187 | 295 | |||||||||
| Unrealized gains/(losses) |
694 | 588 | (974 | ) | ||||||||
5. FAIR VALUE OF FINANCIAL INSTRUMENTS
We determined the estimated fair values of our financial instruments using available information. The fair value amounts discussed in Notes 4 and 5 are not necessarily indicative of either the amounts realizable upon disposition of these instruments or our intent or ability to dispose of these assets. The estimated fair value of cash and cash equivalents, as well as accounts receivable and payable, approximates their carrying value due to their short-term maturities. The carrying amount of investments designated as “trading” securities, primarily U.S. Government and Government agency obligations, money market funds, WHG Funds mutual funds and Westwood Trust common trust fund shares, equals their fair value, which is equal to prices quoted in active markets and, with respect to funds, the net asset value of the shares held as reported by the fund. The market values of our money market holdings generally do not fluctuate. The fair value of the Teton shares, which is designated as an “available for sale” security, is equal to the closing market price as of December 31, 2010 of $9.50 per share less a 25% discount for lack of marketability.
Effective January 1, 2008, we adopted the provisions of ASC No. 820, Fair Value Measurements and Disclosures (“ASC 820”), which defines fair value, establishes a framework for measuring fair value and requires additional disclosures regarding certain fair value measurements. ASC 820 establishes a three-tier hierarchy for measuring fair value as follows:
| • | level 1 – quoted market prices in active markets for identical assets, |
| • | level 2 – inputs other than quoted prices that are directly or indirectly observable and |
| • | level 3 – unobservable inputs where there is little or no market activity. |
F-13
Table of Contents
WESTWOOD HOLDINGS GROUP, INC. AND SUBSIDIARIES
NOTES TO CONSOLIDATED FINANCIAL STATEMENTS – (Continued)
The following table summarizes the values of our assets as of within the fair value hierarchy (in thousands).
| Level 1 | Level 2 | Level 3 | Total | |||||||||||||
| As of December 31, 2010 |
||||||||||||||||
| Investments in securities: |
||||||||||||||||
| Trading |
$ | 41,875 | $ | — | $ | — | $ | 41,875 | ||||||||
| Available-for-sale |
— | — | 1,425 | 1,425 | ||||||||||||
| Total Financial instruments |
$ | 41,875 | $ | — | $ | 1,425 | $ | 43,300 | ||||||||
| As of December 31, 2009 |
||||||||||||||||
| Investments in securities: |
||||||||||||||||
| Trading |
$ | 36,617 | $ | — | $ | — | $ | 36,617 | ||||||||
| Available-for-sale |
3,230 | — | 2,399 | 5,629 | ||||||||||||
| Total Financial instruments |
$ | 39,847 | $ | — | $ | 2,399 | $ | 42,246 | ||||||||
We used level 3 inputs to determine the fair value of 200,000 Class A shares of Teton Advisors, Inc. that we own. This fair value amount is not necessarily indicative of either the amount we would realize upon disposition of these shares or our intent or ability to dispose of them. There were no transfers of level 3 assets to or from other asset classes and there were no gains, losses, purchases or sales of the Teton shares. The following table presents information regarding this investment.
| For the years ended | ||||||||
| Investments in available-for-sale securities (in thousands) |
2010 | 2009 | ||||||
| Beginning balance |
$ | 2,399 | $ | — | ||||
| Unrealized gains/(losses) included in Other Comprehensive Income |
(974 | ) | 2,399 | |||||
| Ending balance |
$ | 1,425 | $ | 2,399 | ||||
6. ACQUISITIONS, GOODWILL AND INTANGIBLE ASSETS
On November 18, 2010, we acquired the business and all related assets of McCarthy Group Advisors, L.L.C. (“McCarthy”), a Nebraska limited liability company and registered investment advisor based in Omaha, Nebraska. Subsequent to closing, the McCarthy business was added to our Westwood Management segment. We expect a significant portion of client assets will transition to Westwood Trust products over time. This acquisition was made in order to increase assets in our private wealth and Westwood Trust operating units, increase revenue from the WHG Funds through the reorganization of the McCarthy Multi-Cap Stock Fund into the WHG Dividend Growth Fund, which was completed in February 2011, and expand the Westwood Trust platform by adding an office of seasoned professionals in a new market. At closing, we paid consideration totaling $12.0 million, comprised of 181,461 shares of Westwood Holdings Group, Inc. common stock and $5.0 million in cash. Related to this acquisition, we recorded goodwill of $7.4 million, intangible assets of $4.2 million and net working capital and property and equipment of $0.4 million, which is detailed by assets and liabilities in a table below. The intangible assets purchased were primarily McCarthy’s customer accounts but also included allocations to trade-name and non-compete agreements, which together comprised approximately 7% of the allocated purchase price. Pro forma results of operations have not been presented because the results of operations for the years ended December 31, 2010, 2009 and 2008, including McCarthy’s operations, would not have been materially different from those reported in our Consolidated Statement of Income.
F-14
Table of Contents
WESTWOOD HOLDINGS GROUP, INC. AND SUBSIDIARIES
NOTES TO CONSOLIDATED FINANCIAL STATEMENTS – (Continued)
The following tables display the assets and liabilities we acquired from McCarthy:
| Amount ($ thousands) |
||||
| Goodwill: |
||||
| Other goodwill |
$ | 6,875 | ||
| Assembled workforce |
491 | |||
| Total goodwill |
$ | 7,366 | ||
| Intangible assets: |
||||
| Customer accounts |
$ | 3,965 | ||
| Trade name |
234 | |||
| Non-compete agreements |
24 | |||
| Total Intangible assets |
$ | 4,223 | ||
| Tangible assets |
Amount ($ thousands) |
|||
| Cash |
$ | 1,008 | ||
| Receivables |
370 | |||
| Property and equipment |
88 | |||
| Prepaid expenses |
76 | |||
| Bonuses payable |
(753 | ) | ||
| Unearned Income |
(296 | ) | ||
| Other liabilities |
(101 | ) | ||
| Net tangible assets |
$ | 392 | ||
On November 16, 2009, we acquired the business and substantially all the related assets of Baxter Financial Corporation related to its management of the Philadelphia Fund. In connection with this acquisition, the Philadelphia Fund was reorganized into the WHG LargeCap Value Fund. This acquisition was made in order to increase WHG Funds revenue, increase economies of scale in the WHG LargeCap Value Fund and increase fund assets to a level that is more attractive to potential institutional clients. At closing, we paid consideration totaling $1.0 million, comprised of 20,435 shares of Westwood Holdings Group, Inc. common stock and $251,000 in cash, which was the result of a multiple applied to the total mutual fund assets being obtained. We are obligated to pay deferred payments twelve and twenty-four months from the transaction closing date. These deferred payments, which are subject to a total purchase price cap, are payable in shares of Westwood Holdings Group, Inc. common stock and/or cash at our discretion and are subject to adjustment based on the value of assets in the acquired customer accounts as of the deferred payment dates. On November 16, 2010, we paid cash for the first deferred payment in the amount of $953,000. Related to this acquisition, we recorded total assets of $2.7 million, comprised solely of goodwill and intangible assets, and deferred liabilities of $1.7 million. Pro forma results of operations have not been presented because the results of operations for the years ended December 31, 2009 and 2008 would not have been materially different from those reported in our Consolidated Statement of Income. The intangible assets we purchased were primarily the rights to manage customer accounts of the Philadelphia Fund, but also include allocations to trade-name and a non-solicitation agreement, which together comprise approximately 1% of the allocated purchase price.
The goodwill we acquired is not amortized, but does provide a tax deduction. The changes in goodwill for the last two years were as follows (in thousands):
| 2010 | 2009 | |||||||
| Beginning balance |
$ | 3,915 | $ | 2,302 | ||||
| Acquired goodwill |
7,366 | 1,613 | ||||||
| Ending balance |
$ | 11,281 | $ | 3,915 | ||||
F-15
Table of Contents
WESTWOOD HOLDINGS GROUP, INC. AND SUBSIDIARIES
NOTES TO CONSOLIDATED FINANCIAL STATEMENTS – (Continued)
Intangible Assets
The following is a summary of our intangible assets at December 31, 2010 and 2009 (in thousands, except years):
| Weighted Average Amortization Period (years) |
Gross Carrying Amount |
Accumu- lated Amortiz- ation |
Net Carrying Amount |
|||||||||||||
| 2010 |
||||||||||||||||
| Client relationships |
14.2 | $ | 5,005 | $ | (139 | ) | $ | 4,866 | ||||||||
| Trade names |
2.0 | 256 | (27 | ) | 229 | |||||||||||
| Non-compete agreements |
2.3 | 26 | (2 | ) | 24 | |||||||||||
| Total |
$ | 5,287 | $ | (168 | ) | $ | 5,119 | |||||||||
| 2009 |
||||||||||||||||
| Client relationships |
11.0 | $ | 1,040 | $ | (12 | ) | $ | 1,028 | ||||||||
| Trade names |
2.0 | 21 | (1 | ) | 20 | |||||||||||
| Non-compete agreements |
5.0 | 3 | (1 | ) | 2 | |||||||||||
| Total |
$ | 1,063 | $ | (13 | ) | 1,050 | ||||||||||
Amortization expense, which is included in “General and administrative” expense on our Consolidated Statement of Income, was $155,000, $13,000 and $0 for the years ended December 31, 2010, 2009 and 2008, respectively. Estimated amortization expense for the intangible assets for the next five years is as follows (in thousands):
| For the Year ending December 31, |
Estimated Amortization Expense |
|||
| 2011 |
$ | 498 | ||
| 2012 |
472 | |||
| 2013 |
359 | |||
| 2014 |
359 | |||
| 2015 |
359 | |||
7. INCOME TAXES:
Income tax expense for the years ended December 31, 2010, 2009 and 2008 differs from the amount that would otherwise have been calculated by applying the Federal corporate tax rates to income before income taxes. The difference between the Federal corporate tax rate and the effective tax rate is comprised of the following (in thousands):
| 2010 | 2009 | 2008 | ||||||||||
| Federal statutory rate |
35.0 | % | 35.0 | % | 35.0 | % | ||||||
| Effective tax rate |
36.3 | % | 35.9 | % | 36.2 | % | ||||||
| Income tax expense at the statutory rate |
$ | 6,202 | $ | 4,311 | $ | 5,788 | ||||||
| State margin, franchise and income taxes |
295 | 230 | 238 | |||||||||
| Other, net |
(56 | ) | (118 | ) | (34 | ) | ||||||
| Total income tax expense |
$ | 6,441 | $ | 4,423 | $ | 5,992 | ||||||
F-16
Table of Contents
WESTWOOD HOLDINGS GROUP, INC. AND SUBSIDIARIES
NOTES TO CONSOLIDATED FINANCIAL STATEMENTS – (Continued)
We include penalties and interest on income based taxes in the “Provision for income taxes” line on our income statement. We recorded penalties and interest of $13,212, $4,103 and $25,748 in 2010, 2009 and 2008, respectively.
Income taxes as set forth in the consolidated statements of income consisted of the following components (in thousands):
| 2010 | 2009 | 2008 | ||||||||||
| State – current |
$ | 450 | $ | 345 | $ | 373 | ||||||
| State – deferred |
3 | 4 | (7 | ) | ||||||||
| Federal – current |
6,341 | 4,151 | 6,597 | |||||||||
| Federal – deferred |
(353 | ) | (77 | ) | (971 | ) | ||||||
| Total income tax expense |
$ | 6,441 | $ | 4,423 | $ | 5,992 | ||||||
The tax effects of temporary differences that give rise to the deferred tax assets and deferred tax liabilities as of December 31, 2010 and 2009 are presented below (in thousands):
| 2010 | 2009 | |||||||
| Deferred tax assets: |
||||||||
| Restricted stock amortization |
$ | 3,191 | $ | 2,489 | ||||
| Stock option expense |
74 | 105 | ||||||
| Incentive compensation |
119 | 175 | ||||||
| Unrealized losses on investments |
— | 55 | ||||||
| Contingent liability |
17 | |||||||
| Deferred rent |
13 | 42 | ||||||
| Other |
4 | 4 | ||||||
| Total deferred tax assets |
3,418 | 2,870 | ||||||
| Deferred tax liabilities: |
||||||||
| Depreciation at rates different for tax than for financial reporting |
(43 | ) | (79 | ) | ||||
| Intangibles |
(45 | ) | (3 | ) | ||||
| Unrealized gains on investments |
(690 | ) | (839 | ) | ||||
| Total deferred tax liabilities |
(778 | ) | (921 | ) | ||||
| Net deferred tax assets |
$ | 2,640 | $ | 1,949 | ||||
Net deferred tax assets and liabilities are reflected on our balance sheet as of December 31, 2010 and 2009 as follows (in thousands):
| 2010 | 2009 | |||||||
| Net current deferred tax asset |
$ | 2,757 | $ | 2,187 | ||||
| Non-current deferred tax assets |
661 | 683 | ||||||
| Non-current deferred tax liabilities, |
(778 | ) | (921 | ) | ||||
| Net non-current deferred tax (liabilities)/assets reflected on the balance sheet |
(117 | ) | (238 | ) | ||||
| Total net deferred tax assets |
$ | 2,640 | $ | 1,949 | ||||
As a result of our history of taxable income and the nature of the items from which deferred tax assets are derived, management believes that it is more likely than not that we will realize the benefit of our deferred tax assets. 2007 through 2009 are open tax years for federal income taxes. 2006 through 2009 are open tax years for Texas franchise taxes. In 2010, the Internal Revenue Service (“IRS”) initiated an examination of our 2008 federal income tax return. The IRS ceased working on the examination prior to its scheduled completion date. We do not know when the examination, which we consider to be ongoing, will conclude.
F-17
Table of Contents
WESTWOOD HOLDINGS GROUP, INC. AND SUBSIDIARIES
NOTES TO CONSOLIDATED FINANCIAL STATEMENTS – (Continued)
8. REGULATORY CAPITAL REQUIREMENTS:
Westwood Trust is subject to the capital requirements of the Texas Department of Banking and has a minimum capital requirement of $1.0 million. At December 31, 2010, Westwood Trust had total stockholders’ equity of approximately $12.4 million, which is $11.4 million in excess of its minimum capital requirement.
Westwood Trust is limited under applicable Texas law in the payment of dividends to undivided profits, which is that part of equity capital equal to the balance of net profits, income, gains and losses since formation date minus subsequent distributions to stockholders and transfers to surplus or capital under share dividends or appropriate Board resolutions. At the discretion of its board of directors, Westwood Trust has made quarterly and special dividend payments to us out of its undivided profits.
9. EMPLOYEE BENEFITS:
We have issued stock options and restricted shares to our employees, non-employee directors and a non-employee consultant and offer 401(k) matching and profit sharing contributions to our employees. The Plan reserves shares of Westwood common stock for issuance to eligible employees, directors and consultants of Westwood or its subsidiaries in the form of restricted stock and stock options. The total number of shares that may be issued under the Plan (including predecessor plans to the Plan) may not exceed 2,648,100 shares. In the event of a change in control of Westwood, the Plan contains provisions providing for the acceleration of the vesting of restricted stock and stock options. At December 31, 2010, approximately 331,000 shares remain available for issuance under the Plan.
The following table presents the total stock-based compensation expense we recorded and the total income tax benefit recognized for stock-based compensation arrangements for the years indicated (in thousands):
| 2010 | 2009 | 2008 | ||||||||||
| Total stock based compensation expense |
$ | 9,269 | $ | 7,666 | $ | 6,735 | ||||||
| Total income tax benefit recognized related to stock-based compensation |
3,497 | 3,699 | 4,184 | |||||||||
Restricted Stock
Under the Plan, we have granted restricted stock to employees and non-employee directors, which are subject to a service condition, and to our Chief Executive Officer and Chief Investment Officer, which are subject to a service condition and performance goals. Until the shares vest, they are restricted from sale, transfer or assignment in accordance with the terms of the agreements under which they were issued. We calculate compensation cost for restricted stock grants by using the fair market value of our common stock at the date of grant, the number of shares issued and an estimate of shares that will not vest due to forfeitures. This compensation cost is amortized on a straight-line basis over the applicable vesting period. As of December 31, 2010, there was approximately $17.7 million of unrecognized compensation cost, which we expect to recognize over a weighted-average period of 2.0 years. In order to satisfy tax liabilities that employees will owe on their shares that vest, we may withhold a sufficient number of vested shares from employees on the date vesting occurs. We estimate that approximately 80,000 shares could potentially be withheld in 2011 for this purpose. Our two types of restricted stock grants are discussed below.
Employee and non-employee director restricted share grants
For the years ended December 31, 2010, 2009 and 2008, we granted restricted stock to employees and non-employee directors. The employees’ shares vest over four years and the directors’ vest over one year. The following table details the status and changes in our restricted stock grants that are subject only to a service condition for the year ended December 31, 2010:
F-18
Table of Contents
WESTWOOD HOLDINGS GROUP, INC. AND SUBSIDIARIES
NOTES TO CONSOLIDATED FINANCIAL STATEMENTS – (Continued)
| Restricted shares subject only to a service condition: |
Shares | Weighted Average Grant Date Fair Value |
||||||
| Non-vested, January 1, 2010 |
549,150 | $ | 31.62 | |||||
| Granted |
216,500 | 39.06 | ||||||
| Vested |
(191,150 | ) | 30.62 | |||||
| Forfeited |
(23,400 | ) | 33.17 | |||||
| Non-vested, December 31, 2010 |
551,100 | 34.83 | ||||||
The following table shows the weighted-average grant date fair value for shares granted and the total fair value of shares vested during the years indicated:
| Restricted shares subject only to a service condition: |
2010 | 2009 | 2008 | |||||||||
| Weighted-average grant date fair value |
$ | 39.06 | $ | 31.15 | $ | 36.51 | ||||||
| Fair value of shares vested (in thousands) |
$ | 7,026 | $ | 8,020 | $ | 8,675 | ||||||
CEO and CIO performance-based restricted share grants
Under the Plan, we granted restricted shares to our Chief Executive Officer and Chief Investment Officer that vest over five and six years, respectively, provided annual performance goals established by the Compensation Committee of Westwood’s board of directors are met. For the year ended December 31, 2010, the officers became vested in the applicable percentage of their restricted shares since Westwood’s adjusted pre-tax income for 2010 was at least $14,774,000, representing a compound annual growth rate of 10% over the adjusted pre-tax income for the year 2005. Each year during the applicable vesting period, the Compensation Committee will establish a specific goal for that year’s vesting of the restricted shares, which is based upon Westwood’s adjusted pre-tax income, as defined. If the performance goal is not met in any year during the vesting period, the Compensation Committee may establish a goal for a subsequent vesting period, which, if achieved or exceeded, may result in full or partial vesting of the shares that did not otherwise become vested in a prior year. In no event will the maximum number of shares which may become vested over the vesting period exceed 175,000 shares in the case of our Chief Executive Officer or 300,000 shares in the case of our Chief Investment Officer. If a portion of the performance-based restricted shares do not vest, no compensation expense is recognized for that portion and any previously recognized compensation expense related to shares that do not vest would be reversed.
| Restricted shares subject to service and performance conditions: |
Shares | Weighted Average Grant Date Fair Value |
||||||
| Non-vested, January 1, 2010 |
100,000 | $ | 18.81 | |||||
| Granted |
175,000 | 39.90 | ||||||
| Vested |
(85,000 | ) | 27.49 | |||||
| Forfeited |
— | — | ||||||
| Non-vested, December 31, 2010 |
190,000 | $ | 34.35 | |||||
The following table shows the weighted-average grant date fair value for shares granted and the total fair value of shares vested during the years indicated:
| Restricted shares subject to a service and performance condition: |
2010 | 2009 | 2008 | |||||||||
| Weighted-average grant date fair value |
$ | 39.90 | $ | — | $ | — | ||||||
| Fair value of shares vested (in thousands) |
$ | 3,397 | $ | 2,942 | $ | 2,797 | ||||||
F-19
Table of Contents
WESTWOOD HOLDINGS GROUP, INC. AND SUBSIDIARIES
NOTES TO CONSOLIDATED FINANCIAL STATEMENTS – (Continued)
Because the performance goal was met in 2010, the shares are vested in substance but require certification by our Compensation Committee, at which time a share price will be determined for tax purposes. As a result, we estimate that the total fair value of the shares that vested in 2010 was approximately $3,397,000, which uses a share price of $39.96, the closing price of our stock as of the last business day of 2010.
Stock Options
Options granted under the Plan have a maximum ten-year term and vest over a period of four years. Options exercised represent newly issued shares. Westwood’s outstanding stock options, which are all exercisable, have exercise prices of $12.90 and $13.03 and a weighted-average remaining contractual life of 1.5 years. A summary of the status of Westwood’s outstanding stock options as of December 31, 2010, 2009 and 2008 is presented below.
| December 31, 2010 | December 31, 2009 | December 31, 2008 | ||||||||||||||||||||||
| Underlying Shares |
Weighted Average Exercise Price |
Underlying Shares |
Weighted Average Exercise Price |
Underlying Shares |
Weighted Average Exercise Price |
|||||||||||||||||||
| Outstanding, beginning of period |
54,900 | $ | 12.90 | 57,400 | $ | 12.93 | 77,300 | $ | 12.92 | |||||||||||||||
| Granted |
— | — | — | — | — | — | ||||||||||||||||||
| Exercised |
(16,500 | ) | 12.90 | (2,500 | ) | 12.93 | (19,900 | ) | 12.90 | |||||||||||||||
| Forfeited |
— | — | — | — | — | — | ||||||||||||||||||
| Outstanding, end of period |
38,400 | 12.90 | 54,900 | 12.90 | 57,400 | 12.93 | ||||||||||||||||||
| Exercisable, end of period |
38,400 | 12.90 | 54,900 | 12.90 | 57,400 | 12.93 | ||||||||||||||||||
| Intrinsic value – outstanding and exercisable |
$ | 1,039,000 | $ | 1,286,000 | $ | 888,000 | ||||||||||||||||||
The following table displays information for Westwood stock options exercised for the periods presented (in thousands):
| For the years ended | ||||||||||||
| 2010 | 2009 | 2008 | ||||||||||
| Total intrinsic value of options exercised |
$ | 425 | $ | 63 | $ | 605 | ||||||
| Cash received from the exercise of stock options |
213 | 33 | 257 | |||||||||
Westwood Holdings Group, Inc. Savings Plan
Westwood has a defined contribution 401(k) and profit sharing plan that was adopted in July 2002 and covers all of our employees. Discretionary employer profit sharing contributions become fully vested after six years of service by the participant. For the 401(k) portion of the plan, Westwood provided a match of up to 6% of eligible compensation. These 401(k) matching contributions vest immediately.
The following table displays our profit sharing and 401(k) contributions for the periods presented (in thousands):
| For the years ended | ||||||||||||
| 2010 | 2009 | 2008 | ||||||||||
| Profit sharing contributions |
$ | 477 | $ | 372 | $ | 575 | ||||||
| 401(k) matching contributions |
679 | 546 | 524 | |||||||||
F-20
Table of Contents
WESTWOOD HOLDINGS GROUP, INC. AND SUBSIDIARIES
NOTES TO CONSOLIDATED FINANCIAL STATEMENTS – (Continued)
10. EARNINGS PER SHARE:
Basic earnings per common share (“EPS”) is computed by dividing net income available to common stockholders by the weighted average number of shares outstanding. Diluted EPS is computed based on the weighted average number of shares outstanding plus the effect of the dilutive shares of restricted stock and stock options granted to employees and non-employee directors and contingently issuable shares.
Under FASB ASC No. 620, Earnings Per Share (“ASC 620’), shares of unvested restricted stock that contain non-forfeitable rights to dividends are treated as participating securities, which requires allocating a portion of net income to those shares as if they were a separate class of stock, which reduces net income available to common stockholders. Prior to the third quarter 2010, shares of unvested restricted stock contained non-forfeitable rights to dividends and accordingly were participating securities. EPS presented for the years ended December 31, 2009 and 2008 are different than those reported previously due to the use of the two-class method. The retrospective impact of adopting the guidance in ASC 620 reduced basic earnings per share from $1.25 to $1.10 in 2009 and from $1.73 to $1.53 in 2008 and diluted earnings per share from $1.18 to $1.09 in 2009 and from $1.63 to $1.52 in 2008. In the third quarter of 2010, the Plan was modified such that dividends on unvested restricted shares no longer contain non-forfeitable rights to dividends, which removes the requirements to treat such shares as a separate class of stock and to allocate a portion of net income to such shares for the third quarter and future periods. There were no anti-dilutive restricted shares or options as of December 31, 2010, 2009 or 2008.
The following table sets forth the computation of basic and diluted earnings per share (in thousands, except per share and share amounts):
| 2010 | 2009 | 2008 | ||||||||||
| Net income |
$ | 11,280 | $ | 7,895 | $ | 10,543 | ||||||
| Less: Income allocated to participating restricted shares |
(576 | ) | (938 | ) | (1,223 | ) | ||||||
| Net income available to common stockholders |
$ | 10,704 | $ | 6,957 | $ | 9,320 | ||||||
| Weighted average shares outstanding – basic |
6,606,281 | 6,339,791 | 6,107,807 | |||||||||
| Dilutive potential shares from unvested restricted shares |
121,110 | — | — | |||||||||
| Dilutive contingently issuable shares |
46,610 | — | — | |||||||||
| Dilutive potential shares from stock options |
21,350 | 27,197 | 33,379 | |||||||||
| Weighted average shares outstanding – diluted |
6,795,351 | 6,366,988 | 6,141,186 | |||||||||
| Earnings per share: |
||||||||||||
| Basic |
$ | 1.62 | $ | 1.10 | $ | 1.53 | ||||||
| Diluted |
$ | 1.58 | $ | 1.09 | $ | 1.52 | ||||||
11. VARIABLE INTEREST ENTITIES
Westwood Trust sponsors common trust funds (“CTFs”) for its clients. These funds allow clients to commingle assets to achieve economies of scale. Westwood Management provides investment advisory services to the WHG Funds, a family of mutual funds. Some clients of Westwood Management acquired in the McCarthy acquisition hold their investments in ten LLCs and two limited partnerships that were formed and sponsored by McCarthy. Westwood Management provides investment advisory services to the McCarthy Multi-Cap Stock Fund, which was reorganized into the WHG Dividend Growth Fund in February 2011. The CTFs, WHG Funds, LLCs, partnerships and McCarthy Multi-Cap Stock Fund (Westwood VIEs) are considered VIEs because our clients, who hold the equity at risk, do not have direct or indirect ability through voting or similar rights to make decisions about the funds that have a significant effect on their success. We receive management fees for managing assets in these entities commensurate with market rates.
We evaluate all of our advisory relationships and CTFs to determine whether or not we qualify as the primary beneficiary based on whether there is an obligation to absorb the majority of the expected losses or a right to receive the majority of the residual returns. Since all losses and returns are distributed to the shareholders of the Westwood VIEs, we are not the primary beneficiary. Consequently, the Westwood VIEs are not consolidated into our financial statements.
F-21
Table of Contents
WESTWOOD HOLDINGS GROUP, INC. AND SUBSIDIARIES
NOTES TO CONSOLIDATED FINANCIAL STATEMENTS – (Continued)
We have not provided any financial support that we were not previously contractually obligated to provide and there are no arrangements that would require us to provide additional financial support to any of these variable interest entities. Our investments in the WHG Funds and the CTFs are accounted for as investments in accordance with our other investments described in “Note. 4 INVESTMENTS”. We recognized fee revenue from the Westwood VIEs of approximately $16.7 million, $12.1 million and $11.5 million for the twelve months ended December 31, 2010, 2009 and 2008, respectively. The following table displays the assets under management, amount of corporate money invested and risk of loss in each vehicle (in millions).
| As of December 31, 2010 | ||||||||||||
| Assets Under Management |
Corporate Investment |
Risk of Loss |
||||||||||
| WHG Funds |
$ | 902 | $ | 2.7 | $ | 2.7 | ||||||
| Common Trust Funds |
1,631 | 2.6 | 2.6 | |||||||||
| LLCs |
443 | — | — | |||||||||
| Partnerships |
27 | — | — | |||||||||
| McCarthy Multi-Cap Stock Fund |
68 | — | — | |||||||||
12. COMMITMENTS AND CONTINGENCIES:
We lease our offices under a non-cancelable operating lease agreement. Rental expense for facilities and equipment leases for years ended December 31, 2010, 2009 and 2008 aggregated approximately $682,000, $687,000 and $729,000 respectively, and is included in general and administrative and information technology expenses in the accompanying consolidated statements of income.
At December 31, 2010, the future contractual rental payments for non-cancelable operating leases for each of the following five years and thereafter follow (in thousands):
| Year ending: |
||||
| 2011 |
$ | 404 | ||
| 2012 |
1,003 | |||
| 2013 |
1,001 | |||
| 2014 |
939 | |||
| 2015 |
859 | |||
| Thereafter |
5,318 | |||
| Total payments due |
$ | 9,524 | ||
13. SEGMENT REPORTING:
We operate two segments: Westwood Management and Westwood Trust. These segments are managed separately based on the types of products and services offered and their related client bases. We evaluate the performance of our segments based primarily on income before income taxes. The entity Westwood Holdings, the parent company of Westwood Management and Westwood Trust, does not have revenues or employees and is the entity in which we record stock-based compensation expense.
F-22
Table of Contents
WESTWOOD HOLDINGS GROUP, INC. AND SUBSIDIARIES
NOTES TO CONSOLIDATED FINANCIAL STATEMENTS – (Continued)
Westwood Management
Westwood Management provides investment advisory services to corporate retirement plans, public retirement plans, endowments, foundations, individuals and the WHG Funds, as well as investment subadvisory services to mutual funds and clients of Westwood Trust.
Westwood Trust
Westwood Trust provides trust and custodial services and participation in common trust funds that it sponsors to institutions and high net worth individuals.
All segment accounting policies are the same as those described in the summary of significant accounting policies. Intersegment balances that eliminate in consolidation have been applied to the appropriate segment.
| Westwood Management |
Westwood Trust |
Westwood Holdings |
Eliminations | Consolidated | ||||||||||||||||
| 2010 |
||||||||||||||||||||
| Net revenues from external sources |
$ | 43,253 | $ | 12,060 | $ | — | $ | — | $ | 55,313 | ||||||||||
| Net intersegment revenues |
4,183 | 17 | — | (4,200 | ) | — | ||||||||||||||
| Net interest and dividend revenue |
291 | 4 | — | — | 295 | |||||||||||||||
| Depreciation and amortization |
307 | 122 | — | — | 429 | |||||||||||||||
| Income (loss) before income taxes |
25,287 | 1,703 | (9,269 | ) | — | 17,721 | ||||||||||||||
| Income tax expense (benefit) |
8,931 | 665 | (3,155 | ) | — | 6,441 | ||||||||||||||
| Segment assets |
61,014 | 13,117 | (1,503 | ) | — | 72,628 | ||||||||||||||
| Segment goodwill |
5,245 | 6,036 | — | — | 11,281 | |||||||||||||||
| Expenditures for long-lived assets |
60 | 77 | — | — | 137 | |||||||||||||||
| 2009 |
||||||||||||||||||||
| Net revenues from external sources |
$ | 32,243 | $ | 10,310 | $ | — | $ | — | $ | 42,553 | ||||||||||
| Net intersegment revenues |
3,476 | 12 | — | (3,488 | ) | — | ||||||||||||||
| Net interest and dividend revenue |
355 | 7 | — | — | 362 | |||||||||||||||
| Depreciation and amortization |
196 | 58 | — | — | 254 | |||||||||||||||
| Income (loss) before income taxes |
17,707 | 2,277 | (7,666 | ) | — | 12,318 | ||||||||||||||
| Income tax expense (benefit) |
6,160 | 840 | (2,577 | ) | — | 4,423 | ||||||||||||||
| Segment assets |
50,687 | 4,001 | 5,198 | — | 59,886 | |||||||||||||||
| Segment goodwill |
3,403 | 512 | — | — | 3,915 | |||||||||||||||
| Expenditures for long-lived assets |
62 | 24 | — | — | 86 | |||||||||||||||
| 2008 |
||||||||||||||||||||
| Net revenues from external sources |
$ | 35,367 | $ | 11,089 | $ | — | $ | — | $ | 46,456 | ||||||||||
| Net intersegment revenues |
3,950 | 8 | — | (3,958 | ) | — | ||||||||||||||
| Net interest and dividend revenue |
689 | 71 | — | — | 760 | |||||||||||||||
| Depreciation and amortization |
174 | 58 | — | — | 232 | |||||||||||||||
| Income (loss) before income taxes |
20,983 | 2,287 | (6,735 | ) | — | 16,535 | ||||||||||||||
| Income tax expense (benefit) |
7,445 | 871 | (2,324 | ) | — | 5,992 | ||||||||||||||
| Segment assets |
41,740 | 4,821 | 4,286 | — | 50,847 | |||||||||||||||
| Segment goodwill |
1,790 | 512 | — | — | 2,302 | |||||||||||||||
| Expenditures for long-lived assets |
118 | 35 | — | — | 153 | |||||||||||||||
F-23
Table of Contents
WESTWOOD HOLDINGS GROUP, INC. AND SUBSIDIARIES
NOTES TO CONSOLIDATED FINANCIAL STATEMENTS – (Continued)
14. CONCENTRATION:
For the years ended December 31, 2010, 2009 and 2008, our four largest clients accounted for 12.2%, 13.1% and 31.0% of our fee revenue, respectively. During the years ended December 31, 2010 and 2009, no customer accounted for 10% or more of our revenues. Our largest client for the year ended December 31, 2008 accounted for 19.5% our fee revenues.
| (in thousands) |
Years ended December 31, | |||||||||||
| 2010 | 2009 | 2008 | ||||||||||
| Advisory fees from Westwood Management’s largest client*: |
||||||||||||
| Asset-based fees |
$ | 196 | $ | 267 | $ | 453 | ||||||
| Performance-based fees |
— | — | 8,645 | |||||||||
| Percent of fee revenue |
0.4 | % | 0.6 | % | 19.5 | % | ||||||
| * | This client was not our largest client in 2010 or 2009. |
15. SUBSEQUENT EVENTS:
On February 3, 2011, we declared a quarterly cash dividend of $0.35 per share on common stock payable on April 1, 2011 to stockholders of record on March 15, 2011.
On February 23, 2011, we issued 211,220 shares of restricted stock to employees at a price of $36.95 per share. The shares are subject to vesting conditions described in “Note. 9 EMPLOYEE BENEFITS” of these financial statements.
16. QUARTERLY FINANCIAL DATA (Unaudited):
The following is a summary of unaudited quarterly results of operations for the years ended December 31, 2010 and 2009 (in thousands, except per share amounts):
| Quarter | ||||||||||||||||
| First | Second | Third | Fourth | |||||||||||||
| 2010 |
||||||||||||||||
| Revenues |
$ | 13,216 | $ | 13,194 | $ | 13,473 | $ | 15,430 | ||||||||
| Income before income taxes |
4,553 | 3,940 | 4,111 | 5,117 | ||||||||||||
| Net income |
2,933 | 2,493 | 2,599 | 3,255 | ||||||||||||
| Basic earnings per common share |
0.40 | 0.34 | 0.39 | 0.48 | ||||||||||||
| Diluted earnings per common share |
0.40 | 0.34 | 0.38 | 0.46 | ||||||||||||
| 2009 |
||||||||||||||||
| Revenues |
$ | 8,217 | $ | 9,972 | $ | 11,641 | $ | 12,723 | ||||||||
| Income before income taxes |
1,929 | 2,504 | 3,598 | 4,287 | ||||||||||||
| Net income |
1,230 | 1,630 | 2,314 | 2,721 | ||||||||||||
| Basic earnings per common share* |
0.15 | 0.23 | 0.32 | 0.38 | ||||||||||||
| Diluted earnings per common share* |
0.15 | 0.23 | 0.32 | 0.38 | ||||||||||||
| * | Please see “Note 10. EARNINGS PER SHARE” of these financial statements for a discussion of the two-class method of calculating earnings per share and the effect on our disclosures. |
F-24
Table of Contents
INDEX TO EXHIBITS
| Exhibit |
Description of Exhibits | |
| 3.1 | Amended and Restated Certificate of Incorporation of Westwood Holdings Group, Inc. (10) | |
| 3.2 | Amended and Restated Bylaws of Westwood Holdings Group, Inc. (6) | |
| 4.1 | Form of Common Stock Certificate of Westwood Holdings Group, Inc. (3) | |
| 10.1 | Third Amended and Restated Westwood Holdings Group, Inc. Stock Incentive Plan (including related forms of Stock Option Agreement and Restricted Stock Agreement) (7)+ | |
| 10.2 | Amendment to Third Amended and Restated Westwood Holdings Group, Inc. Stock Incentive Plan (including related form of Restricted Stock Agreement) (11)+ | |
| 10.3 | Tax Separation Agreement between SWS Group, Inc. and Westwood Holdings Group, Inc. (2) | |
| 10.4 | Office Lease between Westwood Management Corp. and Crescent Real Estate Funding I, L.P., dated as of April 4, 1990, and amendment thereto (4) | |
| 10.5 | Ninth Modification of Office Lease between Westwood Management Corp. and Crescent Real Estate Funding I, dated as of November 25, 2003 (5) | |
| 10.6 | Tenth Modification of Office Lease between Westwood Management Corp. and Crescent Real Estate Funding I, dated as of February 23, 2004 (5) | |
| 10.7 | Eleventh Modification of Office Lease between Westwood Management Corp. and Crescent Real Estate Funding I, dated as of December 9, 2010 (1) | |
| 10.8 | Software License Agreement between Infovisa and Westwood Trust, dated as of December 1, 2001 (4) | |
| 10.9 | Software License and Support Agreement between Advent Software, Inc. and Westwood Management Corp., dated as of December 30, 1996 (4) | |
| 10.10 | Form of Indemnification Agreement for Westwood Holdings Group, Inc. (5)+ | |
| 10.11 | Form of Indemnification Agreement for Westwood Management Corp. (5)+ | |
| 10.12 | Form of Indemnification Agreement for Westwood Trust (5)+ | |
| 10.13 | Executive Employment Agreement between Westwood Holdings Group, Inc. and Susan M. Byrne (8)+ | |
| 10.14 | Executive Employment Agreement between Westwood Holdings Group, Inc. and Brian O. Casey (9)+ | |
| 10.15 | Restricted Stock Agreement between Westwood Holdings Group, Inc. and Brian O. Casey (9)+ | |
| 10.16 | Schedule of Director Compensation (1) | |
| 21.1 | Subsidiaries (4) | |
| 23.1 | Consent of Grant Thornton (1) | |
| 24.1 | Power of Attorney (included on first signature page) (1) | |
| 31.1 | Certification of the Chief Executive Officer of Westwood required by Section 302 of the Sarbanes-Oxley Act of 2002 (1) | |
| 31.2 | Certification of the Chief Financial Officer of Westwood required by Section 302 of the Sarbanes-Oxley Act of 2002 (1) | |
| 32.1 | Certification of Chief Executive Officer Pursuant to 18 U.S.C. Section 1350, as Adopted Pursuant to Section 906 of the Sarbanes-Oxley Act of 2002 (1)# | |
| 32.2 | Certification of Chief Financial Officer Pursuant to 18 U.S.C. Section 1350, as Adopted Pursuant to Section 906 of the Sarbanes-Oxley Act of 2002 (1)# | |
| (1) | Filed herewith. |
| (2) | Incorporated by reference from Amendment No. 5 to Registration Statement on Form 10/A filed with the Securities and Exchange Commission on June 6, 2002. |
| (3) | Incorporated by reference from Amendment No. 2 to Registration Statement on Form 10/A filed with the Securities and Exchange Commission on April 30, 2002. |
| (4) | Incorporated by reference from the Registration Statement on Form 10 filed with the Securities and Exchange Commission on February 8, 2002. |
| (5) | Incorporated by reference from Form 10-K filed with the Securities and Exchange Commission for the fiscal year ended December 31, 2003. |
| (6) | Incorporated by reference from Form 8-K filed with the Securities and Exchange Commission on October 25, 2005. |
| (7) | Incorporated by reference from Form S-8 filed with the Securities and Exchange Commission on July 1, 2009. |
| (8) | Incorporated by reference from Form 8-K filed with the Securities and Exchange Commission on July 28, 2006. |
| (9) | Incorporated by reference from Form 8-K filed with the Securities and Exchange Commission on April 23, 2010. |
| (10) | Incorporated by reference from Form 8-K filed with the Securities and Exchange Commission on May 7, 2008. |
| (11) | Incorporated by reference from Form 10-Q filed with the Securities and Exchange Commission on October 21, 2010. |
| + | Indicates management contract or compensation plan, contract or arrangement. |
| # | Pursuant to Item 601(b)(32) of SEC Regulation S-K, these exhibits are furnished rather than filed with this Report. |