Attached files
Table of Contents
UNITED STATES
SECURITIES AND EXCHANGE COMMISSION
Washington, D.C. 20549
FORM 10-K
| x | ANNUAL REPORT PURSUANT TO SECTION 13 OR 15(d) OF THE SECURITIES EXCHANGE ACT OF 1934 |
For the fiscal year ended December 31, 2010
OR
| ¨ | TRANSITION REPORT PURSUANT TO SECTION 13 OR 15(d) OF THE SECURITIES EXCHANGE ACT OF 1934 |
For the transition period from to
CATALYST HEALTH SOLUTIONS, INC.
(Exact name of registrant as specified in its charter)
| Delaware | 0-31014 | 52-2181356 | ||
| (State or other jurisdiction of incorporation or organization) |
(Commission file number) |
(I.R.S. Employer Identification No.) |
800 King Farm Boulevard, Rockville, Maryland 20850
(Address of principal executive offices, Zip Code)
Registrant’s telephone number, including area code: (301) 548-2900
Securities registered pursuant to section 12(b) of the Act:
| Title of each class |
Name of each exchange on which registered | |
| Common Stock, $0.01 par value | NASDAQ Global Select Market |
Securities registered pursuant to 12(g) of the Act: None
Indicate by check mark if the registrant is a well-known seasoned issuer, as defined in Rule 405 of the Securities Act. Yes x No ¨
Indicate by check mark if the registrant is not required to file reports pursuant to Section 13 or Section 15(d) of the Act. Yes ¨ No x
Indicate by check mark whether the registrant (1) has filed all reports required to be filed by Section 13 or 15(d) of the Securities Exchange Act of 1934 during the preceding 12 months (or for such shorter period that the registrant was required to file such reports), and (2) has been subject to such filing requirements for the past 90 days. Yes x No ¨
Indicate by check mark whether the registrant has submitted electronically and posted on its corporate Web site, if any, every Interactive Data File required to be submitted and posted pursuant to Rule 405 of Regulation S-T (§232.405 of this chapter) during the preceding 12 months (or for such shorter period that the registrant was required to submit and post such files). Yes x No ¨
Indicate by check mark if disclosure of delinquent filers pursuant to Item 405 of Regulation S-K (§229.405 of this chapter) is not contained herein, and will not be contained, to the best of the registrant’s knowledge, in definitive proxy or information statements incorporated by reference in Part III of this Form 10-K or any amendment to this Form 10-K. x
Indicate by check mark whether the registrant is a large accelerated filer, an accelerated filer, a non-accelerated filer, or a smaller reporting company. See the definitions of “large accelerated filer,” “accelerated filer” and “smaller reporting company” in Rule 12b-2 of the Exchange Act:
| Large accelerated filer | x | Accelerated filer | ¨ | |||
| Non-accelerated filer | ¨ | Smaller reporting company | ¨ | |||
Indicate by check mark whether the registrant is a shell company (as defined in Rule 12b-2 of the Act). Yes ¨ No x
The aggregate market value of the voting and non-voting common equity held by non-affiliates of the registrant as of June 30, 2010 was $1,311,024,047 based on the closing price of $34.50 as reported on the NASDAQ Global Select Market. Solely for the purposes of this calculation, directors and officers of the registrant are deemed to be affiliates.
As of February 15, 2011, there were 44,992,432 shares outstanding of the registrant’s $0.01 par value common stock.
Documents incorporated by reference:
The Company’s Proxy Statement for its annual meeting of stockholders to be held on June 1, 2011, a definitive copy of which will be filed within 120 days of December 31, 2010, is incorporated by reference in Part III of this Report on Form 10-K.
Table of Contents
Catalyst Health Solutions, Inc.
Form 10-K
December 31, 2010
| Page | ||||||
| PART I |
||||||
| Item 1. |
1 | |||||
| Item 1A. |
19 | |||||
| Item 1B. |
25 | |||||
| Item 2. |
25 | |||||
| Item 3. |
26 | |||||
| Item 4. |
26 | |||||
| PART II |
||||||
| Item 5. |
27 | |||||
| Item 6. |
29 | |||||
| Item 7. |
Management’s Discussion and Analysis of Financial Condition and Results of Operations |
30 | ||||
| Item 7A. |
40 | |||||
| Item 8. |
41 | |||||
| Item 9. |
Changes in and Disagreements with Accountants on Accounting and Financial Disclosure |
41 | ||||
| Item 9A. |
41 | |||||
| Item 9B. |
42 | |||||
| PART III |
||||||
| Item 10. |
43 | |||||
| Item 11. |
43 | |||||
| Item 12. |
Security Ownership of Certain Beneficial Owners and Management and Related Stockholder Matters |
43 | ||||
| Item 13. |
Certain Relationships and Related Transactions, and Director Independence |
43 | ||||
| Item 14. |
43 | |||||
| PART IV |
||||||
| Item 15. |
44 | |||||
Table of Contents
Special Note Regarding Forward Looking Statements
This Form 10-K, including documents incorporated by reference, may contain certain forward-looking statements including, without limitation, statements concerning Catalyst Health Solutions, Inc.’s (the “Company,” “our,” “we” or “us”) operations, economic performance and financial condition. These forward-looking statements are made pursuant to the safe harbor provisions of the Private Securities Litigation Reform Act of 1995 and within the meaning of Section 21E of the Securities Exchange Act of 1934, as amended. The words “believe,” “expect,” “anticipate,” “will,” “could,” “would,” “should,” “may,” “plan,” “estimate,” “intend,” “predict,” “potential,” “continue,” and the negatives of these words and other similar expressions generally identify forward-looking statements. These forward-looking statements may include statements addressing our operations and our financial performance. Readers are cautioned not to place undue reliance on these forward-looking statements, which, among other things, speak only as of their dates. These forward-looking statements are based largely on our current expectations and are based on a number of risks and uncertainties, including, without limitation, (i) general adverse economic conditions; (ii) changes in governmental laws and regulations; (iii) our ability to compete effectively in the pharmacy benefit management industry; (iv) our relationships with key clients, pharmacy network affiliations and various pharmaceutical manufacturers and rebate intermediaries; (v) changes in industry pricing benchmarks; (vi) uncertainties relating to the transition and integration of completed and future acquisitions and/or expansion; (vii) our current level of indebtedness and any future indebtedness we may incur; (viii) disruption in our operations; (ix) unanticipated changes in our ability to execute our growth strategy; (x) generic utilization levels; (xi) insufficient insurance coverage to cover costs associated with litigation and those risks identified under Item 1A “Risk Factors” and elsewhere in this Form 10-K, including the documents incorporated by reference. Actual results could differ materially from results referred to in the forward-looking statements. In light of these risks and uncertainties, there can be no assurances that the results referred to in the forward-looking statements contained in this Form 10-K will, in fact, occur. We undertake no obligation to revise any forward-looking statements in order to reflect events or circumstances that may arise after the date of this Report. Readers are urged to carefully review and consider the various disclosures made in this Form 10-K and in our other filings with the Securities and Exchange Commission, or SEC, that attempt to advise interested parties of the risks and factors that may affect our business.
Table of Contents
PART I
THE COMPANY
| ITEM 1. | BUSINESS |
The following description of our business should be read in conjunction with the information included elsewhere in this Form 10-K for the year ended December 31, 2010. This description contains forward-looking statements that involve risks and uncertainties. Our actual results could differ significantly from the results discussed in the forward-looking statements due to the factors set forth in “Risk Factors” and elsewhere in this Form 10-K. References in this Form 10-K to “we,” “our,” “us,” or the “Company,” refer to Catalyst Health Solutions, Inc.
Overview
Catalyst Health Solutions, Inc. is a full-service pharmacy benefit management, or PBM, company. We operate primarily under the brand name Catalyst Rx. We are built on strong, innovative principles in the management of prescription drug benefits and our client-centered philosophy contributes to our industry-leading customer service and client retention rates. Our clients include self-insured employers, including state and local governments; managed care organizations, or MCOs; unions; third-party administrators, or TPAs; hospices; and individuals who contract with us to administer the prescription drug component of their overall health benefit programs.
We provide our clients access to a contracted, non-exclusive national network of approximately 63,000 pharmacies. Our primary business is to provide our clients and their members with timely and accurate benefit adjudication, while controlling pharmacy spending trends through customized plan designs, clinical programs, physician orientation programs, and member education. We use an electronic point-of-sale system of eligibility verification and plan design information and offer access to rebate arrangements for certain branded pharmaceuticals. When a member of one of our clients presents a prescription or health plan identification card to a retail pharmacist in our network, the system provides the pharmacist with access to online information regarding eligibility, patient history, health plan formulary listings, and contractual reimbursement rates. The member generally pays a co-payment to the retail pharmacy and the pharmacist fills the prescription. We electronically aggregate pharmacy benefit claims, which include prescription costs plus our claims processing fees for consolidated billing and payment. We receive payments from clients, including applicable claims processing fees, and make payments of amounts owed to the retail pharmacies pursuant to our negotiated rates. Total claims processed increased to 70.2 million in 2010 from 56.2 million in 2009. Our revenue increased by approximately 30% to $3.8 billion in 2010 from $2.9 billion in 2009.
Pharmacy benefit claim payments from our clients are recorded as revenue, and prescription costs to be paid to pharmacies are recorded as direct expenses. Under our network contracts, we generally have an independent obligation to pay pharmacies for the drugs dispensed and, accordingly, have assumed that risk independent of our clients. When we administer pharmacy reimbursement contracts and do not assume a credit risk, we record only our administrative or processing fees as revenue. Rebates earned under arrangements with manufacturers or third party intermediaries are predominately recorded as a reduction of direct expenses. The portion of manufacturer or third party intermediary rebates due to clients is recorded as a reduction of revenue.
We were incorporated in Delaware in 1999. Our principal executive offices are located at 800 King Farm Boulevard, 4th Floor, Rockville, Maryland 20850. Our telephone number is 301-548-2900.
Our Web site is www.chsi.com. We make available free of charge on or through the Web site our annual reports on Form 10-K, quarterly reports on Form 10-Q, current reports on Form 8-K and any amendments to those reports filed or furnished pursuant to Section 13(a) or 15(d) of the Exchange Act as soon as reasonably practicable after we electronically file such material with, or furnish it to, the SEC. This reference to our Web site is for the convenience of shareholders as required by the SEC and shall not be deemed to incorporate any information on the Web site into this Form 10-K or our other filings with the SEC.
Our Web site is also a key source of important information about us. We routinely post to the Investor Information section of our Web site important information about our business, our operating results and our financial condition and prospects, including, for example, information about important acquisitions and dispositions,
1
Table of Contents
our earnings releases and certain supplemental financial information related or complementary thereto. We also have a Corporate Governance page in the Investor Information section of our Web site that includes, among other things, copies of our Code of Ethics & Conduct and the charters for each standing committee of our Board of Directors, which currently are: the Audit Committee, the Compensation Committee, and the Ethics, Governance and Nominating Committee. Copies of our Bylaws and these charters and policies are also available in print to shareholders upon request.
The Industry
The PBM industry has developed and grown in response to trends of increased utilization and demand for pharmaceuticals, increased unit costs, broader application of prescription drugs to various conditions in recent years and changes due to health care reform legislation. These trends and other factors have combined to create a significant and recurring escalation in the cost of drug coverage offered by self-insured employers, including state and local governments, MCOs, unions, TPAs and hospices. In order to understand, manage and mitigate the effects of these trends, many of these payor organizations have contracted for the specialized services offered by PBMs. According to the journal Health Affairs, overall pharmacy expenditures in the United States are expected to be approximately $274.7 billion in 2011, a 5.6% increase over 2010. Also, while pharmacy expenditure increases have moderated since a peak period from the late 1990s through 2006, average annual increases of 6.3% are expected through 2019. Price growth is expected to contribute to more than 50% of the total of those expected spending increases, with the remainder resulting primarily from volume and utilization.
Factors contributing to the increase in pharmacy spending include:
| • | Greater reliance on drug therapy by the physician community; |
| • | Increased “preventative prescribing,” including the management of high cholesterol levels and digestive disorders; |
| • | Efforts by drug manufacturers to increase market share and extend single-source brand use; |
| • | The introduction of improvements over existing therapies, which normally carry higher unit prices than existing formulations; |
| • | Increased patient demand and education as a result of direct-to-consumer advertising and other pharmaceutical marketing or promotional efforts; |
| • | An aging workforce; |
| • | Increased obesity among all age groups; |
| • | Improved techniques and technology to detect and diagnose diseases; and |
| • | Increased utilization and rising costs of specialty drugs, which are high-cost drugs used to treat complex, serious and/or life-threatening conditions such as cancer and HIV/AIDS. |
PBMs are responsible for implementing and administering benefit plans that are care-effective and also seek to lower overall prescription spending by encouraging greater generic utilization, increasing the proportion of brand drugs dispensed from preferred categories and encouraging, where appropriate, non-prescription therapy and treatment alternatives. These objectives are accomplished through a combination of clinical, administrative, educational and technological initiatives directed towards pharmacies, physicians and members.
Over the past several years, plan designs have increasingly focused on the use of three-tier or four-tier co-payment structures. Co-payments represent that portion of the cost of a prescription paid for by the member at the time the drug is dispensed. The purpose of these tiered designs and the use of drug-specific formulary lists is to create financial incentives for members to utilize generic drugs where available and to select the most cost-effective brand drugs indicated for a specific diagnosis or condition. In general, these plans incorporate the lowest member co-payments for generic drugs, with increases in co-payments for preferred brand drugs and co-payments reaching their highest level for non-preferred brands. For example, under a typical three-tier payment structure, these categories might require member co-payments of $10, $25 and $40, respectively. The use of these tiered plans has increased significantly over the past decade and now applies to more than 90% of employer-sponsored members. In recent years, both the levels of member co-payment and the differential between tiers have continued to increase.
2
Table of Contents
Competition
We believe the primary competitive factors in our business are price, quality of service and scope of available services. Market share for PBM services in the United States is highly concentrated, with a few firms controlling more than 70% of prescription volume. These larger national and regional PBMs, such as Medco Health Solutions, Inc. (“Medco”), CVS/Caremark Rx, Inc. (“Caremark”) and Express Scripts, Inc. have significantly greater financial, marketing and technological resources at their disposal to expand client base and grow their business. Large health insurers and certain MCOs, drug retailers and physician practice management companies may also own their own PBM. However, in the midst of recent economic times, some have either sold, or are considering the sale, of their PBM capabilities in order to raise additional funding to support their core businesses.
Scale is a particularly important factor in negotiating prices with pharmacies and drug manufacturers. Although we have certain advantages to offset our relatively smaller scale, we could face more pricing competition in the future. Additionally, some of our services, such as disease management services, informed decision counseling services and medical information management services, also compete with those being offered by pharmaceutical manufacturers, specialized disease management companies and information service providers.
We have demonstrated our ability to serve a broad range of clients from large and regional managed care organizations, to employer groups, including state and local governments, to unions, third party administrators and hospices. We believe the following are our principal strengths and are critical to our ongoing competitiveness:
Customized Programs and Services – We believe it is important to provide our clients with customized solutions and recommendations made with their unique interests in mind. Accordingly, the formulary, plan designs and trend management solutions we suggest to clients are highly flexible and not influenced by manufacturer relationships.
Local Market Presence – Our local market presence in California, Colorado, Florida, Georgia, Hawaii, Iowa, Kentucky, Louisiana, Maryland, Michigan, Minnesota, Mississippi, Nevada, North Carolina, Ohio, Pennsylvania, Puerto Rico and Texas allows us to offer attractive benefit pricing based on local pharmacy network rates and formulary design. Through these local offices, we provide strategic account management and clinical services, including targeted member and physician education programs.
Information-Based Cost Containment Methods – Through the use of proprietary information technology systems we provide our clients and members with access to information on a rapid basis, which allows us to work with our clients and members in a collaborative fashion to manage the costs of their prescription drugs. For example, our Web-based reporting system allows clients to choose which metrics are most important to them for the purposes of evaluating their pharmacy program. We then produce and review these reports and provide recommendations for key performance indicators and targeted disease states. In addition, members can access our Web-based tools to evaluate their costs for selected drugs and pharmacies, compare drug and pharmacy alternatives including low cost retail programs and evaluate the savings opportunities represented by each. We believe these services allow us to further differentiate ourselves from our competitors.
Transparent Pricing – We offer transparent, flexible pricing solutions with full operational and financial audit rights. Our transparent pricing gives our clients the assurance that they have a complete understanding of the source of savings they are receiving and the total price they are paying for our services.
Lowest Net Cost Solutions – We offer clinically-based, flexible pharmacy benefit management solutions with a primary focus on providing the most effective therapy at the lowest net cost. Our continued commitment to innovation, efficiency, and superior member service has helped our clients balance the management of pharmacy costs with superior quality of care.
Our Business Strategy
We seek to continue to retain and grow our client base, manage drug expenditures and deliver innovative products and services. We intend to accomplish these strategies by capitalizing on our competitive strengths and helping to address the challenges confronting payors.
3
Table of Contents
Growing our PBM Client Base by Targeting Select Markets.
We have identified certain sectors of the market that provide us with the greatest opportunity for growth. We intend to focus our sales and marketing efforts to target these sectors in order to gain new clients and increase our membership base and revenues. Our analysis of the opportunities by market sector is as follows:
| • | Large Employer Groups (Self-Insured): Employers in this sector are large enough to need a full-service PBM solution to manage their increasing prescription drug costs. By utilizing our information-based cost-containment strategies and a greater level of client and customer service, we offer these clients favorable results compared to larger PBMs. |
| • | State and Local Governments: State and local governments are also employers who provide health benefits to their employees and retirees. Some state governments have a workforce and retiree population of comparable size to that of a Fortune 1000 employer. These clients seek the same customer service, attention to detail and bottom line results as private sector employers. Because the vast majority of members in this market sector are geographically concentrated, we can analyze the prescribing and utilization trends associated with the government entity and take measures designed to educate prescribing physicians and improve formulary compliance in a particular region. These physician interactions draw on peer-reviewed clinical studies, generic drug utilization patterns and the insights offered by the physicians themselves with the goal to deliver better care at lower costs. |
| • | MCOs: There are hundreds of MCOs that each provide coverage to fewer than 200,000 lives. We believe these mid-sized MCOs are increasingly dissatisfied with the level of service and results they receive from larger PBMs, as those companies devote most of their attention to much larger MCOs. We have demonstrated that we can provide these MCOs with a complete, full-service PBM solution that includes all of the features that larger PBMs offer, but with superior customer service, flexibility, market-specific retail networks and customized benefit plans. |
| • | Unions: According to the AFL-CIO, union members make up over 12% of the U.S. workforce and work in all types of jobs and industries. Union members include teachers, coal miners, construction workers, nurses, firefighters, musicians, engineers, electricians and more. Through collective bargaining, unions are able to negotiate for healthcare benefits that deliver a high quality of care with minimal member cost share. Unions are challenged with maintaining the same benefit standards while budgets and the union workforce face funding decreases due to the economy. We provide solutions that are aligned with the unions’ missions and values by delivering proven programs that reduce drug trend spending without shifting costs to beneficiaries. |
| • | Third-Party Administrators: There are hundreds of TPAs in the U.S. that focus primarily on administering the health benefits of their clients. TPAs provide services to millions of employees, dependents and retirees. As the TPA market continues to consolidate and TPA clients increasingly seek complete health benefits solutions from their TPAs, we believe an increasing number of TPAs will seek a PBM to administer the prescription benefits of their clients. |
| • | Hospices: The number of patients served through the hospice industry has grown dramatically over the past 10 years. According to the National Hospice and Palliative Care Organization, an estimated 1.6 million patients received services from hospice in 2009. We believe there are opportunities in this growth industry to help reduce the costs of care through improved operational efficiencies and economies of scale by partnering with an experienced PBM. |
Leveraging Local Market Dynamics to Build Customized Networks and Manage Drug Spending.
Although clients contract with us to provide PBM services nationwide, capitalizing on local and regional market dynamics is an effective way to manage drug spending and differentiate our PBM services from those offered by our competitors.
| • | Customized Pharmacy Networks: To obtain greater pharmacy discounts for our clients, we work with clients to identify pharmacies that will agree to deeper prescription discounts in a specific locality, based on the concentration of the client’s members in that area and the resulting store traffic those members represent to a drug, grocery, or retail drug store’s non-pharmacy business. To meet the unique needs of our clients, we have established customized pharmacy networks in many geographic regions, including |
4
Table of Contents
| Colorado, Florida, Georgia, Hawaii, Iowa, Kentucky, Louisiana, Maryland, Michigan, Mississippi, Nevada, North Carolina, Ohio, Pennsylvania, Puerto Rico, and Texas and are also expanding our customized networks in other parts of the country to support our growing client base. |
| • | Targeted Cost Management and Quality of Care Initiatives: We perform client-specific data analysis to monitor trends and develop insights and recommendations that result in improved care while reducing costs. These include negotiation of favorable prescription drug pricing, actively influencing the drivers of prescription drug utilization including member and prescriber education initiatives to maximize adherence, execution of targeted trend management programs, and monitoring clinical formulary and disease management trends. |
| • | Extensive Use of Internet Tools to Enhance Account Management Effectiveness: We provide our clients Web-enabled decision support tools for prescription benefit plan management, clinical evaluations, disease management and compliance monitoring. These data analysis and reporting capabilities allow clients to assess top-level trend information for total population management and to analyze detail for a particular drug, physician, member or pharmacy. This functionality enables clients to measure successes relative to formulary and disease management initiatives and assists in the identification of specific patient populations that may benefit from specialty or other pharmacy programs. In addition, members can access our Web-based tools which include benefit summary information, claims history, a drug pricing comparison feature that identifies lowest-cost pharmacies and medications, a therapeutic drug alternative search tool and a drug-to-drug interaction checker. |
Offering Our Clients a Variety of Specialized Services Focused On Improving Health Outcomes.
Comprehensive Spectrum of Clinical and Other Services – Our clinical service teams work closely with clients to design and administer pharmacy benefit plans that use formularies, plan design and other techniques to promote clinically appropriate and cost-effective drug usage. Our programs focus on helping payors control the high costs associated with prescription medications while providing their members with an exceptional level of personalized care that can lead to increased compliance with vital drug regimens and improved member satisfaction. We are often able to influence physician prescribing patterns by comparing their individual prescribing trends to those of other physician peer groups and encouraging change where practices differ from peer group norms and medical best practices. Because we operate with significant geographic focus, the consultations between our clinical pharmacists and local physicians tend to have higher levels of effectiveness compared with less concentrated initiatives. Similarly, our programs with retail pharmacies support therapeutic interchange programs that encourage the evaluation of cost-effective drug alternatives where appropriate. We also offer consulting services to assist clients in designing their benefit plan offering and in developing education and communication programs to support care and cost-effective prescription drug behavior. A more detailed description of selected clinical and other services we perform includes:
| • | Benefit Plan Design and Consultation: Our pharmacy professionals work with our clients to design benefit plans that meet the specific needs of our clients and their members. We seek to help maximize the quality of care members receive while controlling the cost of providing prescription pharmaceutical coverage by, among other efforts, creating financial incentives and reimbursement limitations on the drugs covered by our plan, offering generic utilization incentives and establishing reimbursement parameters on the amount of a drug that can be obtained in a specific period. |
| • | Formulary Administration: We seek to maximize the clinical appropriateness of all drugs covered by our plans. To do so, we actively seek to promote the use of drugs that our clients identify as the preferred prescription alternative for certain clinical conditions, thereby reducing unnecessary overuse of new drugs or reformulations of old drugs in inappropriate circumstances. |
| • | Formulary Compliance and Therapeutic Intervention Programs: We seek to encourage compliance with the formularies established in coordination with our clients and provide recommended treatment guidelines to maximize quality of care, creating financial incentives both for our clients’ members and our pharmacy networks. We also encourage the appropriate use of prescription drugs and identify care- and cost-effective alternatives through prescriber and member education programs when appropriate. Finally, we seek to encourage the use of generic formulations of branded pharmaceuticals, thereby lowering the cost of prescription pharmaceuticals without compromising efficacy. |
5
Table of Contents
| • | Advanced Decision Support and Data Analysis Services: We are able to help manage the cost expansion in prescription drug coverage through intensive analysis and review of utilization data of our clients’ members. By recognizing inappropriate use or dispensing of specific prescription drugs for certain member groups or at certain network pharmacies, we are able to help manage rapid inflation in prescription expenses. |
| • | Flexible Customized Reporting via Secure Internet Connection: We provide our clients’ members the ability to compare options available to them for certain prescription drugs through our comprehensive online tools. For example, on our Web site, members can compare the various options available to them for allergy medication, such as branded prescription pharmaceuticals, a generic alternative or an over-the-counter formulation. |
Disease Management / Integrated Care Management Services – On behalf of our clients, we work collaboratively with their health plan’s disease management teams to provide a focused approach to managing the cost and treatment of specific chronic diseases in order to improve medical outcomes and lower the overall health costs. This model uses clinical experts to monitor the contracted population and intervene when patients exceed predetermined clinical parameters.
Our disease management programs are the responsibility of a dedicated team of clinicians and have been developed around three key approaches focused on improving patient outcomes:
| • | Data Analysis and Integration: We evaluate and identify medical, laboratory, pharmacy and other relevant data within an identified specified population. |
| • | Case Identification: We identify patients who have a specific disease and evaluate the appropriateness of targeted interventions. |
| • | Clinical and Program Interventions: We communicate with identified patients and offer enhanced education about their condition and effective management tools, including education on the importance of adherence to established treatment guidelines. We also integrate our recommendations into our physician education initiatives, including treatment guidelines, patient profiles and patient management tools. Case management intervention programs are coordinated with other caregivers to monitor outcomes and improve overall care. |
Generic Advantage Plan and Formulary Advantage – The Catalyst Rx Generic Advantage Plan is designed to inform members about how to obtain competitively priced generic medications by comparing pricing through various fulfillment channels. Members are shown plan-based pricing for a variety of fulfillment methods, including generics at retail pharmacies, mail order and retail generic programs (commonly referred to as “$4 generic programs” or “low-cost retail programs,” such as those programs offered at Wal-mart, Target and other retail pharmacies). In 2010, we expanded our Generic Advantage Plan by better aligning incentives across the health care value chain, as well as through targeted prescriber detailing efforts, clinical edits, and through new electronic messaging and Smartphone capabilities to be introduced throughout 2011. In addition, based on results of successful pilot programs, we have introduced Formulary Advantage as a new standard offering with the Generic Advantage Plan. Formulary Advantage is a generics-oriented, lowest-net-cost formulary management approach targeting 10 therapeutic classes. The Generic Advantage Plan with Formulary Advantage differentiates us from PBM competitors who sometimes channel volume to mail order programs or certain retail outlets when more affordable options are available.
Mail Service Pharmacy – Whether through our mail service pharmacy, Immediate Pharmaceutical Services, Inc., or through a preferred mail service pharmacy provider, our mail service pharmacy program seeks to deliver quality, service and savings. Mail service is a significant extension of any pharmacy benefit plan as it provides economies of scale, minimizes prescription dispensing costs and provides the convenience of focused service and home delivery. Through our mail service programs, our customers are able to obtain competitive prices on generic drugs in the marketplace.
Specialty Pharmacy Services – We offer a convenient specialty pharmacy solution for our clients and members. Our program offers specialty pharmacy products at discounts over standard retail pharmacy, includes complex therapies and provides dedicated therapeutic management programs for individuals challenged by chronic and costly health conditions.
6
Table of Contents
Hospice Care PBM Services – Through our subsidiary, HospiScript Services, LLC, one of the nation’s largest providers of hospice PBM services, we are able to provide specialized services for facilities focusing on end-of-life care. We deliver reduced pharmaceutical and administrative expenses; custom dispensing parameters; access to hospice-trained pharmacist consultations; online reporting for pharmaceutical expenses and utilization patterns; and powerful educational resources for nurses, pharmacists and hospice administrators.
Pursuing Selective Acquisitions.
Consolidation has been, and may continue to be, an important factor in all aspects of the pharmaceutical industry, including the PBM business. We will continue to evaluate additional acquisition opportunities to enhance our business strategy.
We strive to timely integrate our strategic acquisitions. Our acquisitions have provided us with a more diverse and complete set of products and services to sell to a larger customer base and have expanded our geographic presence. The acquisitions have also allowed us to better capture efficiencies in corporate overhead and information technology investments. In each of the acquisitions, we focused on our objectives by integrating operations, realizing operating efficiencies, improving profitability and growing the revenue base of the acquired businesses. We will continue to look for acquisition opportunities that complement our existing operations and have characteristics similar to those of the companies previously acquired. These characteristics include geographic membership concentrations, opportunities to improve profitability and a base from which to generate revenue growth. See Part II, Item 7, “Management’s Discussion and Analysis of Financial Condition and Results of Operations–Acquisitions” for additional information.
Customers.
Our client agreements provide for the pharmacy benefit management services we deliver to our customers, comprised of pharmacy benefit plan and formulary design, pharmacy claims adjudication, access to programs designed to optimize clinical outcomes, access to our pharmacy network for purposes of dispensing prescriptions to clients’ members, mail order pharmacy services, and management of rebates attributable to branded drugs paid by pharmaceutical manufacturers or third party intermediaries. Our client agreements contain negotiated pricing guarantees with respect to drugs dispensed under clients’ plans, negotiated performance guarantees with respect to the administrative services we provide, and negotiated commitments with respect to rebates payable to our clients. In general, for our institutional clients such as state entities, we agree to pricing, performance guarantees, and/or rebate commitments that are comparatively more favorable to those types of clients compared to the terms for our other clients. Also, we generally agree to invest more in local client support and other customized client services for our largest clients.
In 2010, our largest customers, Wellmark Blue Cross Blue Shield of Iowa and the State of Maryland, accounted for 14% and 10% of our consolidated revenue, respectively. In addition, we generated approximately 7% of our revenue for the three and a half months ended December 31, 2010 from Independence Blue Cross, following our acquisition of FutureScripts LLC on September 13, 2010. Our ten largest customers, including Wellmark Blue Cross Blue Shield of Iowa, the State of Maryland, and Independence Blue Cross, accounted for 70% of our 2010 consolidated revenue. In 2009, our largest customers, Wellmark Blue Cross Blue Shield of Iowa and the State of Maryland, accounted for 18% and 12% of our consolidated revenue, respectively. Our ten largest customers, including Wellmark Blue Cross Blue Shield of Iowa and the State of Maryland, accounted for 68% of our 2009 consolidated revenue.
Government Regulation
Various aspects of our business are governed by federal and state laws and regulations. Because sanctions may be imposed for violations of these laws, compliance is a significant operational requirement. We believe we are in substantial compliance with all existing legal requirements material to the operation of our business. There are, however, significant uncertainties involving the application of many of these legal requirements to our business. In addition, there are numerous proposed health care laws and regulations at the federal and state levels, many of which could adversely affect our business, results of operations and financial condition. We are unable to predict what additional federal or state legislation or regulatory initiatives may be enacted in the future relating to our business or the health care industry in general, or what effect any such legislation or regulations might have on us. We also cannot provide any assurance that federal or state governments will not impose additional restrictions or adopt interpretations of existing laws or regulations that could have a material adverse effect on our business or financial performance.
7
Table of Contents
Some of the state laws described below may be preempted in whole or in part by the Employee Retirement Income Security Act of 1974 (“ERISA”), which provides for comprehensive federal regulation of employee benefit plans. However, the scope of ERISA preemption is uncertain and is subject to conflicting court rulings. We also provide services to certain clients, such as governmental entities, that are not subject to the preemption provisions of ERISA.
Federal Laws and Regulations Affecting Our Business
The following descriptions identify various federal laws and regulations that affect or may affect aspects of our business:
Medicare Part D Laws and Regulations.
The Medicare voluntary outpatient prescription drug benefit, “Part D,” was established under the Medicare Prescription Drug, Improvement, and Modernization Act of 2003, or MMA, and has been amended subsequently by several statutes, most notably by the Medicare Improvements for Patients and Providers Act of 2008, or MIPPA. The MMA also created guidelines for Medicare HMOs, known as Medicare Advantage Plans, which offer both an outpatient prescription drug benefit and health care coverage.
Medicare beneficiaries who elect Part D coverage pay a monthly premium for the covered outpatient drug benefit. Assistance with premiums and cost sharing are provided to eligible low-income beneficiaries. The voluntary outpatient prescription drug benefit requires coverage of essentially the same pharmaceuticals that are approved for the Medicaid program, although selection may be restricted through a formulary. The outpatient prescription drug benefit is offered on an insured basis by prescription drug plans, or PDPs, in 34 regions across the United States and by Medicare Advantage Plans, along with health care coverage, in 26 regions across the United States.
We are neither a PDP nor a Medicare Advantage Plan; however, we contract with PDPs and Medicare Advantage Plans, collectively “Part D Plans,” to provide various PBM services. In our capacity as a subcontractor with certain Part D Plan clients, we are indirectly subject to certain federal rules, regulations, and sub-regulatory guidance pertaining to the operation of Medicare Part D. If the federal Center for Medicare & Medicaid Services, referred to as CMS, determines that we have not performed satisfactorily as a subcontractor, CMS may request our PDP or Medicare Advantage Plan client to revoke our Part D activities or responsibilities under the subcontract. While we believe that we provide satisfactory levels of service under our respective subcontracts, we can give no assurances that CMS or a Part D Plan will not terminate our business relationships insofar as they pertain to Medicare Part D.
Among other things, PDPs and Medicare Advantage Plans are subject to provisions of the MMA intended to deter “fraud, waste and abuse” and are strictly monitored by CMS and its contracted Medicare Drug Integrity Contractors, or MEDICs, to ensure that Part D program funds are not spent inappropriately. Among other things, the fraud, waste and abuse provisions of CMS’s Medicare Prescription Drug Benefit Manual cites the following examples of potential PBM fraud, waste and abuse risks in connection with Part D: prescription drug switching, unlawful remuneration, inappropriate formulary decisions, prescription drug splitting or shorting, and failure to offer negotiated prices. CMS has offered additional sub-regulatory guidance regarding some of these risk areas, particularly with respect to the Part D formulary decision making process which is highly regulated by CMS. We believe that we are in substantial compliance with the applicable laws pertaining to these risk areas. However, no assurance can be given that we will not be subject to scrutiny or challenge under one or more of the underlying laws by the government enforcers or private litigants.
CMS requires PDPs and Medicare Advantage Plans to report 100% of all price concessions received for PBM services. The applicable CMS guidance suggests that best practices would require PDPs and Medicare Advantage Plans to contractually require the right to audit their PBMs as well as require 100% transparency as to manufacturer rebates paid for drugs provided under the sponsor’s plan, including the portion of such rebates retained by the PBM as part of the price concession for the PBM’s services. Additionally, CMS requires Part D Plan sponsors to ensure through their contractual arrangements with first tier, downstream and related entities (which would include PBMs)
8
Table of Contents
that CMS has access to such entities’ books and records pertaining to services performed in connection with Part D. CMS also suggests that Part D Plan sponsors should contractually require their first tier, downstream and related entities to comply with certain elements of the sponsor’s compliance program. Such disclosure and auditing requirements, to the extent required by Medicare plan partners, have not had a materially adverse effect on our business, results of operations, financial condition, or cash flows; however, there can be no assurances as to future effects.
CMS also requires Part D plan sponsors to calculate beneficiary cost sharing based upon the price ultimately received by the pharmacy or other dispensing provider, rather than upon the price paid by the plan. Such calculation could potentially result in lower pharmacy claims reimbursement by Part D plan sponsors to PBMs. In addition, CMS requires that any profit realized or loss incurred by a PBM through price negotiations with pharmacies or manufacturers be included as administrative costs to the plan rather than being factored into drug costs for reimbursement purposes. While there can be no certainty, given our existing arrangements with Part D plan sponsors, we do not currently expect that such changes will materially adversely affect our business, results of operations, financial conditions or cash flows.
In connection with MIPPA, CMS issued regulations in January 2009 revising the requirements applicable to Part D plan formularies. Certain of these requirements went into effect during plan contract year 2010. Although there can be no certainty, we do not currently expect that such changes will materially adversely affect our business, results of operations, financial conditions or cash flows.
Additionally, the enactment of the health care reform legislation discussed below will require changes to the Medicare Advantage and Part D prescription drug programs in the near term. Several key provisions of the legislation regarding drug coverage for brand and generic Part D drugs purchased within the so-called “donut hole” coverage gap phase of the Part D benefit go into effect for the 2011 contract year. The changes include the requirement that pharmaceutical manufacturers provide eligible Medicare Part D beneficiaries access to discount prices for certain brand drugs for enrollees who have reached or exceeded the initial Part D coverage limit, as well as a reduction in beneficiaries’ cost sharing obligations under basic prescription drug coverage for generic covered Part D drugs purchased during the coverage gap. Although we do not believe that the implementation of these requirements will have a material adverse effect on our business, results of operations, financial condition, or cash flow, many of the implementing rules and guidance have yet to be developed and it remains too early to speculate on the potential effects of such requirements.
Federal Anti-Remuneration/Fraud and Abuse Laws.
The federal healthcare Anti-Kickback Statute generally prohibits an entity from paying or receiving, subject to certain exceptions and safe harbors, any remuneration, directly or indirectly, to induce the referral of individuals covered by federally funded health care programs, including Medicare, Medicaid and the Civilian Health and Medical Program of the Uniformed Services, or CHAMPUS, or the purchase, or the arranging for or recommending of the purchase, of items or services for which payment may be made in whole or in part under Medicare, Medicaid, CHAMPUS or other federally funded health care programs. Sanctions for violating the Anti-Kickback Statute may include imprisonment, criminal and civil fines, and exclusion from participation in the federally funded health care programs.
The federal healthcare Anti-Kickback Statute has been interpreted broadly by courts, the Office of Inspector General, referred to as the OIG, within the U.S. Department of Health & Human Services, or the DHHS, and other administrative bodies. Because of the statute’s broad scope and the limited statutory exceptions, federal regulations establish certain safe harbors from liability. For example, safe harbors exist for certain properly disclosed and reported discounts received from vendors, certain investment interests, certain properly disclosed payments made by vendors to group purchasing organizations, certain personal services arrangements, and certain discount and payment arrangements between PBMs and HMO risk contractors serving Medicaid and Medicare members. A practice that does not fall within an exception or a safe harbor is not necessarily unlawful, but may be subject to scrutiny and challenge. In the absence of an applicable exception or safe harbor, a violation of the statute may occur even if only one purpose of a payment arrangement is to induce patient referrals or purchases of products or services that are reimbursed by federal health care programs. In addition, the health care reform legislation discussed below expanded the criminal intent standard under the Anti-Kickback Statute such that the government need not prove specific knowledge of or intent to violate the Anti-Kickback Statute in order to establish a violation. Among the
9
Table of Contents
practices that have been identified by the OIG as potentially improper under the statute are certain product conversion programs in which benefits are given by drug manufacturers to pharmacists or physicians for changing a prescription, or recommending or requesting such a change, from one drug to another. The Anti-Kickback Statute has been cited as a partial basis, along with state consumer protection laws discussed below, for investigations and multi-state settlements relating to financial incentives provided by drug manufacturers to retail pharmacies as well as to PBMs in connection with such programs.
Additionally, it is a crime under the Public Contractor Anti-Kickback Statute, for any person to knowingly and willfully offer or provide any remuneration to a prime contractor to the United States, including a contractor servicing federally funded health programs, in order to obtain favorable treatment in a subcontract. Violators of this law also may be subject to civil monetary penalties.
There have been a series of substantial civil and criminal investigations and settlements, at the state and federal level, involving pharmacy benefit managers over the last several years in connection with alleged kickback schemes. Such cases have included allegations that PBMs inflated service fees charged to pharmaceutical manufacturers and that PBMs made payments to customers allegedly intended to induce business. We are not a party in any such cases, and we believe that we are in substantial compliance with the legal requirements imposed by such anti-remuneration laws and regulations. However, there can be no assurance that we will not be subject to scrutiny or challenge under such laws or regulations. Any such challenge could have a material adverse effect on our business, results of operations, financial condition or cash flows.
Federal Statutes Prohibiting False Claims.
The Federal False Claims Act imposes civil penalties for knowingly making or causing to be made false claims with respect to governmental programs, such as Medicare and Medicaid, for services not rendered, or for misrepresenting actual services rendered, in order to obtain higher reimbursement. Private individuals may bring qui tam or whistleblower suits against providers under the Federal False Claims Act, which authorizes the payment of a portion of any recovery to the individual bringing suit. Such actions are initially required to be filed under seal pending their review by the Department of Justice. A few federal district courts have interpreted the Federal False Claims Act as applying to claims for reimbursement that violate the anti-kickback statute or federal physician self-referral law under certain circumstances and, most recently, the health reform legislation has confirmed that an anti-kickback statute violation may trigger liability under the Federal False Claims Act. The Federal False Claims Act generally provides for the imposition of civil penalties and for treble damages, resulting in the possibility of substantial financial penalties for small billing errors that are replicated in a large number of claims, as each individual claim could be deemed to be a separate violation of the Federal False Claims Act. Criminal provisions that are similar to the Federal False Claims Act provide that a corporation may be fined if it is convicted of presenting to any federal agency a claim or making a statement that it knows to be false, fictitious or fraudulent.
There have been several qui tam actions filed under the Federal False Claims Act, the Public Contractor Anti-Kickback Statute and similar state laws in various federal courts against several PBMs. The complaints allege, among other things, that such PBMs improperly favored the products of certain pharmaceutical manufacturers over less expensive products and engaged in improper mail order pharmacy practices. For example, in October 2006, Medco Health Solutions entered into a $155 million civil settlement of claims under both state and federal false claims statutes that it destroyed and canceled valid patient prescriptions, solicited kickbacks from pharmaceutical manufacturers to favor their drugs and paid kickbacks to health plans to obtain business. Also, in September 2005, Caremark entered into a $137 million civil settlement of claims under both state and federal false claims statutes that its subsidiary, AdvancePCS, allegedly solicited and received kickbacks from pharmaceutical manufacturers in the form of excessive administrative fees, over-priced services agreements as a reward for favorable formulary treatment, and improper flat fee rebates, and that AdvancePCS allegedly paid kickbacks to customers and potential customers to induce them to contract with AdvancePCS. Both Medco and Caremark agreed to enter into five year corporate integrity agreements with the federal government in connection with their respective settlements.
Currently, we do not directly contract with the federal government to provide services to beneficiaries of federally funded health programs. Therefore, we do not directly submit claims to the federal government. However, we do contract with and provide services to entities or organizations that are federal government contractors, such as Medicare Part D PDPs. In recent years, the government has increased its focus on and enforcement of the federal fraud and abuse laws, including the Federal False Claims Act. The Fraud Enforcement and Recovery Act, signed
10
Table of Contents
into federal law on May 20, 2009, broadened significantly the scope of the Federal False Claims Act and limited the availability of certain defenses available previously to entities with indirect ties to federal funds. The health care reform legislation significantly expands the reach of both the Anti-Kickback Statute and the Federal False Claims Act and includes new and strengthened mechanisms for combating fraud, waste and abuse in federal and state health care programs. Finally, the Obama administration has created the Health Care Fraud Prevention and Enforcement Action Team, known as HEAT, and has proposed allocating $1.2 billion to DHHS in the fiscal year 2011 budget for fraud-fighting activities.
There can be no assurance that the government would not potentially view one or more of our actions in providing services to federal government contractors as causing or assisting in the presentment of a false claim. We do not believe we are in violation of the Federal False Claims Act, and we have a corporate compliance and ethics program, policies and procedures and internal controls in place to help maintain an organizational culture of honesty and integrity.
ERISA Regulation.
ERISA regulates certain aspects of employee pension and health benefit plans, including self-funded corporate health plans. We have agreements with self-funded corporate health plans to provide PBM services, and therefore, we are a service provider to ERISA plans. ERISA imposes duties on any person or entity that is a fiduciary with respect to the ERISA plan. We administer pharmacy benefits for ERISA plans in accordance with plan design choices made by the ERISA plan sponsors. We do not believe that the general conduct of our business subjects us to the fiduciary obligations set forth by ERISA, except when we have specifically contracted with an ERISA plan sponsor to accept fiduciary responsibility and be named as a fiduciary for certain functions.
Numerous lawsuits have been filed against various PBMs by private litigants, whether by a plan participant on behalf of an ERISA plan or by the ERISA plan sponsor, alleging that the PBMs are ERISA fiduciaries and that, in such capacity, they allegedly violated ERISA fiduciary duties in connection with certain business practices related to their respective contracts with retail pharmacy networks and/or pharmaceutical manufacturers. For example, in 2004, Medco settled a lawsuit that alleged that Medco was a functional fiduciary under ERISA and violated its fiduciary obligations by, among other things, failing to make adequate disclosures regarding certain rebates from pharmaceutical manufacturers and steering clients toward more expensive pharmaceuticals with higher rebates benefiting Medco and its then-parent company, Merck & Co., Inc. Pursuant to the settlement, Medco agreed to pay $42.5 million into a settlement fund to be distributed to plan participants. In addition, Medco agreed to implement and continue certain business practices aimed at increasing transparency around formulary decisions and therapeutic interchanges. Medco did not admit, and the settlement did not require Medco to admit, any wrongdoing under ERISA or otherwise.
Several recent cases further addressed the issue of whether a PBM is a fiduciary under ERISA. In an action brought against Caremark, a plan alleged that Caremark violated its fiduciary duty under ERISA by hiding pricing spreads that yielded significant revenue for the PBM but was not passed on to the plan. In November 2007, the United States District Court for the Middle District of Tennessee found that Caremark was not a fiduciary under ERISA because Caremark did not have discretion to unilaterally set prices for prescriptions and because the agreement between Caremark and the plan did not prohibit Caremark from negotiating with retail pharmacies for favorable pricing. Similarly, in another action against Caremark, a multiemployer health fund alleged that Caremark breached its ERISA fiduciary duties by charging the fund higher prices for drugs than Caremark itself paid, as well as for failing to pass on to the fund all price concessions that Caremark received from retailers and manufacturers. In January 2007, the Seventh Circuit found that Caremark was not a fiduciary because the fund possessed the sole authority to control and administer prescription drug benefits and because Caremark’s contracts with the fund provided that Caremark was not a fiduciary. In a case brought by a labor organization against its health plan’s PBM, Express Scripts, the United States District Court for the Eastern District of Missouri held in July 2008 that Express Scripts was a fiduciary in connection with the payment of certain monies under a discontinued therapeutic substitution program, but that Express Scripts was not a fiduciary with respect to MAC (generic drug) pricing, selecting the source for average wholesale price, or AWP, pricing, establishing formularies and negotiating rebates, or interest earned on rebates before the payment of the contracted client share.
11
Table of Contents
In those cases where we have not accepted fiduciary status, there can be no assurance that the U.S. Department of Labor, the agency that enforces ERISA, or a private litigant would not assert that the fiduciary obligations imposed by the statute apply to certain aspects of our operations.
ERISA also imposes civil and criminal liability on service providers to health plans and certain other persons if certain forms of illegal remuneration are made or received. These provisions of ERISA are similar, but not identical, to the federal healthcare Anti-Kickback Statute discussed above. In particular, ERISA does not provide the statutory and regulatory safe harbor exceptions incorporated into the federal healthcare Anti-Kickback Statute. Like the health care anti-kickback laws, the corresponding provisions of ERISA are written broadly and their application to particular cases is often uncertain. We have implemented policies regarding, among other things, disclosure to health plan sponsors with respect to any commissions paid by or to us that might fall within the scope of such provisions and accordingly believe we are in substantial compliance with these provisions of ERISA. However, we can provide no assurance that our policies in this regard would be found by the appropriate enforcement authorities and potential private litigants to meet the requirements of ERISA.
On December 13, 2007, the U.S. Department of Labor published proposed rules under ERISA that, if made final, would redefine what constitutes a “reasonable contract or arrangement” exempt from the prohibited transaction provisions of ERISA. Essentially, the proposed rules require a written agreement between certain service providers (that may include a PBM) and an employee benefit plan that would require the disclosure of compensation arrangements so that the plan fiduciary can assess the reasonableness of the compensation and the potential for conflicts of interests that could affect performance of the negotiated services. The proposed rules would also require that for a contract to be considered reasonable it must permit termination by the ERISA plan on reasonably short notice without penalty to prevent the plan from being locked into a contract that has become disadvantageous, although the plan can be charged a fee on early termination to allow the service provider to recover start-up costs.
The Department of Labor received several comments arguing that the rationales for the proposed rule apply to pension plans, but not to welfare benefit plans. Other commenters argued that if the Department of Labor created disclosure rules for welfare benefit plan service providers, they should be promulgated separately. In response to those comments, the Department of Labor, acknowledging the existence of sufficient differences between pension and welfare benefit plans to justify separate rules, issued on July 16, 2010 interim final regulations requiring that certain service providers of employee pension benefit plans disclose information to assist plan fiduciaries in assessing the reasonableness of contracts or arrangements, including the reasonableness of the service providers’ compensation and potential conflicts of interest that may affect the service providers’ performance. On December 7, 2010, the Department of Labor held a public hearing to explore what particular provisions of the interim final rules (relating to pension plans) should and should not apply to welfare benefit plans. Although we have not been informed otherwise, we cannot say with any degree of certainty that interim final rules for welfare benefit plans will not be issued this year. It is difficult to assess how the final rules might impact group health plans and the services provided by us as a PBM. Although we believe the proposed rules are not sufficiently specific in many technical regards, because of disclosures already made, and the current marketplace regarding the length of contracts and pricing arrangements, we do not believe that complying with the proposed rules, should they become final in their current form, would have a material adverse effect on our business, results of operations, financial condition or cash flows.
FDA Regulation.
The U.S. Food and Drug Administration, or FDA, generally has authority to regulate drug promotional materials that are disseminated by or on behalf of a drug manufacturer. In January 1998, the FDA issued a Notice and Draft Guidance regarding its intent to regulate certain drug promotion and switching activities of PBMs that are controlled, directly or indirectly, by drug manufacturers. After extending the comment period due to numerous industry objections to the proposed draft, the FDA has taken no further action on the Notice and Draft Guidance. However, there can be no assurance that the FDA will not attempt again to assert jurisdiction over aspects of our business in the future and, although we are not controlled directly or indirectly by any drug manufacturer, the impact of any future FDA regulation could materially adversely affect our business, results of operations, financial condition or cash flows.
12
Table of Contents
Antitrust Regulation.
The federal antitrust laws regulate trade and commerce and prohibit unfair competition as defined by those laws. Section One of the Sherman Antitrust Act prohibits contracts, combinations or conspiracies in restraint of trade or commerce. Despite its sweeping language, however, Section One of the Sherman Act has been interpreted to prohibit only unreasonable restraints on competition. Section Two of the Sherman Act prohibits monopolization and attempts at monopolization. Similarly, Section Seven of the Clayton Act prohibits unlawful mergers and acquisitions. In addition, the Robinson Patman Act, which is part of the Clayton Act, prohibits certain types of conduct relating to the sale of goods, including prohibiting practices the statute defines as price discrimination. One section of the Robinson Patman Act prohibits a seller from selling goods of like grade or quality to different customers at different prices if the favorable prices are not available to all customers competing in the same class of trade. Successful plaintiffs in antitrust actions are allowed to recover treble damages for the damage sustained as a result of the violation.
Numerous lawsuits are pending against several PBMs and pharmaceutical manufacturers under various state and federal antitrust laws by retail pharmacies throughout the United States challenging certain branded drug pricing practices. The complaints allege, in part, that the defendant PBMs accepted rebates and discounts from pharmaceutical manufacturers on purchases of brand-name prescription drugs and conspired with other PBMs to fix prices in violation of the Robinson Patman Act and the Sherman Antitrust Act. The suits seek unspecified monetary damages, including treble damages, and injunctive relief. These cases are in various stages of litigation. Several have been consolidated in multidistrict litigation with outcomes pending.
We believe that we are in substantial compliance with the legal requirements imposed by the antitrust laws. However, there can be no assurance that we will not be subject to scrutiny or challenge under such legislation. To the extent that we have actual or potential market power in a relevant market, our business arrangements and practices may be subject to heightened scrutiny under the antitrust laws. Any such challenge could have a material adverse effect on our business, results of operations, financial condition or cash flows.
Health Care Reform Legislation.
On March 23, 2010, President Obama signed the Patient Protection and Affordable Care Act and on March 30, 2010, he signed the Health Care and Education Reconciliation Act of 2010, which included a series of amendments to the Patient Protection and Affordable Care Act, collectively known as ACA. ACA authorizes health insurance reforms that will take effect over the next decade and that will have far-reaching implications for individuals and businesses. As a result of ACA, we have been assisting our clients with implementation of their obligations under the legislation. The key features of ACA that may impact PBM providers are: (1) transparency reporting requirements with respect to generic dispensing rates and negotiated price concessions; (2) requirements to cover certain preventive services with no cost-sharing requirements; (3) new coverage determinations and claims appeals processes; (4) requirements to cover a set of yet-to-be-determined prescription drugs under the essential health benefits package; and (5) a requirement to maintain a medical loss ratio of 85% or higher in the large group market and 80% or higher in the individual and small group markets. Although ACA provides for these and other health insurance reforms, we do not believe that our obligations, or our efforts to assist our clients with their obligations, under ACA will have a material adverse effect on our business, results of operations, financial condition or cash flows.
State Laws and Regulations Affecting Our Business
The following descriptions identify various state laws and regulations that affect or may affect aspects of our business:
State Anti-Remuneration/False Claims Laws.
Several states have laws and/or regulations similar to the federal healthcare Anti-Kickback Statute and Federal False Claims Act described above. The federal Deficit Reduction Act of 2005, or DRA, gave incentive to states to enact their own false claims acts, mirrored on the Federal False Claims Act, described above. Such state laws are not necessarily limited to services or items for which federally funded health care program payments may be made. Such state laws may be broad enough to include improper payments made in connection with services or items that
13
Table of Contents
are paid by commercial payors. Both the 2006 Medco Health Solutions and 2005 Caremark settlements, discussed above under “Federal Statutes Prohibiting False Claims,” included settlement of civil claims under several state false claims laws. Sanctions for violating these state anti-remuneration and false claims laws may include injunction, imprisonment, criminal and civil fines and exclusion from participation in the state Medicaid programs. Additionally, under the Deficit Reduction Act of 2005, discussed in greater detail below, states are incentivized to pass broad false claims legislation similar to the Federal False Claims Act.
We believe that we are in substantial compliance with the legal requirements imposed by such laws and regulations. However, there can be no assurance that we will not be subject to scrutiny or challenge under such laws or regulations. Any such challenge could have a material adverse effect on our business, results of operations, financial condition or cash flows.
State Consumer Protection Laws.
Most states have enacted consumer protection and deceptive trade laws that generally prohibit payments and other broad categories of conduct deemed harmful to consumers. These statutes may be enforced by states and/or private litigants. Such laws have been and continue to be the basis for investigations, prosecutions and settlements of PBMs, initiated by state prosecutors as well as by private litigants. For example, in February 2008, CVS Caremark agreed to a settlement with 28 states attorneys general for $41 million to resolve allegations that CVS Caremark engaged in deceptive business practices by retaining the discounts and rebates obtained from switching patients to different brand-name prescription drugs.
We believe that we are in substantial compliance with the legal requirements imposed by such laws and regulations. However, no assurance can be given that we will not be subject to scrutiny or challenge under one or more of these laws, or under similar consumer protection theories.
State Comprehensive PBM Regulation.
States continue to introduce legislation to regulate PBM activities in a comprehensive manner. Legislation seeking to impose fiduciary duties or disclosure obligations on PBMs has been proposed in some states. Both Maine and the District of Columbia have enacted statutes imposing fiduciary obligations on PBMs. However, the District of Columbia statute imposing fiduciary duties on PBMs and requiring PBMs to disclose certain financial information, including the quantity of drugs purchased and the price paid by the PBM for such drugs, was found by the D.C. Circuit Court of Appeals to be preempted by ERISA, and therefore it was never implemented. The Maine statute applies only to contracts entered into in Maine with respect to PBM customers, or covered entities in Maine. Under the Maine law, PBMs have a contractual fiduciary responsibility to pass through to their clients any price concessions received from drug manufacturers that are associated with volume of sales or utilization of certain drug classes. The Maine law also requires PBMs to report all financial terms and arrangements for remuneration of any kind between the PBM and drug manufacturer. Similarly, Iowa, Kansas, North Dakota, South Dakota and Vermont have relatively comprehensive PBM laws that, among other things, increase required financial transparency, and regulate therapeutic interchange programs.
Many states have licensure or registration laws governing certain types of ancillary health care organizations, including preferred provider organizations, TPAs, companies that provide utilization review services and companies that engage in the practices of a pharmacy. The scope of these laws differs significantly from state to state, and the application of such laws to the activities of PBMs often is unclear. Several other states, including Connecticut, Georgia, Louisiana, Maryland, Mississippi, Rhode Island and Tennessee, have enacted laws regulating various PBM activities, and similar legislation is pending in several more states. Such state laws do not appear to be having a material adverse effect on our business operations or our ability to negotiate and/or retain rebates and administrative fees from pharmaceutical manufacturers with respect to our customers in those states. We believe that we currently maintain in good standing or are in the process of applying for all such state licenses and registrations required for our business. However, we can give no assurance that these and other states will not enact legislation with more adverse consequences in the near future, nor can we be certain that future regulations or interpretations of existing laws will not adversely change the consequences experienced to date of existing laws.
In addition, certain quasi-regulatory organizations, including the National Association of Boards of Pharmacy, an organization of state boards of pharmacy, the National Association of Insurance Commissioners, or NAIC, an organization of state insurance regulators, and URAC and the National Committee on Quality Assurance “NCQA,”
14
Table of Contents
both accreditation organizations, have considered or have passed proposals to regulate PBMs and/or PBM activities, such as formulary development and utilization management. We maintain URAC accreditation for Drug Therapy Management as well as full accreditation as a PBM, which includes evaluation of organizational quality, customer service, communications, disclosure of pricing policies, pharmaceutical distribution, drug utilization management, and pharmacy and therapeutics committees. In the summer of 2003, the NAIC adopted the “Health Carrier Prescription Drug Benefit Management Model Act” which sets forth model provisions for states to regulate formularies and create an exceptions process to provide access to non-formulary medicines and avoid drug management requirements such as step therapy. While the actions of the NAIC do not have the force of law, they may influence states to adopt requirements similar to the Model Act.
We believe that we are in substantial compliance with all such laws and requirements where required, and we continue to monitor legislative and regulatory developments. There can be no assurance, however, regarding the future interpretation of these laws and their applicability to the activities of our business. Future legislation or regulation, or interpretations by regulatory and quasi-regulatory authorities of existing laws and regulations, could materially affect the cost and nature of our business as currently conducted.
Network Access Legislation.
A majority of states now have some form of legislation affecting our ability to limit access to a pharmacy provider network, referred to as any willing provider legislation, or removal of a network provider, referred to as due process legislation. Such legislation may require us or our clients to admit any retail pharmacy willing to meet the plan’s price and other terms for network participation, or may provide that a provider may not be removed from a network except in compliance with certain procedures. Similarly, there are any willing pharmacy provisions applicable to Medicare Part D plans with which we contract. These statutes have not materially affected our business, results of operations, financial condition or cash flows; however, there can be no assurances that such will be the case in the future.
State Legislation Affecting Plan or Benefit Design.
Some states have enacted legislation that prohibits certain types of managed care plan sponsors from implementing certain restrictive design features, and many states have legislation regulating various aspects of managed care plans, including provisions relating to the pharmacy benefits. For example, some states, under so-called freedom of choice legislation, provide that members of the plan may not be required to use network providers, but must instead be provided with benefits even if they choose to use non-network providers. Other states have enacted legislation purporting to prohibit health plans from offering members financial incentives for use of mail service pharmacies. Legislation has been introduced in some states to prohibit or restrict therapeutic intervention (including, without limitation, to carve out certain classes from generic substitution), to require coverage of all FDA-approved drugs or to require coverage for off-label uses of drugs where those uses are recognized in peer-reviewed medical journals or reference compendia. Other states mandate coverage of certain benefits or conditions and require health plan coverage of specific drugs, if deemed medically necessary by the prescribing physician. Such legislation does not generally apply to us directly, but may apply to certain of our clients, such as HMOs and health insurers. If legislation were to become widely adopted, it could have the effect of limiting the economic benefits achievable through PBMs. This development could have a material adverse effect on our business, results of operations, financial condition or cash flows.
State Regulation of Financial Risk Plans.
Fee-for-service prescription drug plans are generally not subject to financial regulation by the states. However, if a PBM offers prescription drug coverage on a capitated basis or otherwise accepts material financial risk in providing the benefit, laws in various states may regulate the plan. Such laws may require that the party at risk establish reserves or otherwise demonstrate financial responsibility. Laws that may apply in such cases include insurance laws, HMO laws or limited prepaid health service plan laws. Currently, we do not believe that our business currently incurs financial risk of the type subject to such regulation. However, if we choose to become a regional PDP for the Medicare outpatient prescription drug benefit at some time in the future, we would need to comply with state laws governing risk-bearing entities in the states where we operate a PDP.
15
Table of Contents
State Discount Drug Card Regulation.
Numerous states have laws and/or regulations regulating the selling, marketing, promoting, advertising or distributing of commercial discount drug cards for cash purchases. Such laws and regulations provide, generally, that any person may bring an action for damages or seek an injunction for violations. We administer a limited commercial discount drug card program that we do not consider material to our business. We believe our administration of the commercial discount drug card program is in compliance with various state laws. However, there can be no assurance that the existence of such laws will not materially impact our ability to offer certain new commercial products and/or services in the future.
Combined Federal and State Laws, Regulations and Other Standards Affecting Our Business
Certain aspects of our business are or may be affected by bodies of law that exist at both the federal and state levels and by other standard setting entities. Among these are the following:
Privacy and Confidentiality Legislation.
Our activities involve the receipt or use of confidential medical information concerning individual members. In addition, we use aggregated and de-identified data for research and analysis purposes. Many state laws restrict the use and disclosure of confidential medical information and impose specific security standards, and similar new legislative and regulatory initiatives are underway in several states. To date, no such laws adversely impact our ability to provide our services, but there can be no assurance that federal or state governments will not enact such legislation, impose restrictions or adopt interpretations of existing laws that could have a material adverse effect on our business, results of operations, financial condition or cash flows.
The final privacy regulations, the “Privacy Rule,” issued by the DHHS pursuant to the Health Information Portability and Accountability Act, or HIPAA, imposes extensive restrictions on the use and disclosure of identifiable health information (or “PHI”) by certain entities known under the Privacy Rule as covered entities. PBMs, in general, are not considered covered entities. However, our mail order pharmacy is a covered entity and must comply with these restrictions. Additionally, our clients are covered entities, and are required to enter into business associate agreements with vendors, such as PBMs, that perform a function or activity for the covered entity that involves the use or disclosure of PHI. The business associate agreements mandated by the Privacy Rule create a contractual obligation for the PBM to perform its duties for the covered entity in compliance with the Privacy Rule.
On February 17, 2009, Congress enacted Subtitle D of the Health Information Technology for Economic and Clinical Health Act (“HITECH”) provisions of the American Recovery and Reinvestment Act of 2009. HITECH amends HIPAA, and among other things, expands and strengthens HIPAA enforcement, imposes new penalties for non-compliance, and establishes new breach notification requirements for covered entities and their Business Associates.
The final transactions and code sets regulation, the “Transaction Rule,” promulgated under HIPAA requires that all covered entities that engage in electronic transactions use standardized formats and code sets. DHHS recently revised the rules pertaining to standardized formats and code sets, and the compliance date for the revised standards is October 1, 2013. It is incumbent upon PBMs to conduct all such transactions in accordance with the Transaction Rule to satisfy the obligations of their covered entity clients. Additionally, DHHS requires health plans to utilize National Provider Identifiers, or NPIs, in all Standard Transactions. NPIs are intended to replace National Association of Boards of Pharmacy numbers for pharmacies, Drug Enforcement Agency numbers for physicians and similar identifiers for other health care providers.
We have configured our systems to comply with the NPI requirements and the Transaction Rule’s current requirements. We do not anticipate any material difficulty in meeting the October 1, 2013 deadline for compliance with the revised rules for standardized formats and code sets. The final security regulations, the “Security Rule,” issued pursuant to HIPAA mandate the use of administrative, physical and technical safeguards to protect the confidentiality of electronic health care information. Under HITECH, business associates are responsible for compliance with all of HIPAA’s Security standards. Business Associates are also directly liable for HIPAA violations and subject to both state and federal enforcement. We have made the necessary arrangements to ensure compliance with the Security Rule.
16
Table of Contents
Compliance with the Privacy Rule, the Transaction Rule and the Security Rule, together called HIPAA Regulations, and also applicable state data security laws has not had a material adverse effect on our business operations. Also, pursuant to HIPAA, state laws that are more protective of medical information are not pre-empted by HIPAA. Therefore, to the extent states enact more protective legislation, we could be required to make significant changes to our business operations. We also face significant reputational harm in the event that we are responsible for a breach of PHI or personal data protected by state law and responsible for publicly reporting the breach in accordance with the law.
Independent of any regulatory restrictions, individual health plan sponsor clients could increase limitations on our use of medical information, which could prevent us from offering certain services.
Legislation and Litigation Affecting Drug Prices.
Various federal and state Medicaid agencies, as well as legislators and private litigants have raised the issue of how AWP is determined. AWP is a standard pricing unit published by third party data sources and currently used throughout the PBM industry as the basis for determining drug pricing under contracts with clients, pharmacies and pharmaceutical manufacturers. Under MMA, AWP no longer serves as the basis for Medicare Part B Drug reimbursement, with certain limited exceptions. Rather, Part B drugs generally are reimbursed on an average sales price, or ASP, methodology. The ASP calculation methodology, which takes into account various discounts offered by drug manufacturers, may cause some drug manufacturers to reduce the levels of discounts or rebates available to PBMs or their clients with respect to Medicare Part B drugs. Drugs that are reimbursed on an ASP reimbursement system by Medicare do not represent a significant portion of our business and we therefore do not believe that ASP reimbursement for such drugs will have a material adverse effect on our business, results of operations, financial condition or cash flows. Either the use of ASP in pricing outside the Medicare Part B context or changes to AWP state and federal programs could alter the calculation of drug prices for federal and/or state programs. We are aware that a small number of states have determined to reimburse for certain Medicaid drugs using an ASP-based methodology. We are unable to predict whether any such changes will be adopted on a larger scale, and whether such changes would have a material adverse effect on our business, results of operations, financial condition or cash flows.
As part of recent class action settlements in Massachusetts, First DataBank, or FDB, and Medispan each agreed to reduce the reported AWP of thousands of specific pharmaceutical products by five to ten percent, effective September 26, 2009. Additionally, independent of the settlement, FDB and Medispan announced that they plan to discontinue publishing the AWP data field for all drugs in September 2011. Except when our health plan clients mandate the use of AWP as reported by FDB, our contracts with pharmacies in our retail network and our health plan clients generally cite AWP as reported by Medispan, National Drug Data file, as a pricing source for brand name and certain generic drugs. Since 2009, most of our contracts with our clients and retail pharmacies contained terms that enabled us to mitigate the adverse effect of the reduction in reported AWPs; and even those clients without such terms agreed to mitigate the adverse effect of the reduced AWP due to the practical need of preserving a widely accessible network of pharmacy providers. However, the longer-term impact of the settlement could create disruption in our business due to the adverse impact on AWP-based pharmacy pricing and pharmacy efforts to negotiate another drug pricing measure, such as average manufacturer price, “AMP”, or wholesale acquisition cost, “WAC”. We believe that payors, pharmacy providers and PBMs have begun to evaluate other pricing benchmarks as the basis for contracting for prescription drugs and benefit management services in the future. We believe our business model can utilize one or more other consistently calculated benchmarks, but we cannot evaluate the overall financial impact that the transition to any such alternative benchmark might have. Due to these and other uncertainties, we can give no assurance that the long term impact of changes to industry pricing benchmarks will not have a material adverse effect on our financial performance, results of operations, financial condition or cash flows in future periods.
The federal Medicaid rebate statute provides that pharmaceutical manufacturers must provide rebates on all drugs purchased by the Medicaid program. Manufacturers of brand-name pharmaceuticals must provide the Medicaid program a rebate equivalent to the greater of (1) 15.1% of AMP, the average price for products sold to wholesalers, or (2) the difference between AMP and the best price given to customers other than the Medicaid program, with certain exceptions. We negotiate rebates with and services payments from drug manufacturers. Investigations have been commenced by certain government agencies which question whether AMPs and best
17
Table of Contents
prices, and thus Medicaid rebates, were properly calculated, reported and paid by the manufacturers to the Medicaid programs. We are not responsible for such calculations, reports or payments. Some pharmaceutical manufacturers may view the Medicaid rebate statute and/or the associated investigations as a disincentive to offer rebates and discounts to private parties, including PBMs, and this may adversely affect our ability to negotiate manufacturer rebates in the future.
Certain aspects of CMS’s AMP regulations, such as the public disclosure of AMP data, could potentially affect our ability, or the ability of intermediaries we may use, to negotiate manufacturer administrative fees and rebates in the future. Increased transparency resulting from the AMP publication requirements also could affect the rates at which our pharmacies are reimbursed and the rates our plans pay us for pharmacy claims, but we cannot predict at this time whether the effect of such possible changes will be positive or negative. The final AMP regulation was preliminarily enjoined in December 2007, with respect to the public reporting of AMP and the use of AMP in the Medicaid federal upper limit determination, due to ongoing litigation by the National Community Pharmacists Association and the National Association of Chain Drug Stores. On November 15, 2010, CMS published a final rule withdrawing and amending the AMP regulations. The regulations were withdrawn as a result of the retail pharmacies’ legal challenges and due to the passage of the health care reform legislation which effectively superseded the AMP provisions. CMS has not proposed any regulations interpreting the health care reform statutory changes. Nor has it issued substantive sub-regulatory guidance on the new methods for determining AMP. CMS has indicated that interpretive regulations are forthcoming. Until that time, manufacturers are instructed by CMS to rely on the language of the statute as amended by the health care reform laws. In response to these actions by CMS, in December 2010, the litigation between CMS and the National Community Pharmacists Association and the National Association of Chain Drug Stores was dismissed.
In addition to these potential pricing developments on the federal level, some states have adopted so-called most favored nation legislation providing that a pharmacy participating in the state Medicaid program must give the state the lowest price that the pharmacy makes available to any third-party plan. Such legislation may adversely affect our ability to negotiate discounts in the future from network pharmacies.
Voluntary Industry Ethical Guidelines.
The Pharmaceutical Research and Manufacturers of America encourages its members to comply with a voluntary ethical code titled “PhRMA Code on Interactions with Healthcare Professionals.” This code, which is generally voluntary but has the force of law in a growing number of states, including California, Massachusetts, and Nevada, provides guidance relating to several facets of pharmaceutical manufacturers’ marketing practices, particularly with respect to payments to providers. We believe that these ethical guidelines do not have a material adverse effect on our business, results of operations, financial operations or cash flows.
Future Regulation.
We are unable to predict accurately what additional federal or state legislation or regulatory initiatives may be enacted in the future relating to our businesses or the health care industry in general, or what effect any such legislation or regulations might have on us. For example, the federal government and several state governments have proposed legislation aimed primarily at improving quality of care provided to individuals in managed care plans. Some of the initiatives propose providing greater access to drugs not included on health plan formularies, giving participants the right to sue their health plan for malpractice and mandating an appeals or grievance process. There can be no assurance that federal or state governments will not impose additional restrictions or adopt interpretations of existing laws that could have a material adverse effect on our business, results of operations, financial condition or cash flows.
Laws and Regulations Specifically Related to Our Mail Order Pharmacy Operations
We operate mail order facilities in Alabama and Ohio for certain of our customers. The Alabama facility principally fills hospice-related prescriptions. The Ohio facility fills prescriptions for all other clients electing to be served by that facility. In addition to laws and regulations discussed above that may affect mail order pharmacy operations, we are subject to state and federal statutes and regulations governing the operation of pharmacies, repackaging of drug products and dispensing of controlled substances.
18
Table of Contents
Regulation of Controlled Substances.
Our mail order facilities must register with the United States Drug Enforcement Administration and individual state-controlled substance authorities in order to dispense controlled substances. Federal law requires us to comply with the DEA’s security, recordkeeping, inventory control and labeling standards in order to dispense controlled substances. State-controlled substance law requires registration and compliance with state pharmacy licensure, registration or permit standards promulgated by the state pharmacy licensing authority.
State Licensure Laws.
We are licensed to do business as a pharmacy in Ohio and Alabama and as a non-resident pharmacy in each state where registration with the state board of pharmacy or similar governing body is required so that pharmaceuticals may be delivered by mail into the state. Also, some states require that an out-of-state pharmacy employ a pharmacist that is licensed in the state into which pharmaceuticals are shipped. We believe we are in substantial compliance with state licensure and registration requirements with respect to our mail order facilities.
Other Regulations.
Federal law prohibits the restocking and double billing of prescription drugs in connection with the Medicaid Program. Additionally, the Federal Trade Commission, or FTC, regulates advertising by mail order pharmacies and requires such facilities to stock a reasonable supply of a product sold, to fill mail orders within 30 days and to provide customer refunds where appropriate. The FTC has also interpreted its authority broadly, as exemplified by a June 2009 FTC case settled by CVS/Caremark Rx, alleging privacy and patient record violations. In addition, the FDA sets standards for the packaging of prescription drugs. Federal and state anti-remuneration laws also apply to our mail order pharmacy. We believe we are in substantial compliance with state and federal requirements pertaining to our mail order pharmacy operations.
Employees
As of December 31, 2010, we had 1,036 employees whose services are devoted full time to Catalyst Health Solutions, Inc. and its subsidiaries. We have never had a work stoppage. Our personnel are not represented by any collective bargaining unit. We consider our relations with our personnel to be good. Our future success will depend, in part, on our ability to continue to attract, retain and motivate highly qualified technical and managerial personnel, for whom competition is intense.
| ITEM 1A. | RISK FACTORS |
Risks Related to Economic Conditions
Unprecedented economic conditions have and are likely to continue to affect our business, results of operations, financial condition and cash flows.
Unprecedented national and global market and economic conditions that began in 2008 have been and continue to be challenging with high unemployment, tighter credit conditions and minimal economic recovery in most major economies. Continued concerns about the systemic impact of potential long-term and wide-spread recession, energy costs, geopolitical issues, the availability and cost of credit, and the global housing and mortgage markets have contributed to increased market volatility and diminished expectations for the U.S. and many other economies.
These factors have lead to a decrease in spending by businesses and consumers alike, which may adversely affect our business, results of operations, financial condition and cash flows, to the extent it impacts the liquidity and financial condition of our customers, reduces the extent to which employers are able to offer pharmacy benefits or reduces the number of employees receiving pharmacy benefits through their employer.
19
Table of Contents
Risks Related To Our Business
The enactment and implementation of health care reforms could have a materially adverse effect on the manner in which we operate our business and affect our results of operations, financial position and cash flows.
In 2010, the Patient Protection and Affordable Care Act and a reconciliation measure, the Health Care and Education Reconciliation Act of 2010, were signed into law. These statutes, or the Health Care Law, require significant changes in the manner in which health insurance coverage is administered and made available in the United States, including applicable pharmacy benefits. The Health Care Law contains PBM transparency provisions that will require PBMs like us to report a variety of financial information to the federal government, including pricing, rebate, and discount information, which will be made publicly available by the federal government. While we have historically operated our business in a transparent manner with respect to our clients, there can be no assurance that the public availability of commercial financial information from all PBMs will not adversely alter the discounts, rebates, and fees that PBMs including us can negotiate in the commercial marketplace.
Beyond the provisions directly applicable to PBMs, the Health Care Law contains broad provisions designed to alter the structure of the market for health insurance, and changes in the health insurance market as a whole will impact the market for our pharmacy benefit management services. The Health Care Law defines qualifying health benefits packages, including applicable prescription drug coverage, to be offered by employers or to be obtained by individuals through insurance exchanges. The Health Care Law also contains a variety of requirements applicable to health insurers and pharmaceutical manufacturers, including the elimination of pre-existing condition exclusions and annual and lifetime maximum limits, restrictions on the extent to which policies can be rescinded, establishment of minimum medical cost ratios, the imposition of new and significant taxes on health insurers and health care benefits, and annual fees payable by pharmaceutical manufacturers on brand drugs. Many provisions of the Health Care Law become effective at various dates through 2014, and the impact of the Health Care Law remains uncertain pending promulgation of applicable regulations and implementation of the Health Care Law by health insurers, healthcare providers, pharmaceutical manufacturers, and federal and state authorities. There can be no assurance that the new regulations and implementation of the Health Care Law will not disrupt the market for our PBM services over the next several years, including through our clients reducing or delaying the purchase of PBM services, clients seeking to reduce administrative fees and expenses paid to PBMs, and manufacturers reducing rebates or reducing supplies of certain products. Such market disruptions could have a material adverse effect on our business, results of operations, financial condition, or cash flows.
Competition in our industry is intense and could reduce or eliminate our profitability.
The PBM industry is very competitive. PBM companies compete primarily on the basis of price, service, reporting capabilities and clinical services. If we do not compete effectively, our business, results of operations, financial condition or cash flows could suffer. The industry is highly consolidated and dominated by a few large, profitable, well-established companies with significant financial and marketing resources, purchasing power and other competitive advantages that we do not have. Scale is a particularly important factor in negotiating prices with pharmacies and drug manufacturers. A limited number of firms, including national and regional PBM companies such as Medco Health Solutions, Inc., CVS/Caremark Rx, Inc., and Express Scripts, Inc., have an aggregate market share of approximately 70% of prescription volume. Our competitors also include drug retailers, physician practice management companies and insurance companies/health maintenance organizations. Some of our services, such as disease management services, informed decision counseling services and medical information management services, also compete with those being offered by pharmaceutical manufacturers, specialized disease management companies and information service providers. We may also experience competition from other sources in the future.
We are dependent on a group of key customers, and if we lose key clients as a result of competitive bidding for contracts or contract renewals, consolidation of clients or otherwise, our business, profitability, and growth prospects could suffer.
We depend on a group of clients for a significant portion of our revenue. Our top twenty clients generated approximately 81% of our revenue for the year ended December 31, 2010, including approximately 14% from Wellmark Blue Cross Blue Shield of Iowa and approximately 10% from the State of Maryland. In addition, we generated approximately 7% of our revenue for the three and a half months ended December 31, 2010 from Independence Blue Cross, following our acquisition of FutureScripts LLC on September 13, 2010. Our agreement
20
Table of Contents
with Wellmark Blue Cross Blue Shield terminates in 2017 and our agreement with Independence Blue Cross terminates in 2020, subject in both cases to the client’s right to terminate earlier for breach or if we are unable to provide competitive pricing. Our agreement with the State of Maryland terminates on June 30, 2011. The clients comprising our top twenty clients may change periodically, based on volume, acquisitions, and other factors.
Substantially all of our contracts with our clients are entered into for a specific term, generally three years, and as a result, on average at any time, one-third of our revenue for the preceding twelve months is attributable to agreements that are up for renewal and re-bid over the upcoming twelve months. In addition, substantially all of our contracts with our clients are subject to early termination if either party breaches the agreement. As contracts with our clients approach their termination date, our clients either seek to extend the agreement with us for a specified period, or seek competitive bids from us and other providers for a new agreement. Competitive bidding requires costly and time-consuming efforts and, even after we have won such bidding processes, we can expend significant time and effort in proceedings or litigation contesting the adequacy or fairness of these bidding processes. Historically, we have successfully retained the business of more than 90% of our clients who had contracts scheduled to expire at the beginning of a calendar year or with whom we entered into a competitive re-bid during a calendar year. There can be no assurance, however, that we will successfully extend expiring agreements with our clients, that we will win any competitive bid to renew such agreements, or that we will be able to improve or maintain our historic retention rate of existing business. Our business, financial condition, results of operations, or cash flows could be materially adversely affected if we fail to extend or win competitive renewals with a significant number of our top clients.
In addition, over the past several years, self-funded employers, TPAs and other managed care companies have experienced significant consolidation. Consolidations generally reduce the number of clients who may need our services, and can result in our clients being acquired by companies that may not renew, and in some instances may terminate, the acquired client’s contract with us. If a significant number of our key clients are acquired by, or acquires, companies with which we do not have contracts, or if the financial condition of a significant number of our key clients otherwise deteriorates, our business, financial condition or results of operations could be materially adversely affected.
If we lose pharmacy network affiliations, our business, results of operations, financial condition and cash flows could suffer.
Our operations are dependent to a significant extent on our ability to obtain discounts on prescription purchases from retail pharmacies that can be utilized by our clients and their members. Our contracts with retail pharmacies, which are non-exclusive, are generally terminable by either party on short notice. If one or more of our top pharmacy chains elects to terminate its relationship with us or if we are only able to continue our relationship on terms less favorable to us, access to retail pharmacies by our clients and their health plan members, and consequently our business, results of operations, financial condition or cash flows could suffer. In addition, several large retail pharmacy chains either own or have strategic alliances with PBMs or could attempt to acquire or enter into these kinds of relationships in the future. Ownership of, or alliances with, PBMs by retail pharmacy chains, particularly large pharmacy chains, could have material adverse effects on our relationships with those retail pharmacy chains, particularly the discounts they are willing to make available, and on our business, results of operations, financial condition and cash flows.
If we lose relationships with one or more key pharmaceutical manufacturers or rebate intermediaries, or if rebate payments we receive from pharmaceutical manufacturers or intermediaries decline, our business, results of operations, financial condition and cash flows could suffer.
We receive rebates from rebate intermediaries and numerous pharmaceutical manufacturers based on the use of selected drugs by members of health plans sponsored by our clients, as well as fees for other programs and services. We believe our business, results of operations, financial condition and cash flows could suffer if:
| • | we lose relationships with one or more key pharmaceutical manufacturers or rebate intermediaries; |
| • | we are unable to finalize rebate contracts with one or more key pharmaceutical manufacturers for 2011 or are unable to negotiate interim arrangements; |
21
Table of Contents
| • | rebates decline due to the failure of our health plan sponsors to meet market share or other thresholds, or due to the failure of rebate intermediaries to meet thresholds imposed on them by pharmaceutical manufacturers; |
| • | legal restrictions are imposed on the ability of pharmaceutical manufacturers or rebate intermediaries to offer rebates or purchase our programs or services; |
| • | pharmaceutical manufacturers choose not to offer rebates or purchase our programs or services or those of rebate intermediaries with whom we have arrangements; or |
| • | rebates decline due to contract branded products losing their patents. |
Over the next few years, as patents expire covering many brand name drugs that currently have a substantial market share, generic products will be introduced that may substantially reduce the market share of these brand name drugs. Historically, manufacturers of generic drugs have not offered formulary rebates on their drugs. Our profitability could be adversely affected if the use of newly approved, brand name drugs added to formularies does not offset any decline in use of brand name drugs whose patents expire.
Changes in industry pricing benchmarks could adversely affect our financial performance.
Contracts in the prescription drug industry, including our contracts with our retail pharmacy networks and with our PBM clients, as well as our mail order pharmacy reimbursement rates, generally use certain published benchmarks to establish pricing for prescription drugs. These benchmarks include AWP, AMP and Wholesale Acquisition Cost, or WAC. Most of our contracts utilize the AWP standard. Recent events, including litigation involving First DataBank and Medispan, have raised uncertainties as to whether payors, pharmacy providers, PBMs and others in the prescription drug industry will continue to utilize AWP as it has previously been calculated or whether other pricing benchmarks will be adopted for establishing prices within the industry.
Additionally, CMS regulations regarding the Medicaid AMP calculation could potentially impact our ability to negotiate rebates and discounts, as well as our retail pharmacy network and mail order pricing and PBM client contracts. Because we are awaiting revised final regulations and updated guidance from CMS, we are unable to predict whether and to what extent the updated CMS AMP regulation will impact our business. Thus far, our business has not been materially adversely affected by the AMP regulations.
These matters are discussed in detail under “Business—Government Regulation – Combined Federal and State Laws, Regulations and Other Standards Affecting Our Business — Legislation and Litigation Affecting Drug Prices,” above. We believe that payors, pharmacy providers and PBMs are in the process of evaluating other pricing benchmarks as the basis for contracting for prescription drugs and benefit management services in the future.
Due to these and other uncertainties, we can give no assurance that the long term impact of changes to industry pricing benchmarks will not have a material adverse effect on our financial performance, results of operations, financial condition or cash flows in future periods.
If our business continues to grow rapidly and we are unable to manage this growth, our business, results of operations, financial condition and cash flows could suffer.
Our business has grown rapidly since 2000, in part due to acquisitions, with total annual PBM revenue increasing from $4.9 million in 2000 to $3.8 billion in 2010. Our business strategy is to continue to seek to expand our operations, including through possible acquisitions. If we are unable to finance continued growth, manage future expansion or hire and retain the personnel needed to manage our business successfully, then our business, results of operations, financial condition and cash flows could be adversely affected. Our growth in operations has placed significant demands on our management and other resources, which is likely to continue. Under these conditions, it is important for us to retain our existing management and to attract, hire and retain additional highly skilled and motivated officers, managers and employees.
22
Table of Contents
If we are unable to manage potential problems and risks related to future acquisitions, our business, results of operations, financial condition and cash flows could suffer.
Part of our growth strategy includes making acquisitions involving new markets and complementary products, services, technologies and businesses. If we are unable to overcome the potential problems and inherent risks related to such future acquisitions, our business, results of operations, financial condition and cash flows could suffer. Our ability to continue to expand successfully through acquisitions depends on many factors, including our ability to identify acquisition prospects and negotiate and close transactions. Even if we complete future acquisitions:
| • | we could fail to successfully integrate the operations, services and products of an acquired company; |
| • | there could be inconsistencies in standards, controls, procedures and policies among the companies being combined or assimilated which would make it more difficult to implement and harmonize company-wide financial reporting, accounting, billing, information technology and other systems; |
| • | we may experience difficulties maintaining the quality of products and services that acquired companies have historically provided; |
| • | we could be required to amortize the identifiable intangible assets of an acquired business, which will reduce our net income in the years following its acquisition, and we also would be required to reduce our net income in future years if we were to experience an impairment of goodwill or other intangible assets attributable to an acquisition; |
| • | we could be exposed to unanticipated liabilities of acquired businesses; |
| • | our management’s attention could be diverted from other business concerns; and |
| • | we could lose key employees or customers of the acquired business. |
There are risks associated with integrating and operating newly acquired businesses. We can give no assurance that if we do acquire any new business organizations in the future, we will successfully operate and integrate them. Many companies compete for acquisition opportunities in the PBM industry. Most of our competitors are companies that have significantly greater financial and management resources than we do. This may reduce the likelihood that we will be successful in completing acquisitions necessary to the future success of our business.
Our level of indebtedness could adversely affect our ability to grow our business, our credit ratings and profile, and the covenants and restrictions in our credit facilities could adversely affect our business, financial condition and results of operations.
We may incur substantial indebtedness under our credit facilities, particularly to fund future acquisitions, and our level of indebtedness could adversely affect our financial condition. In such an event, we would be required to devote a portion of our cash flows from operating activities to service our indebtedness, and such cash flows would therefore not be available for other corporate purposes. We have $148.1 million outstanding under our term loan facility. We also have the ability under our credit facilities to draw upon our $200.0 million revolver, and an additional $100.0 million of term loan or revolving loan debt if certain conditions are satisfied under our credit facilities (including the agreement of current or new lenders to extend additional credit to us). We may also seek additional debt financing to fund part of our growth strategy of making acquisitions. Our level of indebtedness may:
| • | adversely impact our ability to obtain additional financing in the future for working capital, capital expenditures, acquisitions or other general corporate purposes; |
| • | require us to dedicate a substantial portion of our cash flow to the payment of interest on our indebtedness; |
| • | subject us to the risk of increased sensitivity to interest rate increases based upon variable interest rates, including our borrowings (if any) under our revolving credit facility; |
23
Table of Contents
| • | increase the possibility of an event of default under the financial and operating covenants contained in our debt instruments; and |
| • | limit our ability to adjust to rapidly changing market conditions, reducing our ability to withstand competitive pressures and make us more vulnerable to a downturn in general economic conditions of our business than our competitors with less debt. |
The operating and financial restrictions and covenants contained in the agreements governing our outstanding and future indebtedness may limit our ability to finance future operations or capital needs, borrow additional funds for development and make certain investments. For example, our credit facilities restrict our ability to, among other things: incur additional debt or issue guarantees; incur or permit certain liens to exist; make certain investments, acquisitions or other restricted payments; modify our organizational documents; dispose of assets; engage in certain types of transactions with affiliates; and merge, consolidate or transfer all or substantially all of our assets.
If we are unable to generate sufficient cash flow from operations in the future to service our debt obligations, we may be required to refinance all or a portion of our existing debt facilities, or to obtain additional financing and facilities. However, we may not be able to obtain any such refinancing or additional facilities on favorable terms or at all.
If we become subject to liability claims that are not covered by our insurance policies, we may be liable for damages and other expenses that could have a material adverse effect on our business, results of operations, financial condition or cash flows.
Various aspects of our business may subject us to litigation and liability for damages. These include, but are not limited to, the performance of PBM services, the operation of our call centers and Web site, and the potential for dispensing errors in the operation of our mail order pharmacies. A successful product or professional liability claim in excess of our insurance coverage where we are required to pay damages, incur legal costs or face negative publicity could have a material adverse effect on our business, results of operations, financial condition or cash flows, our business reputation and our ability to attract and retain clients, network pharmacies, and employees. While we intend to maintain professional and general liability insurance coverage at all times, we cannot provide assurances that we will be able to maintain insurance in the future, that insurance will be available on acceptable terms or that insurance will be adequate to cover any or all potential product or professional liability claims.
Disruption of our point of sale information system and transaction processing system, which relies on third parties, could have a material adverse effect on our business, results of operations, financial condition or cash flows.
Our operations utilize an electronic network connecting over 63,000 retail pharmacies to process third-party claims. This system is provided by a third-party adjudication vendor. Because claims are adjudicated in real time, systems availability and reliability are key to meeting customers’ service expectations. Any interruption in real time service, either through systems availability or telecommunications disruptions can significantly damage the quality of service we provide. Our PBM services also depend on third-party proprietary software to perform automated transaction processing. There can be no assurance that our business will not be harmed by service interruptions or software performance problems.
The failure by our health plan clients to pay for prescription claims or a delay in payment of those claims could have a material adverse effect on our business, results of operations, financial condition or cash flows.
Our contracts with retail pharmacies which participate in our network generally obligate us to make payments for prescription claims even if we are not reimbursed by our clients. If our clients delay their reimbursement payments or fail to make payments for prescription claims, it could have a material adverse effect on our business, results of operations, financial condition or cash flows.
24
Table of Contents
If we fail to comply with complex and rapidly evolving laws and regulations, we could suffer civil and/or criminal penalties, lose clients, be required to pay substantial damages and make significant changes to our operations.
During the past several years, the U.S. health care industry has been subject to an increase in governmental regulation at both the federal and state levels. We are subject to numerous federal and state regulations. If we fail to comply with existing or future applicable laws and regulations, we could suffer civil or criminal penalties. We must devote significant operational and managerial resources to comply with these laws and regulations. Although we believe that we substantially comply with all existing statutes and regulations applicable to our business, different interpretations and enforcement policies of these laws and regulations could subject our current practices to allegations of impropriety or illegality or could require us to make significant changes to our operations. In addition, we cannot predict the impact of future legislation and regulatory changes on our business or assure you that we will be able to obtain or maintain the regulatory approvals required to operate our business.
Among the legislation and government regulations that could affect us as a provider of PBM services are the regulatory matters discussed in detail in under “Business—Government Regulation,” above, specifically including Medicare Part D laws and regulation, federal anti-remuneration/fraud and abuse laws, federal statutes prohibiting false claims, ERISA regulation, FDA regulation, antitrust regulation, health care reform legislation, state anti-remuneration/false claims laws, state consumer protection laws, state comprehensive PBM regulation, network access legislation, state legislation affecting plan or benefit design, state regulation of financial risk plans, state discount drug card regulation, privacy and confidentiality legislation, legislation and litigation affecting drug prices, voluntary industry ethical guidelines, and future legislation or regulatory initiatives.
We are subject to potential lawsuits under ERISA and the potential liabilities associated with being found to be a fiduciary of a health plan governed by ERISA.
As a service provider to ERISA plans, we are subject to potential litigation under ERISA claims and could face potential liabilities if we are found to be acting as a fiduciary of a plan in carrying out the services for which we are under contract. While we do not believe that the general conduct of our business subjects us to the fiduciary obligations set forth by ERISA, except when we have specifically contracted with an ERISA plan sponsor to accept fiduciary responsibility and be named as a fiduciary for certain functions, recent litigation has revealed uncertainties with respect to whether, and under what circumstances, courts will find PBMs to be acting as plan fiduciaries. The potential impact of ERISA liability on our business operations is more fully described in the detailed discussion of ERISA regulation under “Business – Government Regulation-Federal Laws and Regulations Affecting Our Business - ERISA Regulation,” above.
Medicare Part D laws subject us to certain regulations and scrutiny, even in our limited roles as a subcontractor and mail service provider to Part D Plans.
The Medicare Part D program is continuing to evolve, and there are still many uncertainties presented by the program, which is one of the reasons we have opted not to directly sponsor a PDP. However, we do contract with Medicare Part D Plans, as described under “Business—Government Regulation,” above. In the limited capacity of a subcontractor and as a mail service provider, we are indirectly subject to certain regulatory requirements, as more fully described in the detailed discussion of Medicare Part D Laws and Regulations and its potential implications under “Business—Government Regulation,” above.
We face significant competition in attracting and retaining talented employees. Further, managing succession and retention for our Chief Executive Officer and other key executives is critical to our success, and our failure to do so could have an adverse impact on our future performance.
We believe that our ability to retain an experienced workforce and our ability to hire additional qualified employees is essential to meet current and future goals and objectives. However, there is no guarantee that we will be able to attract and retain such employees. An inability to retain existing employees or attract additional employees could have a material adverse effect on our business, results of operations, financial condition and cash flows.
| ITEM 1B. | UNRESOLVED STAFF COMMENTS |
Not applicable.
| ITEM 2. | PROPERTIES |
We lease twenty-three facilities throughout the United States and Puerto Rico. Our corporate headquarters office, containing approximately 75,000 square feet, is located in Rockville, Maryland and accommodates our executive and corporate functions. We also have satellite offices in Alabama, Colorado, Florida, Georgia, Hawaii, Iowa, Michigan, Minnesota, Mississippi, Missouri, Nevada, North Carolina, Ohio, Pennsylvania, Puerto Rico and Texas. We believe all of our facilities are well-maintained and in good operating condition and have adequate capacity to meet our current business needs.
25
Table of Contents
Fifteen of our twenty-two satellite offices, with a total of 164,000 square feet, are under leases that expire over terms through 2023 and the other offices are under a month-to-month lease. We believe that suitable space on commercially reasonable terms will be available to us as required.
| ITEM 3. | LEGAL PROCEEDINGS |
From time to time we become subject to legal proceedings and claims in the ordinary course of business. Such claims, even if without merit, could result in the significant expenditure of our financial and managerial resources. We are not aware of any legal proceedings or claims that we believe will, individually or in the aggregate, materially harm our business or have a material adverse effect on our financial condition, results of operations or cash flows.
| ITEM 4. | (REMOVED AND RESERVED) |
26
Table of Contents
PART II
| ITEM 5. | MARKET FOR REGISTRANT’S COMMON EQUITY, RELATED STOCKHOLDER MATTERS AND ISSUER PURCHASES OF EQUITY SECURITIES |
Market Information
Our common stock is traded on the NASDAQ Global Select Market under the symbol “CHSI.” The following table sets forth, for each period indicated, the range of high and low sales closing prices for our common stock:
| High | Low | |||||||
| 2009 |
||||||||
| First quarter |
$ | 24.41 | $ | 16.18 | ||||
| Second quarter |
$ | 24.94 | $ | 19.53 | ||||
| Third quarter |
$ | 30.85 | $ | 23.40 | ||||
| Fourth quarter |
$ | 37.05 | $ | 28.07 | ||||
| 2010 |
||||||||
| First quarter |
$ | 43.83 | $ | 36.56 | ||||
| Second quarter |
$ | 45.00 | $ | 33.67 | ||||
| Third quarter |
$ | 43.64 | $ | 32.28 | ||||
| Fourth quarter |
$ | 47.21 | $ | 34.66 | ||||
On February 15, 2011, the closing sale price of our common stock, as reported by the NASDAQ Global Select Market, was $44.90 per share.
Holders
As of February 15, 2011, there were approximately 23,907 holders of our common stock either of record or in street name.
Dividend Policy
We have never paid a dividend on our common stock and have no present intention on commencing the payment of cash dividends. It is possible that the Board could determine in the future, based on our financial and other relevant circumstances at that time, to pay dividends.
Recent Sales of Unregistered Securities
Pursuant to our acquisition of inPharmative on August 25, 2010, we issued 100,000 common stock warrants. These warrants, which expire on August 25, 2013, have an exercise price of $44.73 per share and were valued at approximately $1.0 million using the Black-Scholes equity-pricing model. The warrants remained issued and outstanding at December 31, 2010. The 100,000 common stock warrants were issued in a private placement exempt from registration pursuant to Section 4(2) of the Securities Act of 1933, as amended.
Additionally, we issued 1,500 shares of our common stock in 2010, 2009 and 2008 to a non-employee pursuant to previously executed consulting services agreements. These issuances were made in reliance upon Section 4(2) of the Securities Act of 1933, as amended.
Securities Authorized for Issuance under Equity Compensation Plans
This information is discussed in Part III, Item 12 of this Annual Report on Form 10-K.
27
Table of Contents
Comparative Stock Performance
The following graph compares the performance of our common stock with the cumulative total return of companies in the NASDAQ Stock Market (U.S. Companies) Index and the Russell 2000 Index. All indices shown in the graph have been reset to a base of 100 as of December 31, 2005 and assume an investment of $100.00 on that date and the reinvestment of dividends paid since that date. On December 31, 2005, our common stock closed at $25.10 per share. We have never paid cash dividends on our common stock.
The comparisons in the graph are provided in response to disclosure requirements of the SEC and are not intended to forecast or be indicative of future performance of our common stock.
Comparison of 5 Year Cumulative Total Return
Among Catalyst Health Solutions, Inc., NASDAQ Stock Market and Russell 2000 Index
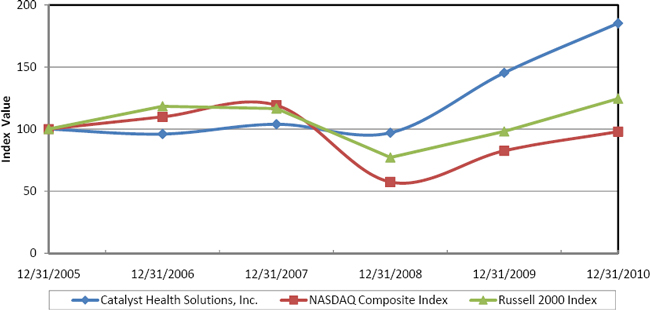
Cumulative Total Return Summary
| 12/31/05 | 12/31/06 | 12/31/07 | 12/31/08 | 12/31/09 | 12/31/10 | |||||||||||||||||||
| Catalyst Health Solutions, Inc. |
$ | 100.00 | $ | 96.00 | $ | 103.89 | $ | 97.01 | $ | 145.30 | $ | 185.22 | ||||||||||||
| NASDAQ Composite Index |
100.00 | 109.84 | 119.14 | 57.41 | 82.53 | 97.95 | ||||||||||||||||||
| Russell 2000 Index |
100.00 | 118.37 | 116.52 | 77.15 | 98.11 | 124.46 | ||||||||||||||||||
Prepared by Zacks Investment Research, Inc. Copyright 1980-2011. Center for Research in Security Prices (CRSP®), Graduate School of Business, The University of Chicago. Used with permission. All rights reserved.
28
Table of Contents
| ITEM 6. | SELECTED FINANCIAL DATA |
The following selected financial data has been derived from the audited financial statements of the Company. We have completed a number of acquisitions over the past five years which may affect year-over-year comparisons of our selected financial data. The revenue and operating results related to acquisitions of companies are included from the respective acquisition dates. The selected financial data should be read in conjunction with “Management’s Discussion and Analysis of Financial Condition and Results of Operations” included as Item 7 of this Annual Report on Form 10-K and with the audited Consolidated Financial Statements and related Notes included as Item 8 of this Annual Report on Form 10-K. The historical results set forth in this Item 6 are not necessarily indicative of the results of operations to be expected in the future.
| For the Years Ended December 31, | ||||||||||||||||||||
| 2010 (1) | 2009 (2) | 2008 (3) | 2007 (4) | 2006 (5) | ||||||||||||||||
| (In thousands, except per share data) | ||||||||||||||||||||
| Statement of Operations Data: |
||||||||||||||||||||
| Revenue |
$ | 3,764,092 | $ | 2,894,380 | $ | 2,543,379 | $ | 1,857,697 | $ | 1,271,006 | ||||||||||
| Direct expenses |
3,529,843 | 2,708,616 | 2,400,125 | 1,747,264 | 1,176,877 | |||||||||||||||
| Selling, general and administrative |
101,745 | 81,036 | 67,822 | 53,994 | 46,414 | |||||||||||||||
| Total operating expenses |
3,631,588 | 2,789,652 | 2,467,947 | 1,801,258 | 1,223,291 | |||||||||||||||
| Operating income |
132,504 | 104,728 | 75,432 | 56,439 | 47,715 | |||||||||||||||
| Interest and other income |
937 | 782 | 4,542 | 6,693 | 5,284 | |||||||||||||||
| Interest expense |
(3,027 | ) | (560 | ) | (311 | ) | (162 | ) | (769 | ) | ||||||||||
| Income before income taxes |
130,414 | 104,950 | 79,663 | 62,970 | 52,230 | |||||||||||||||
| Income tax expense |
49,457 | 39,785 | 29,269 | 23,671 | 20,408 | |||||||||||||||
| Net income |
80,957 | 65,165 | 50,394 | 39,299 | 31,822 | |||||||||||||||
| Less: Net income attributable to non-controlling interest |
— | — | — | 31 | 248 | |||||||||||||||
| Net income attributable to the Company |
$ | 80,957 | $ | 65,165 | $ | 50,394 | $ | 39,268 | $ | 31,574 | ||||||||||
| Net income per share attributable to the Company, basic |
$ | 1.85 | $ | 1.51 | $ | 1.18 | $ | 0.95 | $ | 0.78 | ||||||||||
| Net income per share attributable to the Company, diluted |
$ | 1.82 | $ | 1.48 | $ | 1.16 | $ | 0.91 | $ | 0.75 | ||||||||||
| Weighted average shares of common stock outstanding, basic |
43,855 | 43,128 | 42,527 | 41,525 | 40,270 | |||||||||||||||
| Weighted average shares of common stock outstanding, diluted |
44,536 | 43,942 | 43,588 | 43,006 | 42,319 | |||||||||||||||
| Balance Sheet Data (as of December 31): |
||||||||||||||||||||
| Cash, cash equivalents and short-term investments |
$ | 157,843 | $ | 152,055 | $ | 54,979 | $ | 124,573 | $ | 91,701 | ||||||||||
| Total assets |
1,142,036 | 832,921 | 701,637 | 551,430 | 436,024 | |||||||||||||||
| Debt: |
||||||||||||||||||||
| Current maturities of long-term debt |
7,500 | — | — | — | — | |||||||||||||||
| Long-term debt |
140,625 | — | — | — | — | |||||||||||||||
| Total liabilities |
603,913 | 391,924 | 337,708 | 251,150 | 194,729 | |||||||||||||||
| Total stockholders’ equity |
538,123 | 440,997 | 363,929 | 300,280 | 241,295 | |||||||||||||||
| (1) | Includes the acquisitions of FutureScripts, LLC and FutureScripts Secure LLC (collectively, “FutureScripts”) effective September 13, 2010. |
| (2) | Effective January 1, 2009, the Company adopted (a) the Financial Accounting Standards Board’s, or FASB, revised authoritative guidance for business combinations and (b) the FASB’s authoritative guidance for fair value measurements for non-financial assets and liabilities that are measured at fair value on a non-recurring basis. See “Note 11. Business Combinations” and “Note 7. Fair Value Measurements,” respectively, of our consolidated financial statements. |
| (3) | Effective January 1, 2008, the Company adopted the FASB’s authoritative guidance for fair value measurements, with the exception of the application of the statement to non-recurring non-financial assets and non-financial liabilities. See “Note 7. Fair Value Measurements” of our consolidated financial statements. |
| (4) | Effective January 1, 2007, the Company adopted the FASB’s authoritative guidance for accounting for uncertain tax positions. See “Note 9. Income Taxes” of our consolidated financial statements. |
| (5) | Effective January 1, 2006, the Company adopted the FASB’s revised authoritative guidance for accounting for stock compensation. See “Note 10. Stockholders’ Equity” of our consolidated financial statements. |
29
Table of Contents
| ITEM 7. | MANAGEMENT’S DISCUSSION AND ANALYSIS OF FINANCIAL CONDITION AND RESULTS OF OPERATIONS |
This Form 10-K may contain forward-looking statements within the meaning of Section 21E of the Securities Exchange Act of 1934, as amended. These forward-looking statements involve a number of risks and uncertainties including, without limitation, those identified under Item 1A. “Risk Factors” and elsewhere in this Form 10-K. We undertake no obligation to revise any forward-looking statements in order to reflect events or circumstances that may arise after the date of this Report. Readers are urged to carefully review and consider the various disclosures made in this report and in our other filings with the SEC that attempt to advise interested parties of the risks and factors that may affect our business.
COMPANY OVERVIEW
Catalyst Health Solutions, Inc. is a full-service pharmacy benefit management, or PBM, company. We operate primarily under the brand name Catalyst Rx. We are built on strong, innovative principles in the management of prescription drug benefits and our client-centered philosophy contributes to our industry-leading customer service and client retention rates. Our clients include self-insured employers, including state and local governments; managed care organizations, or MCOs; unions; third-party administrators, or TPAs; hospices; and individuals who contract with us to administer the prescription drug component of their overall health benefit programs.
We provide our clients access to a contracted, non-exclusive national network of approximately 63,000 pharmacies. We provide our clients and their members with timely and accurate benefit adjudication, while controlling pharmacy spending trends through customized plan designs, clinical programs, physician orientation programs, and member education. We use an electronic point-of-sale system of eligibility verification and plan design information and offer access to rebate arrangements for certain branded pharmaceuticals. When a member of one of our clients presents a prescription or health plan identification card to a retail pharmacist in our network, the system provides the pharmacist with access to online information regarding eligibility, patient history, health plan formulary listings, and contractual reimbursement rates. The member generally pays a co-payment to the retail pharmacy and the pharmacist fills the prescription. We electronically aggregate pharmacy benefit claims, which include prescription costs plus our claims processing fees for consolidated billing and payment. We receive payments from clients, including applicable claims processing fees, and make payments of amounts owed to the retail pharmacies pursuant to our negotiated rates. Total claims processed increased to 70.2 million in 2010 from 56.2 million in 2009. Our revenue increased by approximately 30% to $3.8 billion in 2010 from $2.9 billion in 2009.
Pharmacy benefit claims payments from our clients are recorded as revenue, and prescription costs to be paid to pharmacies are recorded as direct expenses. Under our network contracts, we generally have an independent obligation to pay pharmacies for the drugs dispensed and, accordingly, have assumed that risk independent of our clients. When we administer pharmacy reimbursement contracts and do not assume a credit risk, we record only our administrative or processing fees as revenue. Rebates earned under arrangements with manufacturers or third party intermediaries are predominately recorded as a reduction of direct expenses. The portion of manufacturer or third party intermediary rebates due to clients is recorded as a reduction of revenue. We refine our rebate estimates each period based on actual collection and payment experiences.
Member co-payments to pharmacies are not recorded as revenue or direct expenses. We incur no obligations for co-payments to pharmacies and have never made such payments. Under our pharmacy agreements, the pharmacy is solely obligated to collect the co-payments from the members. If we had included co-payments in our reported revenue and direct expenses, it would have resulted in an increase in our reported revenue and direct expenses of approximately $1.0 billion, $0.8 billion and $0.8 billion for the years ended December 31, 2010, 2009 and 2008, respectively. Our operating and net income, consolidated balance sheets and statements of cash flows would not have been affected.
30
Table of Contents
The following table illustrates the effects on the reported revenue and direct expenses if we had included the actual member co-payments as indicated by our claims processing system (in millions):
| For the years ended December 31, | ||||||||||||
| 2010 | 2009 | 2008 | ||||||||||
| Reported revenue |
$ | 3,764.1 | $ | 2,894.4 | $ | 2,543.4 | ||||||
| Member co-payments |
1,025.3 | 810.6 | 753.5 | |||||||||
| Total |
$ | 4,789.4 | $ | 3,705.0 | $ | 3,296.9 | ||||||
| Reported direct expenses |
$ | 3,529.8 | $ | 2,708.6 | $ | 2,400.1 | ||||||
| Member co-payments |
1,025.3 | 810.6 | 753.5 | |||||||||
| Total |
$ | 4,555.1 | $ | 3,519.2 | $ | 3,153.6 | ||||||
ACQUISITIONS
Our business has grown rapidly since 2000, in part due to acquisitions, with total annual PBM revenue increasing from $4.9 million in 2000 to $3.8 billion in 2010. Our business strategy is to continue to seek to expand our operations, including through making acquisitions involving new markets and complementary products, services, technologies and businesses. We strive to timely integrate our acquisitions into our financial, organizational, management and technology structure. When successfully integrated, we expect to achieve cost savings from the consolidation of certain corporate activities and the elimination of certain duplicate components of our corporate operations.
Acquisition of FutureScripts, LLC
On September 13, 2010, we completed the acquisition of FutureScripts, LLC and FutureScripts Secure LLC (collectively, “FutureScripts”). FutureScripts, formed in 2006, was the PBM subsidiary of Independence Blue Cross (“IBC”). FutureScripts provides pharmacy benefit management services to approximately 1 million lives and manages over 14 million prescriptions annually. We manage these pharmacy benefits under the terms of a 10-year contract. Under the terms of the acquisition agreement, we maintain the FutureScripts brand and provide IBC a full complement of services, including: claims adjudication, member services, network administration, formulary management and rebate contracting, mail and specialty drug management, clinical services, data reporting and analytics, as well as client service and sales support.
Total consideration for the acquisition of FutureScripts consisted of cash payments of $225.5 million. The purchase price was funded from our cash on hand. We incurred approximately $1.5 million of acquisition-related costs, which are included in selling, general and administrative expenses in our consolidated statements of operations for the twelve months ended December 31, 2010.
The purchase price of FutureScripts was largely determined on the basis of management’s expectations of future earnings and cash flows, resulting in the recognition of goodwill. Management’s preliminary allocation of the purchase price to the net assets acquired resulted in goodwill of $111.2 million, trade name intangibles of $20.0 million with an estimated useful life of 20 years, and customer contract intangibles of $90.0 million with an estimated useful life of 10 years. Because valuations of acquired assets and liabilities are in process, and information may become available within the measurement period which indicates a potential change to these valuations, the purchase price allocation is subject to adjustment.
Acquisition of inPharmative, Inc.
On August 25, 2010, we acquired inPharmative, Inc. for a cash payment of $16.5 million and 100,000 common stock warrants valued at approximately $1.0 million using the Black-Scholes option pricing model. inPharmative, which is based in Kansas City, MO, is a provider of rebate administration technology tools to PBMs, health plans, state Medicaid programs and group purchasing organizations.
The purchase price of inPharmative was largely determined on the basis of management’s expectations of future earnings and cash flows, resulting in the recognition of goodwill. Management’s final allocation of the
31
Table of Contents
purchase price to the net assets acquired resulted in goodwill of $12.6 million, customer relationships of $3.2 million with an estimated useful life of 12 years, technology software of $0.7 million with an estimated useful life of 3 years, and trade name intangibles of $0.5 million with an estimated useful life of 20 years. Goodwill related to this acquisition is deductible for tax purposes.
Acquisition of Total Script, LLC
On July 16, 2009, we purchased Total Script, LLC, a pharmacy benefit management company with a strategic focus on the small- to mid-sized employer group markets. Total consideration for the acquisition of Total Script consisted of cash payments of $13.5 million. We incurred approximately $0.2 million of acquisition-related costs, which are included in selling, general and administrative expenses in our consolidated statements of operations for the year ended December 31, 2009. Additionally, the purchase agreement includes contingent consideration payable over a three-year period based on the achievement of certain milestones and on net new business contracted. The fair value of the net contingent consideration recognized on the acquisition date, which was determined using expected present value techniques, was approximately $13.4 million. During 2010, we made contingent consideration payments of $3.2 million, based on the achievement of certain milestones and net new business acquired. Additionally, during 2010 and 2009, there were decreases of $1.1 million and $0.1 million, respectively, in the fair value of recognized amounts for the remaining contingent consideration primarily due to revised assumptions regarding net new business contracted. The adjustments of the fair value of recognized amounts for contingent consideration were included in our consolidated statement of operations.
The purchase price of Total Script was largely determined on the basis of management’s expectations of future earnings and cash flows, resulting in the recognition of goodwill. Management’s allocation of the purchase price to the net assets acquired resulted in goodwill of $21.6 million and PBM customer relationship intangibles of $5.1 million with an estimated useful life of 14 years. Goodwill related to this acquisition is deductible for tax purposes.
Other acquisitions
To support our geographic expansion and growth, we have periodically completed various insignificant business acquisitions to secure local operating assets, new pharmacy network contracts and local market executive offices. None of these transactions has had any significant impact on our reported revenues, assets or results of operations.
RESULTS OF OPERATIONS
Year Ended December 31, 2010 Compared to Year Ended December 31, 2009
Revenue. Revenue from operations for the years ended December 31, 2010 and 2009 were approximately $3.8 billion and $2.9 billion, respectively. Revenue increased over the comparable period in 2009 by $0.9 billion. Total claims processed increased to 70.2 million in 2010 from 56.2 million in 2009. Our initiation of services with several new PBM clients and our acquisition of FutureScripts, inPharmative and Total Script were the primary contributors to the increase in our revenue and prescription volume. Also, for the year ended December 31, 2010, in accordance with applicable accounting guidance, acquisition related intangible amortization expense of $2.7 million for a customer contract related to a PBM agreement has been included as an offset to revenue. For the year ended December 31, 2010, our revenue per claims processed increased by approximately 4% when compared to the same period in 2009. The increase in revenue per claims processed for 2010 was primarily caused by manufacturer-driven price inflation and increased use of specialty medications offset by an increase in generic utilization. Additionally, the portion of manufacturer or third party intermediary rebates due to clients is recorded as a reduction of revenue. For the year ended December 31, 2010, adjustments made to these rebate payable estimates from prior periods increased revenue by $3.5 million, or approximately 0.1%.
Direct Expenses. Direct expenses for the years ended December 31, 2010 and 2009 were approximately $3.5 billion and $2.7 billion, respectively. Direct expenses increased by $0.8 billion over the comparable period in 2009 primarily related to the $0.9 billion increase in revenue. Direct expenses for 2010 and 2009 represented 97.2% and 97.1% of total operating expenses for the respective periods. Rebates earned under arrangements with manufacturers or third party intermediaries are recorded as a reduction of direct expenses. For the year ended December 31, 2010, adjustments made to these rebate receivable estimates from prior periods reduced direct expenses by $4.8 million, or approximately 0.1%.
32
Table of Contents
Gross margin is calculated as revenue less direct expenses. Factors that can result in changes in gross margins include generic substitution rates, changes in the utilization of preferred drugs with higher discounts and changes in the volume of prescription dispensing at lower-cost network pharmacies. Our gross margin increased to $234.2 million for the year ended December 31, 2010 from $185.8 million for the comparable period in 2009. Gross margin as a percentage of revenue was 6.2% and 6.4% for the years ended December 31, 2010 and 2009, respectively. In 2010, gross margin percentages were slightly reduced by the impact of the addition of several recent new large contracts and renewals, including the Michigan Public School Employees Retirement System and the State of Louisiana. These decreases were somewhat offset by gross margin improvements resulting from an increased level of generic substitution and higher network discount rates.
Selling, General and Administrative. For the year ended December 31, 2010, selling, general and administrative expenses increased by $20.7 million over the prior year to $101.7 million, or 2.8% of operating expenses. For the year ended December 31, 2009, selling, general and administrative expenses was $81.0 million, or 2.9% of total 2009 operating expenses. The increase in selling, general and administrative expenses was primarily associated with our growth and the associated personnel, facility and vendor costs to serve and implement new clients, as well as incremental selling, general and administrative costs related to pursuing potential acquisitions.
Selling, general and administrative expenses of $101.7 million for the year ended December 31, 2010, consisted of $50.0 million in compensation and benefits, which includes $5.5 million in non-cash compensation, $14.2 million in professional fees, which includes transaction related costs, $10.3 million in facility costs, $5.6 million in travel expenses, $3.4 million in insurance and other corporate expenses, $1.6 million in non-employee non-cash compensation expense, $4.6 million in other, which includes $1.1 million in recruitment and temporary help, and $12.0 million in depreciation and amortization.
Selling, general and administrative expenses of $81.0 million for the year ended December 31, 2009, consisted of $41.0 million in compensation and benefits, which includes $4.3 million in non-cash compensation, $8.2 million in professional fees and technology services, $9.7 million in facility costs, $2.9 million in travel expenses, $3.4 million in insurance and other corporate expenses, $2.2 million in non-employee non-cash compensation expense, $3.9 million in other, which includes $0.9 million in recruitment and temporary help, and $9.7 million in depreciation and amortization.
Interest and Other Income. Interest and other income increased to $0.9 million for the year ended December 31, 2010 from $0.8 million for the year ended December 31, 2009.
Interest Expense. Interest expense increased to $3.0 million for the year ended December 31, 2010 from $0.6 million in the comparable period in 2009. The increase in interest expense was primarily attributable to the expense associated with our new credit facilities and the amortization of related debt financing costs.
Income Tax Expense. The effective income tax rates of 37.9% in 2010 and 2009 represent the combined federal and state income tax rates adjusted as necessary based on the particular jurisdictions where we operate.
Net Income. Net income for year ended December 31, 2010 increased by approximately $15.8 million over the same period in 2009 to $81.0 million. The increase in net income was primarily a function of increased gross margin, reduced by an increase in selling, general and administrative expenses.
Year Ended December 31, 2009 Compared to Year Ended December 31, 2008
Revenue. Revenue from operations for the years ended December 31, 2009 and 2008 were approximately $2.9 billion and $2.5 billion, respectively. Revenue increased over the comparable period in 2008 by $0.4 billion. Total claims processed increased to 56.2 million in 2009 from 52.0 million in 2008. The primary contributors to the increase in revenue and prescription volume were our acquisition of Total Script, IPS and HospiScript, as well as our initiation of services with several new PBM clients. For the year ended December 31, 2009, our revenue per claims processed increased by approximately 5% when compared to the same period in 2008. The increase in revenue per claims processed for 2009 was primarily caused by manufacturer-driven price inflation and increased use of specialty medications offset by an increase in generic utilization.
33
Table of Contents
Direct Expenses. Direct expenses for the years ended December 31, 2009 and 2008 were approximately $2.7 billion and $2.4 billion, respectively. Direct expenses increased by $0.3 billion over the comparable period in 2008 primarily related to the $0.4 billion increase in revenue. Direct expenses for 2009 and 2008 represented 97.1% and 97.3% of total operating expenses for the respective periods.
Gross margin is calculated as revenue less direct expenses. Factors that can result in changes in gross margins include generic substitution rates, changes in the utilization of preferred drugs with higher discounts, changes in net rebate reimbursements and changes in the volume of prescription dispensing at lower-cost network pharmacies. Our gross margin increased to $185.8 million for the year ended December 31, 2009 from $143.3 million for the comparable period in 2008.
Gross margin as a percentage of revenue was 6.4% and 5.6% for the years ended December 31, 2009 and 2008, respectively. In 2009, we experienced gross margin improvements resulting from our mail service pharmacy operations, higher generic utilization, contribution of performance management fees, enhanced drug manufacturer rebates, improved pharmacy reimbursement rates and higher formulary compliance.
Selling, General and Administrative. For the year ended December 31, 2009, selling, general and administrative expenses increased by $13.2 million over the prior year to $81.0 million, or 2.9% of operating expenses. For the year ended December 31, 2008, selling, general and administrative expenses was $67.8 million, or 2.7% of total 2008 operating expenses. The increase in selling, general and administrative expenses in 2009 was primarily driven by our growth and the associated personnel, facility and vendor costs to serve and implement new clients. Additionally, we incurred incremental selling, general and administrative expenses related to our evaluation of various strategic opportunities, as well as assumed selling, general and administrative expenses from our acquisitions of Total Script, IPS, and HospiScript.
Selling, general and administrative expenses of $81.0 million for the year ended December 31, 2009, consisted of $41.0 million in compensation and benefits, which includes $4.3 million in non-cash compensation, $8.2 million in professional fees and technology services, $9.7 million in facility costs, $2.9 million in travel expenses, $3.4 million in insurance and other corporate expenses, $2.2 million in non-employee non-cash compensation expense, $3.9 million in other, which includes $0.9 million in recruitment and temporary help, and $9.7 million in depreciation and amortization.
Selling, general and administrative expenses of $67.8 million for the year ended December 31, 2008, consisted of $34.1 million in compensation and benefits, which includes $5.2 million in non-cash compensation, $6.3 million in professional fees and technology services, $8.4 million in facility costs, $3.3 million in travel expenses, $3.0 in insurance and other corporate expenses, $4.1 million in other, which includes $1.2 million in recruitment and temporary help, and $8.6 million in depreciation and amortization.
Interest and Other Income. Interest and other income decreased to $0.8 million for the year ended December 31, 2009 from $4.5 million for the year ended December 31, 2008. The decrease was primarily due to a reduction in average market interest rates on our short-term investments.
Interest Expense. Interest expense increased to $0.6 million for the year ended December 31, 2009 from $0.3 million in the comparable period in 2008. The increase in interest expense was primarily attributable to the expense associated with the accretion of the liability related to our First Rx Specialty and Mail Services, LLC arrangement.
Income Tax Expense. The effective income tax rates of 37.9% in 2009 and 36.7% in 2008 represent the combined federal and state income tax rates adjusted as necessary based on the particular jurisdictions where we operate. The effective tax rate in 2009 was higher than in 2008 primarily due to an increase in our overall state effective income tax rates.
Net Income. Net income for year ended December 31, 2009 increased by approximately $14.8 million over the same period in 2008 to $65.2 million. The increase in net income was primarily a function of increased gross margin, reduced by an increase in selling, general and administrative expenses.
34
Table of Contents
LIQUIDITY AND CAPITAL RESOURCES
Our sources of funds are primarily cash flows from operating activities. We have in the past also raised funds by borrowing on bank debt and selling equity in the capital markets to fund specific acquisition opportunities. During the last several years, we have generated positive cash flow from operations and anticipate similar results in 2011. At December 31, 2010, our cash and cash equivalents were $157.8 million. The net increase of $5.8 million in our cash and cash equivalents since the end of fiscal 2009 resulted primarily from cash used in investing activities offset by proceeds from our term loan facility, as described below.
On August 4, 2010, we entered into new senior credit facilities consisting of a revolving credit facility and term loan facility. The term loan facility has a principal amount of $150.0 million. Our revolving credit facility has a principal amount of $200.0 million. Each of our revolving credit facility and our term loan facility matures on August 4, 2015. In addition to the revolving credit facility and term loan facility, our new senior credit facilities permit us to incur up to $100.0 million in total principal amount of additional term loan or revolving loan indebtedness under the senior credit facilities. Our obligations under our new senior credit facilities are fully and unconditionally guaranteed jointly and severally by us and certain of our U.S. subsidiaries currently existing or that we may create or acquire, with certain exceptions as set forth in our credit agreement, pursuant to the terms of a separate guarantee and collateral agreement. There was no outstanding balance under the revolving credit facility at December 31, 2010.
The term loan facility amortizes in nominal quarterly installments of $1.875 million on the last day of each calendar quarter, commencing on December 31, 2010 until maturity, whereby the final installment of the term loan facility will be paid on the maturity date in an amount equal to the aggregate unpaid principal amount. We anticipate repaying this term loan facility through our operating cash flows.
As previously disclosed, we were exploring and pursuing alternatives for obtaining relief from the unanticipated temporary illiquidity of our auction rate securities (“ARS”) holdings, including seeking relief from entities involved in investing our funds in ARS. As a part of these efforts, on February 23, 2009, we brought an arbitration claim before the Financial Industry Regulatory Authority (“FINRA”) against Credit Suisse Securities (USA), LLC (“Credit Suisse”) seeking rescission, restitution and damages for Credit Suisse’s conduct in connection with our investment account with Credit Suisse. On May 27, 2010, the arbitration panel ruled in our favor, finding Credit Suisse liable and requiring Credit Suisse to pay us $9.75 million, representing the par value of the remaining outstanding ARS in our Credit Suisse investment account on the date of the ruling. These ARS in our Credit Suisse investment account were transferred to Credit Suisse.
We currently have remaining $0.6 million at par value in investments related to ARS. Although we continue to receive timely interest payments, our ARS investments currently lack short-term liquidity and are therefore classified as non-current on our balance sheet. For each of our ARS, we evaluate the risks related to the structure, collateral and liquidity and estimate the fair value of the securities using a discounted cash flow model based on (a) the underlying structure of each security; (b) the present value of future principal and interest payments discounted at rates considered to reflect current market conditions; and (c) considerations of the probabilities of redemption or auction success for each period. Based on the results of these assessments, we recorded temporary impairment charges in accumulated other comprehensive income of $48 thousand through December 31, 2010 to reduce the value of our ARS classified as available-for-sale securities.
Effective April 1, 2009, we adopted the authoritative guidance which amended the other-than-temporary impairment model for debt securities. Under this new guidance, other-than-temporary impairment must be recognized through earnings if an investor has the intent to sell the debt or if it is more likely than not that the investor will be required to sell the debt security before recovery of its amortized cost basis. However, even if an investor does not expect to sell a debt security, it must evaluate expected cash flows to be received and determine if a credit loss has occurred. In the event of a credit loss, only the amount of the impairment associated with the credit loss is recognized in income. The amount of the impairment relating to other factors is recorded in accumulated other comprehensive income. The guidance also requires additional disclosures regarding the calculation of the credit loss and the factors considered in reaching a conclusion that an investment is not other-than-temporarily
35
Table of Contents
impaired. As of December 31, 2010, based on our evaluation of cash flows expected to be recovered from these securities, we determined there was no credit loss related to our ARS and, accordingly, no impairment losses have been recognized through earnings in 2010.
In connection with First Rx Specialty and Mail Services, LLC, an entity we formed in December 2008, we received $8.0 million in cash through December 31, 2010. As a part of this arrangement, we are also recognizing expense associated with the accretion of the liability to its ultimate redemption value of $9.0 million. We have a contractual obligation to redeem the total amount in cash in the year 2013. This obligation is included in other current liabilities in our consolidated balance sheet at December 31, 2010, because unilateral contract termination rights are exercisable beginning on December 1, 2011 and may require us to satisfy the obligation on demand.
Net Cash Provided by Operating Activities. Our operating activities generated $97.7 million of cash from operations in 2010, a $14.4 million decrease from the $112.1 million generated in 2009. This $97.7 million in cash provided by operating activities in 2010 reflects $81.0 million in net income, plus $27.4 million in non-cash charges and $10.7 million net decrease in cash from changes in working capital and other assets and liabilities. This $10.7 million net decrease in cash provided by changes in working capital, net of effects from acquisitions, was primarily due to changes in rebates receivable of $4.6 million, inventory of $0.2 million, rebates payable of $19.2 million and accrued expense and other liabilities of $28.3 million, offset by changes in accounts receivable of $5.5 million, income tax receivable of $1.1 million, accounts payable of $48.4 million and other assets of $8.0 million. The change in rebates payable and in accrued expenses and other liabilities reflects the temporary benefit in the timing of payments of these payables and liabilities. The change in accounts payable reflects the timing of payments of our accounts payable.
Our operating activities generated $112.1 million of cash from operations in 2009, a $33.5 million increase from the $78.6 million generated in 2008. This $112.1 million in cash provided by operating activities in 2009 reflects $65.2 million in net income, plus $19.9 million in non-cash charges and $27.0 million net increase in cash from changes in working capital and other assets and liabilities. This $27.0 million net increase in working capital, net of effects of acquisitions, was primarily due to changes in accounts receivable of $18.3 million, accounts payable of $13.0 million, rebates payable of $13.3 million, accrued liabilities of $9.1 million, income tax receivable of $1.2 million and inventory of $1.3 million, offset by changes in rebates receivable of $25.9 million and other assets of $3.3 million.
Our operating activities generated $78.6 million of cash from operations in 2008, a $24.0 million increase from the $54.6 million generated in 2007. This $78.6 million in cash provided by operating activities in 2008 reflects $50.4 million in net income, plus $17.4 million in non-cash charges and $10.8 million net increase in cash from changes in working capital and other assets and liabilities. This $10.8 million net increase in working capital was primarily due to changes in accounts payable of $23.9 million, rebates payable of $35.0 million and inventory of $2.1 million, offset by changes in accounts receivable of $23.9 million, rebates receivable of $25.6 million and income tax receivable of $0.7 million.
Net Cash Used in Investing Activities. Net cash used in investing activities for the year ended December 31, 2010 was $240.3 million, compared to $21.5 million in 2009. The cash used in 2010 reflects expenditures of $239.9 million for business acquisitions, net of cash acquired, and $12.3 million in capital expenditures offset by investment sales of $11.9 million.
Net cash used in investing activities for the year ended December 31, 2009 was $21.5 million, compared to $120.3 million in 2008. The cash used in 2009 reflects $11.4 million in business acquisitions and related payments and $10.0 million in capital expenditures (net of proceeds from sale of property and equipment of $0.5 million) and other net investing activities of $0.1 million.
Net cash used in investing activities for the year ended December 31, 2008 was $120.3 million, compared to $37.2 million in 2007. During 2008, approximately $142.4 million of cash was used relating to business acquisitions. Additionally, during 2008, we had $8.7 million in capital expenditures and net sales of marketable securities of $30.9 million.
Net Cash Provided by Financing Activities. Net cash provided by financing activities for the year ended December 31, 2010 was $148.4 million compared to $6.4 million in 2009. In 2010, we received $150.0 million in
36
Table of Contents
proceeds from a term loan, $3.6 million from the exercise of stock options, $0.3 million in proceeds from issuance of common stock pursuant to our employee stock purchase plan and had an income tax benefit of $6.0 million related to the exercise of stock options and restricted stock vesting. Additionally, we purchased $2.6 million of treasury stock during 2010, incurred $3.8 million in deferred financing cost related to our new credit facilities, made a repayment of $1.9 million on our term loan, and made a $3.2 million contingent consideration payment.
Net cash provided by financing activities for the year ended December 31, 2009 was $6.4 million compared to $15.7 million in 2008. In 2009, we received proceeds of $2.9 million from the exercise of stock options and $0.3 million in proceeds from issuance of common stock pursuant to the employee stock purchase plan, had an income tax benefit of $3.6 million related to the exercise of stock options and restricted stock vesting, and received proceeds of $1.0 million related to our First Rx Specialty and Mail Services, LLC arrangement. Additionally, we purchased $1.0 million of treasury stock and incurred $0.4 million in deferred financing cost during 2009.
Net cash provided by financing activities for the year ended December 31, 2008 was $15.7 million compared to $14.0 million in 2007. In 2008, we purchased $1.8 million of treasury stock, received proceeds of $4.6 million from the exercise of options and $0.4 million in proceeds from issuance of common stock pursuant to the employee stock purchase plan. In addition, we received an income tax payable benefit of $5.5 million from the exercise of stock options and restricted stock vesting and cash of $7.0 million related to the formation of First Rx Specialty and Mail Services, LLC.
We anticipate continuing to generate positive operating cash flow which, combined with available cash resources, should be sufficient to meet our planned working capital, debt service, capital expenditures and operating expenses. However, there can be no assurance that we will not require additional capital. Even if such funds are not required, we may seek additional equity or debt financing, particularly to fund future acquisitions. We cannot be assured that such financing will be available on acceptable terms, if at all, or that such financing will not be dilutive to our stockholders.
OBLIGATIONS AND CONTRACTUAL COMMITMENTS
The following table reflects our current contractual commitments as of December 31, 2010 (in thousands):
| Payments Due by Period | ||||||||||||||||||||
| Total | 2011 | 2012-2013 | 2014-2015 | Thereafter | ||||||||||||||||
| Long-term debt obligations |
$ | 148,125 | $ | 7,500 | $ | 15,000 | $ | 125,625 | $ | — | ||||||||||
| Interest payments on long-term debt obligations(1) |
12,593 | 2,935 | 5,416 | 4,242 | — | |||||||||||||||
| Operating leases |
56,364 | 5,751 | 9,809 | 9,676 | 31,128 | |||||||||||||||
| Other long-term liabilities (2) |
9,000 | — | 9,000 | — | — | |||||||||||||||
| Total contractual obligations (3) |
$ | 226,082 | $ | 16,186 | $ | 39,225 | $ | 139,543 | $ | 31,128 | ||||||||||
| (1) | The interest expense for our long-term debt obligations is based on our December 31, 2010 LIBOR and applicable margin over LIBOR. Our actual interest payments will fluctuate with changes in LIBOR and in the margin over LIBOR we are required to pay. See “Note 8 – Financing” of our consolidated financial statements for further discussion. |
| (2) | In connection with First Rx Specialty and Mail Services, LLC, an entity we formed in December 2008, we received $8.0 million in cash through December 31, 2010. As a part of this arrangement, we are also recognizing expense associated with the accretion of the liability to its ultimate redemption value of $9.0 million. We have a contractual obligation to redeem the total amount in cash in the year 2013. This obligation is included in other current liabilities in our consolidated balance sheet at December 31, 2010, because unilateral contract termination rights are exercisable beginning on December 1, 2011 and may require us to satisfy the obligation on demand. |
| (3) | Total contractual obligations exclude the potential future payments required in connection with possible contingent consideration through 2012 associated with our acquisition of Total Script. See “Note 11. Business Combinations” of our consolidated financial statements for further discussion. |
37
Table of Contents
At December 31, 2010, we had available a $200.0 million revolving credit facility with no outstanding borrowings. For additional information regarding our credit facility, deferred income taxes, and operating leases, see Notes 8, 9 and 12, respectively, of our consolidated financial statements.
CRITICAL ACCOUNTING POLICIES AND ESTIMATES
Critical Accounting Policies and Estimates
Management’s Discussion and Analysis of Financial Condition and Results of Operations discusses our consolidated financial statements. Preparation of financial statements in conformity with accounting principles generally accepted in the United States requires management to make estimates and assumptions that affect the amounts reported in the consolidated financial statements and accompanying notes. Our estimates and assumptions are based upon a combination of historical information and various other assumptions believed to be reasonable under the particular circumstances. Actual results could differ from those estimates. Certain of the accounting policies which most impact our consolidated financial statements and that require management to make difficult, subjective or complex judgments are described below. See also “Note 2. Summary of Significant Accounting Policies,” to our consolidated financial statements included in Part II, Item 8 of this Annual Report on Form 10-K.
Revenue and direct expense recognition
We recognize revenues from services provided to our clients for sales of prescription drugs either by pharmacies in our nationwide network or through our mail order facilities, and related claims processing fees. Revenue is recognized when the claims are adjudicated. Pharmacy claims are adjudicated at the point-of-sale using an on-line claims processing system. When we have a contractual obligation to pay a network pharmacy provider for benefits provided to our clients’ members, total payments from these clients, including administration and other fees, are recorded as revenue and payments to the network pharmacy provider, and the claim adjudication service costs are recorded as direct expenses. Generally, these contracts require us to assume the credit risk of our clients’ abilities to pay. When we administer pharmacy reimbursement contracts and do not assume credit risk, we record only the net revenue and the administrative or processing fees. Rebates earned under arrangements with manufacturers or third party intermediaries are predominately recorded as a reduction to direct expenses. The portion of such rebates due to our clients is recorded as a reduction of revenue. Manufacturers’ or third party intermediary rebates are based on estimates, which are subject to final settlement with the contracted party. We refine our estimates each period based on actual collection and payment experiences.
Member co-payments are not recorded as revenue. Under our pharmacy contracts, the pharmacy is solely obligated to collect the co-payments from the members. Under client contracts, we do not assume liability for member co-payments in pharmacy transactions. As such, we do not include member co-payments to pharmacies in revenue or direct expenses.
Rebates Receivable and Payable
Rebates earned under arrangements with manufacturers or third party intermediaries are predominately recorded as a reduction of direct expenses. The portion, which in some cases may be the full amount, of such rebates due to clients is recorded as a reduction of revenue. Manufacturer or third party intermediary rebates are based on estimates, which are subject to final settlement with the contracted party on an on-going basis.
The Company estimates its rebates receivable and rebates payable based on the number and type of claims submitted, the rebate program terms with its clients, the Company’s rebate contracts with pharmaceutical manufacturers and third party intermediaries, and other information that may be available. The amount of rebates actually received by the Company, and rebates paid to its clients, is impacted by a variety of factors, including the validation of claims data submitted by the Company and differences between estimated and actual rebatable products. As a result, the Company’s actual experience relative to rebates received by the Company, and rebates paid to its clients, may result in adjustments to the estimates made in prior periods.
During 2010, the Company adjusted its prior estimates related to rebates receivable and rebates payable by $4.8 million and $3.5 million, respectively. The impact of adjustments in rebates receivable and rebates payable estimates for the years ended December 31, 2009 and 2008 were not material. Future adjustments to the amounts of rebates receivable and rebates payable outstanding are possible and the impact, although not expected to be, could be material.
38
Table of Contents
Allowance for Accounts Receivable
Trade accounts receivable are recorded at the invoiced amount and do not bear interest. The allowance for accounts receivable is our best estimate of the amount of probable credit losses in our existing accounts receivable. We determine the allowance based on historical write-off experience by industry and regional economic data. We review our allowance for accounts receivable quarterly. Account balances are charged off against the allowance when we feel it is probable the receivable will not be recovered. We do not have any off-balance-sheet credit exposure related to our customers.
Assets Acquired and Liabilities Assumed in Business Combinations
In our acquisitions, we are required to make judgments regarding the fair values of the assets acquired and the liabilities assumed. For significant acquisitions, management has engaged consultants to assist it in estimating the fair values of acquired intangible assets.
Intangible Assets
We do not have any intangible assets with indefinite lives. We do have other intangible assets subject to amortization, and these assets are amortized straight-line over 5 months to 20 years, depending on each intangible asset’s estimated useful life. The estimated fair value and the weighted average useful-life of the intangible assets are based on income-method valuation calculations. The remaining useful life of intangible assets is evaluated periodically and adjusted as necessary to match the period that the assets are expected to provide economic benefits.
Goodwill
Our goodwill is not amortized, but is tested for impairment at least annually. We performed our annual goodwill impairment testing at December 31, 2010 and concluded that no goodwill impairment exists because the fair values of our reporting units are substantially in excess of their carrying values.
We test for impairment of goodwill according to a two-step approach. In the first step, we test for impairment of goodwill by estimating the fair values of our reporting units using a present value of future cash flows approach. Although we operate in one reportable segment, for the purposes of performing this impairment test under the accounting standards, we have identified three reporting units. If the carrying amount of the reporting unit exceeds the fair value, the second step of the goodwill impairment test is performed to measure the amount of the impairment loss, if any. In the second step, the implied fair value of the goodwill is estimated as the fair value of the reporting unit used in the first step less the fair values of all other net tangible and intangible assets of the reporting unit. If the carrying amount of the goodwill exceeds its implied fair market value, an impairment loss is recognized in an amount equal to that excess, not to exceed the carrying amount of the goodwill. In addition, the goodwill of a reporting unit is tested for impairment between annual tests if an event occurs or circumstances change that would more-likely-than-not reduce the fair value of a reporting unit below its carrying value.
Investments
The Company’s investments, which consist primarily of auction rate securities (“ARS”), and are recorded at fair market value, with unrealized gains (losses), net of taxes, reported as a separate component of shareholders’ equity. Realized gains (losses) and amounts representing credit losses, of which there were none, are included in other income. For purposes of determining any credit loss, the Company assesses the fair value of its ARS under the single best-estimate approach. Although we continue to receive timely interest payments and there have been instances of recent redemptions of our auction rate securities by issuers at par, our ARS investments currently lack short-term liquidity and therefore are classified as non-current on our balance sheet. Aggregate investments outstanding at December 31, 2010 were $0.9 million. The impact of changes to their valuation is not expected to be material.
39
Table of Contents
Income Taxes
Our deferred income taxes are determined based on the estimated future tax effects of differences between the financial statement and tax bases of assets and liabilities given the provisions of enacted tax laws. Deferred income tax provisions and benefits are based on changes to the assets or liabilities from year to year. In providing for deferred taxes, we consider tax regulations of the jurisdictions in which we operate, estimates of future taxable income, and available tax planning strategies. If tax regulations, operating results or the ability to implement tax-planning strategies vary, adjustments to the carrying value of deferred tax assets and liabilities may be required. Valuation allowances, if any, are recorded related to deferred tax assets based on the “more-likely-than-not” criteria.
We recognize the financial statement benefit of a tax position only after determining that the relevant tax authority would more-likely-than-not sustain the position following an audit. For tax positions meeting the more-likely-than-not threshold, the amount recognized in the financial statements is the largest benefit that has a greater than 50 percent likelihood of being realized upon ultimate settlement with the relevant tax authority.
We may from time to time be assessed interest or penalties by major tax jurisdictions, although any such assessments historically have been minimal and immaterial to our financial results. Our policy is that we recognize interest and penalties accrued on any unrecognized tax benefits as a component of income tax expense.
NEW ACCOUNTING STANDARDS
In December 2010, the Financial Accounting Standards Board (“FASB”) issued a final Accounting Standards Update (“ASU”) that sets forth revised goodwill impairment guidance for reporting units that have a zero or negative carrying amount. For these reporting units, the FASB concluded that step 2 of the test should be performed if qualitative factors indicate that it is more likely than not that goodwill impairment exists. For public entities, this new guidance is effective for fiscal years, and interim periods within those years, beginning after December 15, 2010. Early adoption is not permitted. We do not expect the adoption of this guidance to have an impact on our financial position, results of operations or cash flows.
In January 2010, the FASB issued a final ASU that sets forth additional requirements and guidance regarding disclosures of fair value measurements. The ASU requires the gross presentation of activity within the Level 3 fair value measurement roll forward and details of transfers in and out of Level 1 and Level 2 fair value measurements. It also clarifies two existing disclosure requirements within the current fair value authoritative guidance on the level of disaggregation of fair value measurements and disclosures on inputs and valuation techniques. The new requirements and guidance were effective for interim and annual periods beginning after December 15, 2009, which for us meant the beginning of our 2010 fiscal year, except for the Level 3 roll forward requirements which is effective for interim and annual periods beginning after December 15, 2010, which for us means our first quarterly period ending on March 31, 2011. The adoption of the disclosures effective in 2010 did not have an impact on our financial position, results of operations or cash flows. Additionally, we do not expect the adoption of the disclosures which were deferred until the first quarter of 2011 to have an impact on our financial position, results of operations or cash flows.
In June 2009, the FASB issued guidance that changed the consolidation model for variable interest entities (“VIEs”). This guidance requires companies to qualitatively assess the determination of the primary beneficiary of a VIE based on whether a company (1) has the power to direct matters that most significantly impact the activities of the VIE and (2) has the obligation to absorb losses or the right to receive benefits of the VIE that could potentially be significant to the VIE. This standard is effective at the beginning of our 2010 fiscal year. The adoption of the standard did not have an impact on our financial position, results of operations or cash flows.
| ITEM 7A. | QUANTITATIVE AND QUALITATIVE DISCLOSURES ABOUT MARKET RISK |
We believe we have minimal market risk inherent in our financial position. We do not have any derivative financial instruments and do not hold any derivative financial instruments for trading purposes. Our market risk primarily represents the potential loss arising from adverse changes in market interest rates. Our results from operations could be impacted by decreases in interest rates on our cash and cash equivalents. Additionally, we may be exposed to market risk from changes in interest rates related to our term loan facility and any debt that may be outstanding under our revolving credit facility.
40
Table of Contents
We do not expect our business, results of operations, financial position or cash flows to be affected to any significant degree by a sudden change in market interest rates. At December 31, 2010, we had $148.1 million of long-term debt obligations which were subject to variable interest rates under our senior credit facilities. A hypothetical increase in interest rates of 1% would result in an increase in our annual interest expense of approximately $1.5 million (pre-tax), presuming obligations subject to variable interest rates remained constant.
We operate our business within the United States and Puerto Rico and execute all of our transactions in U.S. dollars and therefore do not have any foreign currency exchange risk.
| ITEM 8. | FINANCIAL STATEMENTS AND SUPPLEMENTARY DATA |
Our audited consolidated financial statements are contained in a separate section of this Annual Report on Form 10-K on pages F-1 through F-23 and Financial Statement Schedule on page S-1 attached hereto.
| ITEM 9. | CHANGES IN AND DISAGREEMENTS WITH ACCOUNTANTS ON ACCOUNTING AND FINANCIAL DISCLOSURE |
None.
| ITEM 9A. | CONTROLS AND PROCEDURES |
Management’s Responsibility for Financial Statements
Our management is responsible for the integrity and objectivity of all information presented in this Annual Report on Form 10-K. The consolidated financial statements were prepared in conformity with accounting principles generally accepted in the United States of America and include amounts based on management’s best estimates and judgments. Management believes the consolidated financial statements fairly reflect the form and substance of transactions and that the financial statements present fairly, in all material respects, our financial position, results of operations and cash flows.
The Audit Committee of the Board of Directors, which is composed solely of independent directors, meets regularly with the independent registered public accounting firm and representatives of management to review accounting, financial reporting, internal control and audit matters, as well as the nature and extent of the audit effort. The Audit Committee is responsible for the engagement of the independent registered public accounting firm. The independent registered public accounting firm has free access to the Audit Committee.
Evaluation of Disclosure Controls and Procedures
Our management, with the participation of our Chief Executive Officer and Chief Financial Officer, has evaluated the effectiveness of the design and operation of our disclosure controls and procedures (as defined in Rules 13a-15(e) and 15d-15(e) under the Exchange Act) as of the end of the period covered by this Annual Report on Form 10-K. Based on this evaluation, our Chief Executive Officer and Chief Financial Officer have concluded that our disclosure controls and procedures are effective and designed to ensure that the information required to be disclosed in our reports filed or submitted under the Exchange Act is recorded, processed, summarized and reported within the requisite time periods.
Management’s Report on Internal Control Over Financial Reporting
Our management is responsible for establishing and maintaining adequate internal control over financial reporting, as such term is defined in Rules 13a-15(f) and 15d-15(f) under the Exchange Act. Our internal control over financial reporting is designed to provide reasonable assurance regarding the reliability of our financial reporting and the preparation of published financial statements in accordance with generally accepted accounting principles.
41
Table of Contents
Because of its inherent limitations, internal control over financial reporting may not prevent or detect misstatements. Therefore, even those systems determined to be effective can only provide reasonable assurance with respect to financial statement preparation and presentation. Also, projections of any evaluation of effectiveness to future periods are subject to the risk that controls may become inadequate because of changes in conditions, or that the degree of compliance with the policies or procedures may deteriorate.
Our management, with the participation of our Chief Executive Officer and Chief Financial Officer, assessed the effectiveness of our internal control over financial reporting as of December 31, 2010. In making this assessment, our management used the criteria set forth by the Committee of Sponsoring Organizations of the Treadway Commission in Internal Control—Integrated Framework. Our management has excluded FutureScripts, LLC and inPharmative, Inc. from our assessment of internal controls over financial reporting in 2010 because they were acquired by us in a purchase business combination during 2010. FutureScripts is a wholly-owned subsidiary whose total assets and total revenues represent 22.8% and 6.6%, respectively, of the related consolidated financial statement amounts as of and for the year ended December 31, 2010. inPharmative is also a wholly-owned subsidiary whose total assets and total revenues represent 1.6% and 0.1%, respectively, of the related consolidated financial statement amounts as of and for the year ended December 31, 2010.
Based on its assessment, management has concluded that as of December 31, 2010, our internal control over financial reporting was effective based on those criteria. Our assessment of the effectiveness of our internal control over financial reporting as of December 31, 2010 has been audited by PricewaterhouseCoopers LLP, an independent registered public accounting firm, as stated in their report which appears herein.
Changes in Internal Control Over Financial Reporting
No change in our internal control over financial reporting (as defined in Rules 13a-15(f) and 15d-15(f) under the Exchange Act) occurred during the quarter ended December 31, 2010 that has materially affected, or is reasonable likely to materially affect, our internal control over financial reporting.
| ITEM 9B. | OTHER INFORMATION |
None.
42
Table of Contents
PART III
| ITEM 10. | DIRECTORS, EXECUTIVE OFFICERS AND CORPORATE GOVERNANCE |
Information required under this item will be contained in our Proxy Statement for our 2011 Annual Meeting of Stockholders under the heading Proposal 1 – Election of Directors, Directors and Executive Officers, Corporate Governance, Committees and Section 16(a) Beneficial Ownership Reporting Compliance and is incorporated herein by reference.
| ITEM 11. | EXECUTIVE COMPENSATION |
Information required under this item will be contained in our Proxy Statement for our 2011 Annual Meeting of Stockholders under the heading Executive Compensation, including Compensation Discussion and Analysis, Director Compensation, Compensation Committee Report and Compensation Committee and is incorporated herein by reference.
| ITEM 12. | SECURITY OWNERSHIP OF CERTAIN BENEFICIAL OWNERS AND MANAGEMENT AND RELATED STOCKHOLDER MATTERS |
Information required under this item will be contained in our Proxy Statement for our 2011 Annual Meeting of Stockholders under Stock Ownership and is incorporated herein by reference.
The following table provides information as of December 31, 2010 with respect to shares of our common stock that may be issued under our existing equity compensation plans (share data in thousands):
| Plan category |
Number of securities to be issued upon exercise of outstanding options, warrants and rights (a) |
Weighted average exercise price of outstanding options, warrants and rights (b) |
Number of securities remaining available for future issuance under equity compensation plans (excluding securities reflected in column (a)) (c) |
|||||||||
| Equity compensation plans approved by security holders |
466 | $ | 6.51 | 2,716 | ||||||||
| Total |
466 | $ | 6.51 | 2,716 | ||||||||
| ITEM 13. | CERTAIN RELATIONSHIPS AND RELATED TRANSACTIONS, and DIRECTOR INDEPENDENCE |
Information required under this item will be contained in our Proxy Statement for our 2011 Annual Meeting of Stockholders under Transactions with Related Persons and Corporate Governance and is incorporated herein by reference.
| ITEM 14. | PRINCIPAL ACCOUNTING FEES AND SERVICES |
Information required under this item will be contained in our Proxy Statement for our 2011 Annual Meeting of Stockholders under Services Provided by the Independent Auditors and Policy Regarding Pre-Approval of Services Provided by the Independent Auditors and is incorporated by reference.
43
Table of Contents
PART IV
| ITEM 15. | EXHIBITS, FINANCIAL STATEMENT SCHEDULES |
| (a) | The following consolidated financial statements of Catalyst Health Solutions, Inc. are filed as part of this report under Item 8. - Financial Statements and Supplementary Data. |
| (1) | Financial Statements | |||||
| Consolidated Balance Sheets as of December 31, 2010 and 2009 |
F-1 | |||||
| Consolidated Statements of Operations for the years ended December 31, 2010, 2009, and 2008 |
F-2 | |||||
| F-3 | ||||||
| Consolidated Statements of Cash Flows for the years ended December 31, 2010, 2009, and 2008 |
F-4 | |||||
| F-5 | ||||||
| F-6 | ||||||
| (2) | Financial statement schedule: |
|||||
| S-1 | ||||||
| All other schedules are omitted as the required information is inapplicable or the information is presented in the consolidated financial statements and notes thereto in Item 8 above. | ||||||
| (3) | Exhibits | |||||
The following exhibits are filed as part of this report unless noted otherwise:
| Exhibit No. |
Description | |
| 2.1 |
Catalyst Rx, Inc. Securities Purchase Agreement dated as of November 14, 2001 by and among HealthExtras, Inc. as the Purchaser, Catalyst Rx, Inc. and Kevin C. Hooks as the Seller (1) | |
| 2.2 |
Catalyst Consultants, Inc. Securities Purchase Agreement dated as of November 14, 2001 by and among HealthExtras, Inc. as the Purchaser, Catalyst Consultants, Inc. and Kevin C. Hooks as the Seller (2) | |
| 2.3 |
Equity Interest Purchase Agreement dated as of August 4, 2010 by and among Catalyst Health Solutions, Inc., Independence Blue Cross, QCC Insurance Company, FutureScripts, LLC and FutureScripts Secure LLC (3) | |
| 3.1 |
Certificate of Ownership and Merger Merging Catalyst Health Solutions, Inc. with and into HealthExtras, Inc., effective October 1, 2008 (4) | |
| 3.2 |
Amended and Restated Certificate of Incorporation of Catalyst Health Solutions, Inc., effective October 1, 2008 (5) | |
| 3.3 |
Amended and Restated Bylaws of Catalyst Health Solutions, Inc., effective October 1, 2008 (6) | |
| 4.1 |
Registration Rights Agreement dated June 18, 2004 by and among HealthExtras, Inc. and Kenneth J. Sack and the Sack Family Trust (7) | |
| 10.1 |
Form of HealthExtras, Inc. 1999 Stock Option Plan (8) | |
| 10.2 |
HealthExtras, Inc. 2000 Stock Option Plan (9) | |
| 10.3 |
HealthExtras, Inc. 2000 Directors’ Stock Option Program (10) | |
| 10.4 |
2003 HealthExtras, Inc. Equity Incentive Plan (11) | |
44
Table of Contents
| 10.5 |
Form of 2003 HealthExtras, Inc. Equity Incentive Plan Restricted Stock Award Agreement (12) | |
| 10.6 |
HealthExtras, Inc. 2004 Employee Stock Purchase Plan (13) | |
| 10.7 |
Amendment to HealthExtras, Inc. 2004 Employee Stock Purchase Plan (14) | |
| 10.8 |
Catalyst Health Solutions, Inc. 2006 Stock Incentive Plan, as Amended and Restated on April 8, 2010 (15) | |
| 10.9 |
Form of HealthExtras, Inc. 2006 Stock Incentive Plan Restricted Stock Award Agreement (16) | |
| 10.10 |
HealthExtras, Inc. Management Non-Equity Incentive Compensation Plan (17) | |
| 10.11 |
Employment Agreement by and between HealthExtras, Inc. and Hai Tran (18) | |
| 10.12 |
Employment Agreement by and between HealthExtras, Inc. and Bruce Metge (19) | |
| 10.13 |
Employment Agreement by and between HealthExtras, Inc. and Nick J. Grujich, as amended and restated effective February 28, 2008 (20) | |
| 10.14 |
Amendment to Employment Agreement by and between HealthExtras, Inc. and Nick J. Grujich, effective June 22, 2010 (21) | |
| 10.15 |
Separation and Release Agreement between Catalyst Health Solutions, Inc. and Nick J. Grujich, effective September 20, 2010 (22) | |
| 10.16 |
Employment Agreement by and between HealthExtras, Inc. and David T. Blair, as amended and restated effective February 28, 2008 (23) | |
| 10.17 |
Employment Agreement by and between Catalyst Health Solutions, Inc. and Richard A. Bates (24) | |
| 10.18 |
Amendment to Employment Agreement by and between Catalyst Health Solutions, Inc. and Richard A. Bates, effective June 22, 2010 (25) | |
| 10.19 |
Membership Interest Purchase Agreement dated April 7, 2008 by and among HealthExtras, Inc.; HospiScript Services, LLC; Concept Pharmaceuticals, LLC; and the selling members identified therein (26) | |
| 10.20 |
Amendment to Membership Interest Purchase Agreement dated May 16, 2008 by and among HealthExtras, Inc.; HospiScript Services, LLC; Concept Pharmaceuticals, LLC; and the selling members identified therein (27) | |
| 10.21 |
Revolving Credit and Term Loan Agreement dated as of August 4, 2010 among Catalyst Health Solutions, Inc., as borrower, the lenders from time to time party hereto, Wells Fargo Bank, National Association and Bank of America, N.A., as Co-Syndication Agents, JPMorgan Chase Bank, N.A. and Citizens Bank of Pennsylvania, as Co-Documentation Agents and SunTrust Bank, as Administrative Agent (28) | |
| 11.1 |
Statement re: Computation of Per Share Earnings (see Note 2 of the Notes to Consolidated Financial Statements)* | |
| 21.1 |
List of Subsidiaries* | |
| 23.1 |
Consent of Independent Registered Public Accounting Firm* | |
| 31.1 |
Exchange Act Rule 13a-14(a)/15d-14(a) Certification of Chief Executive Officer* | |
| 31.2 |
Exchange Act Rule 13a-14(a)/15d-14(a) Certification of Chief Financial Officer* | |
| 32.1 |
Certification pursuant to 18 U.S.C. Section 1350, as added by Section 906 of the Sarbanes-Oxley Act of 2002** | |
| 101.INS |
XBRL Taxonomy Instance Document** | |
| 101.SCH |
XBRL Taxonomy Extension Schema Document** | |
45
Table of Contents
| 101.CAL |
XBRL Taxonomy Extension Calculation Linkbase Document** | |
| 101.DEF |
XBRL Taxonomy Extension Definition Linkbase Document** | |
| 101.LAB |
XBRL Taxonomy Extension Labels Linkbase Document** | |
| 101.PRE |
XBRL Taxonomy Extension Presentation Linkbase Document** | |
| * | Filed herewith. |
| ** | Furnished herewith, not filed. |
| (1) | Incorporated by reference to Exhibit 2.1 to the Registrant’s Form 8-K Current Report filed on November 29, 2001. |
| (2) | Incorporated by reference to Exhibit 2.2 to the Registrant’s Form 8-K Current Report filed on November 29, 2001. |
| (3) | Incorporated by reference to Exhibit 2.1 to the Registrant’s Form 10-Q Quarterly Report filed on November 5, 2010. |
| (4) | Incorporated by reference to Exhibit 3(i)(a) to the Registrant’s Form 10-Q Quarterly Report filed on November 6, 2008. |
| (5) | Incorporated by reference to Exhibit 3(i)(b) to the Registrant’s Form 10-Q Quarterly Report filed on November 6, 2008. |
| (6) | Incorporated by reference to Exhibit 3(ii) to the Registrant’s Form 10-Q Quarterly Report filed on November 6, 2008. |
| (7) | Incorporated by reference to Exhibit 4.2 to the Registrant’s Form 8-K Current Report filed on June 23, 2004. |
| (8) | Incorporated by reference to Exhibit 10.9 to the Registrant’s Form S-1/A Pre-Effective Amendment No. 2 to Form S-1 Registration Statement (Registration No. 333-83761) filed on October 20, 1999. |
| (9) | Incorporated by reference to Exhibit 10.12 to the Registrant’s Form 10-K Annual Report for the Fiscal Year Ended December 31, 2000 filed on April 2, 2001. |
| (10) | Incorporated by reference to Exhibit 10.13 to the Registrant’s Form 10-K Annual Report for the Fiscal Year Ended December 31, 2000 filed on April 2, 2001. |
| (11) | Incorporated by reference to Exhibit A to the Registrant’s Schedule 14A Definitive Proxy Statement filed on April 30, 2003. |
| (12) | Incorporated by reference to Exhibit 10.1 to the Registrant’s Form 8-K Current Report filed on February 28, 2006. |
| (13) | Incorporated by reference to Exhibit A to the Registrant’s Schedule 14A Definitive Proxy Statement filed on April 29, 2004. |
| (14) | Incorporated by reference to Exhibit 99.2 to the Registrant’s Form S-8 filed on June 5, 2009. |
| (15) | Incorporated by reference to Appendix A to the Registrant’s Schedule 14A Definitive Proxy Statement filed on April 23, 2010. |
| (16) | Incorporated by reference to Exhibit 10.2 to the Registrant’s Registration Statement on Form S-8 filed on June 22, 2006. |
| (17) | Incorporated by reference to Exhibit A to the Registrant’s Schedule 14A Definitive Proxy Statement filed on April 30, 2007. |
| (18) | Incorporated by reference to Exhibit 10.1 to the Registrant’s Form 8-K Current Report filed on April 4, 2008. |
| (19) | Incorporated by reference to Exhibit 10.1 to the Registrant’s Form 8-K Current Report filed on June 4, 2008. |
| (20) | Incorporated by reference to Exhibit 10.9 to the Registrant’s Form 10-K Annual Report for the Fiscal Year Ended December 31, 2007 filed on February 29, 2008. |
| (21) | Incorporated by reference to Exhibit 10.2 to the Registrant’s Form 10-Q Quarterly Report filed on August 6, 2010. |
| (22) | Incorporated by reference to Exhibit 10.1 to the Registrant’s Form 8-K Current Report filed on September 21, 2010. |
| (23) | Incorporated by reference to Exhibit 10.10 to the Registrant’s Form 10-K Annual Report for the Fiscal Year Ended December 31, 2007 filed on February 29, 2008. |
| (24) | Incorporated by reference to Exhibit 10.1 to the Registrant’s Form 8-K Current Report filed on August 7, 2009. |
| (25) | Incorporated by reference to Exhibit 10.1 to the Registrant’s Form 10-Q Quarterly Report filed on August 6, 2010. |
| (26) | Incorporated by reference to Exhibit 10.1 to the Registrant’s Form 10-Q Quarterly Report filed on August 7, 2008. |
| (27) | Incorporated by reference to Exhibit 10.2 to the Registrant’s Form 10-Q Quarterly Report filed on August 7, 2008. |
| (28) | Incorporated by reference to Exhibit 10.1 to the Registrant’s Form 10-Q Quarterly Report filed on November 5, 2010. |
46
Table of Contents
Pursuant to the requirements of Section 13 or 15(d) of the Securities Exchange Act of 1934, the registrant has duly caused this report to be signed on its behalf by the undersigned, thereunto duly authorized.
| CATALYST HEALTH SOLUTIONS, INC. | ||||||
| February 25, 2011 | By: | /S/ DAVID T. BLAIR | ||||
| David T. Blair | ||||||
| Chief Executive Officer and Director | ||||||
Pursuant to the requirements of the Securities Exchange Act of 1934, this report has been signed below by the following persons on behalf of the registrant and in the capacities and on the dates indicated:
| February 25, 2011 | By: |
/S/ EDWARD S. CIVERA | ||||
| Edward S. Civera | ||||||
| Chairman of The Board | ||||||
| February 25, 2011 | By: | /S/ DAVID T. BLAIR | ||||
| David T. Blair | ||||||
| Chief Executive Officer and Director | ||||||
| February 25, 2011 | By: | /S/ HAI V. TRAN | ||||
| Hai V. Tran | ||||||
| Chief Financial Officer and | ||||||
| Chief Accounting Officer | ||||||
| February 25, 2011 | By: | /S/ WILLIAM E. BROCK | ||||
| William E. Brock | ||||||
| Director | ||||||
| February 25, 2011 | By: | /S/ STEVEN B. EPSTEIN | ||||
| Steven B. Epstein | ||||||
| Director | ||||||
| February 25, 2011 | By: | /S/ DANIEL J. HOUSTON | ||||
| Daniel J. Houston | ||||||
| Director | ||||||
| February 25, 2011 | By: | /S/ MICHAEL R. MCDONNELL | ||||
| Michael R. McDonnell | ||||||
| Director | ||||||
| February 25, 2011 | By: | /S/ KENNETH A. SAMET | ||||
| Kenneth A. Samet | ||||||
| Director | ||||||
| February 25, 2011 | By: | /S/ DALE B. WOLF | ||||
| Dale B. Wolf | ||||||
| Director | ||||||
47
Table of Contents
Report of Independent Registered Public Accounting Firm
To Board of Directors and Stockholders of Catalyst Health Solutions, Inc.:
In our opinion, the consolidated financial statements listed in the accompanying index appearing under Item 15(a)(1) present fairly, in all material respects, the financial position of Catalyst Health Solutions, Inc. and its subsidiaries at December 31, 2010 and 2009, and the results of their operations and their cash flows for each of the three years in the period ended December 31, 2010 in conformity with accounting principles generally accepted in the United States of America. In addition, in our opinion, the financial statement schedule listed in Item 15(a)(2) presents fairly, in all material respects, the information set forth therein when read in conjunction with the related consolidated financial statements. Also in our opinion, the Company maintained, in all material respects, effective internal control over financial reporting as of December 31, 2010, based on criteria established in Internal Control - Integrated Framework issued by the Committee of Sponsoring Organizations of the Treadway Commission (COSO). The Company’s management is responsible for these financial statements and financial statement schedule, for maintaining effective internal control over financial reporting and for its assessment of the effectiveness of internal control over financial reporting, included in Management’s Report on Internal Control over Financial Reporting appearing under Item 9A. Our responsibility is to express opinions on these financial statements, on the financial statement schedule, and on the Company’s internal control over financial reporting based on our integrated audits. We conducted our audits in accordance with the standards of the Public Company Accounting Oversight Board (United States). Those standards require that we plan and perform the audits to obtain reasonable assurance about whether the financial statements are free of material misstatement and whether effective internal control over financial reporting was maintained in all material respects. Our audits of the financial statements included examining, on a test basis, evidence supporting the amounts and disclosures in the financial statements, assessing the accounting principles used and significant estimates made by management, and evaluating the overall financial statement presentation. Our audit of internal control over financial reporting included obtaining an understanding of internal control over financial reporting, assessing the risk that a material weakness exists, and testing and evaluating the design and operating effectiveness of internal control based on the assessed risk. Our audits also included performing such other procedures as we considered necessary in the circumstances. We believe that our audits provide a reasonable basis for our opinions.
As discussed in Note 11 to the consolidated financial statements, the Company changed the manner in which it accounts for business combinations in 2009.
A company’s internal control over financial reporting is a process designed to provide reasonable assurance regarding the reliability of financial reporting and the preparation of financial statements for external purposes in accordance with generally accepted accounting principles. A company’s internal control over financial reporting includes those policies and procedures that (i) pertain to the maintenance of records that, in reasonable detail, accurately and fairly reflect the transactions and dispositions of the assets of the company; (ii) provide reasonable assurance that transactions are recorded as necessary to permit preparation of financial statements in accordance with generally accepted accounting principles, and that receipts and expenditures of the company are being made only in accordance with authorizations of management and directors of the company; and (iii) provide reasonable assurance regarding prevention or timely detection of unauthorized acquisition, use, or disposition of the company’s assets that could have a material effect on the financial statements.
Because of its inherent limitations, internal control over financial reporting may not prevent or detect misstatements. Also, projections of any evaluation of effectiveness to future periods are subject to the risk that controls may become inadequate because of changes in conditions, or that the degree of compliance with the policies or procedures may deteriorate.
As described in Management’s Report on Internal Control over Financial Reporting, management has excluded FutureScripts, LLC and inPharmative, Inc. from its assessment of internal control over financial reporting as of December 31, 2010 because they were acquired by the Company in purchase business combinations during 2010. We have also excluded FutureScripts, LLC and inPharmative, Inc. from our audit of internal control over financial reporting. FutureScripts, LLC is a wholly-owned subsidiary whose total assets and total revenues represent 22.8% and 6.6%, respectively, of the related consolidated financial statement amounts as of and for the year ended December 31, 2010. inPharmative, Inc. is also a wholly-owned subsidiary whose total assets and total revenues represent 1.6% and 0.1%, respectively, of the related consolidated financial statement amounts as of and for the year ended December 31, 2010.
/s/ PricewaterhouseCoopers LLP
McLean, Virginia
February 25, 2011
Table of Contents
CATALYST HEALTH SOLUTIONS, INC.
and Subsidiaries
CONSOLIDATED BALANCE SHEETS
(In thousands, except per share data)
| December 31, | ||||||||
| 2010 | 2009 | |||||||
| ASSETS |
||||||||
| Current assets: |
||||||||
| Cash and cash equivalents |
$ | 157,843 | $ | 152,055 | ||||
| Accounts receivable, net of allowances of $2,599 and $1,533 at December 31, 2010 and 2009, respectively |
205,538 | 172,058 | ||||||
| Rebates receivable, net of allowances of $1,377 and $998 at December 31, 2010 and 2009, respectively |
162,395 | 129,955 | ||||||
| Inventory, net of allowances of $46 and $0 at December 31, 2010 and 2009, respectively |
3,405 | 3,556 | ||||||
| Income taxes receivable |
3,415 | 2,398 | ||||||
| Deferred income taxes |
1,657 | 996 | ||||||
| Other current assets |
11,682 | 7,551 | ||||||
| Total current assets |
545,935 | 468,569 | ||||||
| Property and equipment, net |
30,759 | 24,797 | ||||||
| Goodwill |
396,995 | 273,158 | ||||||
| Intangible assets, net |
158,871 | 54,300 | ||||||
| Investments, net |
889 | 11,655 | ||||||
| Other assets |
8,587 | 442 | ||||||
| Total assets |
$ | 1,142,036 | $ | 832,921 | ||||
| LIABILITIES AND STOCKHOLDERS’ EQUITY |
||||||||
| Current liabilities: |
||||||||
| Accounts payable |
$ | 187,401 | $ | 209,539 | ||||
| Rebates payable |
177,346 | 121,595 | ||||||
| Accrued expenses and other current liabilities |
64,942 | 26,611 | ||||||
| Current maturities of long-term debt |
7,500 | — | ||||||
| Total current liabilities |
437,189 | 357,745 | ||||||
| Long-term debt |
140,625 | — | ||||||
| Deferred rent expense |
2,440 | 2,907 | ||||||
| Deferred income taxes |
18,694 | 15,828 | ||||||
| Other liabilities |
4,965 | 15,444 | ||||||
| Total liabilities |
603,913 | 391,924 | ||||||
| Commitments and contingencies (Notes 12 and 13) |
||||||||
| Stockholders’ equity: |
||||||||
| Preferred stock, $0.01 par value, 5,000 shares authorized, none issued |
— | — | ||||||
| Common stock, $0.01 par value, 100,000 shares authorized, 44,980 and 44,331 shares issued at December 31, 2010 and 2009, respectively |
450 | 443 | ||||||
| Additional paid-in capital |
239,699 | 221,623 | ||||||
| Treasury stock, at cost, 271 and 204 shares at December 31, 2010 and 2009, respectively |
(7,791 | ) | (5,187 | ) | ||||
| Accumulated other comprehensive loss |
(30 | ) | (720 | ) | ||||
| Retained earnings |
305,795 | 224,838 | ||||||
| Total stockholders’ equity |
538,123 | 440,997 | ||||||
| Total liabilities and stockholders’ equity |
$ | 1,142,036 | $ | 832,921 | ||||
The accompanying notes are an integral part of these consolidated financial statements.
F - 1
Table of Contents
CATALYST HEALTH SOLUTIONS, INC.
and Subsidiaries
CONSOLIDATED STATEMENTS OF OPERATIONS
(In thousands, except per share data)
| For the years ended December 31, | ||||||||||||
| 2010 | 2009 | 2008 | ||||||||||
| Revenue (excludes member co-payments of $1,025,306, $810,576 and $753,547 in 2010, 2009 and 2008, respectively) |
$ | 3,764,092 | $ | 2,894,380 | $ | 2,543,379 | ||||||
| Direct expenses |
3,529,843 | 2,708,616 | 2,400,125 | |||||||||
| Selling, general and administrative expenses |
101,745 | 81,036 | 67,822 | |||||||||
| Total operating expenses |
3,631,588 | 2,789,652 | 2,467,947 | |||||||||
| Operating income |
132,504 | 104,728 | 75,432 | |||||||||
| Interest and other income |
937 | 782 | 4,542 | |||||||||
| Interest expense |
(3,027 | ) | (560 | ) | (311 | ) | ||||||
| Income before income taxes |
130,414 | 104,950 | 79,663 | |||||||||
| Income tax expense |
49,457 | 39,785 | 29,269 | |||||||||
| Net income |
$ | 80,957 | $ | 65,165 | $ | 50,394 | ||||||
| Net income per share, basic |
$ | 1.85 | $ | 1.51 | $ | 1.18 | ||||||
| Net income per share, diluted |
$ | 1.82 | $ | 1.48 | $ | 1.16 | ||||||
| Weighted average shares of common stock outstanding, basic |
43,855 | 43,128 | 42,527 | |||||||||
| Weighted average shares of common stock outstanding, diluted |
44,536 | 43,942 | 43,588 | |||||||||
The accompanying notes are an integral part of these consolidated financial statements.
F - 2
Table of Contents
CATALYST HEALTH SOLUTIONS, INC.
and Subsidiaries
CONSOLIDATED STATEMENTS OF STOCKHOLDERS’ EQUITY
(In thousands)
| Shares Issued |
Amount | Additional Paid-in Capital |
Treasury Stock |
Accumulated Other Comprehensive Income (Loss) |
Retained Earnings |
Total | ||||||||||||||||||||||
| Balance at December 31, 2007 |
42,639 | $ | 426 | $ | 192,941 | $ | (2,366 | ) | $ | — | $ | 109,279 | $ | 300,280 | ||||||||||||||
| Exercise of stock options, including tax benefits |
669 | 7 | 10,193 | — | — | — | 10,200 | |||||||||||||||||||||
| Expense related to restricted stock granted to employees |
200 | 2 | 5,173 | — | — | — | 5,175 | |||||||||||||||||||||
| Expense related to stock and stock options granted in exchange for services |
2 | — | 77 | — | — | — | 77 | |||||||||||||||||||||
| Tax expense of restricted stock vesting |
— | — | (82 | ) | — | — | — | (82 | ) | |||||||||||||||||||
| Shares issued pursuant to employee stock purchase plan |
16 | — | 397 | — | — | — | 397 | |||||||||||||||||||||
| Purchases of treasury stock |
— | — | — | (1,828 | ) | — | — | (1,828 | ) | |||||||||||||||||||
| Unrealized loss on investments, net of tax |
— | — | — | — | (684 | ) | — | (684 | ) | |||||||||||||||||||
| Net income for the year |
— | — | — | — | — | 50,394 | 50,394 | |||||||||||||||||||||
| Balance at December 31, 2008 |
43,526 | $ | 435 | $ | 208,699 | $ | (4,194 | ) | $ | (684 | ) | $ | 159,673 | $ | 363,929 | |||||||||||||
| Exercise of stock options, including tax benefits |
418 | 4 | 6,206 | — | — | — | 6,210 | |||||||||||||||||||||
| Expense related to restricted stock granted to employees |
372 | 4 | 4,285 | — | — | — | 4,289 | |||||||||||||||||||||
| Expense related to stock and restricted stock granted in exchange for services |
2 | — | 2,158 | — | — | — | 2,158 | |||||||||||||||||||||
| Tax expense of restricted stock vesting |
— | — | (64 | ) | — | — | — | (64 | ) | |||||||||||||||||||
| Shares issued pursuant to employee stock purchase plan |
13 | — | 339 | — | — | — | 339 | |||||||||||||||||||||
| Purchases of treasury stock |
— | — | — | (993 | ) | — | — | (993 | ) | |||||||||||||||||||
| Unrealized loss on investments, net of tax |
— | — | — | — | (36 | ) | — | (36 | ) | |||||||||||||||||||
| Net income for the year |
— | — | — | — | — | 65,165 | 65,165 | |||||||||||||||||||||
| Balance at December 31, 2009 |
44,331 | $ | 443 | $ | 221,623 | $ | (5,187 | ) | $ | (720 | ) | $ | 224,838 | $ | 440,997 | |||||||||||||
| Exercise of stock options, including tax benefits |
415 | 4 | 8,487 | — | — | — | 8,491 | |||||||||||||||||||||
| Expense related to restricted stock granted to employees |
223 | 3 | 5,528 | — | — | — | 5,531 | |||||||||||||||||||||
| Expense related to stock and restricted stock granted in exchange for services |
2 | — | 1,645 | — | — | — | 1,645 | |||||||||||||||||||||
| Tax benefit of restricted stock vesting |
— | — | 1,076 | — | — | — | 1,076 | |||||||||||||||||||||
| Shares issued pursuant to employee stock purchase plan |
9 | — | 352 | — | — | — | 352 | |||||||||||||||||||||
| Purchases of treasury stock |
— | — | — | (2,604 | ) | — | — | (2,604 | ) | |||||||||||||||||||
| Warrants issued pursuant to acquisition |
— | — | 988 | — | — | — | 988 | |||||||||||||||||||||
| Unrealized gain on investments, net of tax |
— | — | — | — | 690 | — | 690 | |||||||||||||||||||||
| Net income for the year |
— | — | — | — | — | 80,957 | 80,957 | |||||||||||||||||||||
| Balance at December 31, 2010 |
44,980 | $ | 450 | $ | 239,699 | $ | (7,791 | ) | $ | (30 | ) | $ | 305,795 | $ | 538,123 | |||||||||||||
The accompanying notes are an integral part of these consolidated financial statements.
F - 3
Table of Contents
CATALYST HEALTH SOLUTIONS, INC.
and Subsidiaries
CONSOLIDATED STATEMENTS OF CASH FLOWS
(In thousands)
| For the years ended December 31, | ||||||||||||
| 2010 | 2009 | 2008 | ||||||||||
| Cash flows from operating activities: |
||||||||||||
| Net income |
$ | 80,957 | $ | 65,165 | $ | 50,394 | ||||||
| Adjustments to reconcile net income to net cash provided by operating activities: |
||||||||||||
| Depreciation expense |
6,597 | 4,944 | 4,699 | |||||||||
| Amortization of intangible and other assets |
10,709 | 6,980 | 5,375 | |||||||||
| Loss (gain) on disposal of property and equipment |
271 | (64 | ) | — | ||||||||
| Allowances on receivables |
1,512 | 1,394 | 308 | |||||||||
| Deferred income taxes |
1,866 | 40 | 1,717 | |||||||||
| Equity based compensation charges |
7,176 | 6,447 | 5,252 | |||||||||
| Other non-cash (income) charges |
(714 | ) | 198 | 17 | ||||||||
| Changes in assets and liabilities, net of effects from acquisitions: |
||||||||||||
| Accounts receivable |
(5,481 | ) | 18,259 | (23,873 | ) | |||||||
| Rebates receivable |
4,655 | (25,894 | ) | (25,580 | ) | |||||||
| Income tax receivable |
(1,097 | ) | 1,269 | (735 | ) | |||||||
| Inventory, net |
151 | 1,339 | 2,048 | |||||||||
| Other assets |
(8,020 | ) | (3,337 | ) | 646 | |||||||
| Accounts payable |
(48,372 | ) | 13,015 | 23,923 | ||||||||
| Rebate payable |
19,208 | 13,280 | 35,034 | |||||||||
| Accrued expenses and other liabilities |
28,291 | 9,071 | (647 | ) | ||||||||
| Net cash provided by operating activities |
97,709 | 112,106 | 78,578 | |||||||||
| Cash flows from investing activities: |
||||||||||||
| Purchases of property and equipment |
(12,324 | ) | (10,459 | ) | (8,717 | ) | ||||||
| Proceeds from sale of property and equipment |
— | 500 | — | |||||||||
| Business acquisitions and related payments, net of cash acquired |
(239,882 | ) | (11,415 | ) | (142,417 | ) | ||||||
| Purchases of investments |
— | — | (6,825 | ) | ||||||||
| Sales of investments |
11,875 | 225 | 37,700 | |||||||||
| Other investing activities |
— | (312 | ) | — | ||||||||
| Net cash used in investing activities |
(240,331 | ) | (21,461 | ) | (120,259 | ) | ||||||
| Cash flows from financing activities: |
||||||||||||
| Borrowings under revolving credit line |
— | — | 25,000 | |||||||||
| Repayments under revolving credit line |
— | — | (25,000 | ) | ||||||||
| Proceeds from term loan |
150,000 | — | — | |||||||||
| Repayments of term loan |
(1,875 | ) | — | — | ||||||||
| Proceeds from First Rx Specialty and Mail Services, LLC arrangement |
— | 1,000 | 7,000 | |||||||||
| Deferred financing costs |
(3,846 | ) | (415 | ) | — | |||||||
| Contingent consideration payments |
(3,184 | ) | — | — | ||||||||
| Proceeds from exercise of stock options |
3,602 | 2,863 | 4,621 | |||||||||
| Excess tax benefits due to option exercises and restricted stock vesting |
5,965 | 3,637 | 5,497 | |||||||||
| Proceeds from shares issued under employee stock purchase plan |
352 | 339 | 397 | |||||||||
| Purchases of treasury stock |
(2,604 | ) | (993 | ) | (1,828 | ) | ||||||
| Net cash provided by financing activities |
148,410 | 6,431 | 15,687 | |||||||||
| Net increase (decrease) in cash and cash equivalents |
5,788 | 97,076 | (25,994 | ) | ||||||||
| Cash and cash equivalents at the beginning of year |
152,055 | 54,979 | 80,973 | |||||||||
| Cash and cash equivalents at the end of year |
$ | 157,843 | $ | 152,055 | $ | 54,979 | ||||||
| Supplemental disclosure: |
||||||||||||
| Cash paid for interest |
$ | 1,990 | $ | 94 | $ | 257 | ||||||
| Cash paid for taxes |
$ | 42,723 | $ | 34,839 | $ | 22,795 | ||||||
The accompanying notes are an integral part of these consolidated financial statements.
F - 4
Table of Contents
CATALYST HEALTH SOLUTIONS, INC.
and Subsidiaries
CONSOLIDATED STATEMENTS OF COMPREHENSIVE INCOME
(In thousands)
| For the years ended December 31, | ||||||||||||
| 2010 | 2009 | 2008 | ||||||||||
| Net income |
$ | 80,957 | $ | 65,165 | $ | 50,394 | ||||||
| Other comprehensive income, net of tax: |
||||||||||||
| Unrealized gain (loss) on investments |
690 | (36 | ) | (684 | ) | |||||||
| Comprehensive income |
$ | 81,647 | $ | 65,129 | $ | 49,710 | ||||||
The accompanying notes are an integral part of these consolidated financial statements.
F - 5
Table of Contents
CATALYST HEALTH SOLUTIONS, INC.
and Subsidiaries
NOTES TO CONSOLIDATED FINANCIAL STATEMENTS
| 1. | COMPANY |
Catalyst Health Solutions, Inc., a Delaware corporation (the “Company,” “our,” “we” or “us”), is a full-service pharmacy benefit management (“PBM”) company. We operate primarily under the brand name Catalyst Rx. Our clients include self-insured employers, including state and local governments; managed care organizations; third-party administrators; hospices; unions; and individuals who contract with us to administer the prescription drug component of their overall health benefit programs. We provide our clients access to a contracted, non-exclusive national network of approximately 63,000 pharmacies. We provide our clients and their members with timely and accurate benefit adjudication, while controlling pharmacy spending trends through customized plan designs, clinical programs, physician orientation programs and member education. We utilize an electronic point-of-sale system for eligibility verification and plan design information and offer access to rebate arrangements for certain branded pharmaceuticals.
| 2. | SUMMARY OF SIGNIFICANT ACCOUNTING POLICIES |
Basis of presentation
The accompanying consolidated financial statements include the accounts of the Company and all of our subsidiaries. All intercompany accounts and transactions have been eliminated. Certain balance sheet reclassifications were made to the prior year amounts to conform to the current year presentation. These changes have no impact on our previously reported totals for current assets, current liabilities, total assets, total liabilities or stockholders’ equity.
Use of estimates
Preparation of financial statements in conformity with accounting principles generally accepted in the United States of America requires management to make estimates and assumptions that affect the amounts reported in the consolidated financial statements and accompanying notes. Actual results could differ from those estimates. The most significant estimates included in these financial statements include accounting for: rebates earned under arrangements with pharmaceutical manufacturing companies or third party intermediaries; the value of intangible assets acquired in business combinations and related amortization periods; impairment assessments of goodwill; and allowance for accounts receivable.
Fair value of financial instruments
At December 31, 2010 and 2009, our financial instruments included cash and cash equivalents, accounts receivable, rebates receivable, investments, accounts payable, rebates payable, accrued liabilities and long-term debt. With the exception of our investments and long-term debt, the fair values of these financial instruments approximate the carrying value due to the short-term maturities of these instruments. See Note 7 for a discussion of fair value of our investments and long-term debt.
Cash and cash equivalents
All highly liquid investments purchased with an original maturity date of three months or less when purchased are classified as cash equivalents. The Company maintains its cash and cash equivalents in financial institutions with high credit ratings; however, at times the balances may exceed federally insured amounts. The Company has not experienced any losses related to its cash or cash equivalents and believes it is not exposed to any significant credit risk on its cash or cash equivalents.
Accounts receivable
Trade accounts receivable are recorded at the invoiced amount and do not bear interest. The allowance for accounts receivable is our best estimate of the amount of probable credit losses in our existing accounts receivable. We determine the allowance based on historical write-off experience by industry and regional economic data. We review our allowance for accounts receivable quarterly. Account balances are charged off against the allowance when we determine it is probable the receivable will not be recovered. We do not have any off-balance-sheet credit exposure related to our customers.
F - 6
Table of Contents
CATALYST HEALTH SOLUTIONS, INC.
and Subsidiaries
NOTES TO CONSOLIDATED FINANCIAL STATEMENTS (Continued)
Concentration of credit risk
Accounts receivable consists principally of amounts due from the Company’s PBM customers. In 2010, the Company’s top ten clients’ generated approximately 70% of consolidated revenue, including two customers who accounted for 14% and 10% of our consolidated revenue. In addition, we generated approximately 7% of our revenue for the three and a half months ended December 31, 2010 from Independence Blue Cross, following our acquisition of FutureScripts LLC on September 13, 2010. In 2009, the Company’s top ten clients generated approximately 68% of our consolidated revenue, including two customers who accounted for 18% and 12% of our consolidated revenue. In 2008, the Company’s top ten clients generated approximately 64% of our consolidated revenue, including two customers who accounted for 18% and 12% of our consolidated revenue.
The Company holds no collateral for accounts receivable. Concentration of risks with respect to receivables is mitigated based on the geographical dispersion of clients, the Company’s communications with clients, and the Company’s continuous review of outstanding receivables. Management also performs ongoing credit evaluations of its clients and provides allowances as deemed necessary. The Company has not experienced significant losses related to receivables in the past. The Company’s collection experience indicates limited loss exposure due to the nature of the benefits involved and the necessity of benefit continuity for plan sponsor employees.
Rebates receivable and payable
Rebates earned under arrangements with manufacturers or third party intermediaries are predominately recorded as a reduction of direct expenses. The portion, which in some cases may be the full amount, of such rebates due to clients is recorded as a reduction of revenue. Manufacturer or third party intermediary rebates are based on estimates, which are subject to final settlement with the contracted party on an on-going basis.
The Company estimates its rebates receivable and rebates payable based on the number and type of claims submitted, the rebate program terms with its clients, the Company’s rebate contracts with pharmaceutical manufacturers and third party intermediaries, and other information that may be available. The amount of rebates actually received by the Company, and rebates paid to its clients, is impacted by a variety of factors, including the validation of claims data submitted by the Company and differences between estimated and actual rebatable products. In addition, the amount of rebates actually received by the Company, and rebates paid to its clients, in a period may result in adjustments to the estimates made in prior periods.
Inventory
Inventory consists of prescription drugs and medical supplies that are stated at the lower of weighted average cost or market.
Property and equipment
Property and equipment is stated at cost and depreciated over their estimated useful lives using the straight-line method. The estimated useful lives typically range from 3-5 years for the Company’s equipment and computer software while leasehold improvements are amortized over the shorter of the estimated lives of the assets or the lease term.
Internally developed software
We capitalize costs associated with computer software developed or obtained for internal use in accordance with the Financial Accounting Standard Board’s (“FASB”) authoritative guidance on accounting for such costs. Capitalized internal use software development costs include only (1) external direct costs of materials and services consumed in developing and obtaining software, (2) payroll and payroll-related costs for employees who are directly associated with and who devote time to the project, and (3) interest costs incurred, when material, while developing the software. Capitalization of these costs ceases when the project is substantially complete and ready for its intended purpose. Internally developed software is reported in the “property and equipment” line on the consolidated balance sheet.
F - 7
Table of Contents
CATALYST HEALTH SOLUTIONS, INC.
and Subsidiaries
NOTES TO CONSOLIDATED FINANCIAL STATEMENTS (Continued)
Goodwill
Goodwill is not amortized, but is tested for impairment at least annually. We performed our annual impairment testing at December 31, 2010 and 2009 and concluded that no impairment of goodwill existed because the fair value of our reporting units is substantially in excess of the carrying value.
We test for impairment of our goodwill according to a two-step approach. In the first step, we test for impairment of goodwill by estimating the fair values of our reporting units using a present value of future cash flows approach. Although we operate in one reportable segment, for the purposes of performing this impairment test under the accounting guidance, we have identified three reporting units. If the carrying amount of the reporting unit exceeds the fair value, the second step of the goodwill impairment test is performed to measure the amount of the impairment loss, if any.
In the second step, the implied fair value of the goodwill is estimated as the fair value of the reporting unit used in the first step less the fair values of all other net tangible and intangible assets of the reporting unit. If the carrying amount of the goodwill exceeds its implied fair market value, an impairment loss is recognized in an amount equal to that excess, not to exceed the carrying amount of the goodwill. In addition, goodwill of a reporting unit is tested for impairment between annual tests if an event occurs or circumstances change that would more likely than not reduce the fair value of a reporting unit below its carrying value.
Intangible assets
We do not have any intangible assets with indefinite lives. We do have intangible assets subject to amortization and these assets are amortized over 5 months to 20 years, depending on each intangible asset’s estimated useful life. The estimated fair value and the weighted average useful life of the intangible assets are based on income and market approach valuation calculations. The remaining useful life of intangible assets is evaluated periodically and adjusted as necessary to match the period that the assets are expected to provide economic benefits. We concluded that no impairment of our intangible assets existed at December 31, 2010 and 2009.
Impairment of long-lived assets
We investigate potential impairments of our long-lived assets when evidence exists that events or changes in circumstances may have made recovery of an asset’s carrying value unlikely. Long-lived assets are considered to be potentially impaired when the sum of the expected undiscounted future net cash flows is less than the carrying amount of the asset. Any related impairment loss is calculated based upon comparison of the fair value to the carrying value of the asset. No triggering events that would require an impairment test for long-lived assets were identified during 2010 or 2009.
Investments
The Company’s investments, which consist primarily of auction rate securities (“ARS”), and are classified as available-for-sale and are recorded at fair market value, with unrealized gains (losses), net of taxes, reported as a separate component of shareholders’ equity. Realized gains (losses) and amounts representing credit losses, of which there were none in 2010, 2009 and 2008, are included in other income. For purposes of determining any credit loss, the Company assesses the fair value of its ARS under the single best-estimate approach. We continue to receive timely interest payments and there have been instances of recent redemptions of our auction rate securities by issuers at par; however, our ARS investments currently lack short-term liquidity and therefore are classified as non-current on our balance sheet.
Revenue and direct expense recognition
The Company recognizes revenue from services provided to its clients for sales of prescription drugs by either pharmacies in the Company’s nationwide network or through our mail order facilities, and related claims processing fees. Revenue is recognized when the claims are adjudicated. Pharmacy claims are adjudicated at the point-of-sale using an on-line claims processing system. When the Company has a contractual obligation to pay its network
F - 8
Table of Contents
CATALYST HEALTH SOLUTIONS, INC.
and Subsidiaries
NOTES TO CONSOLIDATED FINANCIAL STATEMENTS (Continued)
pharmacy providers for benefits provided to its clients’ members, total payments from these clients, including administration and other fees, are recorded as revenue and payments to the network pharmacy provider and the claim adjudication service costs are recorded as direct expenses. Generally, these contracts require the Company to assume the credit risk of its clients’ abilities to pay.
When the Company administers pharmacy reimbursement contracts and does not assume credit risk, the Company records only the net revenue and the administrative or processing fees.
Rebates earned under arrangements with manufacturers or third party intermediaries are predominately recorded as a reduction of direct expenses. The Company refines its estimates each period based on actual collection and payment experience. For the year ended December 31, 2010, adjustments made to these rebate receivable estimates from prior periods reduced direct expenses by $4.8 million, or approximately 0.1% of direct expenses. Additionally, the portion of manufacturer or third party intermediary rebates due to clients is recorded as a reduction of revenue. For the year ended December 31, 2010, adjustments made to rebate payable estimates from prior periods increased revenue by $3.5 million, or approximately 0.1% of revenue. The impact of adjustments in rebates receivable and rebates payable estimates for the years ended December 31, 2009 and 2008 were not material.
Under the Company’s pharmacy network contracts, the pharmacy is solely obligated to collect the co-payments from the members. Under client contracts, the Company does not assume liability for member co-payments in pharmacy transactions. As such, the Company does not include member co-payments to retail pharmacies in revenue or direct expenses.
Income taxes
Deferred tax assets and liabilities are recognized for the expected future tax consequences of events that have been included in the financial statements or tax returns. Deferred income taxes reflect the net effects of timing differences between the carrying amounts of assets and liabilities for financial reporting purposes and the amounts used for income tax purposes measured using the enacted tax rates and laws that will be in effect when the differences are expected to reverse.
Benefits from uncertain tax positions are recognized in the consolidated financial statements only when it is more likely than not that the tax position will be sustained upon examination by the appropriate taxing authorities having full knowledge of all relevant information. A tax position that meets the more-likely-than-not recognition threshold is measured at the largest amount of benefit that is greater than fifty percent likely of being realized upon settlement.
Net income per share attributable to the Company
Basic net income per common share excludes dilution and is computed by dividing net income available to common stockholders by the weighted average number of common shares outstanding for the period. Diluted net income per common share reflects the potential dilution that could occur (using the treasury stock method) if stock options, restricted stock awards and warrants to issue common stock were exercised.
The following represents a reconciliation of the number of shares used in the basic and diluted net income per share computations (amounts in thousands, except per share data):
| 2010 | 2009 | 2008 | ||||||||||
| Net income available to common stockholders |
$ | 80,957 | $ | 65,165 | $ | 50,394 | ||||||
| Calculation of shares: |
||||||||||||
| Weighted average common shares outstanding, basic |
43,855 | 43,128 | 42,527 | |||||||||
| Dilutive effect of stock options, restricted stock awards and warrants |
681 | 814 | 1,061 | |||||||||
| Weighted average common shares outstanding, diluted |
44,536 | 43,942 | 43,588 | |||||||||
| Net income per common share, basic |
$ | 1.85 | $ | 1.51 | $ | 1.18 | ||||||
| Net income per common share, diluted |
$ | 1.82 | $ | 1.48 | $ | 1.16 | ||||||
During 2010, 100,000 warrants were excluded from the computation of diluted net income per share because the exercise price was greater than the average market price of our common shares.
F - 9
Table of Contents
CATALYST HEALTH SOLUTIONS, INC.
and Subsidiaries
NOTES TO CONSOLIDATED FINANCIAL STATEMENTS (Continued)
Share-based compensation
Share-based compensation awards and awards modified, repurchased, or cancelled are accounted for using the fair value based method under FASB authoritative guidance surrounding share-based payments.
Other comprehensive income
Comprehensive income at December 31, 2010 and 2009 consists of net income plus unrealized net (gains) losses on investments held as available-for-sale.
| 3. | NEW ACCOUNTING STANDARDS |
In December 2010, the Financial Accounting Standards Board (“FASB”) issued a final Accounting Standards Update (“ASU”) that sets forth revised goodwill impairment guidance for reporting units that have a zero or negative carrying amount. For these reporting units, the FASB concluded that step 2 of the test should be performed if qualitative factors indicate that it is more likely than not that goodwill impairment exists. For public entities, this new guidance is effective for fiscal years, and interim periods within those years, beginning after December 15, 2010. Early adoption is not permitted. We do not expect the adoption of this guidance to have an impact on our financial position, results of operations or cash flows.
In January 2010, the Financial Accounting Standards Board (“FASB”) issued a final Accounting Standards Update (“ASU”) that sets forth additional requirements and guidance regarding disclosures of fair value measurements. The ASU requires the gross presentation of activity within the Level 3 fair value measurement roll forward and details of transfers in and out of Level 1 and Level 2 fair value measurements. It also clarifies two existing disclosure requirements within the current fair value authoritative guidance on the level of disaggregation of fair value measurements and disclosures on inputs and valuation techniques. The new requirements and guidance were effective for interim and annual periods beginning after December 15, 2009, which for us meant the beginning of our 2010 fiscal year, except for the Level 3 roll forward requirements which is effective for interim and annual periods beginning after December 15, 2010, which for us means our first quarterly period ending on March 31, 2011. The adoption of the disclosures effective in 2010 did not have an impact on our financial position, results of operations or cash flows. Additionally, we do not expect the adoption of the disclosures which were deferred until the first quarter of 2011 to have an impact on our financial position, results of operations or cash flows.
In June 2009, the FASB issued guidance that changed the consolidation model for variable interest entities (“VIEs”). This guidance requires companies to qualitatively assess the determination of the primary beneficiary of a VIE based on whether a company (1) has the power to direct matters that most significantly impact the activities of the VIE and (2) has the obligation to absorb losses or the right to receive benefits of the VIE that could potentially be significant to the VIE. This standard is effective at the beginning of our 2010 fiscal year. The adoption of the standard did not have an impact on our financial position, results of operations or cash flows.
| 4. | PROPERTY AND EQUIPMENT |
Property and equipment consists of the following (in thousands):
| 2010 | 2009 | |||||||
| Computer hardware |
$ | 11,347 | $ | 5,569 | ||||
| Computer software |
16,639 | 12,572 | ||||||
| Furniture, fixtures and office equipment |
6,094 | 6,753 | ||||||
| Leasehold improvements |
9,485 | 7,500 | ||||||
| Transportation equipment |
2,547 | 1,983 | ||||||
| Assets not yet placed in service |
2,132 | 6,169 | ||||||
| Total property and equipment |
48,244 | 40,546 | ||||||
| Accumulated depreciation |
(17,485 | ) | (15,749 | ) | ||||
| Total property and equipment, net |
$ | 30,759 | $ | 24,797 | ||||
F - 10
Table of Contents
CATALYST HEALTH SOLUTIONS, INC.
and Subsidiaries
NOTES TO CONSOLIDATED FINANCIAL STATEMENTS (Continued)
Depreciation expense for the years ended December 31, 2010, 2009, and 2008 was $6.6 million, $4.9 million and $4.7 million, respectively.
| 5. | INTANGIBLE ASSETS |
The following table sets forth the components of intangible assets at December 31, 2010 and 2009 (in thousands):
| December 31, 2010 | December 31, 2009 | |||||||||||||||||||||||
| Gross Carrying Value |
Accumulated Amortization |
Net Carrying Value |
Gross Carrying Value |
Accumulated Amortization |
Net Carrying Value |
|||||||||||||||||||
| Customer relationships |
$ | 158,754 | $ | (22,071 | ) | $ | 136,683 | $ | 65,596 | $ | (14,962 | ) | $ | 50,634 | ||||||||||
| Non-compete agreements |
155 | (155 | ) | — | 155 | (130 | ) | 25 | ||||||||||||||||
| Trade names |
21,856 | (1,358 | ) | 20,498 | 1,400 | (650 | ) | 750 | ||||||||||||||||
| Developed technology |
1,348 | (411 | ) | 937 | 620 | (202 | ) | 418 | ||||||||||||||||
| Other PBM contracts |
7,036 | (6,283 | ) | 753 | 7,527 | (5,054 | ) | 2,473 | ||||||||||||||||
| Total intangible assets |
$ | 189,149 | $ | (30,278 | ) | $ | 158,871 | $ | 75,298 | $ | (20,998 | ) | $ | 54,300 | ||||||||||
The weighted average amortization period of our intangible assets subject to amortization is 11.6 years. Customer relationships intangibles represent the estimated fair value of customer relationships at the dates of acquisition and are amortized from 5 years to 20 years. The estimated fair values are based on income-method valuation calculations. Non-compete agreements, trade names and developed technology intangibles are subject to amortization from 2 years to 20 years. The other PBM contracts class of intangibles allows us to provide PBM services, and is amortized over the expected period of future cash flow, based on management’s best estimate, which range from 5 months to 20 years.
In determining the useful life of the intangible assets for amortization purposes, we consider the period of expected cash flows used to measure the fair value of the intangible asset, adjusted as appropriate for entity-specific factors. The costs incurred to renew or extend the term of a recognized intangible asset are generally deferred, where practicable, to the extent recoverable from future cash flows. We did not incur costs to renew or extend the term of acquired intangible assets during the years ended December 31, 2010 and 2009.
The aggregate amount of amortization expense of intangible and other assets was $10.7 million, $7.0 million and $5.4 million for the years ended December 31, 2010, 2009 and 2008, respectively. In accordance with applicable accounting guidance, acquisition related intangible amortization expense of $2.7 million for a customer contract related to a PBM agreement has been included as an offset to revenue for the year ended December 31, 2010.
The following table sets forth the estimated aggregate amortization expense of our existing intangible assets for each of the five succeeding years (in thousands):
| Year ended December 31, |
||||
| 2011 |
$ | 15,809 | ||
| 2012 |
15,381 | |||
| 2013 |
14,855 | |||
| 2014 |
14,551 | |||
| 2015 |
14,543 | |||
F - 11
Table of Contents
CATALYST HEALTH SOLUTIONS, INC.
and Subsidiaries
NOTES TO CONSOLIDATED FINANCIAL STATEMENTS (Continued)
| 6. | GOODWILL |
The changes in the carrying amounts of goodwill for the years ended December 31, 2010 and 2009 are as follows (in thousands):
| 2010 | 2009 | |||||||
| Balance as of January 1 |
$ | 273,158 | $ | 252,961 | ||||
| Net adjustments to goodwill acquired in prior acquisitions |
— | (1,361 | ) | |||||
| Goodwill acquired in current acquisitions (see Note 11) |
123,837 | 8,149 | ||||||
| Contingent consideration incurred |
— | 13,408 | ||||||
| Balance as of December 31 |
$ | 396,995 | $ | 273,158 | ||||
The net adjustments to goodwill acquired in prior acquisitions relates primarily to the finalization of purchase price accounting for acquisitions that occurred prior to 2009.
Goodwill represents the excess of the purchase price over the fair value of the net assets of acquired businesses. Approximately $262.7 million and $138.9 million of the Company’s goodwill were deductible for income tax purposes in 2010 and 2009, respectively.
| 7. | FAIR VALUE MEASUREMENTS |
Summary of Financial Assets Measured on a Recurring Basis
The following table details the fair value measurements of our financial assets measured on a recurring basis as of December 31, 2010 and 2009 and indicates the fair value hierarchy of the valuation techniques we utilized to determine such fair value (in thousands).
| Fair Value Measurements at Reporting Date Using | ||||||||||||||||
| December 31, 2010 |
Quoted Prices in Active Markets Using Identical Assets (Level 1) |
Significant Other Observable Inputs (Level 2) |
Significant Unobservable Inputs (Level 3) |
|||||||||||||
| Money market funds |
$ | 144,587 | $ | 144,587 | $ | — | $ | — | ||||||||
| Available for sale investments: |
||||||||||||||||
| Auction rate securities |
577 | — | — | 577 | ||||||||||||
| Total assets measured at fair value |
$ | 145,164 | $ | 144,587 | $ | — | $ | 577 | ||||||||
| Fair Value Measurements at Reporting Date Using | ||||||||||||||||
| December 31, 2009 |
Quoted Prices in Active Markets Using Identical Assets (Level 1) |
Significant Other Observable Inputs (Level 2) |
Significant Unobservable Inputs (Level 3) |
|||||||||||||
| Money market funds |
$ | 142,076 | $ | 142,076 | $ | — | $ | — | ||||||||
| Available for sale investments: |
||||||||||||||||
| Auction rate securities |
11,343 | — | — | 11,343 | ||||||||||||
| Total assets measured at fair value |
$ | 153,419 | $ | 142,076 | $ | — | $ | 11,343 | ||||||||
The valuation technique used to measure fair value for our Level 1 assets is a market approach, using market prices. The valuation technique used to measure fair value for our Level 3 assets is an income approach, using a discounted cash flow model which incorporates a number of variables that reflect current market conditions.
The following table reflects the roll forward of activity for our major classes of assets measured at fair value using Level 3 inputs (in thousands):
| 2010 | 2009 | |||||||
| Beginning Balance |
$ | 11,343 | $ | 11,625 | ||||
| Redemptions and sales during the period |
(11,875 | ) | (225 | ) | ||||
| Changes in unrealized gain (loss) included in accumulated other comprehensive income |
1,109 | (57 | ) | |||||
| Ending Balance |
$ | 577 | $ | 11,343 | ||||
F - 12
Table of Contents
CATALYST HEALTH SOLUTIONS, INC.
and Subsidiaries
NOTES TO CONSOLIDATED FINANCIAL STATEMENTS (Continued)
Investments
The following is a summary of our investments (in thousands):
| Fair Value |
Gross Unrealized Gains |
Gross Unrealized Losses |
Amortized Cost |
|||||||||||||
| As of December 31, 2010: |
||||||||||||||||
| Auction rate securities |
$ | 577 | $ | — | $ | 48 | $ | 625 | ||||||||
| Other long-term investments |
312 | — | — | 312 | ||||||||||||
| Total investments |
$ | 889 | $ | — | $ | 48 | $ | 937 | ||||||||
| As of December 31, 2009: |
||||||||||||||||
| Auction rate securities |
$ | 11,343 | $ |
— |
|
$ | 1,157 | $ | 12,500 | |||||||
| Other long-term investments |
312 | — | — | 312 | ||||||||||||
| Total investments |
$ | 11,655 | $ | — | $ | 1,157 | $ | 12,812 | ||||||||
Auction rate securities
Our auction rate securities (“ARS”) are floating rate securities with longer-term maturities with auction reset dates from 7 to 35 day intervals. Beginning in February 2008, auctions for these securities began to fail. We explored and pursued alternatives for obtaining relief from the unanticipated temporary illiquidity of our auction rate securities holdings, including seeking relief from entities involved in investing our funds in ARS. As a part of these efforts, on February 23, 2009, we brought an arbitration claim before the Financial Industry Regulatory Authority (“FINRA”) against Credit Suisse Securities (USA), LLC (“Credit Suisse”) seeking rescission, restitution and damages for Credit Suisse’s conduct in connection with our investment account with Credit Suisse. On May 27, 2010, the arbitration panel ruled in our favor, finding Credit Suisse liable and requiring Credit Suisse to pay us $9.75 million, representing the par value of the remaining outstanding ARS in our Credit Suisse investment account on the date of the ruling. The ARS in our Credit Suisse investment account were transferred to Credit Suisse.
We currently have remaining $0.6 million at par value in investments related to other ARS. Although we continue to receive timely interest payments, our ARS investments currently lack short-term liquidity and are therefore classified as non-current on our balance sheet. For each of our ARS, we evaluate the risks related to the structure, collateral and liquidity and estimate the fair value of the securities using a discounted cash flow model based on (a) the underlying structure of each security; (b) the present value of future principal and interest payments discounted at rates considered to reflect current market conditions; and (c) considerations of the probabilities of redemption or auction success for each period. Based on the results of these assessments, we recorded a temporary impairment charge in accumulated other comprehensive income of $48 thousand through December 31, 2010 to reduce the value of our ARS classified as available-for-sale securities.
Effective April 1, 2009, we adopted the authoritative guidance which requires other-than-temporary impairments to be separated into (a) the amount representing credit loss and (b) the amount related to all other factors. We have determined there was no credit loss related to our ARS based on our evaluation of the present value of expected cash flows from these securities. Our determination of the expected cash flows was based on employing a single best estimate measure. Accordingly, no impairment losses have been recognized through earnings in 2010.
Summary of Contractual Maturities
The contractual maturities of our available for sale ARS securities at December 31, 2010 are as follows (in thousands):
| Amortized Cost |
Estimated Fair Value |
|||||||
| Due in one year or less |
$ | — | $ | — | ||||
| Due after one year |
625 | 577 | ||||||
| Total |
$ | 625 | $ | 577 | ||||
F - 13
Table of Contents
CATALYST HEALTH SOLUTIONS, INC.
and Subsidiaries
NOTES TO CONSOLIDATED FINANCIAL STATEMENTS (Continued)
Fair Value of Financial Liabilities
The carrying amount of our term loan under our senior credit facilities approximates fair value as of December 31, 2010. We estimate fair value for this liability based on the market value.
| 8. | FINANCING |
The following table sets forth the components of our long-term debt (in thousands):
| December 31, 2010 |
||||
| Senior secured term loan facility due August 4, 2015 with an average interest rate of 2.02% at December 31, 2010 |
$ | 148,125 | ||
| Revolving credit facility due August 4, 2015 |
— | |||
| Total debt |
148,125 | |||
| Less current maturities |
(7,500 | ) | ||
| Long-term debt |
$ | 140,625 | ||
On August 4, 2010, we terminated our then-existing secured revolving credit facility with our primary commercial bank, which was amended on October 9, 2009. This revolving credit facility was for a three-year term expiring October 9, 2012. The maximum principal amount of the facility available to us was $100.0 million. There was no outstanding balance under that credit facility at August 4, 2010 or at December 31, 2009.
On August 4, 2010, we entered into new senior credit facilities consisting of a revolving credit facility and term loan facility. The term loan facility had a principal amount of $150.0 million. Our revolving credit facility has a principal amount of $200.0 million. Each of our revolving credit facility and our term loan facility matures on August 4, 2015. In addition to the revolving credit facility and term loan facility, our new senior credit facilities permit us to incur up to $100.0 million in total principal amount of additional term loan or revolving loan indebtedness under the senior credit facilities. Our obligations under our new senior credit facilities are fully and unconditionally guaranteed jointly and severally by us and certain of our U.S. subsidiaries currently existing or that we may create or acquire, with certain exceptions as set forth in our credit agreement, pursuant to the terms of a separate guarantee and collateral agreement. There was no outstanding balance under the revolving credit facility at December 31, 2010.
The term loan facility amortizes in nominal quarterly installments of $1.875 million on the last day of each calendar quarter, commencing on December 31, 2010 until maturity, whereby the final installment of the term loan facility will be paid on the maturity date in an amount equal to the aggregate unpaid principal amount.
Our borrowings under our new senior credit facilities bear interest at a rate equal to the applicable margin plus, at our option, either: (i) a base rate determined by reference to the higher of (a) the rate announced by the Administrative Agent as its prime rate, (b) the federal funds rate plus 0.5%, and (c) the Adjusted LIBO Rate determined on a daily basis for an interest period of one month, plus 1.00% per annum; or (ii) a LIBO Rate on deposits in U.S. dollars for one-, two-, three- or six-month periods. The applicable margin on loans under our new senior credit facilities is 2.00% for LIBO Rates loans and 1.00% for base rate loans. The applicable margin is subject to change depending on our total senior secured leverage ratio. We also pay the lenders a commitment fee on the unused commitments under our revolving credit facility, which is payable quarterly in arrears. The commitment fee is subject to change depending on our leverage ratio.
Our new senior credit facilities contain negative and affirmative covenants affecting us and our existing and future subsidiaries, with certain exceptions set forth in our credit agreement. Negative covenants and restrictions include: restrictions on liens, debt, dividends and other restricted payments, redemptions and stock repurchases, consolidations and mergers, acquisitions, investments, loans, advances, restrictive agreements with subsidiaries, speculative hedging agreements and a leverage ratio of consolidated total debt to consolidated EBITDA. At December 31, 2010, we believe we were in compliance with all covenants associated with our credit facilities.
Financing costs of $4.1 million for the issuance of the credit facilities are being amortized over an average weighted period of 4.6 years and are reflected in other assets in the accompanying consolidated balance sheet.
F - 14
Table of Contents
CATALYST HEALTH SOLUTIONS, INC.
and Subsidiaries
NOTES TO CONSOLIDATED FINANCIAL STATEMENTS (Continued)
| 9. | INCOME TAXES |
We file income tax returns in the U.S. federal jurisdiction and various state jurisdictions. Our federal income tax returns for 2007 through 2010 are open tax years. State jurisdictions that remain subject to examinations range from 2006 to 2010.
U.S. GAAP accounting guidance for uncertain tax positions prescribes a recognition threshold and measurement criteria for the financial statement recognition and measurement of a tax position taken or expected to be taken in a tax return. As of December 31, 2010 and 2009, the Company had no accrued liabilities on the consolidated balance sheet related to uncertain federal or state income tax matters.
From time to time, we may be assessed interest or penalties by major tax jurisdictions, although any such assessments historically have been minimal and immaterial to our financial results. Our policy is that we recognize interest and penalties accrued on any unrecognized tax benefits as a component of income tax expense.
The components of income tax (benefit) expense at December 31, 2010, 2009 and 2008 are as follows (in thousands):
| 2010 | 2009 | 2008 | ||||||||||||
| Current: |
Federal |
$ | 41,788 | $ | 34,929 | $ | 24,990 | |||||||
| State |
5,783 | 4,796 | 2,507 | |||||||||||
| Foreign |
20 | 20 | 19 | |||||||||||
| Total |
47,591 | 39,745 | 27,516 | |||||||||||
| Deferred: |
Federal |
1,566 | 234 | 1,957 | ||||||||||
| State |
300 | (194 | ) | (204 | ) | |||||||||
| Total |
1,866 | 40 | 1,753 | |||||||||||
| Total: |
Federal |
43,354 | 35,163 | 26,947 | ||||||||||
| State |
6,083 | 4,602 | 2,303 | |||||||||||
| Foreign |
20 | 20 | 19 | |||||||||||
| Total |
$ | 49,457 | $ | 39,785 | $ | 29,269 | ||||||||
F - 15
Table of Contents
CATALYST HEALTH SOLUTIONS, INC.
and Subsidiaries
NOTES TO CONSOLIDATED FINANCIAL STATEMENTS (Continued)
A summary of the components of deferred income taxes at December 31, 2010 and 2009 is as follows (in thousands):
| 2010 | 2009 | |||||||
| Deferred tax assets: |
||||||||
| Allowance for doubtful accounts |
$ | 1,266 | $ | 656 | ||||
| Equity based compensation |
2,664 | 1,346 | ||||||
| Deferred rent |
1,074 | 704 | ||||||
| Federal and state net operating loss carryforwards |
1,453 | 198 | ||||||
| Capital loss |
770 | 770 | ||||||
| Other |
1,077 | 436 | ||||||
| Total deferred tax assets |
8,304 | 4,110 | ||||||
| Valuation allowance |
(770 | ) | (770 | ) | ||||
| Total deferred tax assets net of valuation allowance |
7,534 | 3,340 | ||||||
| Deferred tax liabilities: |
||||||||
| Goodwill |
(13,252 | ) | (11,487 | ) | ||||
| Deferred charges |
(81 | ) | (89 | ) | ||||
| Property and equipment |
(5,065 | ) | (1,236 | ) | ||||
| Customer-based and other intangibles |
(6,173 | ) | (5,360 | ) | ||||
| Total deferred tax liability |
(24,571 | ) | (18,172 | ) | ||||
| Net deferred tax liability |
$ | (17,037 | ) | $ | (14,832 | ) | ||
The Company had net operating loss carryforwards of $14.9 million and $8.7 million at December 31, 2010 and 2009, respectively, which were available to offset future state taxable income and will expire beginning 2024 through 2030.
We have determined that a valuation allowance is needed against a deferred tax asset related to the capital loss that the Company realized during 2008 because there is not enough positive evidence to meet the “more likely than not” threshold for recognition.
The effective tax rate varies from the U.S. Federal Statutory tax rate principally due to the following:
| 2010 | 2009 | 2008 | ||||||||||
| U.S. Federal Statutory tax rate |
35.0 | % | 35.0 | % | 35.0 | % | ||||||
| State taxes, net of federal benefits |
3.0 | 2.8 | 1.9 | |||||||||
| Non-deductible expenses |
0.1 | 0.1 | 0.2 | |||||||||
| Non-taxable income |
— | — | (0.1 | ) | ||||||||
| Other |
(0.2 | ) | — | (0.3 | ) | |||||||
| Effective tax rate |
37.9 | % | 37.9 | % | 36.7 | % | ||||||
| 10. | STOCKHOLDERS’ EQUITY |
Equity Plans
In 1999, the Company established the Catalyst Health Solutions, Inc. 1999 Stock Option Plan (“1999 SOP”). The 1999 SOP provides for a maximum of 4,000,000 common shares of the Company to be issued as option grants. A Committee of the Board of Directors determines award amounts, option prices and vesting periods, subject to the provisions of the 1999 SOP. All option grants expire in ten years. All officers, employees and independent contractors of the Company are eligible to receive option awards at the discretion of the Committee.
In 2000, the shareholders approved and the Company adopted the Catalyst Health Solutions, Inc. 2000 Stock Option Plan (“2000 SOP”). The 2000 SOP provides for a maximum of 1,000,000 common shares of the Company to be issued as option grants. A Committee of the Board of Directors determines award amounts, option prices and vesting periods, subject to the provisions of the 2000 SOP. All option grants expire in ten years. All officers, employees and independent contractors of the Company are eligible to receive option awards at the discretion of the Committee.
F - 16
Table of Contents
CATALYST HEALTH SOLUTIONS, INC.
and Subsidiaries
NOTES TO CONSOLIDATED FINANCIAL STATEMENTS (Continued)
In 2000, the shareholders approved and the Company adopted the Catalyst Health Solutions, Inc. Directors’ Stock Option Plan (“Directors’ SOP”). The Directors’ SOP, as subsequently amended, provided for a maximum of 400,000 common shares of the Company to be issued as option grants. The Board of Directors determines award amounts, option prices and vesting periods, subject to the provisions of the Directors’ SOP. All option grants expire in ten years. All non-employee Directors of the Company are eligible to receive option awards at the discretion of the Board of Directors.
In 2003, the shareholders approved and the Company adopted the Catalyst Health Solutions, Inc. 2003 Equity Incentive Plan (“2003 EIP”). The 2003 EIP provides for a maximum of 1,500,000 common shares of the Company to be issued as option grants or restricted shares. A Committee of the Board of Directors determines award amounts, option prices, vesting periods, and restrictions, subject to the provisions of the 2003 EIP. All grants expire in ten years. All officers, employees and independent contractors of the Company are eligible to receive option and restricted stock awards at the discretion of the Committee.
In 2004, the shareholders approved and the Company adopted the Catalyst Health Solutions, Inc. 2004 Employee Stock Purchase Plan (“ESPP”). The ESPP, as subsequently amended, provides eligible employees of the Company with opportunities to purchase shares of the Company common stock. 200,000 shares have been approved for this purpose. The ESPP is intended to qualify as an “employee stock purchase plan” as defined in Section 423 if the Internal Revenue Code of 1986, as amended.
In 2006, the shareholders approved and the Company adopted the Catalyst Health Solutions, Inc. 2006 Stock Incentive Plan (“2006 SIP”). The 2006 SIP, as subsequently amended, provides for a maximum of 3,000,000 common shares of the Company to be issued as option grants or restricted shares. A Committee of the Board of Directors determines award amounts, option prices, vesting periods, and restrictions, subject to the provisions of the 2006 SIP. All grants expire in ten years. All employees, outside directors and independent contractors of the Company are eligible to receive option and restricted stock awards at the discretion of the Committee.
Stock Options
A summary of our stock option activity for the year ended December 31, 2010 is as follows (in thousands, except price per share and weighted-average exercise price):
| Number of Options |
Price Per Share |
Weighted - Average Exercise Price |
||||||||||
| Outstanding at December 31, 2009 |
943 | $ | 3.56 – 17.64 | $ | 7.85 | |||||||
| Granted |
— | — | — | |||||||||
| Exercised |
(415 | ) | 3.56 – 17.64 | 8.68 | ||||||||
| Forfeited or expired |
(62 | ) | 4.63 – 13.30 | 12.35 | ||||||||
| Outstanding at December 31, 2010 |
466 | $ | 3.56 – 14.21 | $ | 6.51 | |||||||
| Exercisable at December 31, 2010 |
466 | $ | 3.56 – 14.21 | $ | 6.51 | |||||||
The aggregate intrinsic value of exercisable stock options at December 31, 2010 and 2009 was approximately $18.6 million and $27.0 million, respectively, with a weighted average remaining life of 1.5 years at December 31, 2010. The total intrinsic value of stock options exercised during the years ended December 31, 2010, 2009 and 2008 was $13.0 million, $9.1 million and $15.4 million, respectively.
F - 17
Table of Contents
CATALYST HEALTH SOLUTIONS, INC.
and Subsidiaries
NOTES TO CONSOLIDATED FINANCIAL STATEMENTS (Continued)
Restricted Stock Awards
A summary of our restricted share activity for the year ended December 31, 2010 is as follows (in thousands, except for weighted average fair value per share):
| Shares | Weighted Average Fair Value Per Share |
|||||||
| Non-vested shares outstanding at December 31, 2009 |
640 | $ | 25.08 | |||||
| Granted |
322 | 38.96 | ||||||
| Vested |
(214 | ) | 25.82 | |||||
| Forfeited or expired |
(98 | ) | 26.35 | |||||
| Non-vested shares outstanding at December 31, 2010 |
650 | $ | 31.52 | |||||
The fair value of restricted shares, based on our stock price at the date of grant, is expensed over the vesting period. As of December 31, 2010 and 2009, the total remaining unrecognized compensation cost related to non-vested restricted shares was approximately $15.2 million and $12.0 million, respectively, with a weighted average period over which it is expected to be recognized of 2.8 years.
Employee Stock Purchase Plan
Our employee stock purchase plan (“ESPP”) allows eligible employees to purchase shares of the Company’s common stock each quarter at 95% of the market value on the last day of the quarter. The ESPP is not considered compensatory under the provisions of the FASB’s stock compensation guidance and therefore no portion of the costs related to ESPP purchases are included in our stock-based compensation expense for the years ended December 31, 2010, 2009 and 2008.
Common Stock Warrants
Pursuant to our acquisition of inPharmative on August 25, 2010 (see Note 11), we issued 100,000 common stock warrants. These warrants, which expire on August 25, 2013, have an exercise price of $44.73 per share and were valued at approximately $1.0 million using the Black-Scholes equity-pricing model. The warrants remained issued and outstanding at December 31, 2010. The key assumptions used by us in valuing these warrants were:
| Expected volatility |
40 | % | ||
| Expected dividend yield |
0 | % | ||
| Risk-free interest rate |
0.77 | % | ||
| Expected term |
3 years |
Pursuant to an acquisition in 2004, we issued common stock warrants of 55,000, 100,000 and 100,000, effective July 2007, 2006 and 2005, respectively, at an exercise price of $15.45 per share. These 255,000 common stock warrants remain issued and outstanding at December 31, 2010.
Treasury Stock
Recipients of restricted stock awards are provided the opportunity to sell a portion of those shares to the Company at the time the shares vest in order to pay their withholding tax obligations. We account for these share purchases as treasury stock transactions using the cost method. For the years ended December 31, 2010, 2009 and 2008, 67,000, 46,000 and 70,000 shares, respectively, were used for this purpose at a value of approximately $2.6 million, $1.0 million and $1.8 million, respectively.
| 11. | BUSINESS COMBINATIONS |
Effective January 1, 2009, we implemented the FASB’s revised authoritative guidance for business combinations which establishes principles and requirements for how an acquirer in a business combination recognizes and measures in its financial statements the identifiable assets acquired, the liabilities assumed and any controlling interest in the acquiree at the acquisition date fair value. The revised guidance significantly changed the accounting for business combinations in a number of areas including the treatment of contingent consideration, pre-
F - 18
Table of Contents
CATALYST HEALTH SOLUTIONS, INC.
and Subsidiaries
NOTES TO CONSOLIDATED FINANCIAL STATEMENTS (Continued)
acquisition contingencies and transaction costs. In addition, any changes in an acquired entity’s deferred tax assets and uncertain tax positions after the measurement period will impact income tax expense. The guidance also included a substantial number of new disclosure requirements. The adoption of this revised guidance did not have a material impact on our consolidated financial statements. However, any future effects of this guidance on our consolidated financial statements will depend upon the terms and size of future business acquisitions.
Acquisition of FutureScripts, LLC
On September 13, 2010, we completed the acquisition of FutureScripts, LLC and FutureScripts Secure LLC (collectively, “FutureScripts”). FutureScripts, formed in 2006, was the PBM subsidiary of Independence Blue Cross (“IBC”). FutureScripts provides pharmacy benefit management services to approximately 1 million lives and manages over 14 million prescriptions annually. We manage these pharmacy benefits under the terms of a 10-year contract. Under the terms of the acquisition agreement, we maintain the FutureScripts brand and provide IBC a full complement of services, including: claims adjudication, member services, network administration, formulary management and rebate contracting, mail and specialty drug management, clinical services, data reporting and analytics, as well as client service and sales support.
Total consideration for the acquisition of FutureScripts consisted of cash payments of $225.5 million. The purchase price was funded from our cash on hand. We incurred approximately $1.5 million of acquisition-related costs, which are included in selling, general and administrative expenses in our consolidated statements of operations for the year ended December 31, 2010.
The purchase price of FutureScripts was largely determined on the basis of management’s expectations of future earnings and cash flows, resulting in the recognition of goodwill. Management’s preliminary allocation of the purchase price to the net assets acquired resulted in goodwill of $111.2 million, trade name intangibles of $20.0 million with an estimated useful life of 20 years, and customer contract intangibles of $90.0 million with an estimated useful life of 10 years. Because valuations of acquired assets and liabilities are in process, and information may become available within the measurement period which indicates a potential change to these valuations, the purchase price allocation is subject to adjustment.
The following table summarizes the consideration transferred to acquire FutureScripts and the preliminary amounts of identified assets acquired and liabilities assumed at the date of acquisition. The acquisition was accounted for as a purchase, and accordingly, the results of FutureScripts operations are included in our consolidated financial statements since the date of acquisition. Amounts are in thousands.
| At Sept. 13, 2010 |
||||
| Fair value of consideration: |
||||
| Cash |
$ | 225,488 | ||
| Total consideration |
225,488 | |||
| Preliminary valuation of identifiable assets acquired and liabilities assumed: |
||||
| Cash and cash equivalents |
1,986 | |||
| Current assets (primarily accounts receivable and rebates receivable) |
66,751 | |||
| Intangible assets |
110,000 | |||
| Property, plant and equipment |
160 | |||
| Liabilities assumed (primarily trade payable and rebates payable) |
(64,637 | ) | ||
| Total identified net assets |
114,260 | |||
| Goodwill |
$ | 111,228 | ||
Goodwill related to this acquisition is deductible for tax purposes. The goodwill recognized is primarily attributable to the workforce of the acquired business and the operating synergies expected to be realized after our acquisition of FutureScripts.
The acquired business contributed revenue of $247.2 million and net income of $0.9 million to us for the period from September 13, 2010 to December 31, 2010. The following table sets forth certain unaudited pro forma financial data assuming the acquisition of FutureScripts had been completed as of the beginning of the earliest period presented, after giving effect to purchase accounting adjustments. The pro forma financial information is not necessarily indicative of the results of operations if the transaction had been in effect as of the beginning of the periods presented, nor is it necessarily an indication of trends in future results. Amounts are in thousands, except for per share data.
F - 19
Table of Contents
CATALYST HEALTH SOLUTIONS, INC.
and Subsidiaries
NOTES TO CONSOLIDATED FINANCIAL STATEMENTS (Continued)
| For the year ended December 31, |
||||||||
| 2010 | 2009 | |||||||
| (Unaudited) | ||||||||
| Revenue |
$ | 4,391,306 | $ | 3,792,064 | ||||
| Net income |
$ | 79,599 | $ | 64,473 | ||||
| Net income per share, basic |
$ | 1.82 | $ | 1.49 | ||||
| Net income per share, diluted |
$ | 1.79 | $ | 1.47 | ||||
| Weighted average shares, basic |
43,855 | 43,128 | ||||||
| Weighted average shares, diluted |
44,536 | 43,942 | ||||||
Acquisition of inPharmative, Inc.
On August 25, 2010, we acquired inPharmative, Inc. for a cash payment of $16.5 million and 100,000 common stock warrants valued at approximately $1.0 million using the Black-Scholes option pricing model. inPharmative, which is based in Kansas City, MO, is a provider of rebate administration technology tools to PBMs, health plans, state Medicaid programs and group purchasing organizations.
We incurred approximately $0.4 million of acquisition-related costs, which are included in selling, general and administrative expenses in our consolidated statements of operations for the year ended December 31, 2010.
The purchase price of inPharmative was largely determined on the basis of management’s expectations of future earnings and cash flows, resulting in the recognition of goodwill. Management’s final allocation of the purchase price to the net assets acquired resulted in goodwill of $12.6 million, customer relationships of $3.2 million with an estimated useful life of 12 years, technology software of $0.7 million with an estimated useful life of 3 years, and trade name intangibles of $0.5 million with an estimated useful life of 20 years. Goodwill related to this acquisition is deductible for tax purposes.
The acquisition was accounted for as a purchase, and accordingly, the results of inPharmative operations are included in our consolidated financial statements since the date of acquisition. Revenue and expenses since acquisition and unaudited pro forma financial information have not been disclosed herein because of the immateriality of the inPharmative business combination.
The following table summarizes the consideration transferred to acquire inPharmative and the amounts of identified assets acquired and liabilities assumed at the date of acquisition. Amounts are in thousands.
| At August 25, 2010 |
||||
| Fair value of consideration transferred: |
||||
| Cash |
$ | 16,500 | ||
| Warrants |
988 | |||
| Total consideration |
17,488 | |||
| Recognized amounts of identifiable assets acquired and liabilities assumed: |
||||
| Cash |
120 | |||
| Current assets (primarily accounts receivable) |
944 | |||
| Intangible assets |
4,342 | |||
| Property, plant and equipment |
217 | |||
| Liabilities assumed (primarily accrued expenses) |
(744 | ) | ||
| Total identified net assets |
4,879 | |||
| Goodwill |
$ | 12,609 | ||
Acquisition of Total Script, LLC
On July 16, 2009, we purchased Total Script, LLC, a pharmacy benefit management company with a strategic focus on the small to mid-sized employer group markets. Consideration for the acquisition of Total Script consisted of cash payments of $13.5 million. We incurred approximately $0.2 million of acquisition-related costs, which are included in selling, general and administrative expenses in our consolidated statements of operations for the year ended December 31, 2009. Additionally, the purchase agreement includes contingent consideration payable over a
F - 20
Table of Contents
CATALYST HEALTH SOLUTIONS, INC.
and Subsidiaries
NOTES TO CONSOLIDATED FINANCIAL STATEMENTS (Continued)
three-year period based on the achievement of certain milestones and on net new business contracted. The fair value of the net contingent consideration recognized on the acquisition date, which was determined using expected present value techniques, was approximately $13.4 million. During 2010, we made contingent consideration payments of $3.2 million, based on the achievement of certain milestones and net new business acquired. Additionally, during 2010 and 2009, there were decreases of $1.1 million and $0.1 million, respectively, in the fair value of recognized amounts for the remaining contingent consideration primarily due to revised assumptions regarding net new business contracted. The adjustments of the fair value of recognized amounts for contingent consideration were included in selling, general and administrative expenses in our consolidated statement of operations.
The purchase price of Total Script was largely determined on the basis of management’s expectations of future earnings and cash flows, resulting in the recognition of goodwill. Management’s allocation of the purchase price to the net assets acquired resulted in goodwill of $21.6 million and PBM customer relationship intangibles of $5.1 million with an estimated useful life of 14 years. Goodwill related to this acquisition is deductible for tax purposes.
The following table summarizes the consideration transferred to acquire Total Script and the amounts of identified assets acquired and liabilities assumed at the date of acquisition. The acquisition was accounted for as a purchase, and accordingly, the results of Total Script operations are included in our consolidated financial statements since the date of acquisition. Amounts are in thousands.
| At July 16, 2009 |
||||
| Fair value of consideration: |
||||
| Cash |
$ | 13,501 | ||
| Contingent consideration |
13,408 | |||
| Total consideration |
26,909 | |||
| Recognized amounts of identifiable assets acquired and liabilities assumed: |
||||
| Cash |
912 | |||
| Current assets |
2,876 | |||
| Intangible assets |
5,100 | |||
| Liabilities assumed |
(3,536 | ) | ||
| Total identified net assets |
5,352 | |||
| Goodwill |
$ | 21,557 | ||
Revenue and expenses since acquisition and unaudited pro forma financial information have not been included because of the immateriality of the Total Script business combination.
Other acquisitions
To support our geographic expansion and growth, we have periodically completed various insignificant business acquisitions to secure local operating assets, new pharmacy network contracts and local market executive offices. None of these transactions has had any significant impact on our reported revenues, assets or results of operations.
| 12. | LEASE COMMITMENTS |
The Company maintains non-cancelable lease agreements for office space in its 16 main operating locations. These agreements provide for annual escalations and payment by the Company of its proportionate share of the increase in the costs of operating the buildings. The Company also leases certain office equipment. The Company recognizes rent expense on a straight-line basis over the terms of the leases.
F - 21
Table of Contents
CATALYST HEALTH SOLUTIONS, INC.
and Subsidiaries
NOTES TO CONSOLIDATED FINANCIAL STATEMENTS (Continued)
The future minimum payments due under non-cancelable leases are as follows (in thousands):
| 2011 |
$ | 5,751 | ||
| 2012 |
4,923 | |||
| 2013 |
4,886 | |||
| 2014 |
4,755 | |||
| 2015 |
4,921 | |||
| Thereafter |
31,128 | |||
| $ | 56,364 | |||
Rent expense for the years ended December 31, 2010, 2009 and 2008 was $5.6 million, $5.6 million and $5.1 million, respectively.
| 13. | COMMITMENTS AND CONTINGENCIES |
In connection with First Rx Specialty and Mail Services, LLC, an entity that we formed in December 2008, we received $7.0 million in cash in December 2008 and $1.0 million in cash in the first quarter of 2009. We have considered the accounting for the arrangement and recorded a liability in our consolidated balance sheet. As a part of this arrangement, we are also recognizing expense, of which approximately $0.3 million was recognized during each of the years ended December 31, 2010 and 2009, associated with the accretion of the liability to its ultimate redemption value of $9.0 million. We have a contractual obligation to redeem the total amount in cash in the year 2013. This obligation is included in other current liabilities in our consolidated balance sheet at December 31, 2010, because of unilateral contract termination rights exercisable beginning on December 1, 2011 and may require the Company to satisfy the obligation on demand.
In the ordinary course of our business, we are sometimes required to provide financial guarantees related to certain customer contracts. These financial guarantees may include performance bonds, standby letters of credit or other performance guarantees. These financial guarantees represent obligations to make payments to customers if we fail to fulfill an obligation under a contractual arrangement with that customer. We have had no history of significant claims, nor are we aware of circumstances that would require us to perform under these arrangements. We believe that the resolution of any claim that might arise in the future, either individually or in the aggregate, would not have a material adverse effect on our financial condition, results of operations or cash flows.
| 14. | SEGMENT REPORTING |
We have determined that we operate in only one segment – the PBM segment. Accordingly, no segment disclosures have been included in the notes to the consolidated financial statements.
| 15. | 401(k) SAVINGS PLAN |
We offer a 401(k) Savings Plan (the “Plan”) to all Company employees, subject to certain service requirements. The Company matches the first $1,000 of the employee’s contribution to the Plan and 50% thereafter, up to a discretionary pre-defined limit, on the first ten percent of the employee’s pre-tax deferral subject to statutory limits. The Company’s matching contribution vests ratably over 5 years for each employee. For the years ended December 31, 2010, 2009, and 2008, we incurred expense of $1.2 million, $1.0 million, and $0.8 million respectively, under the Plan.
| 16. | RELATED PARTY TRANSACTIONS |
In September 2007, the Company expanded its corporate offices in Rockville, Maryland by assuming 34,382 square feet of finished office space on the third floor of 800 King Farm Boulevard from two companies owned by Thomas L. Blair. In these transactions the Company assumed one prime lease for 17,487 square feet of space and assumed a second prime lease for another 16,895 square feet. In the second transaction, the Company contemporaneously subleased 6,932 square feet of finished office space it held on the first floor of 800 King Farm Boulevard back to the companies owned by Mr. Blair. The transactions allowed the Company to consolidate operations on two contiguous floors and reflected only the assumption of actual occupancy costs. In September
F - 22
Table of Contents
CATALYST HEALTH SOLUTIONS, INC.
and Subsidiaries
NOTES TO CONSOLIDATED FINANCIAL STATEMENTS (Continued)
2010, due to continued expansion of the corporate offices, the Company assumed 500 square feet of its previously subleased space on the first floor. The rent charged by the Company under the sublease is the Company’s actual rent obligation for the space amounting to $245,000, $239,000 and $233,000 in 2010, 2009 and 2008, respectively.
In November 2008, the Company continued its expansion of corporate offices in Rockville, Maryland by assuming an additional 3,032 square feet of finished office space from Mr. Blair on the third floor of 800 King Farm Boulevard. The Company’s rent obligation for this space amounted to approximately $98,000, $95,000 and $8,000 in 2010, 2009 and 2008, respectively.
Mr. Blair was a member of the Company’s Board of Directors at the time of these transactions and until December 31, 2008, at which time he retired, as disclosed in the Company’s Form 8-K filed on December 3, 2008. Mr. Blair is also the father of David T. Blair, the Company’s Chief Executive Officer.
| 17. | SUPPLEMENTAL DISCLOSURE OF QUARTERLY RESULTS OF OPERATIONS (UNAUDITED) |
Quarterly results of operations for the years ended December 31, 2010 and 2009 (in thousands, except per share amounts):
| First Quarter |
Second Quarter |
Third Quarter |
Fourth Quarter |
|||||||||||||
| 2010 Quarterly Operating Results (1) |
||||||||||||||||
| Revenue (excludes member co-payments of $254,203, $231,174, $251,412, and $288,517 for the four quarterly periods ended March 31, June 30, September 30, and December 31, 2010) |
$ | 832,312 | $ | 890,107 | $ | 925,056 | $ | 1,116,617 | ||||||||
| Gross profit |
50,647 | 55,724 | 61,743 | 66,135 | ||||||||||||
| Operating income |
28,438 | 31,641 | 35,004 | 37,421 | ||||||||||||
| Income before income taxes |
28,281 | 31,524 | 34,413 | 36,196 | ||||||||||||
| Net income |
17,421 | 19,479 | 21,505 | 22,552 | ||||||||||||
| Net income per common share, basic |
$ | 0.40 | $ | 0.44 | $ | 0.49 | $ | 0.51 | ||||||||
| Net income per common share, diluted |
$ | 0.39 | $ | 0.44 | $ | 0.48 | $ | 0.51 | ||||||||
| 2009 Quarterly Operating Results |
||||||||||||||||
| Revenue (excludes member co-payments of $202,425, $189,878, $206,441, and $211,832 for the four quarterly periods ended March 31, June 30, September 30, and December 31, 2009) |
$ | 703,272 | $ | 717,629 | $ | 725,579 | $ | 747,900 | ||||||||
| Gross profit |
41,130 | 45,135 | 48,967 | 50,532 | ||||||||||||
| Operating income |
21,811 | 25,873 | 27,865 | 29,179 | ||||||||||||
| Income before income taxes |
22,004 | 26,033 | 27,855 | 29,058 | ||||||||||||
| Net income |
13,818 | 16,157 | 17,230 | 17,960 | ||||||||||||
| Net income per common share, basic |
$ | 0.32 | $ | 0.38 | $ | 0.40 | $ | 0.41 | ||||||||
| Net income per common share, diluted |
$ | 0.32 | $ | 0.37 | $ | 0.39 | $ | 0.41 | ||||||||
| (1) | - Includes the acquisition of FutureScripts effective September 13, 2010. |
| 18. | SUBSEQUENT EVENT |
On January 25, 2011, we acquired NLBP, LLC, an Arizona limited liability company which has developed an electronic clinical messaging platform, for $4.2 million in cash.
F - 23
Table of Contents
CATALYST HEALTH SOLUTIONS, INC.
and Subsidiaries
CATALYST HEALTH SOLUTIONS, INC.
SCHEDULE II—VALUATION AND QUALIFYING ACCOUNTS
(In thousands)
| Description |
Balance Beginning of Period |
Additions/ (Reductions) Charged to Costs and Expense |
Additions/ (Reductions) Due to Acquisitions |
Deductions | Balance End of Period |
|||||||||||||||
| Deduction from asset account: |
||||||||||||||||||||
| Allowance for accounts receivable: |
||||||||||||||||||||
| Year ended December 31, 2010 |
$ | 1,533 | $ | 1,430 | $ | — | $ | (364 | ) | $ | 2,599 | |||||||||
| Year ended December 31, 2009 |
1,064 | 811 | 18 | (360 | ) | 1,533 | ||||||||||||||
| Year ended December 31, 2008 |
825 | 122 | 243 | (126 | ) | 1,064 | ||||||||||||||
| Allowance for rebates receivable: |
||||||||||||||||||||
| Year ended December 31, 2010 |
$ | 998 | $ | 342 | $ | 37 | $ | — | $ | 1,377 | ||||||||||
| Year ended December 31, 2009 |
404 | 583 | 11 | — | 998 | |||||||||||||||
| Year ended December 31, 2008 |
218 | 79 | 107 | — | 404 | |||||||||||||||
S-1