Attached files
| file | filename |
|---|---|
| 8-K - FORM 8-K - TELEFLEX INC | c13188e8vk.htm |

| 1 TELEFLEX INCORPORATED 2010 EARNINGS & 2011 OUTLOOK CONFERENCE CALL Exhibit 99.1 |
| 2 Conference Call Logistics The release, accompanying slides, and replay webcast available online at www.teleflex.com (click on "Investors") Telephone replay available by dialing 888-286-8010 or for international calls, 617- 801-6888, pass code number 84161006 |
| 3 Introductions Benson Smith Chairman, President and CEO Randy Meier Executive Vice President and CFO Jake Elguicze Vice President, Investor Relations |

| 4 4 4 4 4 4 Forward-Looking Statements/Additional Notes This presentation and our discussion contain forward-looking information and statements including, but not limited to, our expectation that the VasoNova business will be accretive to revenue and earnings by year-end 2011; longer-term growth and profitability objectives over the next 5 years, including, achievement of consolidated organic revenue growth of approximately 5%, consolidated gross margins of approximately 55%, consolidated research and development expense as a percentage of revenue of approximately 5%, consolidated operating margins of approximately 25% and annual return on equity of 15%; forecasted 2011 total company revenue and total company cash earnings per share excluding special items; and other matters which inherently involve risks and uncertainties which could cause actual results to differ from those projected or implied in the forward- looking statements. These risks and uncertainties are addressed in the Company's SEC filings, including its most recent Form 10-K. This presentation includes certain non-GAAP financial measures, which include adjusted earnings per share; revenue growth on a constant currency basis; adjusted gross margins; adjusted operating margins; adjusted gross profit; adjusted selling, general and administrative expenses; adjusted operating expenses; adjusted operating income; adjusted cash flow from operations; and forecasted consolidated earnings per share excluding special items and amortization expense, which we refer to as "Adjusted Cash EPS." These non-GAAP measures exclude the impact of restructuring and impairment costs, losses and other charges, certain tax payments, debt restructuring costs, facility shut down costs, acquisition integration costs and the impact of changes in certain accounting rules. In addition, this presentation includes information regarding adjusted free cash flow, which reflects cash flow from operations minus capital expenditures and dividends and excludes the impact of the adoption of ASC topic 860 and certain tax payments. Reconciliation of these non-GAAP measures to the most comparable GAAP measures is contained within this presentation. Segment operating profit is defined as a segment's revenues reduced by its materials, labor and other product costs along with the segment's selling, engineering and administrative expenses and noncontrolling interest. Unallocated corporate expenses, restructuring costs, gain or loss on the sale of assets, acquisition integration costs, fair market adjustments for inventory, interest income and expense and taxes on income are excluded from the measure. Core revenues and growth exclude the impact of translating the results of international subsidiaries at different currency exchange rates from year to year and the comparable activity of companies acquired or divested within the most recent twelve-month period. The following slides reflect continuing operations. |

| 5 HIGHLIGHTS |
| 6 2010 Highlights Significant portfolio transformation progress made to med-tech company Focus on devices that provide leadership position for access into the body Divested additional non-core / cyclical assets Full year research & development spending up 16% to 2.4% of revenue New product introductions ArrowEVOLUTION(tm) PICC with Chlorag+ard(tm) technology The PICC WAND(tm) Safety Introducer with ARROW(r) peelable sheath Gibeck(r) Humid-Flo(r) Passive Humidification kit Teleflex ISIS(tm) HVT(tm) Endotracheal Tube Vitality Index of 9.2%, up 70 bps Obtained Receipt of Approval of All Certificates to Foreign Governments from FDA Completed a series of refinancing transactions Extended maturities and optimized capital structure Provided financial flexibility to grow medical business Adjusted EPS of $3.93, up 14% versus prior year |
| 7 2011 Recent Developments VasoNova acquisition Unique central venous catheter navigation technology that allows for real-time accurate confirmation of catheter placement Expands existing vascular access product offerings Expected to be accretive to revenue and earnings by year-end 2011 CEO leadership change Extensive leadership experience in healthcare and medical technology businesses Board member since 2005 Focused on executing "High Five" long-term strategic initiatives Announced pre-payment of remaining 2004 Senior Notes |
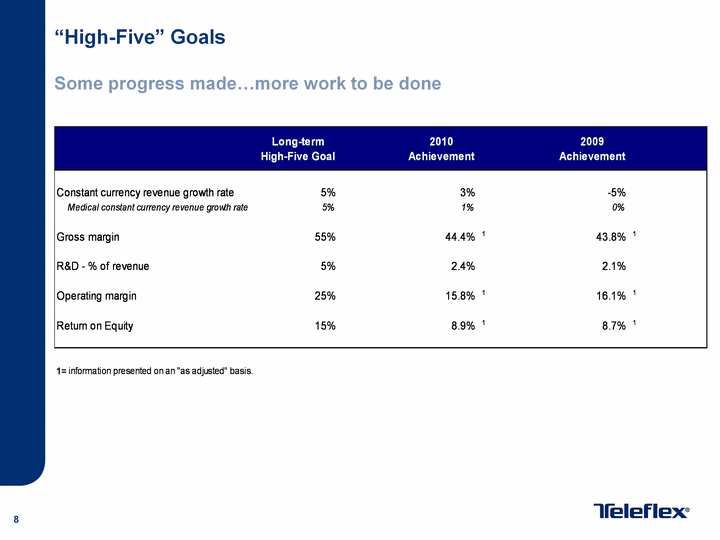
| 8 "High-Five" Goals Some progress made...more work to be done |

| 9 FOURTH QUARTER & FULL YEAR 2010 FINANCIAL REVIEW |
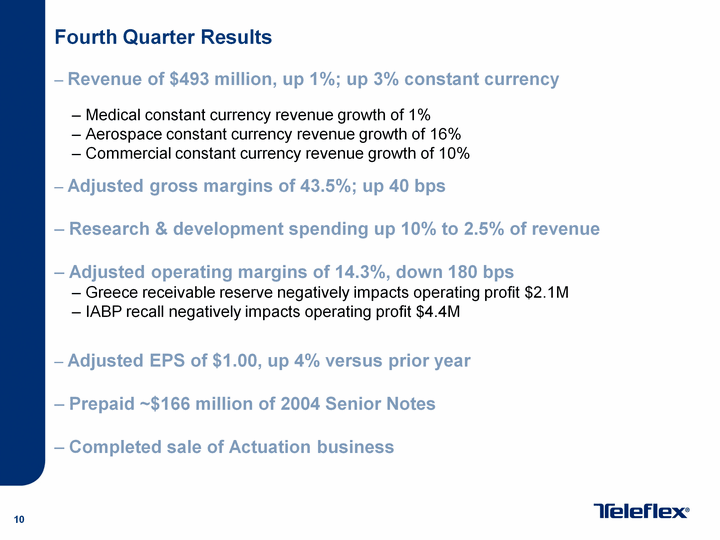
| 10 Fourth Quarter Results Revenue of $493 million, up 1%; up 3% constant currency Medical constant currency revenue growth of 1% Aerospace constant currency revenue growth of 16% Commercial constant currency revenue growth of 10% Adjusted gross margins of 43.5%; up 40 bps Research & development spending up 10% to 2.5% of revenue Adjusted operating margins of 14.3%, down 180 bps Greece receivable reserve negatively impacts operating profit $2.1M IABP recall negatively impacts operating profit $4.4M Adjusted EPS of $1.00, up 4% versus prior year Prepaid ~$166 million of 2004 Senior Notes Completed sale of Actuation business |
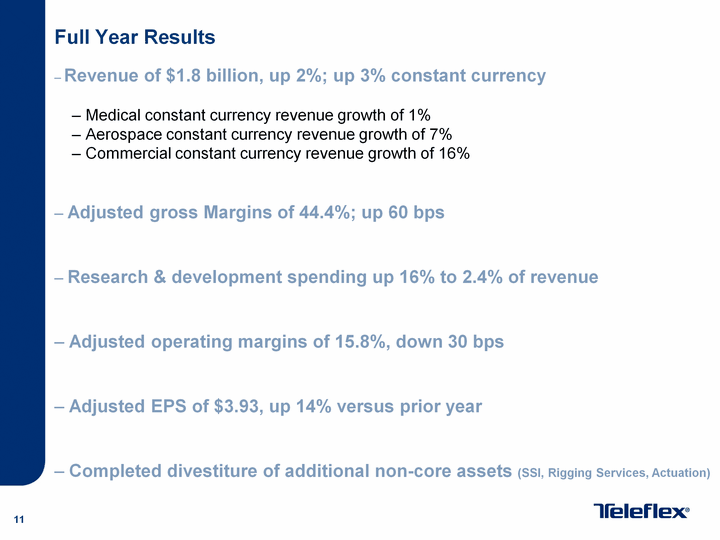
| 11 Full Year Results Revenue of $1.8 billion, up 2%; up 3% constant currency Medical constant currency revenue growth of 1% Aerospace constant currency revenue growth of 7% Commercial constant currency revenue growth of 16% Adjusted gross Margins of 44.4%; up 60 bps Research & development spending up 16% to 2.4% of revenue Adjusted operating margins of 15.8%, down 30 bps Adjusted EPS of $3.93, up 14% versus prior year Completed divestiture of additional non-core assets (SSI, Rigging Services, Actuation) |

| 12 FOURTH QUARTER SEGMENT REVENUE REVIEW |
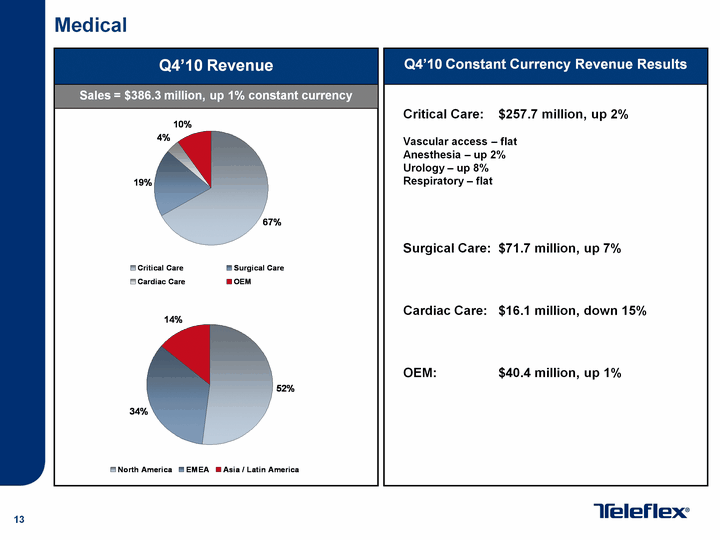
| 13 Medical Critical Care Surgical Care Cardiac Care OEM 0.67 0.19 0.04 0.1 North America EMEA Asia / Latin America 0.52 0.34 0.14 Q4'10 Revenue Sales = $386.3 million, up 1% constant currency Q4'10 Constant Currency Revenue Results Critical Care: $257.7 million, up 2% Vascular access - flat Anesthesia - up 2% Urology - up 8% Respiratory - flat Surgical Care: $71.7 million, up 7% Cardiac Care: $16.1 million, down 15% OEM: $40.4 million, up 1% |

| 14 Non-Core Assets Cargo Systems Cargo Containers 0.72 0.28 Aerospace - Q4'10 Revenue Sales = $59.1 million, up 16% constant currency Narrow-body cargo loading system unit volume up OEM wide-body sales down Improved spare & repair sales Significant improvement in container sales due to improved end-market conditions Q4'10 Constant Currency Revenue Results Commercial - Q4'10 Revenue Sales = $47.7 million, up 10% constant currency Marine 1 Significant increase in higher gross margin aftermarket marine products, as well as sales to OEM manufacturers Sales of modern burner unit to U.S. military down, as expected Q4'10 Constant Currency Revenue Results |

| 15 2011 OUTLOOK |
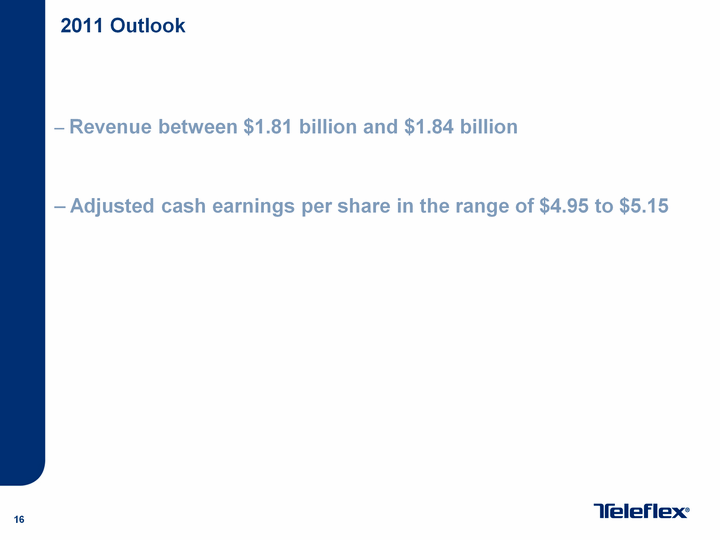
| 16 2011 Outlook Revenue between $1.81 billion and $1.84 billion Adjusted cash earnings per share in the range of $4.95 to $5.15 |

| 17 QUESTION & ANSWER |

| 18 APPENDICES |

| 19 Appendix A - Medical Segment Review |

| 20 Appendix B - Aerospace Segment Review |
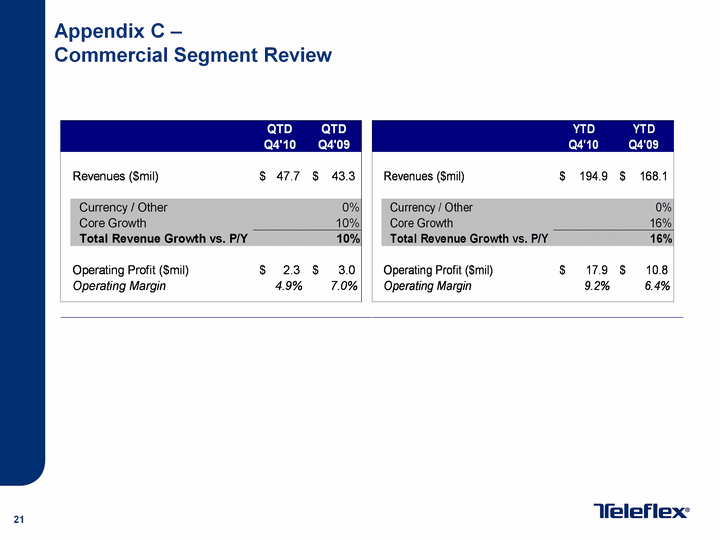
| 21 Appendix C - Commercial Segment Review |
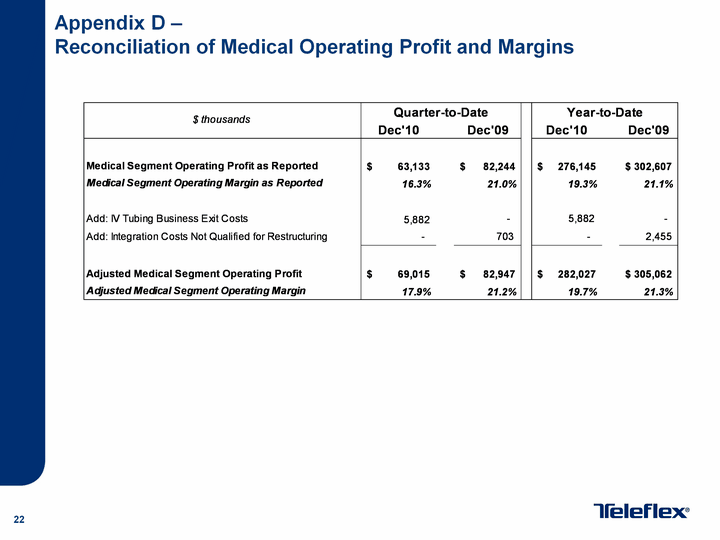
| 22 Appendix D - Reconciliation of Medical Operating Profit and Margins |
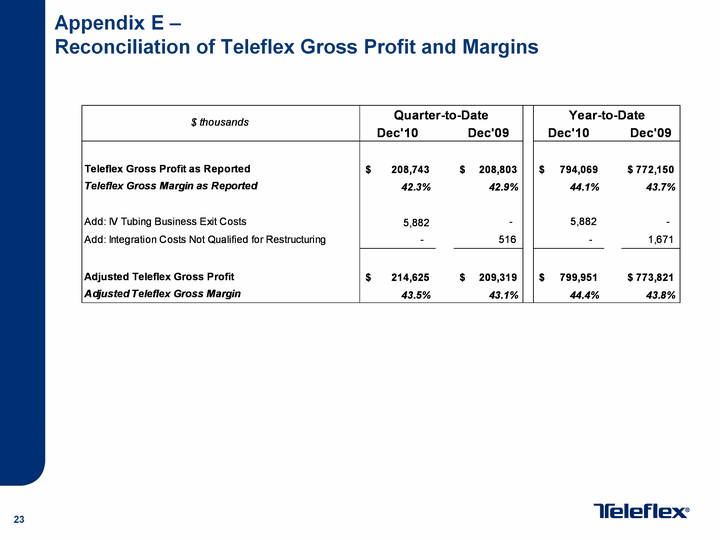
| 23 Appendix E - Reconciliation of Teleflex Gross Profit and Margins |

| 24 Appendix F - Reconciliation of Teleflex Selling, General and Administrative Expenses |
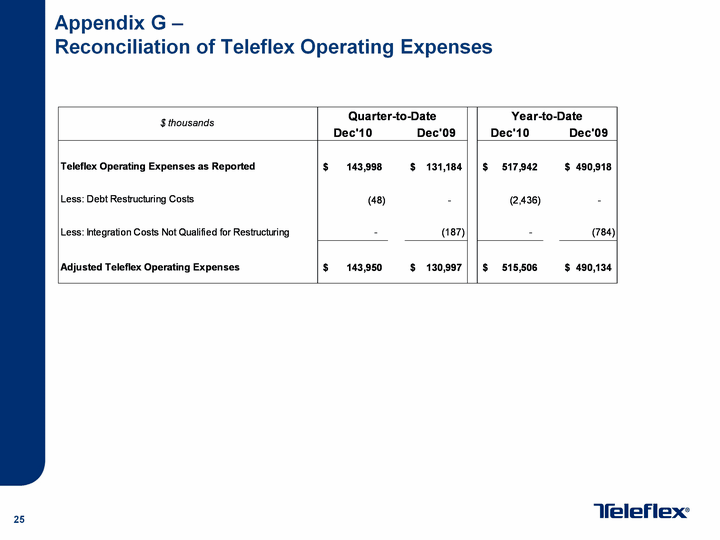
| 25 Appendix G - Reconciliation of Teleflex Operating Expenses |

| 26 Appendix H - Special Charge Income Statement Classification Summary |
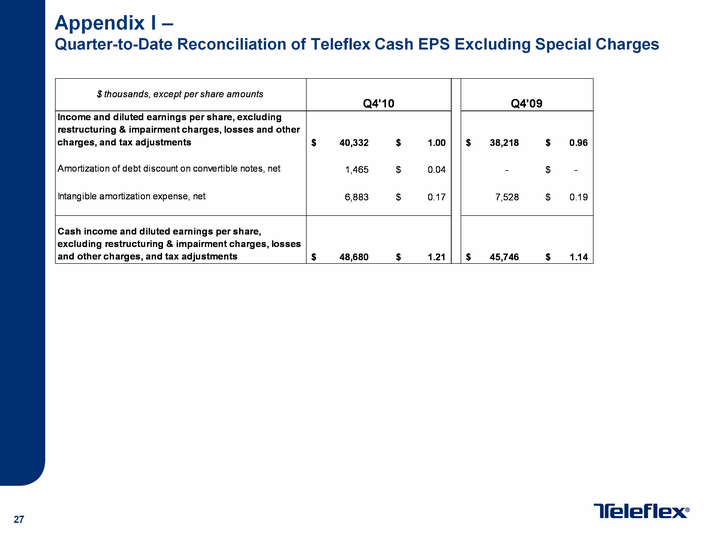
| 27 Appendix I - Quarter-to-Date Reconciliation of Teleflex Cash EPS Excluding Special Charges |

| 28 Appendix J - Year-to-Date Reconciliation of Teleflex Cash EPS Excluding Special Charges |

| 29 Appendix K - Quarter and Year-to-Date Reconciliation of Medical Constant Currency Revenue Growth |
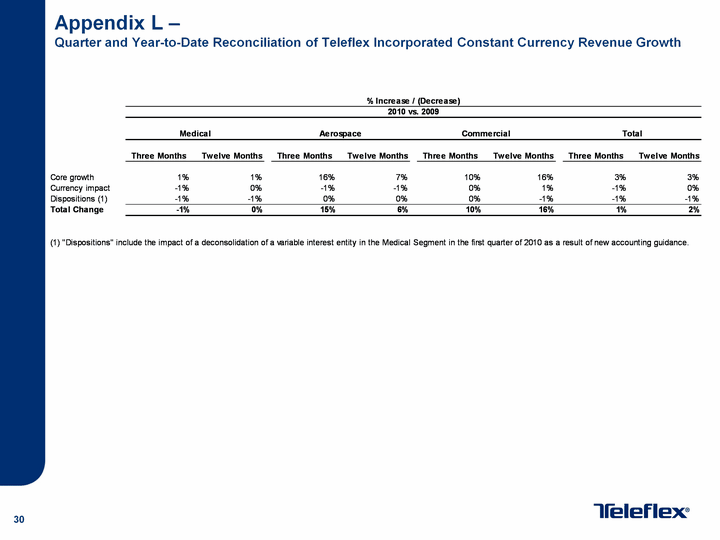
| 30 Appendix L - Quarter and Year-to-Date Reconciliation of Teleflex Incorporated Constant Currency Revenue Growth |
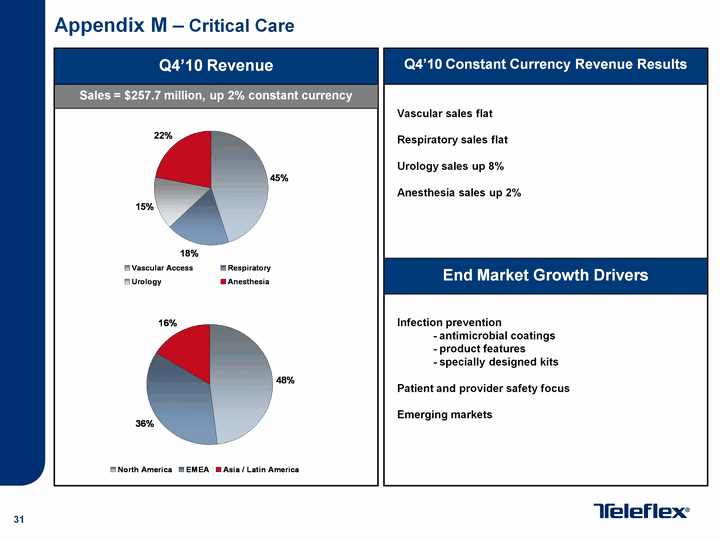
| 31 Appendix M - Critical Care Vascular Access Respiratory Urology Anesthesia 0.45 0.18 0.15 0.22 North America EMEA Asia / Latin America 0.48 0.36 0.16 Q4'10 Revenue Vascular sales flat Respiratory sales flat Urology sales up 8% Anesthesia sales up 2% End Market Growth Drivers Infection prevention - antimicrobial coatings - product features - specially designed kits Patient and provider safety focus Emerging markets Sales = $257.7 million, up 2% constant currency Q4'10 Constant Currency Revenue Results |

| 32 Appendix N - Surgical Care North America EMEA Asia / Latin America 0.5 0.37 0.13 Q4'10 Revenue Increased sales of ligation and closure devices Instrument sales essentially flat versus prior year quarter Minimally invasive surgical techniques Technology / product advances Emerging markets Instruments Ligation Closure/Chest Drainage Other 0.23 0.38 0.25 0.14 End Market Growth Drivers Sales = $71.7 million, up 7% constant currency Q4'10 Constant Currency Revenue Results |

| 33 Appendix O - Cardiac Care North America EMEA Asia / Latin America 0.31 0.48 0.21 Q4'10 Revenue Voluntary recall of 5800 Series Intra-Aortic Balloon Catheters negatively impacted sales in Q4'10 Emerging markets Technology innovation Aging population Pumps Catheters 0.3 0.7 End Market Growth Drivers Sales = $16.1 million, down 15% constant currency Q4'10 Constant Currency Revenue Results |
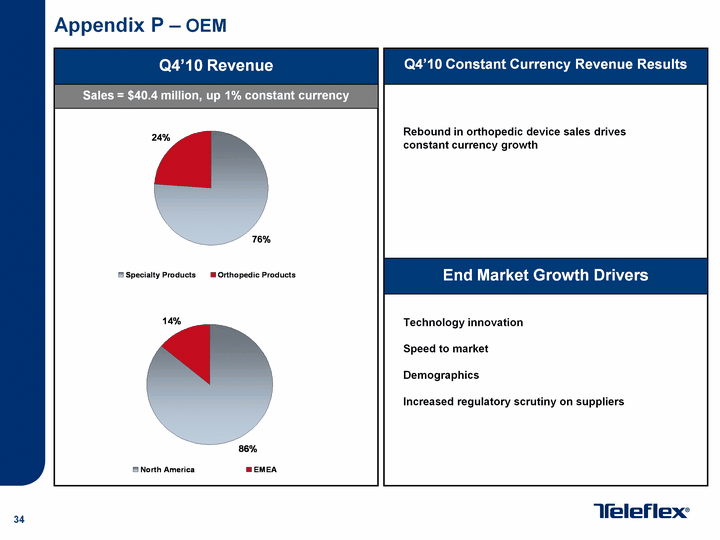
| 34 Appendix P - OEM Q4'10 Revenue Rebound in orthopedic device sales drives constant currency growth Technology innovation Speed to market Demographics Increased regulatory scrutiny on suppliers Specialty Products Orthopedic Products 0.76 0.24 North America EMEA 0.86 0.14 End Market Growth Drivers Sales = $40.4 million, up 1% constant currency Q4'10 Constant Currency Revenue Results |
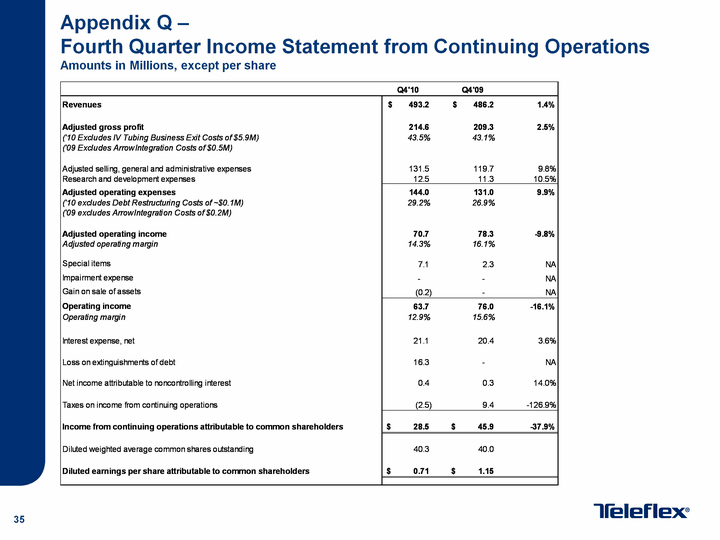
| 35 Appendix Q - Fourth Quarter Income Statement from Continuing Operations Amounts in Millions, except per share |
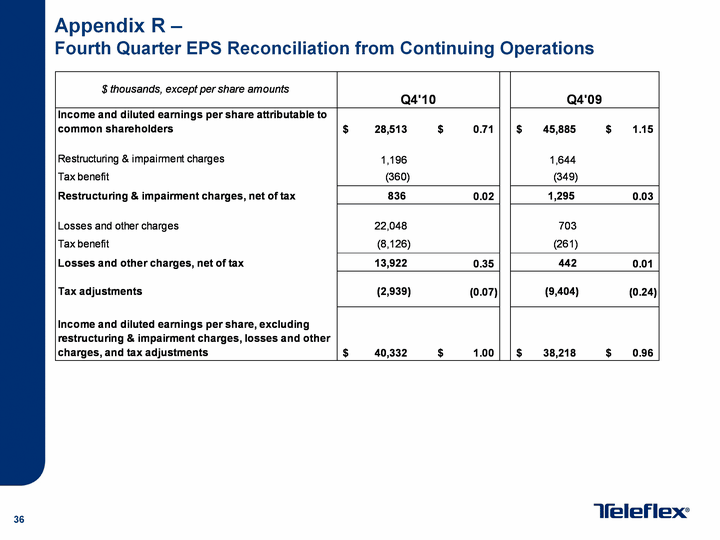
| 36 Appendix R - Fourth Quarter EPS Reconciliation from Continuing Operations |

| 37 Appendix S - Year-to-Date Income Statement from Continuing Operations Amounts in Millions, except per share |

| 38 Appendix T - Year-to-Date EPS Reconciliation from Continuing Operations |
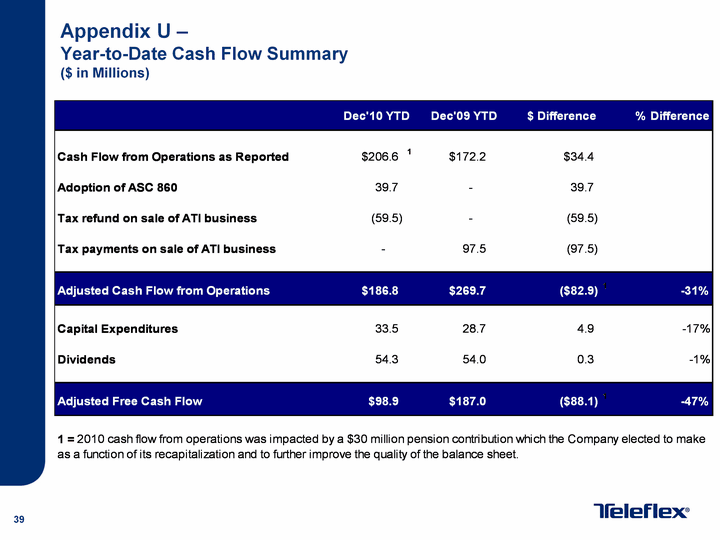
| 39 Appendix U - Year-to-Date Cash Flow Summary ($ in Millions) |

| 40 Appendix V - Reconciliation of Teleflex Incorporated Return on Equity |
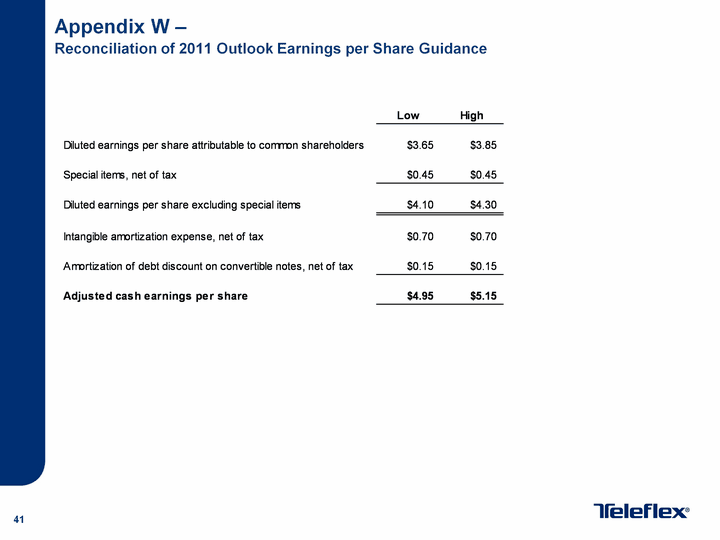
| 41 Appendix W - Reconciliation of 2011 Outlook Earnings per Share Guidance |
