Attached files
| file | filename |
|---|---|
| EX-99.1 - EX-99.1 - LTC PROPERTIES INC | a11-6361_1ex99d1.htm |
| 8-K - 8-K - LTC PROPERTIES INC | a11-6361_18k.htm |
Exhibit 99.2
|
|
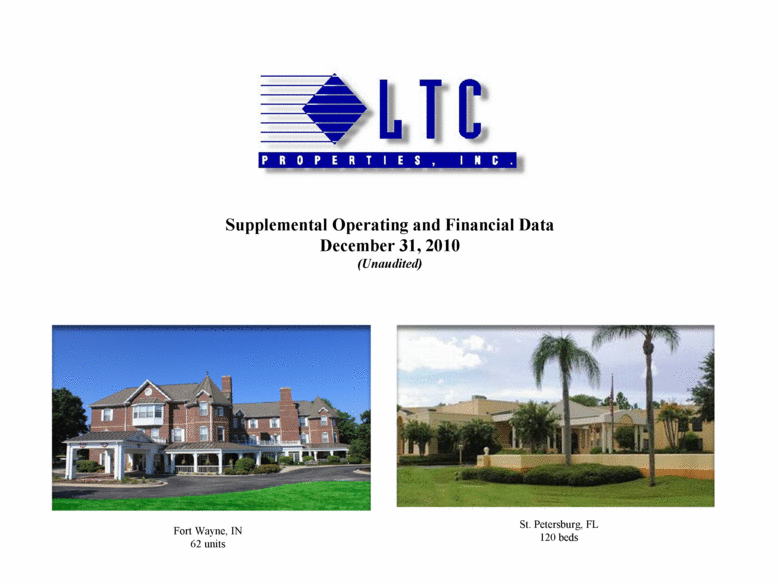
St. Petersburg, FL 120 beds Fort Wayne, IN 62 units Supplemental Operating and Financial Data December 31, 2010 (Unaudited) |
|
|
Table of Contents 2 Founded in 1992, LTC Properties, Inc. is a self-administered real estate investment trust that primarily invests in senior housing and long-term care properties through facility lease transactions, mortgage loans, and other investments. Our primary objectives are to sustain and enhance stockholder equity value and provide current income for distribution to stockholders through real estate investments in long-term care properties and other health care related properties managed by experienced operators. To meet these objectives, we attempt to invest in properties that provide opportunity for additional value and current returns to our stockholders and diversify our investment portfolio by geographic location, operator, and form of investment. For more information on LTC Properties, Inc., visit the Company’s website at www.LTCProperties.com. About LTC Properties, Inc. CORPORATE Company Information 3 Additional Information 4 Forward-Looking Statements 5 Non-GAAP Information 4 Acquisitions 6 Real Estate Portfolio Summary 7 Real Estate Portfolio Diversification 8-9 Top Ten Operators - Owned Portfolio 10 Market Capitalization 11 Lease & Mortgage Loan Receivable Maturity 12 Debt Maturity 13 Financial Data Summary 14-15 Funds from Operations 16 |
|
|
3 Company Information CORPORATE Andre Dimitriadis Wendy Simpson Edmund King Chairman Timothy Triche, MD Boyd Hendrickson Devra Shapiro Lead Director Andre Dimitriadis Wendy Simpson Pam Kessler Executive Chairman Chief Executive Officer and President Executive Vice President and Chief Financial Officer Clint Malin Andy Stokes Peter Lyew Senior Vice President and Chief Investment Officer Senior Vice President, Marketing & Strategic Planning Vice President and Director of Tax Cece Chikhale Mark Hemingway Vice President, Controller and Treasurer Vice President, Investment and Asset Management Corporate Office Investor Relations www.LTCProperties.com 2829 Townsgate Road, Suite 350 Investor.Relations@LTCProperties.com (805) 981-8655 phone Westlake Village, CA 91361 (805) 981-8655 (805) 981-8663 fax Board of Directors Management Contact Information |
|
|
4 CORPORATE Additional Information BMO Capital Markets Hilliard Lyons JMP Securities Richard Anderson John Roberts Peter Martin KeyBanc Capital Markets Stifel, Nicolaus & Company, Incorporated Karin Ford Jerry Doctrow Analyst Coverage Any opinions, estimates, or forecasts regarding LTC's performance made by the analysts listed above do not represent the opinions, estimates, or forecasts of LTC or its management. |
|
|
5 Forward-Looking Statements This supplemental information contains forward-looking statements within the meaning of Section 27A of the Securities Act of 1933, as amended, and Section 21E of the Securities Exchange Act of 1934, as amended, adopted pursuant to the Private Securities Litigation Reform Act of 1995. Statements that are not purely historical may be forward-looking. You can identify some of the forward-looking statements by their use of forward-looking words, such as ‘‘believes,’’ ‘‘expects,’’ ‘‘may,’’ ‘‘will,’’ ‘‘should,’’ ‘‘seeks,’’ ‘‘approximately,’’ ‘‘intends,’’ ‘‘plans,’’ ‘‘estimates’’ or ‘‘anticipates,’’ or the negative of those words or similar words. Forward- looking statements involve inherent risks and uncertainties regarding events, conditions and financial trends that may affect our future plans of operation, business strategy, results of operations and financial position. A number of important factors could cause actual results to differ materially from those included within or contemplated by such forward-looking statements, including, but not limited to, the status of the economy, the status of capital markets (including prevailing interest rates), and our access to capital; the income and returns available from investments in health care related real estate, the ability of our borrowers and lessees to meet their obligations to us, our reliance on a few major operators; competition faced by our borrowers and lessees within the health care industry, regulation of the health care industry by federal, state and local governments, (including as a result of the Patient Protection and Affordable Care Act of 2010 and the Health Care and Education Reconciliation Act of 2010), changes in Medicare and Medicaid reimbursement amounts (including due to federal and state budget constraints), compliance with and changes to regulations and payment policies within the health care industry, debt that we may incur and changes in financing terms, our ability to continue to qualify as a real estate investment trust, the relative illiquidity of our real estate investments, potential limitations on our remedies when mortgage loans default, and risks and liabilities in connection with properties owned through limited liability companies and partnerships. For a discussion of these and other factors that could cause actual results to differ from those contemplated in the forward-looking statements, please see the discussion under ‘‘Risk Factors’’ and other information contained in our Annual Report on Form 10-K for the fiscal year ended December 31, 2010 and in our publicly available filings with the Securities and Exchange Commission. We do not undertake any responsibility to update or revise any of these factors or to announce publicly any revisions to forward-looking statements, whether as a result of new information, future events or otherwise. Non-GAAP Information This supplemental information contains certain non-GAAP information including EBITDA, normalized EBITDA, FFO, normalized FFO, normalized interest coverage ratio, and normalized fixed charges coverage ratio. A reconciliation of this non-GAAP information is provided on pages 14-15 of this supplemental information, and additional information is available under the “Non-GAAP Financial Measures” subsection under the “Selected Financial Data” section of our website at www.LTCProperties.com. CORPORATE |
|
|
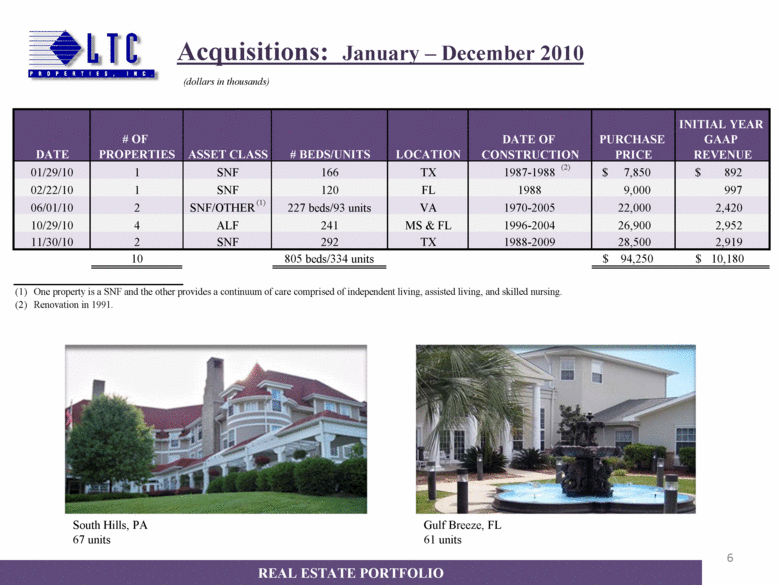
6 Acquisitions: January – December 2010 South Hills, PA 67 units Gulf Breeze, FL 61 units (dollars in thousands) REAL ESTATE PORTFOLIO # OF PROPERTIES ASSET CLASS # BEDS/UNITS LOCATION 1 SNF 166 TX 1987-1988 (2) $ 7,850 $ 892 1 SNF 120 FL 1988 9,000 997 2 SNF/OTHER (1) 227 beds/93 units VA 1970-2005 22,000 2,420 4 ALF 241 MS & FL 1996-2004 26,900 2,952 2 SNF 292 TX 1988-2009 28,500 2,919 10 805 beds/334 units $ 94,250 $ 10,180 (1) (2) INITIAL YEAR GAAP REVENUE One property is a SNF and the other provides a continuum of care comprised of independent living, assisted living, and skilled nursing. Renovation in 1991. DATE DATE OF CONSTRUCTION PURCHASE PRICE 01/29/10 02/22/10 06/01/10 10/29/10 11/30/10 |
|
|
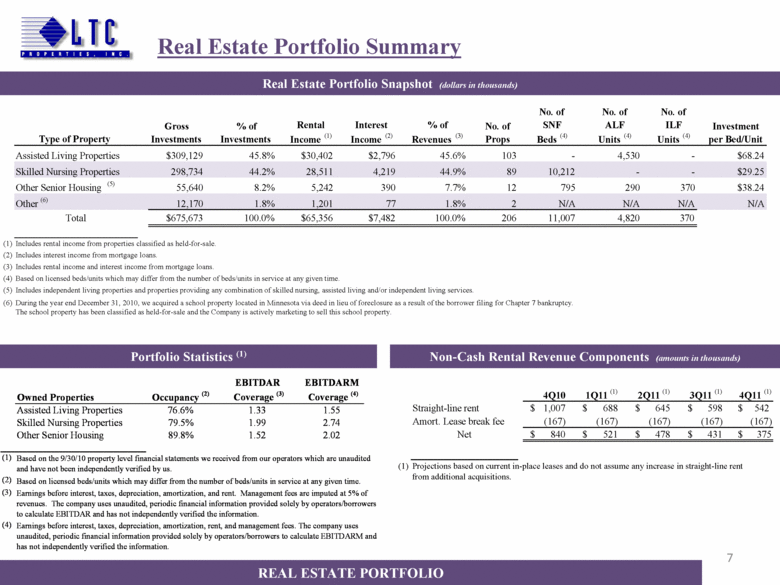
7 Real Estate Portfolio Summary REAL ESTATE PORTFOLIO Real Estate Portfolio Snapshot (dollars in thousands) Portfolio Statistics (1) Non-Cash Rental Revenue Components (amounts in thousands) Owned Properties Occupancy (2) EBITDAR Coverage (3) EBITDARM Coverage (4) Assisted Living Properties 76.6% 1.33 1.55 Skilled Nursing Properties 79.5% 1.99 2.74 Other Senior Housing 89.8% 1.52 2.02 (1) (2) (3) (4) Earnings before interest, taxes, depreciation, amortization, rent, and management fees. The company uses unaudited, periodic financial information provided solely by operators/borrowers to calculate EBITDARM and has not independently verified the information. Earnings before interest, taxes, depreciation, amortization, and rent. Management fees are imputed at 5% of revenues. The company uses unaudited, periodic financial information provided solely by operators/borrowers to calculate EBITDAR and has not independently verified the information. Based on licensed beds/units which may differ from the number of beds/units in service at any given time. Based on the 9/30/10 property level financial statements we received from our operators which are unaudited and have not been independently verified by us. Type of Property Gross Investments % of Investments Rental Income (1) Interest Income (2) % of Revenues (3) No. of Props No. of SNF Beds (4) No. of ALF Units (4) No. of ILF Units (4) Investment per Bed/Unit Assisted Living Properties $309,129 45.8% $30,402 $2,796 45.6% 103 - 4,530 - $68.24 Skilled Nursing Properties 298,734 44.2% 28,511 4,219 44.9% 89 10,212 - - $29.25 Other Senior Housing (5) 55,640 8.2% 5,242 390 7.7% 12 795 290 370 $38.24 Other (6) 12,170 1.8% 1,201 77 1.8% 2 N/A N/A N/A N/A Total $675,673 100.0% $65,356 $7,482 100.0% 206 11,007 4,820 370 (1) (2) (3) (4) (5) (6) Includes rental income from properties classified as held-for-sale. Includes rental income and interest income from mortgage loans. Includes independent living properties and properties providing any combination of skilled nursing, assisted living and/or independent living services. During the year end December 31, 2010, we acquired a school property located in Minnesota via deed in lieu of foreclosure as a result of the borrower filing for Chapter 7 bankruptcy. The school property has been classified as held-for-sale and the Company is actively marketing to sell this school property. Includes interest income from mortgage loans. Based on licensed beds/units which may differ from the number of beds/units in service at any given time. 4Q10 1Q11 (1) 2Q11 (1) 3Q11 (1) 4Q11 (1) Straight-line rent $ 1,007 $ 688 $ 645 $ 598 $ 542 Amort. Lease break fee (167) (167) (167) (167) (167) Net $ 840 $ 521 $ 478 $ 431 $ 375 (1) Projections based on current in-place leases and do not assume any increase in straight-line rent from additional acquisitions. |
|
|
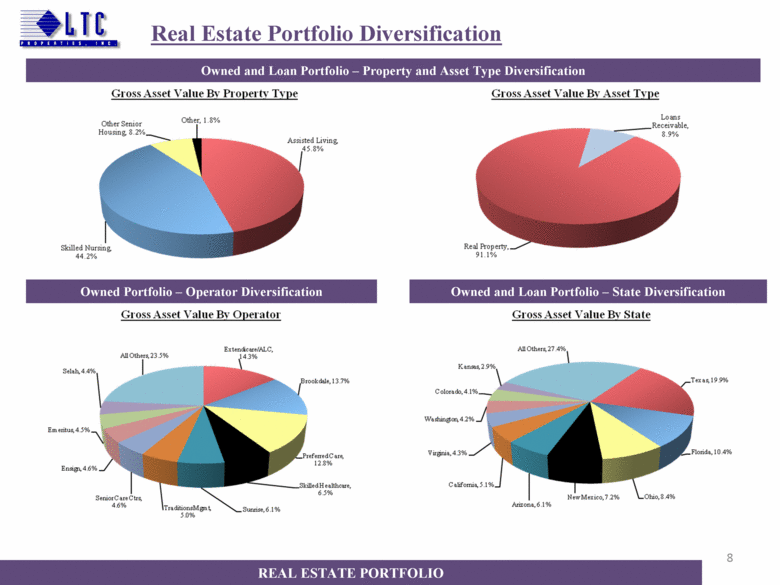
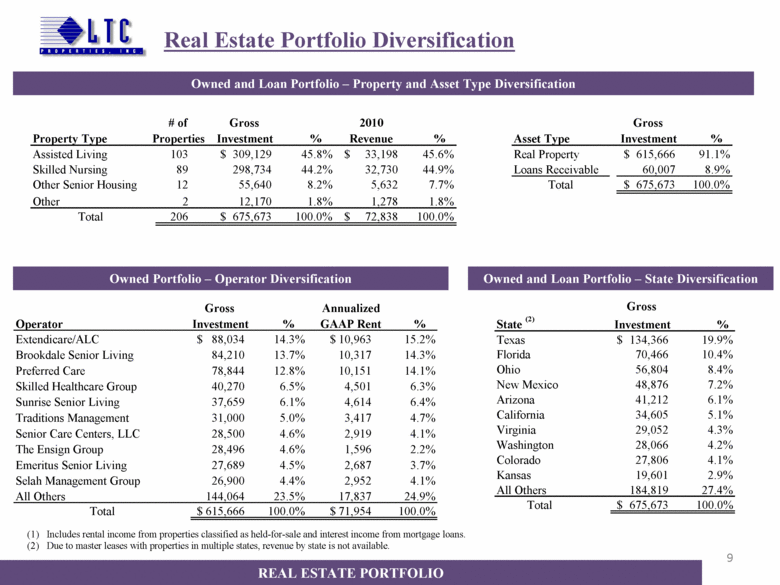
8 Real Estate Portfolio Diversification REAL ESTATE PORTFOLIO Owned and Loan Portfolio – Property and Asset Type Diversification Owned Portfolio – Operator Diversification Owned and Loan Portfolio – State Diversification |
|
|
9 Real Estate Portfolio Diversification Includes rental income from properties classified as held-for-sale and interest income from mortgage loans. Due to master leases with properties in multiple states, revenue by state is not available. REAL ESTATE PORTFOLIO Owned and Loan Portfolio – Property and Asset Type Diversification Owned Portfolio – Operator Diversification Owned and Loan Portfolio – State Diversification Gross State (2) Investment % Texas 134,366 $ 19.9% Florida 70,466 10.4% Ohio 56,804 8.4% New Mexico 48,876 7.2% Arizona 41,212 6.1% California 34,605 5.1% Virginia 29,052 4.3% Washington 28,066 4.2% Colorado 27,806 4.1% Kansas 19,601 2.9% All Others 184,819 27.4% Total 675,673 $ 100.0% Gross Operator Investment % % Extendicare/ALC 88,034 $ 14.3% 10,963 $ 15.2% Brookdale Senior Living 84,210 13.7% 10,317 14.3% Preferred Care 78,844 12.8% 10,151 14.1% Skilled Healthcare Group 40,270 6.5% 4,501 6.3% Sunrise Senior Living 37,659 6.1% 4,614 6.4% Traditions Management 31,000 5.0% 3,417 4.7% Senior Care Centers, LLC 28,500 4.6% 2,919 4.1% The Ensign Group 28,496 4.6% 1,596 2.2% Emeritus Senior Living 27,689 4.5% 2,687 3.7% Selah Management Group 26,900 4.4% 2,952 4.1% All Others 144,064 23.5% 17,837 24.9% Total 615,666 $ 100.0% 71,954 $ 100.0% Annualized GAAP Rent # of Gross 2010 Gross Property Type Properties Investment % Revenue % Asset Type Investment % Assisted Living 103 $ 309,129 45.8% $ 33,198 45.6% Real Property $ 615,666 91.1% Skilled Nursing 89 298,734 44.2% 32,730 44.9% Loans Receivable 60,007 8.9% Other Senior Housing 12 55,640 8.2% 5,632 7.7% Total $ 675,673 100.0% Other 2 12,170 1.8% 1,278 1.8% Total 206 $ 675,673 100.0% $ 72,838 100.0% % |
|
|
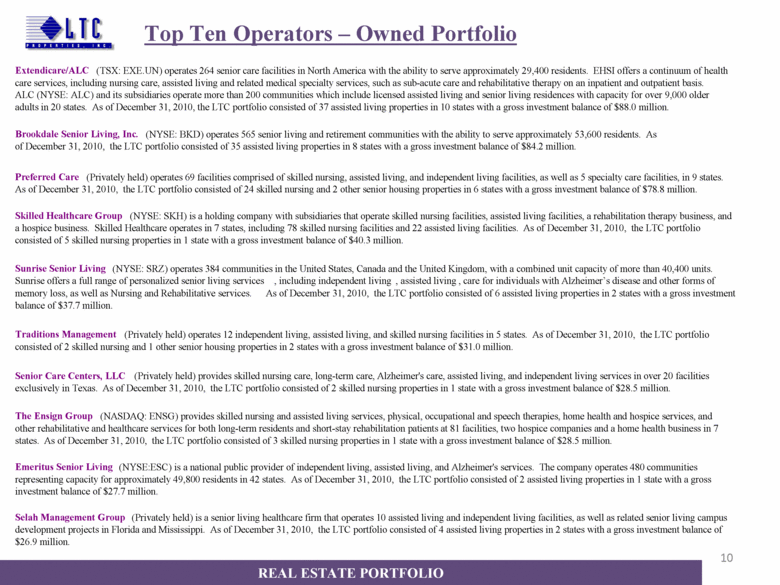
10 Top Ten Operators – Owned Portfolio REAL ESTATE PORTFOLIO Traditions Management (Privately held) operates 12 independent living, assisted living, and skilled nursing facilities in 5 states. As of December 31, 2010, the LTC portfolio consisted of 2 skilled nursing and 1 other senior housing properties in 2 states with a gross investment balance of $31.0 million. Senior Care Centers, LLC (Privately held) provides skilled nursing care, long-term care, Alzheimer's care, assisted living, and independent living services in over 20 facilities exclusively in Texas. As of December 31, 2010, the LTC portfolio consisted of 2 skilled nursing properties in 1 state with a gross investment balance of $28.5 million. The Ensign Group (NASDAQ: ENSG) provides skilled nursing and assisted living services, physical, occupational and speech therapies, home health and hospice services, and other rehabilitative and healthcare services for both long-term residents and short-stay rehabilitation patients at 81 facilities, two hospice companies and a home health business in 7 states. As of December 31, 2010, the LTC portfolio consisted of 3 skilled nursing properties in 1 state with a gross investment balance of $28.5 million. Emeritus Senior Living (NYSE:ESC) is a national public provider of independent living, assisted living, and Alzheimer's services. The company operates 480 communities representing capacity for approximately 49,800 residents in 42 states. As of December 31, 2010, the LTC portfolio consisted of 2 assisted living properties in 1 state with a gross investment balance of $27.7 million. Selah Management Group (Privately held) is a senior living healthcare firm that operates 10 assisted living and independent living facilities, as well as related senior living campus development projects in Florida and Mississippi. As of December 31, 2010, the LTC portfolio consisted of 4 assisted living properties in 2 states with a gross investment balance of $26.9 million. Extendicare/ALC (TSX: EXE.UN) operates 264 senior care facilities in North America with the ability to serve approximately 29,400 residents. EHSI offers a continuum of health care services, including nursing care, assisted living and related medical specialty services, such as sub-acute care and rehabilitative therapy on an inpatient and outpatient basis. ALC (NYSE: ALC) and its subsidiaries operate more than 200 communities which include licensed assisted living and senior living residences with capacity for over 9,000 older adults in 20 states. As of December 31, 2010, the LTC portfolio consisted of 37 assisted living properties in 10 states with a gross investment balance of $88.0 million. Brookdale Senior Living, Inc. (NYSE: BKD) operates 565 senior living and retirement communities with the ability to serve approximately 53,600 residents. As of December 31, 2010, the LTC portfolio consisted of 35 assisted living properties in 8 states with a gross investment balance of $84.2 million. Preferred Care (Privately held) operates 69 facilities comprised of skilled nursing, assisted living, and independent living facilities, as well as 5 specialty care facilities, in 9 states. As of December 31, 2010, the LTC portfolio consisted of 24 skilled nursing and 2 other senior housing properties in 6 states with a gross investment balance of $78.8 million. Skilled Healthcare Group (NYSE: SKH) is a holding company with subsidiaries that operate skilled nursing facilities, assisted living facilities, a rehabilitation therapy business, and a hospice business. Skilled Healthcare operates in 7 states, including 78 skilled nursing facilities and 22 assisted living facilities. As of December 31, 2010, the LTC portfolio consisted of 5 skilled nursing properties in 1 state with a gross investment balance of $40.3 million. Sunrise Senior Living (NYSE: SRZ) operates 384 communities in the United States, Canada and the United Kingdom, with a combined unit capacity of more than 40,400 units. Sunrise offers a full range of personalized senior living services , including independent living , assisted living , care for individuals with Alzheimer’s disease and other forms of memory loss, as well as Nursing and Rehabilitative services. As of December 31, 2010, the LTC portfolio consisted of 6 assisted living properties in 2 states with a gross investment balance of $37.7 million. |
|
|
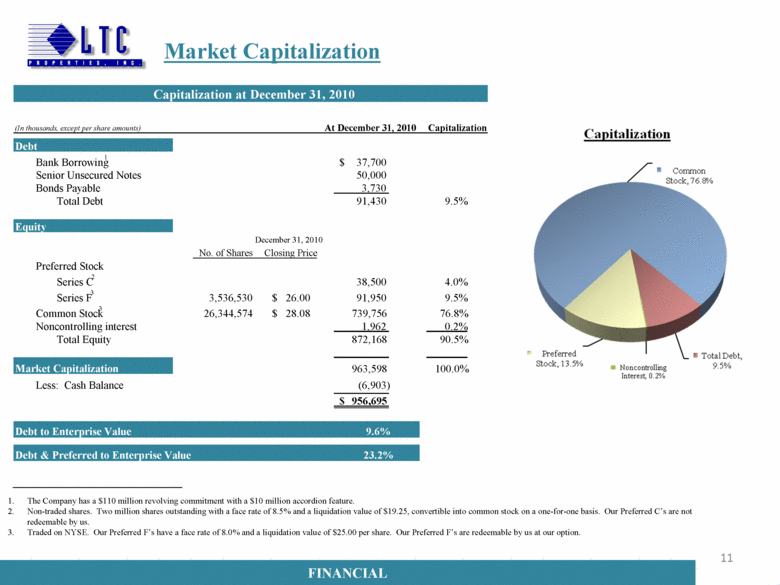
11 Market Capitalization The Company has a $110 million revolving commitment with a $10 million accordion feature. Non-traded shares. Two million shares outstanding with a face rate of 8.5% and a liquidation value of $19.25, convertible into common stock on a one-for-one basis. Our Preferred C’s are not redeemable by us. Traded on NYSE. Our Preferred F’s have a face rate of 8.0% and a liquidation value of $25.00 per share. Our Preferred F’s are redeemable by us at our option. FINANCIAL (In thousands, except per share amounts) Capitalization Bank Borrowing 1 37,700 $ Senior Unsecured Notes 50,000 Bonds Payable 3,730 Total Debt 91,430 9.5% December 31, 2010 No. of Shares Preferred Stock Series C 2 38,500 4.0% Series F 3 3,536,530 26.00 $ 91,950 9.5% Common Stock 3 26,344,574 28.08 $ 739,756 76.8% Noncontrolling interest 1,962 0.2% Total Equity 872,168 90.5% 963,598 100.0% Less: Cash Balance (6,903) Enterprise Value 956,695 $ Debt to Enterprise Value Debt & Preferred to Enterprise Value Capitalization at December 31, 2010 At December 31, 2010 Closing Price 9.6% 23.2% Market Capitalization Equity Debt |
|
|
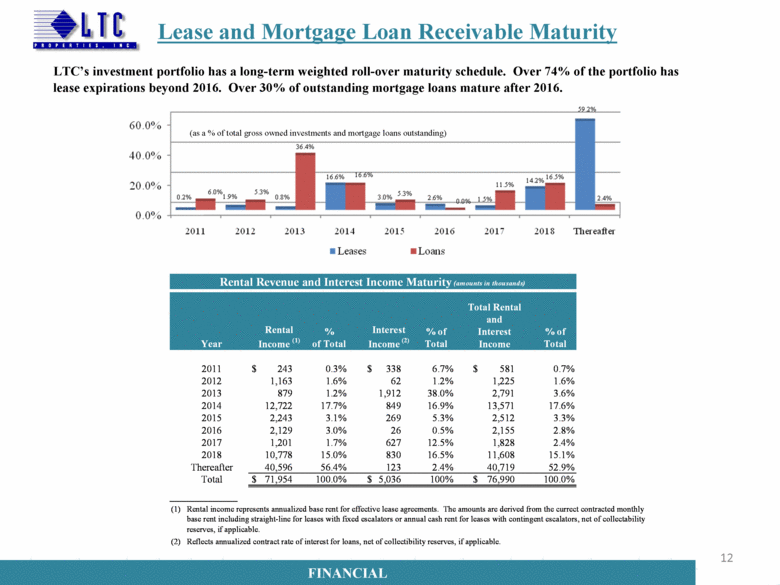
12 Lease and Mortgage Loan Receivable Maturity LTC’s investment portfolio has a long-term weighted roll-over maturity schedule. Over 74% of the portfolio has lease expirations beyond 2016. Over 30% of outstanding mortgage loans mature after 2016. (as a % of total gross owned investments and mortgage loans outstanding) FINANCIAL Year % of Total % of Total % of Total 2011 $ 243 0.3% $ 338 6.7% $ 581 0.7% 2012 1,163 1.6% 62 1.2% 1,225 1.6% 2013 879 1.2% 1,912 38.0% 2,791 3.6% 2014 12,722 17.7% 849 16.9% 13,571 17.6% 2015 2,243 3.1% 269 5.3% 2,512 3.3% 2016 2,129 3.0% 26 0.5% 2,155 2.8% 2017 1,201 1.7% 627 12.5% 1,828 2.4% 2018 10,778 15.0% 830 16.5% 11,608 15.1% Thereafter 40,596 56.4% 123 2.4% 40,719 52.9% Total $ 71,954 100.0% $ 5,036 100% $ 76,990 100.0% (1) (2) Reflects annualized contract rate of interest for loans, net of collectibility reserves, if applicable. Rental Revenue and Interest Income Maturity (amounts in thousands) Total Rental and Interest Income Rental income represents annualized base rent for effective lease agreements. The amounts are derived from the currect contracted monthly base rent including straight-line for leases with fixed escalators or annual cash rent for leases with contingent escalators, net of collectability reserves, if applicable. Rental Income (1) Interest Income (2) |
|
|
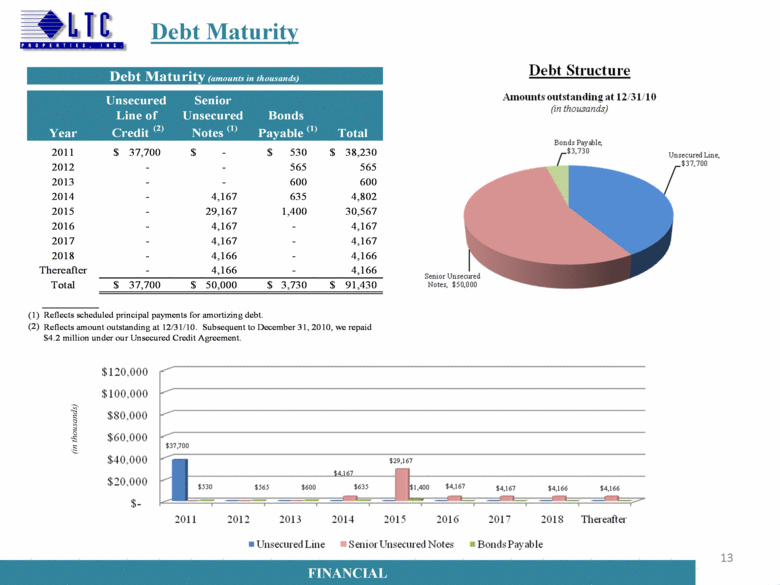
13 Debt Maturity (in thousands) FINANCIAL $ 37,700 $ - $ 530 $ 38,230 - - 565 565 - - 600 600 - 4,167 635 4,802 - 29,167 1,400 30,567 - 4,167 - 4,167 - 4,167 - 4,167 - 4,166 - 4,166 - 4,166 - 4,166 $ 37,700 $ 50,000 $ 3,730 $ 91,430 (1) (2) 2018 2012 2013 2014 Thereafter Total Debt Maturity (amounts in thousands) Year 2011 Reflects amount outstanding at 12/31/10. Subsequent to December 31, 2010, we repaid $4.2 million under our Unsecured Credit Agreement. Reflects scheduled principal payments for amortizing debt. Unsecured Line of Credit (2) Senior Unsecured Notes (1) Bonds Payable (1) Total 2015 2016 2017 |
|
|
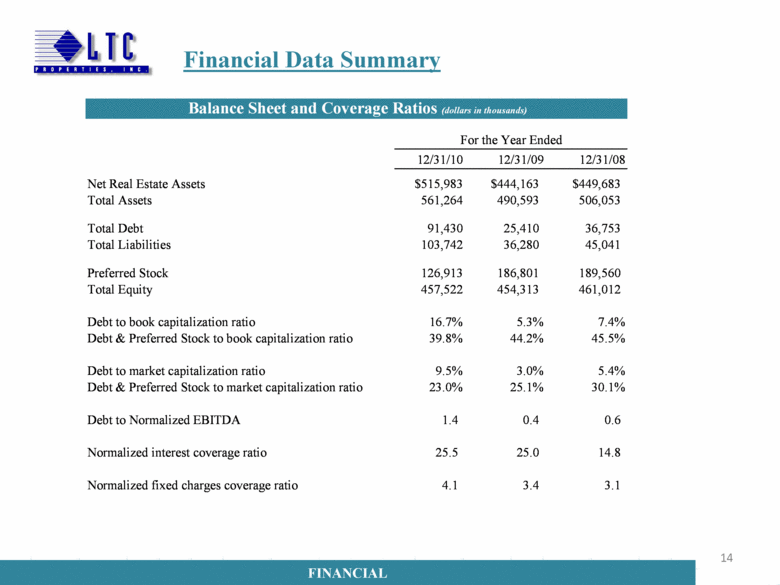
14 Financial Data Summary FINANCIAL 12/31/10 12/31/09 12/31/08 Net Real Estate Assets $515,983 $444,163 $449,683 Total Assets 561,264 490,593 506,053 Total Debt 91,430 25,410 36,753 Total Liabilities 103,742 36,280 45,041 Preferred Stock 126,913 186,801 189,560 Total Equity 457,522 454,313 461,012 Debt to book capitalization ratio 16.7% 5.3% 7.4% Debt & Preferred Stock to book capitalization ratio 39.8% 44.2% 45.5% Debt to market capitalization ratio 9.5% 3.0% 5.4% Debt & Preferred Stock to market capitalization ratio 23.0% 25.1% 30.1% Debt to Normalized EBITDA 1.4 0.4 0.6 Normalized interest coverage ratio 25.5 25.0 14.8 Normalized fixed charges coverage ratio 4.1 3.4 3.1 Balance Sheet and Coverage Ratios (dollars in thousands) For the Year Ended |
|
|
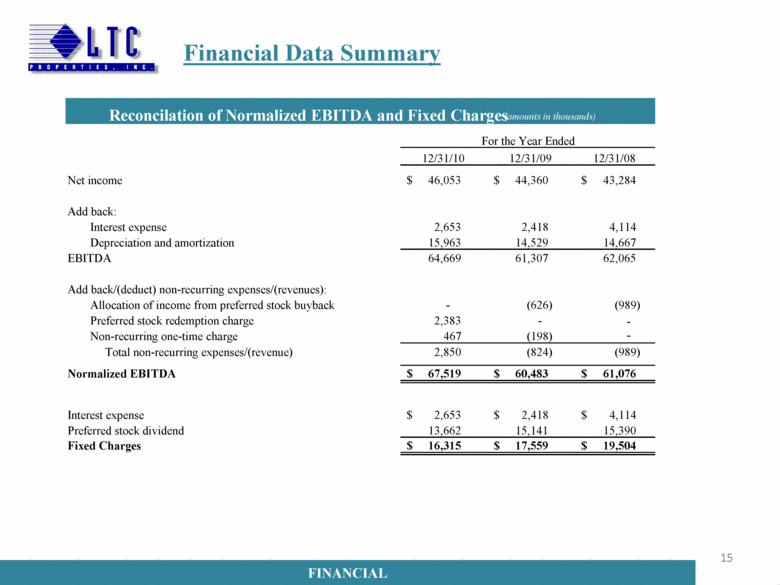
15 Financial Data Summary FINANCIAL Net income $ 46,053 $ 44,360 $ 43,284 Add back: Interest expense 2,653 2,418 4,114 Depreciation and amortization 15,963 14,529 14,667 EBITDA 64,669 61,307 62,065 Add back/(deduct) non-recurring expenses/(revenues): Allocation of income from preferred stock buyback - (626) (989) Preferred stock redemption charge 2,383 - - Non-recurring one-time charge 467 (198) - Total non-recurring expenses/(revenue) 2,850 (824) (989) Normalized EBITDA $ 67,519 $ 60,483 $ 61,076 Interest expense $ 2,653 $ 2,418 $ 4,114 Preferred stock dividend 13,662 15,141 15,390 Fixed Charges $ 16,315 $ 17,559 $ 19,504 For the Year Ended Reconcilation of Normalized EBITDA and Fixed Charges (amounts in thousands) 12/31/10 12/31/09 12/31/08 |
|
|
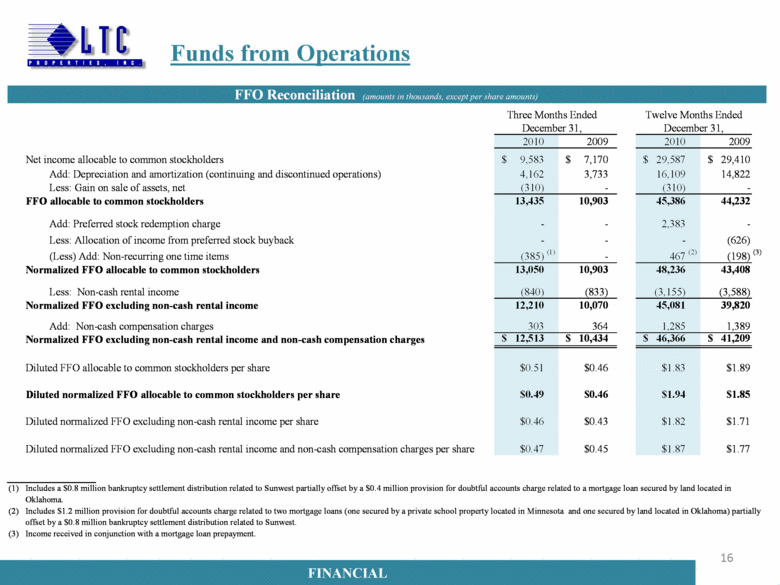
Funds from Operations 16 FINANCIAL FINANCIAL 2010 2009 2010 2009 Net income allocable to common stockholders $ 9,583 $ 7,170 $ 29,587 $ 29,410 Add: Depreciation and amortization (continuing and discontinued operations) 4,162 3,733 16,109 14,822 Less: Gain on sale of assets, net (310) - (310) - FFO allocable to common stockholders 13,435 10,903 45,386 44,232 Add: Preferred stock redemption charge - - 2,383 - Less: Allocation of income from preferred stock buyback - - - (626) (Less) Add: Non-recurring one time items (385) (1) - 467 (2) (198) (3) Normalized FFO allocable to common stockholders 13,050 10,903 48,236 43,408 Less: Non-cash rental income (840) (833) (3,155) (3,588) Normalized FFO excluding non-cash rental income 12,210 10,070 45,081 39,820 Add: Non-cash compensation charges 303 364 1,285 1,389 Normalized FFO excluding non-cash rental income and non-cash compensation charges $ 12,513 $ 10,434 $ 46,366 $ 41,209 $0.51 $0.46 $1.83 $1.89 $0.49 $0.46 $1.94 $1.85 $0.46 $0.43 $1.82 $1.71 $0.47 $0.45 $1.87 $1.77 (1) (2) (3) December 31, Includes a $0.8 million bankruptcy settlement distribution related to Sunwest partially offset by a $0.4 million provision for doubtful accounts charge related to a mortgage loan secured by land located in Oklahoma. Includes $1.2 million provision for doubtful accounts charge related to two mortgage loans (one secured by a private school property located in Minnesota and one secured by land located in Oklahoma) partially offset by a $0.8 million bankruptcy settlement distribution related to Sunwest. Income received in conjunction with a mortgage loan prepayment. Three Months Ended FFO Reconciliation (amounts in thousands, except per share amounts) Twelve Months Ended December 31, Diluted normalized FFO allocable to common stockholders per share Diluted normalized FFO excluding non-cash rental income per share Diluted normalized FFO excluding non-cash rental income and non-cash compensation charges per share Diluted FFO allocable to common stockholders per share |

