Attached files
| file | filename |
|---|---|
| 8-K - FORM 8-K - ABERCROMBIE & FITCH CO /DE/ | c12834e8vk.htm |
| EX-99.1 - EXHIBIT 99.1 - ABERCROMBIE & FITCH CO /DE/ | c12834exv99w1.htm |
| EX-99.2 - EXHIBIT 99.2 - ABERCROMBIE & FITCH CO /DE/ | c12834exv99w2.htm |
| EX-99.4 - EXHIBIT 99.4 - ABERCROMBIE & FITCH CO /DE/ | c12834exv99w4.htm |
Exhibit 99.3

| Investor Presentation 2010 Fourth Quarter |
| SAFE HARBOR STATEMENT UNDER THE PRIVATE SECURITIES LITIGATION REFORM ACT OF 1995 A&F cautions that any forward-looking statements (as such term is defined in the Private Securities Litigation Reform Act of 1995) contained in this presentation or made by management of A&F involve risks and uncertainties and are subject to change based on various important factors, many of which may be beyond the Company’s control. Words such as “estimate,” “project,” “plan,” “believe,” “expect,” “anticipate,” “intend,” and similar expressions may identify forward-looking statements. The factors included in the disclosure under the heading “FORWARD-LOOKING STATEMENTS AND RISK FACTORS” in “ITEM 1A. RISK FACTORS” of A&F’s Annual Report on Form 10-K for the fiscal year ended January 30, 2010, and Quarterly Reports on Form 10-Q for the fiscal quarters ended May 1, July 31 and October 30, 2010, in some cases have affected and in the future could affect the Company’s financial performance and could cause actual results for the 2011 fiscal year and beyond to differ materially from those expressed or implied in any of the forward-looking statements included in this presentation or otherwise made by management. OTHER INFORMATION All dollar amounts are in 000’s unless otherwise stated. Sub-totals and totals may not foot due to rounding. After-tax operating results of Ruehl for 2009 and prior periods are included in discontinued operations. |
2
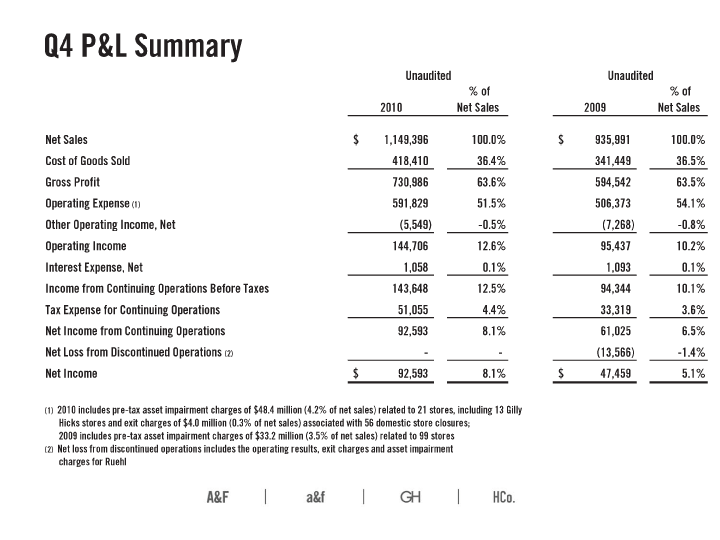
| Q4 P&L Summary Unaudited Unaudited % of % of 2010 Net Sales 2009 Net Sales Net Sales $ 1,149,396 100.0% $ 935,991 100.0% Cost of Goods Sold 418,410 36.4% 341,449 36.5% Gross Profit 730,986 63.6% 594,542 63.5% Operating Expense (1) 591,829 51.5% 506,373 54.1% Other Operating Income, Net (5,549) -0.5% (7,268) -0.8% Operating Income 144,706 12.6% 95,437 10.2% Interest Expense, Net 1,058 0.1% 1,093 0.1% Income from Continuing Operations Before Taxes 143,648 12.5% 94,344 10.1% Tax Expense for Continuing Operations 51,055 4.4% 33,319 3.6% Net Income from Continuing Operations 92,593 8.1% 61,025 6.5% Net Loss from Discontinued Operations (2) — - (13,566) -1.4% Net Income $ 92,593 8.1% $ 47,459 5.1% (1) 2010 includes pre-tax asset impairment charges of $48.4 million (4.2% of net sales) related to 21 stores, including 13 Gilly Hicks stores and exit charges of $4.0 million (0.3% of net sales) associated with 56 domestic store closures; 2009 includes pre-tax asset impairment charges of $33.2 million (3.5% of net sales) related to 99 stores (2) Net loss from discontinued operations includes the operating results, exit charges and asset impairment charges for Ruehl |
3
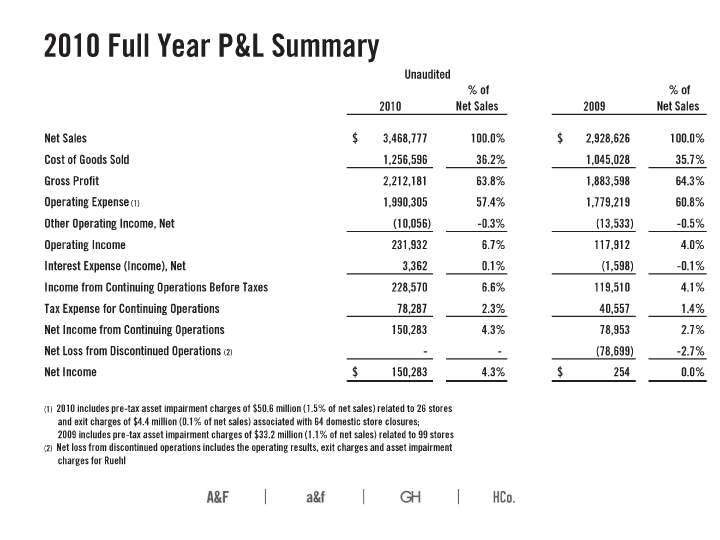
| 2010 Full Year P&L Summary Unaudited % of % of 2010 Net Sales 2009 Net Sales Net Sales $ 3,468,777 100.0% $ 2,928,626 100.0% Cost of Goods Sold 1,256,596 36.2% 1,045,028 35.7% Gross Profit 2,212,181 63.8% 1,883,598 64.3% Operating Expense (1) 1,990,305 57.4% 1,779,219 60.8% Other Operating Income, Net (10,056) -0.3% (13,533) -0.5% Operating Income 231,932 6.7% 117,912 4.0% Interest Expense (Income), Net 3,362 0.1% (1,598) -0.1% Income from Continuing Operations Before Taxes 228,570 6.6% 119,510 4.1% Tax Expense for Continuing Operations 78,287 2.3% 40,557 1.4% Net Income from Continuing Operations 150,283 4.3% 78,953 2.7% Net Loss from Discontinued Operations (2) — - (78,699) -2.7% Net Income $ 150,283 4.3% $ 254 0.0% |
| (1) 2010 includes pre-tax asset impairment charges of $50.6 million (1.5% of net sales) related to 26 stores and exit charges of $4.4 million (0.1% of net sales) associated with 64 domestic store closures; 2009 includes pre-tax asset impairment charges of $33.2 million (1.1% of net sales) related to 99 stores (2) Net loss from discontinued operations includes the operating results, exit charges and asset impairment charges for Ruehl |
4
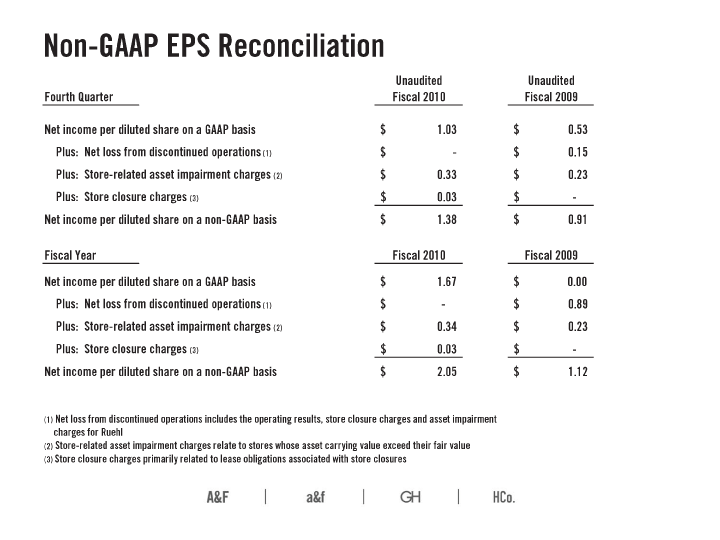
| Non-GAAP EPS Reconciliation Unaudited Unaudited Fourth Quarter Fiscal 2010 Fiscal 2009 Net income per diluted share on a GAAP basis $ 1.03 $ 0.53 Plus: Net loss from discontinued operations (1) $ — $ 0.15 Plus: Store-related asset impairment charges (2) $ 0.33 $ 0.23 Plus: Store closure charges (3) $ 0.03 $ -Net income per diluted share on a non-GAAP basis $ 1.38 $ 0.91 Fiscal Year Fiscal 2010 Fiscal 2009 Net income per diluted share on a GAAP basis $ 1.67 $ 0.00 Plus: Net loss from discontinued operations (1) $ — $ 0.89 Plus: Store-related asset impairment charges (2) $ 0.34 $ 0.23 Plus: Store closure charges (3) $ 0.03 $ -Net income per diluted share on a non-GAAP basis $ 2.05 $ 1.12 (1) Net loss from discontinued operations includes the operating results, store closure charges and asset impairment charges for Ruehl (2) Store-related asset impairment charges relate to stores whose asset carrying value exceed their fair value (3) Store closure charges primarily related to lease obligations associated with store closures |
5
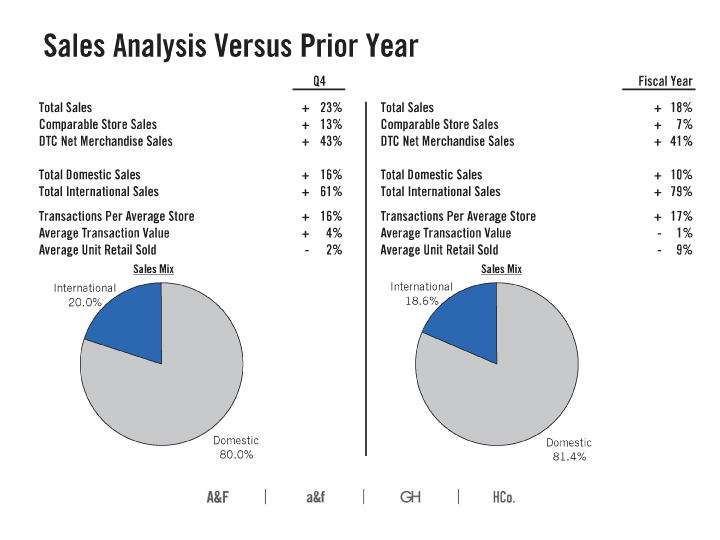
| Sales Analysis Versus Prior Year Q4 Fiscal Year Total Sales + 23% Total Sales + 18% Comparable Store Sales + 13% Comparable Store Sales + 7% DTC Net Merchandise Sales + 43% DTC Net Merchandise Sales + 41% Total Domestic Sales + 16% Total Domestic Sales + 10% Total International Sales + 61% Total International Sales + 79% Transactions Per Average Store + 16% Transactions Per Average Store + 17% Average Transaction Value + 4% Average Transaction Value — 1% Average Unit Retail Sold — 2% Average Unit Retail Sold — 9% Sales Mix Sales Mix International International 20.0% 18.6% Domestic Domestic 80.0% 81.4% |
6
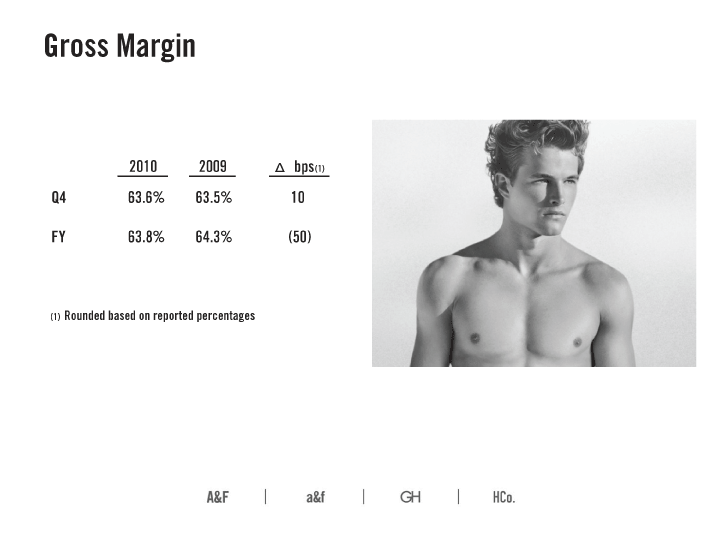
| Gross Margin 2010 2009 Ģ bps(1) Q4 63.6% 63.5% 10 FY 63.8% 64.3% (50) (1) Rounded based on reported percentages |
7
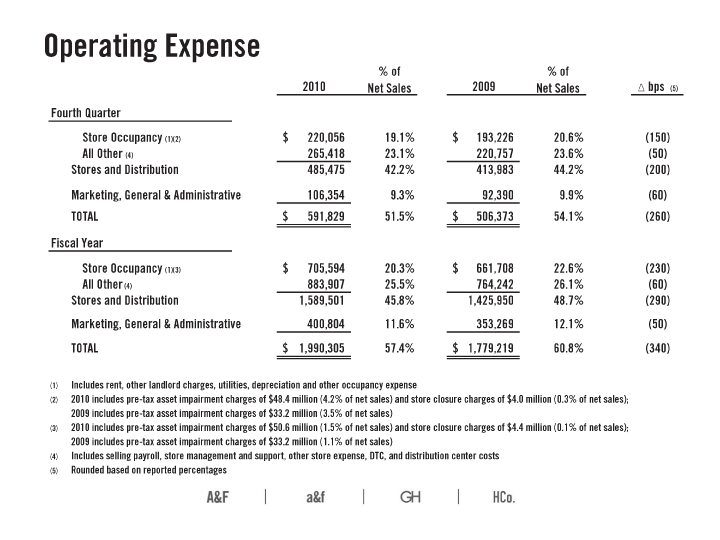
| Operating Expense % of % of 2010 Net Sales 2009 Net Sales Ģ bps (5) Fourth Quarter 1149396 935991 Store Occupancy (1)(2) $ 220,056 19.1% $ 193,226 20.6% (150) All Other (4) 265,418 23.1% 220,757 23.6% (50) Stores and Distribution 485,475 42.2% 413,983 44.2% (200) Marketing, General & Administrative 106,354 9.3% 92,390 9.9% (60) TOTAL $ 591,829 51.5% $ 506,373 54.1% (260) Fiscal Year 3,468,777 2,928,626 Store Occupancy (1)(3) $ 705,594 20.3% $ 661,708 22.6% (230) All Other (4) 883,907 25.5% 764,242 26.1% (60) Stores and Distribution 1,589,501 45.8% 1,425,950 48.7% (290) Marketing, General & Administrative 400,804 11.6% 353,269 12.1% (50) TOTAL $ 1,990,305 57.4% $ 1,779,219 60.8% (340) (1) Includes rent, other landlord charges, utilities, depreciation and other occupancy expense (2) 2010 includes pre-tax asset impairment charges of $48.4 million (4.2% of net sales) and store closure charges of $4.0 million (0.3% of net sales); 2009 includes pre-tax asset impairment charges of $33.2 million (3.5% of net sales) (3) 2010 includes pre-tax asset impairment charges of $50.6 million (1.5% of net sales) and store closure charges of $4.4 million (0.1% of net sales); 2009 includes pre-tax asset impairment charges of $33.2 million (1.1% of net sales) (4) Includes selling payroll, store management and support, other store expense, DTC, and distribution center costs (5) Rounded based on reported percentages |
8
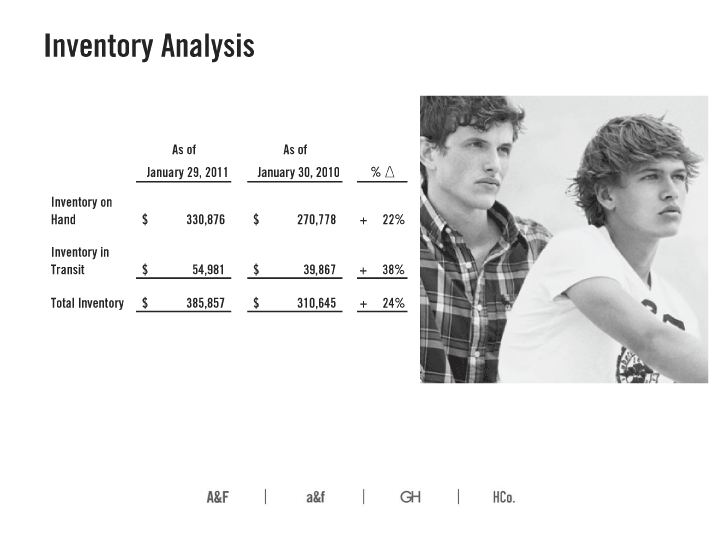
| Inventory Analysis As of As of January 29, 2011 January 30, 2010 % Ģ Inventory on Hand $ 330,876 $ 270,778 + 22% Inventory in Transit $ 54,981 $ 39,867 + 38% Total Inventory $ 385,857 $ 310,645 + 24% |
9
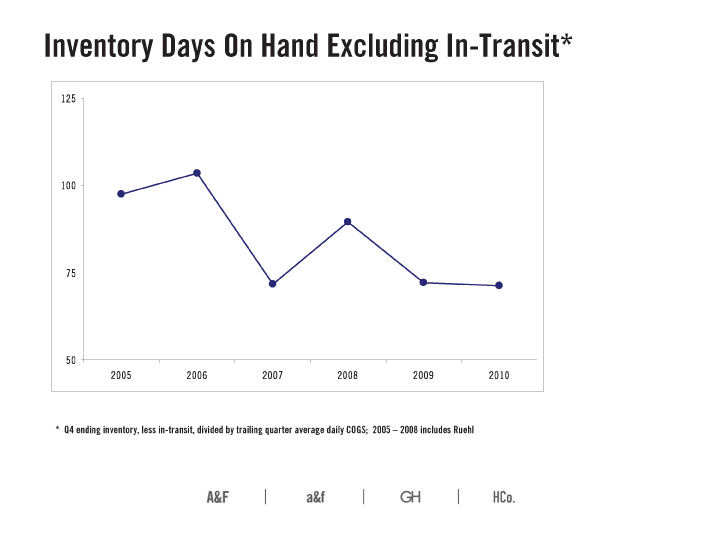
| Inventory Days On Hand Excluding In-Transit* 125 100 75 50 2005 2006 2007 2008 2009 2010 * Q4 ending inventory, less in-transit, divided by trailing quarter average daily COGS; 2005 — 2008 includes Ruehl |
10
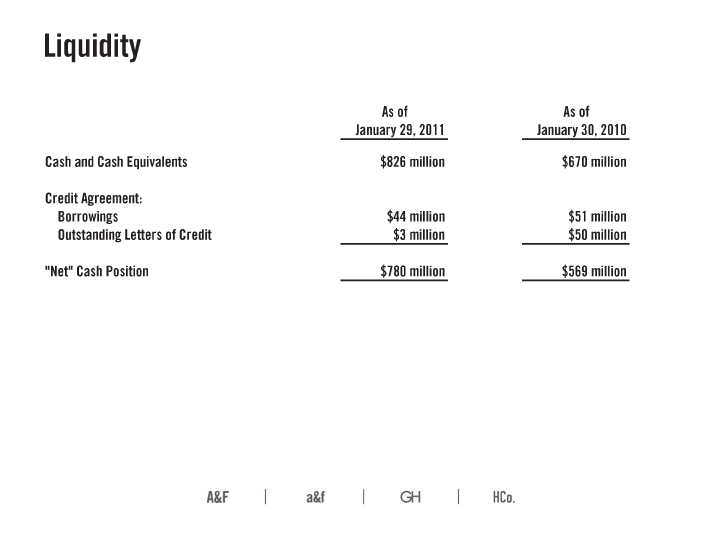
| Liquidity As of As of January 29, 2011 January 30, 2010 Cash and Cash Equivalents $826 million $670 million Credit Agreement: Borrowings $44 million $51 million Outstanding Letters of Credit $3 million $50 million “Net” Cash Position $780 million $569 million |
11
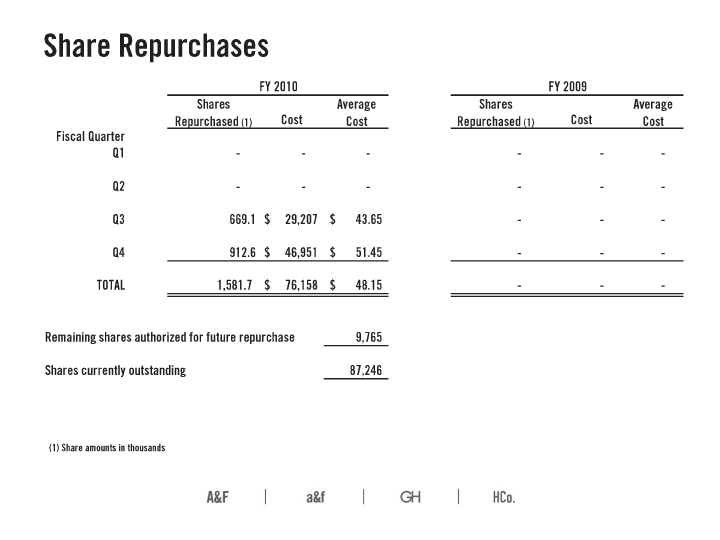
| Share Repurchases FY 2010 FY 2009 Shares Average Shares Average Repurchased (1) Cost Cost Repurchased (1) Cost Cost Fiscal Quarter Q1 — - — - — - Q2 — - — - — -Q3 669.1 $ 29,207 $ 43.65 — - -Q4 912.6 $ 46,951 $ 51.45 — - -TOTAL 1,581.7 $ 76,158 $ 48.15 — - - Remaining shares authorized for future repurchase 9,765 Shares currently outstanding 87,246 (1) Share amounts in thousands |
12
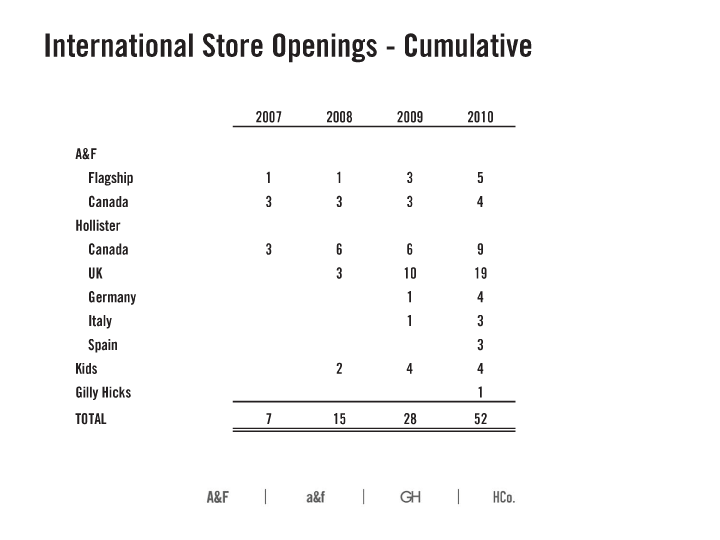
| International Store Openings — Cumulative 2007 2008 2009 2010 A&F Flagship 1 1 3 5 Canada 3 3 3 4 Hollister Canada 3 6 6 9 UK 3 10 19 Germany 1 4 Italy 1 3 Spain 3 Kids 2 4 4 Gilly Hicks 1 TOTAL 7 15 28 52 |
13
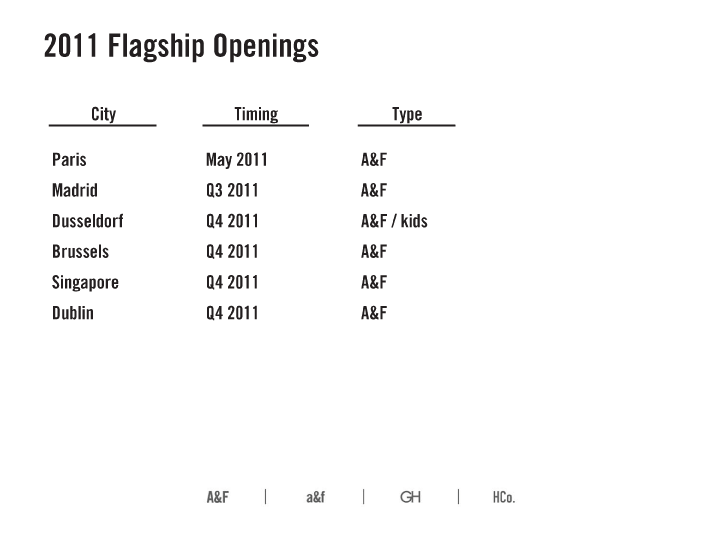
| 2011 Flagship Openings City Timing Type Paris May 2011 A&F Madrid Q3 2011 A&F Dusseldorf Q4 2011 A&F / kids Brussels Q4 2011 A&F Singapore Q4 2011 A&F Dublin Q4 2011 A&F |
14
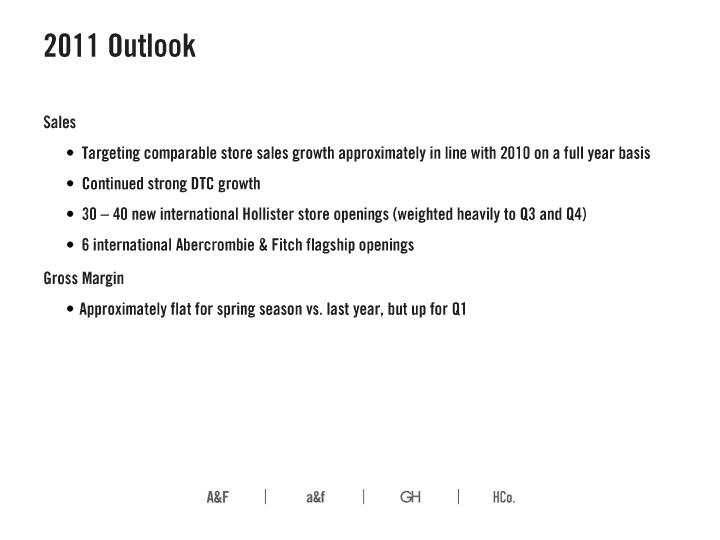
| 2011 Outlook Sales · Targeting comparable store sales growth approximately in line with 2010 on a full year basis · Continued strong DTC growth · 30 — 40 new international Hollister store openings (weighted heavily to Q3 and Q4) · 6 international Abercrombie & Fitch flagship openings Gross Margin · Approximately flat for spring season vs. last year, but up for Q1 |
15
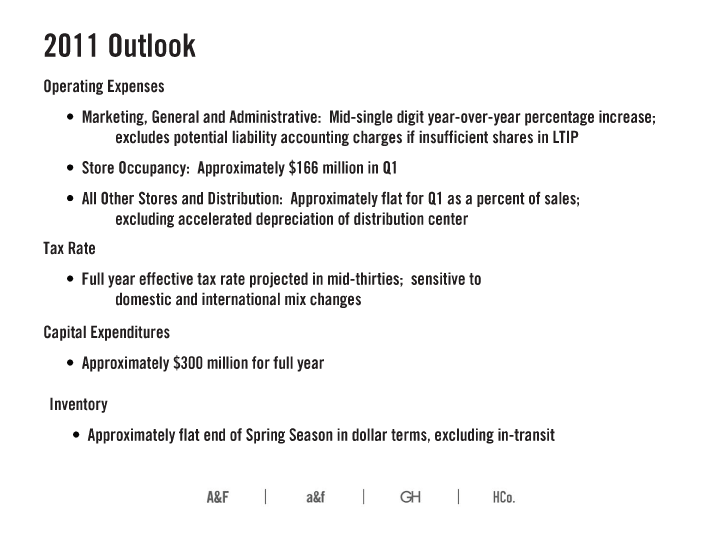
| 2011 Outlook Operating Expenses · Marketing, General and Administrative: Mid-single digit year-over-year percentage increase; excludes potential liability accounting charges if insufficient shares in LTIP · Store Occupancy: Approximately $166 million in Q1 · All Other Stores and Distribution: Approximately flat for Q1 as a percent of sales; excluding accelerated depreciation of distribution center Tax Rate · Full year effective tax rate projected in mid-thirties; sensitive to domestic and international mix changes Capital Expenditures · Approximately $300 million for full year Inventory · Approximately flat end of Spring Season in dollar terms, excluding in-transit |
16
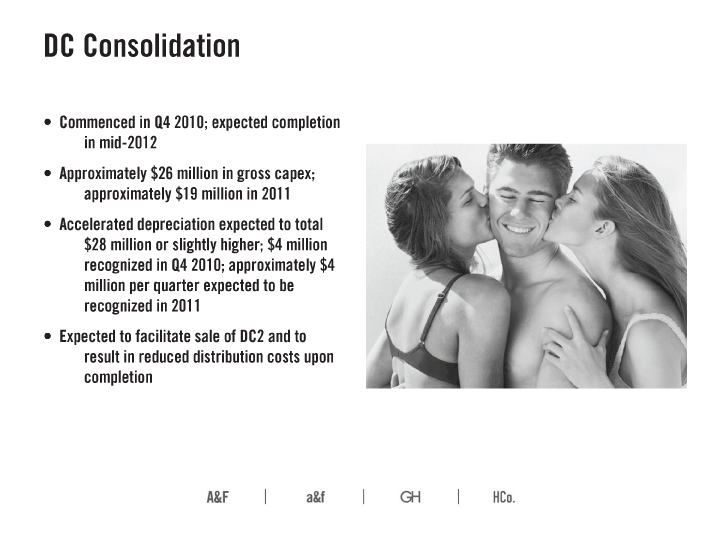
| DC Consolidation · Commenced in Q4 2010; expected completion in mid-2012 · Approximately $26 million in gross capex; approximately $19 million in 2011 · Accelerated depreciation expected to total $28 million or slightly higher; $4 million recognized in Q4 2010; approximately $4 million per quarter expected to be recognized in 2011 · Expected to facilitate sale of DC2 and to result in reduced distribution costs upon completion |
17

| Tuesday, April 5, 2011 — Investor Day New Albany, OH · 9:30am — 2:30pm (registration begins at 9:00am) · Presentations and Q&A on the state of the business from Mike Jeffries and Jonathan Ramsden · Presentations by senior leadership · Optional Distribution Center tour Register today by visiting www.abercrombie.com and the investor relations website. |
18
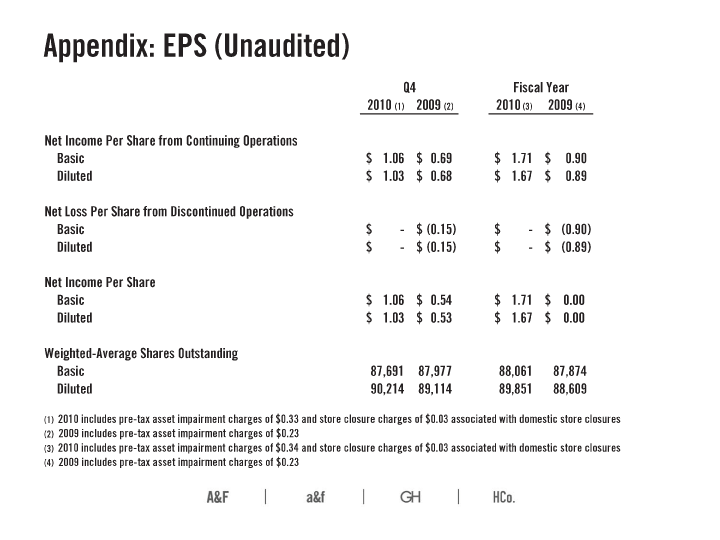
| Appendix: EPS (Unaudited) Q4 Fiscal Year 2010 (1) 2009 (2) 2010 (3) 2009 (4) Net Income Per Share from Continuing Operations Basic $ 1.06 $ 0.69 $ 1.71 $ 0.90 Diluted $ 1.03 $ 0.68 $ 1.67 $ 0.89 Net Loss Per Share from Discontinued Operations Basic $ — $ (0.15) $ — $ (0.90) Diluted $ — $ (0.15) $ — $ (0.89) Net Income Per Share Basic $ 1.06 $ 0.54 $ 1.71 $ 0.00 Diluted $ 1.03 $ 0.53 $ 1.67 $ 0.00 Weighted-Average Shares Outstanding Basic 87,691 87,977 88,061 87,874 Diluted 90,214 89,114 89,851 88,609 (1) 2010 includes pre-tax asset impairment charges of $0.33 and store closure charges of $0.03 associated with domestic store closures (2) 2009 includes pre-tax asset impairment charges of $0.23 (3) 2010 includes pre-tax asset impairment charges of $0.34 and store closure charges of $0.03 associated with domestic store closures (4) 2009 includes pre-tax asset impairment charges of $0.23 |
19
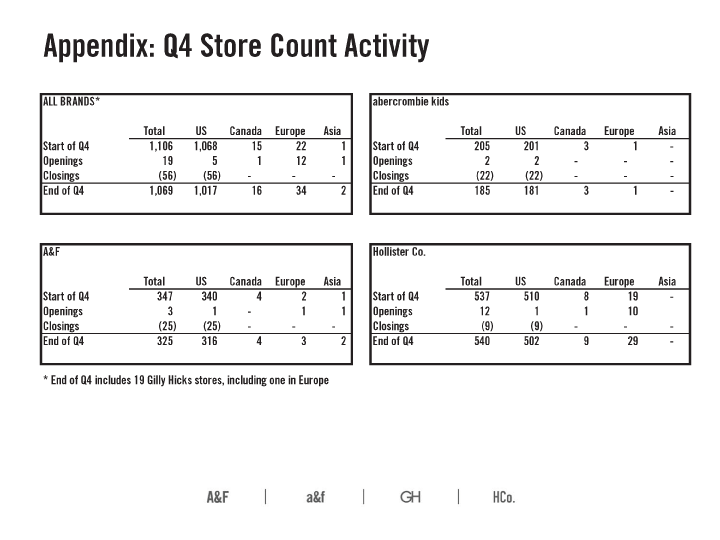
| Appendix: Q4 Store Count Activity ALL BRANDS* Store Count — By Brand and Region abercrombie kids Total US Canada Europe Asia Total US Canada Europe Asia Start of Q4 1,106 1,068 15 22 1 Start of Q4 205 201 3 1 -Openings 19 5 1 12 1 Openings 2 2 — - -Closings (56) (56) — - — Closings (22) (22) — - -End of Q4 1,069 1,017 16 34 2 End of Q4 185 181 3 1 - A&F Hollister Co. Total US Canada Europe Asia Total US Canada Europe Asia Start of Q4 347 340 4 2 1 Start of Q4 537 510 8 19 -Openings 3 1 — 1 1 Openings 12 1 1 10 Closings (25) (25) — - — Closings (9) (9) — - -End of Q4 325 316 4 3 2 End of Q4 540 502 9 29 - * End of Q4 includes 19 Gilly Hicks stores, including one in Europe |
20
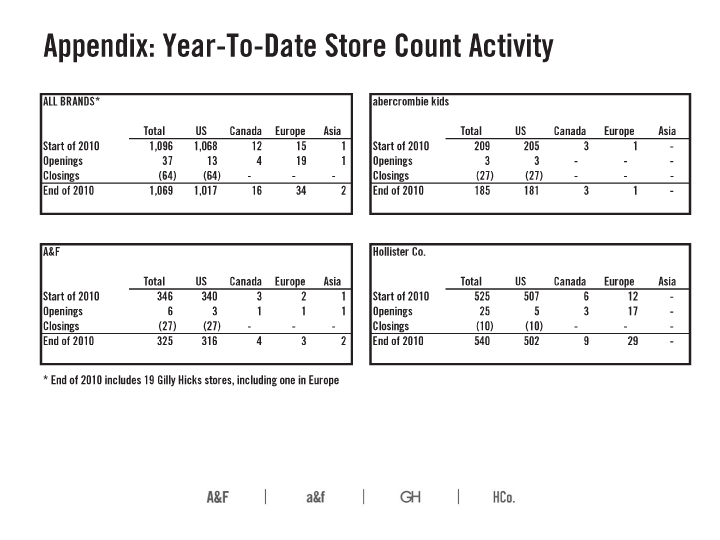
| Appendix: Year-To-Date Store Count Activity ALL BRANDS* Store Count — By Brand and Region abercrombie kids Total US Canada Europe Asia Total US Canada Europe Asia Start of 2010 1,096 1,068 12 15 1 Start of 2010 209 205 3 1 -Openings 37 13 4 19 1 Openings 3 3 — - -Closings (64) (64) — - - Closings (27) (27) — - -End of 2010 1,069 1,017 16 34 2 End of 2010 185 181 3 1 - A&F Hollister Co. Total US Canada Europe Asia Total US Canada Europe Asia Start of 2010 346 340 3 2 1 Start of 2010 525 507 6 12 -Openings 6 3 1 1 1 Openings 25 5 3 17 -Closings (27) (27) — - — Closings (10) (10) — - -End of 2010 325 316 4 3 2 End of 2010 540 502 9 29 - * End of 2010 includes 19 Gilly Hicks stores, including one in Europe |
21
