Attached files
| file | filename |
|---|---|
| 8-K - CURRENT REPORT ON FORM 8-K - BROCADE COMMUNICATIONS SYSTEMS INC | d8k.htm |
| EX-99.1 - PRESS RELEASE - BROCADE COMMUNICATIONS SYSTEMS INC | dex991.htm |
 Q1 FY 2011 EARNINGS
February 17, 2011
Exhibit 99.2
©
2011 Brocade Communications Systems, Inc.
Page 1 of 41 |
| Prepared comments provided by Rob Eggers, Investor Relations
Thank you for your interest in Brocade’s Q1 Fiscal 2011 earnings
presentation, which includes prepared remarks, slides, and a press
release detailing fiscal first quarter 2011 financial results. The press release was issued shortly after 1:00 p.m. Pacific
time on February 17, 2011, via Marketwire. The press release, along with these
prepared comments and slides, has been made available on Brocade’s
Investor Relations website at www.brcd.com and has been furnished to the SEC on Form 8-K. |
| Cautionary Statements and Disclosures
This presentation includes forward-looking statements regarding
Brocade’s financial results, plans and business outlook as well as
worldwide SAN, Ethernet and Federal government IT spending, which are
only predictions and involve risks and uncertainties such that actual
results may vary significantly. These and other risks are set forth in
more detail in our Form 10-K for the fiscal year ended October 30,
2010. These forward-looking statements reflect beliefs, assumptions,
outlook, estimates and predictions as of today, and Brocade expressly
assumes no obligation to update any such forward-looking
statements. In addition, this presentation includes various
third-party estimates regarding the total available market and other
measures, which do not necessarily reflect the views of Brocade.
Further, Brocade does not guarantee the accuracy or reliability of any such
information or forecast.
Certain financial information is presented on a non-GAAP basis. The most
directly comparable GAAP information and a reconciliation between the
non-GAAP and GAAP figures are provided in the accompanying press
release, which has been furnished to the SEC on Form 8-K and posted
on Brocade’s website, and is included in the appendix to this
presentation. Please see risk factors on Form 10-K filed with the
SEC ©
2011 Brocade Communications Systems, Inc.
Page 2 of 41 |
 Agenda
Prepared comments followed by live Q&A call
Richard Deranleau
CFO
Mike Klayko
CEO
©
2011 Brocade Communications Systems, Inc.
Page 3 of 41 |
| Today’s prepared comments include remarks by Mike Klayko, Brocade’s
CEO, regarding the company’s quarterly results, its strategy and a
review of operations, as well as industry trends and market/technology drivers related to its business; and by
Richard Deranleau, Brocade’s CFO, who will provide a financial review.
A live question-and-answer conference call will be webcast beginning at
2:30 p.m. Pacific time on February 17 at www.brcd.com
and will be archived on Brocade’s Investor Relations website for
approximately 12 months. Participants are invited to submit questions
via email at ir@brocade.com up to 60 minutes prior to the conference call and to ask live questions during the call. |
 Fiscal 2011: Q1 Earnings
Mike Klayko, CEO
©
2011 Brocade Communications Systems, Inc.
Page 4 of 41 |
| Prepared comments provided by Mike Klayko, CEO
|
 Q1 Executive Summary
Q1 Results
•
$546M revenues, up 1.2% Yr./Yr.
•
$0.12 non-GAAP EPS* (diluted)
Business Highlights
•
Highest end-user demand for SAN
•
SAN product revenue grew 4.9%
Qtr./Qtr. driven by Director/Server
•
Ethernet product revenue grew
32% Yr./Yr. led by EMEA and APAC
•
Operating cash flows of $118M,
up 11% Qtr./Qtr.
* Note: Non-GAAP, please see GAAP reconciliation in appendix
Quarterly Revenues
$539M
$501M
$504M
$550M
$546M
Q1 10
Q2 10
Q3 10
Q4 10
Q1 11
©
2011 Brocade Communications Systems, Inc.
Page 5 of 41 |
| Brocade reported Q1 revenues of $546M and non-GAAP diluted
earnings per share (EPS) of $0.12, which exceeded our prior guidance
range of $0.09 to $0.10 for the quarter. Our revenues in the quarter represented a 1.2% increase year-over-year
(Yr./Yr.) and a slight decrease sequentially as expected, following an
all-time record revenue quarter in Q4 FY10. A highlight in Q1
was our ability to maintain momentum in our Ethernet products revenue, which was up 32% Yr./Yr. fueled by
growth in EMEA and Asia Pacific (APAC) in terms of geographies. In addition, we
saw strong traction in the Service Provider and Enterprise businesses in
terms of customer segments. Another highlight was the performance of our
storage area networking (SAN) products revenue, which was up approximately 5%
sequentially. Specifically, we are seeing healthy end-user demand for our
SAN products as customers continue to invest in their
data center networking infrastructures to address IT imperatives
such as server virtualization sprawl and private cloud
initiatives. These dynamics are also having a positive impact in
our Director and Server products businesses. As servers run
more virtual machines, the connection rate to storage increases and the demand
for SAN switching increases. In Q1, Brocade generated its
second-highest Director product revenue, its highest Server product revenue and record sell-through or end-user
demand for its SAN business. |
 Brocade FY 2011 Playbook
1.
Differentiate through Innovation
2.
Grow the Ethernet Business
3.
Maintain SAN Leadership
4.
Generate More Awareness
5.
Be an Employer of Choice
6.
Grow Top-Line Profitably
©
2011 Brocade Communications Systems, Inc.
Page 6
of 41 |
| Last quarter I discussed our FY 11 Playbook. I will now take a closer
look at our Q1 performance according to the FY 11 Playbook
fundamentals: 1.
Differentiate through Innovation
2.
Grow the Ethernet Business
3.
Maintain SAN Leadership
4.
Generate More Awareness
5.
Be an Employer of Choice
6.
Grow Top-Line Profitably |
 1. Differentiate through Innovation
Brocade One
™
Strategy
•
Unmatched simplicity
•
Non-stop networking
•
Application optimization
•
Investment protection
Brocade MLXe
with 100 GbE
Brocade VDX
™
6720
Data Center Switches with
Brocade VCS technology
BROCADE
Brocade One in Action
Brocade One in Action
©
2011 Brocade Communications Systems, Inc.
Page 7 of 41 |
| Brocade introduced the Brocade One™
strategy to help us align our innovation priorities with four key customer
imperatives that we believe are essential for success in IT today:
Unmatched simplicity, non-stop networking, application optimization
and investment protection. Two of the best recent examples of Brocade One
“in action” are the Brocade VDX™
6720 Data
Center Switch powered by Brocade VCS™
technology and the Brocade MLXe
Core Router, which establishes industry
benchmarks for performance, scalability and investment protection for service
provider and data center networks. I will provide a brief progress
update on each platform. |
 “Most Important
Enterprise IT
Product of 2010”
©
2011 Brocade Communications Systems, Inc.
Page 8 of 41 |
| (1)
http://www.cio.gov/documents/25-Point-Implementation-Plan-to-Reform-Federal%20IT.pdf
Award-Winning Brocade VDX 6720/ Brocade VCS Technology:
Brocade VCS technology to enable a new category of data center networks, or Ethernet fabrics, that are purpose-built to
help our customers simplify their network architectures and manage the rampant growth of server
virtualization inside of their data centers. This is a critical technology building block
towards highly automated, private cloud architectures that many customers are evaluating
today. The initial reception of the Brocade VDX 6720 from customers, industry pundits and
other luminaries has been very positive. Customers who are evaluating an Ethernet fabric
solution have told us, “If you are building a cloud environment, you must start with the
assumption that it will need an Ethernet fabric as its foundation”. We are also proud of the fact that CTOEdge
named the Brocade VDX 6720 the
“Most Important Enterprise Product for 2010,” pointing out that “this offering heralds a
change in the way we think about managing data centers for years to come.” We also received
favorable feedback about Ethernet fabrics from the CIO of the United States government, Vivek
Kundra, as part of a larger discussion on data center consolidation strategies and cloud
computing best practices. These two topics are top-of-mind for Mr. Kundra, as evidenced
by their prominence in his “25 Point Implementation Plan to Reform Federal Information Technology
Management”. In terms of key metrics, Q1 saw Brocade winning some
significant deals for the Brocade VDX 6720 at large enterprise customers in a number of
targeted vertical markets; energy, high-tech, media and communications. These customers have
already deployed their Brocade VDX 6720 switches into production environments in high-performance,
low-latency top-of- rack switch configurations with plans to migrate to Ethernet
fabric clusters later. These early customers helped the Brocade VDX 6720 surpass our goals for
Q1 in both unit shipments and revenue. In future quarters, we expect to leverage our time-
to-market advantage in this category.
We designed the Brocade VDX 6720 Switch and
(1) |
 ©
2011 Brocade Communications Systems, Inc.
Page 9 of 41 |
| The IP/Ethernet networking world is
also dealing with massive scale in terms of global digital data and
private network/Internet traffic growth. The proliferation of connected mobile devices, the
rapid adoption of public cloud computing services, the migration toward
next-generation 4G cellular as well as IPv6 technologies are some of
the factors driving customers to either upgrade or refresh their service provider and data center
networks today.
The Brocade MLXe Core Router, which was named the
“Product of the Year” by Internet Telephony magazine, is designed
to tackle these challenges, offering industry-leading 1/10/100 Gigabit
Ethernet (GbE) wire-speed density, high reliability, and
cost-saving operational efficiency for the world’s most demanding networks.
Award-Winning Brocade MLXe
Core Router: |
 CERN Accelerates Scientific
Innovation with MLXe
Routers
”
“
—Jean-Michel Jouanigot, Communications
Systems Group Leader, IT Department, CERN
Excels in one of the world’s most rigorous testing environments
Brocade’s MLXe
was the only product that
met our stringent requirements (we test
prod`ucts
to destruction), and not only
delivers a solution to meet our immediate
needs but also gives us a platform to 100
GbE
when the time is right. I do not see our
appetite for data waning in the future, so
with the addition of the MLXe
in our
environment, I am confident we have a
blueprint for success.
©
2011 Brocade Communications Systems, Inc.
Page 10 of 41 |
| One such example is our Q1 win at CERN, one of the most respected
scientific research organizations in the world. CERN is using the Brocade
MLXe to manage a networking environment that generates more than 15
petabytes of data every year. Further, we are
extremely proud of this win because the Brocade MLXe
was able to out-perform all other competing solutions in a rigorous testing
process that is recognized as one of the most thorough and demanding in
the scientific community. |
 IPv4 Address Exhaustion
Opportunity for IPv6-certified Brocade MLXe
core routers
Source: American Registry for Internet Numbers
2008
2009
2010
2011
688
654
654
570
537
503
436
436
369
268
235
117
0
Mar
Jun
Sep
Dec
Mar
Jun
Sep
Dec
Mar
Jun
Sep
Dec
Feb
Available Free Pool of IPv4 Addresses
from the Internet Assigned Numbers Authority
as of February 3, 2011
The last blocks of
IPv4 addresses were
distributed to each
Regional Internet
Registry on 2/3/11
©
2011 Brocade Communications Systems, Inc.
Page 11 of 41 |
| As customers and the industry make the transition to IPv6 technology,
which has garnered significant media attention recently, the
high-performance and reliability of the Brocade MLXe will be vital.
Industry experts say that IP addresses available through IPv4 are nearly
exhausted. This is hastening the migration to IPv6 among service providers and
enterprises alike. The Brocade MLXe
is one of a comprehensive set of IPv6-certified products that Brocade
offers to simplify this migration for customers, without compromising
performance levels. It is yet another example of how we’re applying
the Brocade One strategy to solve the most critical problems our customers face. |
 2. Grow the Ethernet Business
•
32% Yr./Yr. growth in
Ethernet products revenue
•
Nearly 50% sequential
growth in EMEA
•
Double-digit growth in
APAC
•
315 Elite and Premier
global channel partners
Strong performance drives growth
©
2011 Brocade Communications Systems, Inc.
Page 12 of 41 |
| In Q1, our Ethernet products revenue grew more than 32% Yr./Yr. and
total Ethernet revenue (products and services) was up almost 23% Yr./Yr.
Other positive signs include Q1 being the best quarter in winning new
Ethernet customer accounts since we started to track and report on this metric. EMEA was a particular
area of strength for us with the highest growth ever in terms of
new Ethernet accounts and nearly 50%
sequential growth in terms of Ethernet products revenue. APAC had
double-digit sequential growth in Q1, and was up over 65% Yr./Yr.
Consistent with our prior guidance for the quarter, the Federal Ethernet
business in Q1 was down sequentially, but was up more than 22% on a
Yr./Yr. basis. Our non-Federal Ethernet business in the Americas was
up 37% on a Yr./Yr. basis. |
 Channel Partner Momentum
John McHugh, Chief Marketing
Officer Barbara Spicek, VP of Worldwide Channels
©
2011 Brocade Communications Systems, Inc.
Page 13 of 41 |
| Overall, I am pleased with our execution in our Ethernet business,
which is a key success factor in Brocade being able to grow our
top-line profitably. We will continue to enhance existing business initiatives and introduce new ones to drive growth
in this market. Focusing on channel partner success is one example of this,
because it is a critical go-to-market route for the Ethernet
business. In Q1, Brocade successfully recruited an additional 11
Elite and Premier channel partners to our Alliance Partner Network
(APN), giving us a total of 315 such partners globally, adding to the almost
7000 Select partners in the program. We also introduced a number of new
and enhanced APN program features that are designed specifically to educate, train and certify
our partners to better address data center, virtualization and cloud computing
business opportunities. Brocade’s channel programs received
significant industry recognition in this quarter when CRN Magazine, a high-profile
publication aimed at resellers, named Vice President of Worldwide Channels
Barbara Spicek and Chief Marketing Officer John McHugh among its “Top 100 Most Influential Executives”.
|
 3. Maintain SAN Leadership
•
Record SAN sell-through in Q1
•
Record quarter for Server product revenue
•
110% sequential growth for
10 GbE-based convergence
products
Driving innovation and growth in converged networking
Brocade
Brocade
MLX
MLX
FC
iSCSI
NAS
FCoE
Brocade
Brocade
DCX
DCX
SAN
©
2011 Brocade Communications Systems, Inc.
Page 14 of 41 |
| Maintaining Brocade’s leadership in the SAN market is just as important as
growing our Ethernet Business. Brocade continues to demonstrate leadership
and generate momentum in the storage networking industry in both the traditional Fibre Channel
market as well as the emerging converged networking market.
Our strength in the SAN products business is reflected in the Q1 results with
approximately 5% growth sequentially and an all- time
record in terms of sell-through following a very good Q4 FY10.
It is also reflected in the momentum of our Director and Server products
businesses, which both experienced very strong demand in Q1 including a
record quarter for the Server products. Additionally, we are
showing good progress in sales of our Ethernet fabric products supporting multiple and converged
protocols. These products include the Brocade 8000 FCoE Switch, the Brocade
1010/1020 Converged Network Adapters (CNAs), Brocade VDX 6720 and
embedded FCoE blades. The sales of these 10 GbE-based convergence products in Q1 was up
approximately 110% sequentially and more than 320% Yr./Yr., showing that
customers are turning to Brocade to connect their servers, both physical
and virtual, to shared storage, regardless of technology or protocol. We are committed to providing
leadership in this emerging category. |
 Brocade Leading Fibre
Channel
Transformation
Industry’s first end-to-end 16 Gbps
product portfolio
•
Unmatched Simplicity: Integrated
compression, encryption, and routing
•
Investment Protection: Upgrade
existing SAN infrastructure
•
Non-Stop Networking:
Field-proven
“five nines”
availability
8-slot and 4-slot
Backbones
48-port 1U
16 Gbps
Fabric Switch
Mezzanine
16 Gbps
HBAs
©
2011 Brocade Communications Systems, Inc.
Page 15 of 41 |
| Getting back to Fibre
Channel, this technology continues to be, by a wide margin, the
preferred protocol to provide shared
storage for server virtualization and desktop virtualization. In
fact, the rapidly growing adoption for both server and desktop
virtualization is a driving force toward continually faster connections in
Fibre Channel technology. Brocade again expects to
lead this technology transition with our plans to introduce a full suite of next
generation 16 Gbps products and solutions from
server adapters, embedded and fabric switches to directors/backbones later this
year. Another proof point of the relative health of the Fibre
Channel business is the fact that our OEM partners are continuing to
invest in Fibre
Channel technology. In addition, most industry research firms who track the
Fibre Channel market are predicting
growth in 2011 and well beyond, which supports our belief that this market is
healthy and growing. |
 4. Generate More Awareness
©
2011 Brocade Communications Systems, Inc.
Page 16 of 41 |
| One focus area in our FY 11 Playbook is our goal to generate broader global
awareness of Brocade as a complete networking solutions provider and not
just the leading “SAN company”. In fact, one of the goals of our Brocade One strategy is to
demonstrate that Brocade is leading the transformation of the network in all
areas of IT with the goal of helping our customers transition smoothly to
a world where information and applications can reside anywhere. We have
focused our global marketing and corporate communications efforts on high-impact programs to accomplish this.
Driving industry thought-leadership with contributions from across the
company is an example. In the technology arena, this is exemplified by
our recent efforts to promote Ethernet fabrics as the de
facto category name for next-generation, flat Layer
2 networks for virtualized data centers. In the non-technology realm,
Brocade being awarded the prestigious “Pinnacle Grand
Prize”
by the Association for Financial Professionals for our innovative process to
converge strategic liquidity planning with enterprise risk management is
another recent example of our thought-leadership. Finally, our
company-wide use of social media to communicate directly to all our key audiences including customers,
partners, investors and employees is an example of how Brocade is specifically
leveraging the power of networking to generate awareness. Please take a
look at our social media campaigns and assets for yourselves at
brocade.com/socialmedia. |
   5. Be an Employer of Choice
©
2011 Brocade Communications Systems, Inc.
Page 17 of 41 |
| Another important focus area in the FY 11 Playbook is our goal to be an
“employer of choice”. We received an important industry
validation when Fortune Magazine, for the second year in a row, named
Brocade as one of the “100 Best Companies to Work
For”.
The Fortune 100 list is based on direct feedback from our employees who gave us
high marks in the areas of innovation, fostering a professional
team environment, community giving, compensation, and flexible work environment. In the spirit of using
social media more, I encourage you to view my short video about the Fortune 100
award at www.youtube.com/watch?v=yZFrd7yvNCI. |
 6. Grow Top-Line Profitably
•
32% growth Yr./Yr. in the Ethernet
products revenue
•
All-time record quarter of SAN
sell-through
•
320% growth Yr./Yr. in converged
networking products
•
Delivered higher EPS than outlook
Q1 2011 Summary
©
2011 Brocade Communications Systems, Inc.
Page 18 of 41 |
| Overall, I am pleased with our performance in Q1 and with our ability
to execute thus far to our FY 11 Playbook, including growing the
top-line profitably. Again, this quarter’s highlights include:
•32% growth in the Ethernet products revenue Yr./Yr. led by strength in EMEA, APAC
and our Service Provider businesses; •All-time record quarter in terms of sell-through in our SAN products business including a record in our Server products
revenue; •Good traction in sales of our converged networking products with
320% growth Yr./Yr. and 110% growth sequentially;
•Delivered non-GAAP EPS of $0.12 which topped our guidance of $0.09 to $0.10 for the
quarter. |
 Q1 FY 2011 Financials
Richard Deranleau, CFO
©
2011 Brocade Communications Systems, Inc.
Page 19 of 41 |
| Prepared comments provided by Richard Deranleau, CFO
|
 Financial Highlights
* Note: Non-GAAP, please see GAAP reconciliation in appendix
Growing the top-line profitably and reducing term debt
Q1 11
Revenues
Overall revenue
$546M
SAN sell-through
Record quarter
Ethernet revenue
+32% Yr./Yr.
Profitability
Non-GAAP EPS* (diluted)
$0.12
GAAP EPS (diluted)
$0.06
Generating Cash/Reducing Debt
Operating cash flow
$118M
Total debt payments
$40M
Term loan down to $311M at end of Q1 11
©
2011 Brocade Communications Systems, Inc.
Page 20 of 41 |
| Brocade executed well in Q1, achieving revenues of $546M which was up
1.2% Yr./Yr. and down slightly Qtr./Qtr., in line with the guidance we
shared with you on our last earnings call. Storage demand was very strong in Q1 with SAN sell-through
reaching an all-time high for the company. Storage product revenues were up
4.9% Qtr./Qtr., in a quarter when OEM partners
reduced their inventory positions as expected. OEM inventories are now at their
lowest since Q4 09. Ethernet product revenues were up 32.2% Yr./Yr.
driven by growth across all geographies. Ethernet product revenues were down 11.5%
Qtr./Qtr. from our all-time record revenue in Q4 driven by lower Federal
spending, consistent with our prior guidance. Non-GAAP
earnings per share on a diluted basis was $0.12 for Q1, which includes a benefit from a lower-than-expected US
Federal tax rate resulting from the passage of the R&D tax credit
bill. Excluding this benefit our non-GAAP EPS for Q1 would
have been $0.11, which is higher than the guidance we provided of $0.09 to
$0.10 for the quarter. We generated $118M in operating cash flow in Q1,
the highest cash generation since Q4 09, which we used to pay down our term loan and to build our
cash balance. |
 Key Financial Metrics
Q1 10
Q2 10
Q3 10
Q4 10
Q1 11
Revenue
$539M
$501M
$504M
$550M
$546M
Sequential growth
3.4%
(7.1)%
.5%
9.3%
(0.8)%
Year-over-year growth
25.0%
(1)
(1.1)%
2.1%
5.5%
1.2%
Non-GAAP gross margin*
64.9%
62.7%
60.4%
62.3%
62.0%
Non-GAAP operating margin*
26.0%
20.5%
17.3%
20.4%
17.1%
Non-GAAP EPS*—diluted
$0.19
$0.13
$0.13
$0.14
$0.12
GAAP EPS—diluted
$0.11
$0.05
$0.05
$0.05
$0.06
(1)
Acquisition of Foundry in December 2008
* Note: Non-GAAP, please see GAAP reconciliation in appendix
Managing the business to our 2-year target model
©
2011 Brocade Communications Systems, Inc.
Page 21 of 41 |
| Turning first to revenues, Q1 revenues were $546.0M in a quarter where we saw good execution
across our business segments and particularly in our EMEA and APAC geographies. Revenues came in
near the high end of the guidance range we provided in our Q4 earnings call driven by strong
storage demand and where both EMEA and APAC posted record percentage contribution of revenue for
the company in Q1. Storage product revenues were up 4.9% sequentially driven by
higher director and server sales which were up 16% and 6%, respectively, compared to Q4.
Ethernet product revenues were down 11.5% sequentially driven by lower Federal revenue as
expected, partially offset by growth in the international regions led by EMEA. We continue to see progress in
our Ethernet sales investments and are pleased with the improvements and growth in both EMEA and APAC
this quarter. Global Services revenues were down 3.6% sequentially driven by associated lower
Ethernet support revenue. OEM inventory levels exiting the quarter were down to about two weeks
of supply, as expected, as OEMs trimmed their inventory entering the seasonally slower quarters
of the year. Non-GAAP Gross Margins of 62.0% were at the high end of our guidance
range of 61.5% to 62.0% for the quarter driven by the strong storage performance. Non-GAAP
gross margins in the quarter were comfortably within our 2-year target model range of 61%
to 63%. Non-GAAP operating margins were 17.1%, above the guidance we gave of 15% to
16% for the quarter, and in our 2-year target model range of 17% to 20%. The sequential
decline in operating margins was driven by slightly lower gross margins and higher operating
expenses as a percentage of revenue driven by our sales and marketing investments over the past
two quarters. Q1 non-GAAP operating expenses were higher as a percentage of revenue at 44.9%, but lower
than the guidance of 46% to 47% for the quarter.
The Q1 11 effective non-GAAP tax rate was 15.9% and effective GAAP tax benefit was (26.6%).
Both tax rates reflect the benefit from the US R&D tax credit that was approved during Q1
by the US Congress. Looking to the Balance Sheet, we repaid $39.7M of our
senior secured debt of which $30.0M was in excess of the mandatory amount due, bringing our
acquisition term debt down to approximately $311M. Total Q1 diluted shares were 491M shares and
within our expected range when we provided our outlook for the quarter. We did not repurchase any
stock during the quarter. |
 Revenue: SAN, Ethernet, and Global Services
SAN growth offset lower Federal Ethernet revenue
©
2011 Brocade Communications Systems, Inc.
Page 22 of 41 |
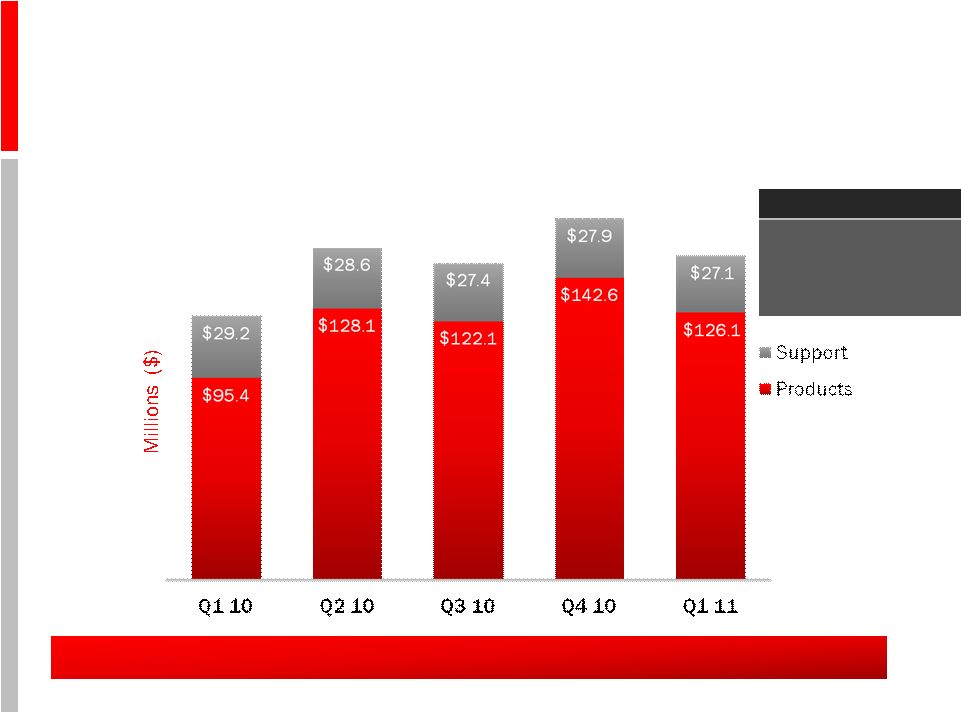
| Turning to revenues by business unit, our Storage product revenue was
$331.2M in the quarter, an increase of 4.9% sequentially. Storage
represented 61% of revenues in Q1 versus 57% in Q4. Our Ethernet
product revenue was $126.1M in the quarter, a decrease of 11.5% sequentially. Ethernet product revenue
represented 23% of total revenue versus 26% in Q4.
Our Global Services revenue was $88.7M in the quarter and represented 16% of
revenues, down slightly versus 17% in Q4. Global Services revenue was
down 3.6% sequentially driven primarily by lower Ethernet support revenue. |
 Total Ethernet Business Revenue
Strong year-over-year Ethernet revenue growth
$124.6
$156.7
$149.5
$170.5
$153.2
Total +23%
Support -7%
Products +32%
Q1 Yr./Yr. Compares
©
2011 Brocade Communications Systems, Inc.
Page 23
of 41 |
| Looking at our Ethernet business, including hardware and Ethernet based support and
services, Q1 revenues were $153.2M up 23% Yr./Yr. and down 10% from our record quarter in
Q4 10. Our Federal Ethernet business was $20.4M, up 22% Yr./Yr. which was slightly
higher than our previous guidance of $15- 20M for the quarter. Non-Federal Ethernet
revenue was also up 23% Yr./Yr. showing strength across our product portfolio and customer
base. The non-Federal Ethernet business growth was driven by strong performances in our
international geographies led by the EMEA region. We saw good growth in our new accounts with both
initial sales in the quarter as well as new customers from previous quarters returning and
buying again. We also saw strong demand for our stackables in Q1, reaching a new record for
Brocade for these products. |
 Total Ethernet Business Revenue
By customer segment
Strong year-over-year growth across all customer segments
$124.6
$156.7
$149.5
$170.5
$153.2
Total +23%
Federal +22%
Service Provider +58%
Enterprise +13%
Q1 Yr./Yr. Compares
©
2011 Brocade Communications Systems, Inc.
Page 24 of 41 |
| We were also very pleased with continued strength in our Service Provider and Enterprise
segments in Q1. Revenue from customers that we have identified as service providers grew to now
represent 26% of total Ethernet business and grew 5 Yr./Yr. reaching their
2nd highest revenue quarter for Brocade. Revenue from enterprise customers, excluding Federal,
were up 4.4% sequentially and grew 12.5% Yr./Yr. Federal Ethernet business was down 48% sequentially
but up 22% Yr./Yr., consistent with the expectation set out on last quarter’s earnings
call. Ethernet ASP sequential declines were in the low
single-digits, at the low end of the Q1 guidance. |
 Total SAN Business Revenue
Quarter-over-quarter growth driven by Directors and Server
products $414.8
$344.3
$354.0
$379.9
$392.8
Total -5%
Support +1%
Products -6%
Q1 Yr./Yr. Compares
©
2011 Brocade Communications Systems, Inc.
Page 25 of 41 |
| Looking at our SAN business, including hardware and SAN based support and
services, Q1 revenue of $392.8M grew 3.4% from Q4.
Demand for Brocade’s leading SAN products was strong resulting in SAN product
revenue of $331.2M in the quarter, up 4.9% sequentially. Increases in revenue
across our director and server product families drove the overall SAN increase
Qtr./Qtr. We generated the 2nd
highest revenue quarter for directors and a record revenue quarter for our Server
product group in Q1.
Our Server
product group, including Embedded Switches, HBA’s, and Mezzanine Cards, posted
record revenues of $48.7M which was up 7.0% Yr./Yr. and up 6.4% from a
strong Q4. Embedded Switches were up 5.7% sequentially while our
host
products
including
HBA’s
and
Mezzanine
Cards
were
up
nearly
200%
Yr./Yr.
SAN
ASP
sequential
declines
were
in
the
low
single-digits,
consistent
with
the
prior
quarter.
-
As
we
look
at
our
multi-protocol
and
converged
networking
products
including
the
Brocade
8000,
FCoE
blades
for
our
flagship DCX storage chassis, VDX switches and CNAs, total converged product
revenue growth was more than 110% sequentially. We feel that our product
portfolio continues to demonstrate our leadership in multi-protocol and convergence
solutions in the marketplace as networks
evolve. |
 Revenue: 10% Customers,
Other OEM, Channel/Direct
Higher mix of OEM revenue driven by overall mix to SAN business
©
2011 Brocade Communications Systems, Inc.
Page 26 of 41 |
| In Q1, consistent with the prior quarters, Brocade had three customers that had revenue
greater than 10%. EMC, IBM and HP all contributed more than 10% of revenues individually.
Collectively, our top three OEMs contributed 47% of revenues in Q1, up from 44% in Q4, and down
from 54% in the year ago quarter. Other OEMs represented 19% of revenues in Q1 versus 17% in Q4.
We saw very good growth from HDS and Dell in the quarter which drove this metric higher sequentiall
Channel and Direct were 34% of revenues in Q1, a decrease from 39% in Q4, reflecting the overall mix
away from Federal Ethernet business in the quarter to SAN and the OEM routes to market.
|
 Segment Revenues and
Gross Margin Snapshot
Q1 11 vs. Q4 10 revenue mix and non-GAAP gross margin*
* Note: Non-GAAP, please see GAAP reconciliation in appendix
Q4 10
Q1 11
Revenues by Segment ($M)
Non-GAAP Gross Margin*
by Segment
Gross Margins: SAN strong; Ethernet down due to lower revenue
©
2011 Brocade Communications Systems, Inc.
Page 27 of 41 |
| Non-GAAP Gross Margins of 62.0% were at the high end of our guidance range of 61.5% to
62.0% for the quarter driven by the strong storage performance and down 30 basis points from
Q4. Q1 SAN gross margins, were 71.4% unchanged from Q4, reflecting a strong mix of
director products that is typical in our Q1. The higher mix of SAN products at an overall
company level increased margins by approximately 75 basis points. Q1 Ethernet
non-GAAP gross margins were 46.7%, down from 47.8% in Q4. The lower Ethernet gross margins were
primarily driven by lower volumes in the quarter. The impact of lower Ethernet gross margins on
overall company gross margins was approximately -25 basis points in Q1. We continue to be
focused on our Ethernet gross margin initiatives outlined during our Analyst Day and expect to
see improvements again in the 2nd half of 2011 to be within our Ethernet
gross margin target exiting the year.
Global Services non-GAAP gross margins were 48.7% in Q1, down versus 53.7% in Q4 due to lower
revenue and mix to lower margin support offerings. The impact of lower services gross margins
on overall company gross margins was approximately -80 basis points in Q1.
|
 Operating Expenses and Margins
* Note: Non-GAAP, please see GAAP reconciliation in appendix
Non-GAAP Operating Margins*
Non-GAAP Operating Expenses*
as a Percentage of Revenues
2-year target operating
expense range: 43–44%
Operating margins within our 2-year target model
2-year target operating
margin range: 17–20%
©
2011 Brocade Communications Systems, Inc.
Page 28
of 41 |
| On a non-GAAP basis, total operating expenses were 44.9% of revenues in Q1 versus 41.9%
in Q4. Operating expenses were better than our previous guidance range of 46% to 47% of revenues
due, in part, to a slower hiring ramp than planned as well as some project spending that moved
out of the quarter. The dollar increase in operating expenses sequentially reflects the
investment in our sales organization made in Q4 as well as some additional investments in Q1.
We added 70 headcount in Q1, of which the majority was in Sales.
Non-GAAP operating margins were 17.1% in Q1, lower than our strong Q4 operating margins of 20.4%
due to higher operating expenses and slightly lower gross margins in the quarter. Our
2-year target range of operating margins is 17% to 20% and we plan to be at the low end of
that range for the full year. |
 Balance Sheet and Cash Flow Highlights
as of January 29, 2011
Cash flows enable de-leveraging and reinvestment
* Note: Adjusted EBITDA is as defined in the term debt credit agreement
** Note: Giving effect to the McDATA
convertible debt of $173M repaid on February 16, 2010
Q1 10
Q2 10
Q3 10
Q4 10
Q1 11
Cash from operations
$69.1M
$67.7M
$55.3M
$106.4M
$118.2M
Capital expenditures
$47M
$62M
$47M
$46M
$23M
Free cash flow
$22M
$6M
$9M
$61M
$95M
Debt payments
$506.5M
$202.2M
$30.6M
$30.2M
$39.7M
Cash, equivalents, and
short term investments
$328M**
$290M
$296M
$336M
$416M
Senior secured debt
$1.04B
$1.01B
$0.99B
$0.96B
$0.92B
Adjusted EBITDA*
$154.7M
$116.4M
$101.5M
$127.7M
$114.5M
Stock repurchase
$0
$20M
$5M
$0
$0
Senior secured leverage ratio
1.99x
1.95x
1.97x
1.92x
2.0x
Covenant
2.5x
2.5x
2.5x
2.5x
2.5x
Fixed charge coverage ratio
2.0x
1.8x
1.7x
1.7x
1.8x
Covenant
1.25x
1.25x
1.25x
1.25x
1.5x
©
2011 Brocade Communications Systems, Inc.
Page 29 of 41 |
| Cash from operations was over $118M in Q1, our highest level since Q4 09 and better than our
previous guidance. Total capital expenditures in the quarter were $23M. Free cash flow was
nearly $95M in the quarter, again the highest since Q4 09. Capital spending on the Company campus
fell to approximately $2M in the quarter, reflecting the completion of the project with only
minor final payments remaining through Q3 11. Cash and equivalents grew to $416M, up $80M from $336M in Q4. In Q1, we reduced our debt principal by
$39.7M including $30.0M in excess of the mandatory payment.
As we stated during our Analyst Day, we continue to focus on increasing operating cash flow and our
priorities for cash will be focused on paying down our term debt first, continuing to build our
cash reserves, and repurchasing stock on an opportunistic basis and subject to debt
covenants. |
 Net Debt:
Defined as Total Debt Less Total Cash
Net-debt decreased by $570M from Q1 09 to Q1 11
More than
50% reduction
in 2 years
©
2011 Brocade Communications Systems, Inc.
Page 30 of 41 |
| Net Debt has declined from $1,073M at the end of Q1 09 to $503M at the end of Q1 11. This
represents a $570M or 53% reduction over the last two years, demonstrating Brocade’s
ability to generate cash and reduce our long-term debt. Our term debt loan balance is now
down to $311M. Adjusted EBITDA in the quarter was $114.5M, which was down from the Q4 level of
$127.7M. The Senior Secured Leverage Ratio of 2.00x and the Fixed Charge Coverage Ratio of
1.80x are both within the covenant requirements of our term credit agreement.
|
| Q2 2011 Planning Assumptions
IT market conditions
•
Macro economic conditions improving
•
Strength building in international IT spending
•
Federal spending improving
•
SAN revenue slightly better than typical seasonality
•
Expect to grow at least with market in Ethernet
ASP trends
•
Low single-digit declines in SAN pricing
•
Low to mid single-digit declines in Ethernet pricing
Taxes
•
Outlook tax rate does not include discrete items
•
Outlook tax rate includes R&D tax credit
OEM inventories
•
Expect to come down slightly exiting Q2
©
2011 Brocade Communications Systems, Inc.
Page 31
of 41 |
| Now, as we look forward to Q2 11, here are some things to consider in
developing your financial models: •
We continue to look at GDP and IT spending forecasts for next quarter and this
year. Our current GDP growth assumptions have not changed since Analyst
Day 2010 but we are seeing more positive signs as we enter our Q2.
•
We continue to monitor the strength of international markets, specifically
Europe and Japan, and expect to see continued growth as these economies
strengthen. •
We are mindful of the
ongoing
Federal budget discussions but believe that we will see an improvement in the
Federal spending in Q2.
•
Q2 SAN demand is historically down 6% to 8% and we expect Q2 11 revenue to be
slightly better than historical performance.
•
We continue to expect improvements
and growth in our Ethernet business as our new sales headcount becomes more
productive.
•
We anticipate that our new VDX and VCS products will continue to
ramp but will have minimal impact to revenue/gross
margin in Q2.
•
We expect quarterly ASP declines in our SAN business to remain in the
low-single digits. ASP declines in our Ethernet business are
expected to be in the low to mid-single digits. •
From a tax rate perspective, we do not forecast discrete events due to the
inherent uncertainty of their timing, but have reflected the benefit of
the passage of the R&D tax credit in our full year tax rate.
•
Regarding OEM inventory, we would expect OEM inventory levels to
be flat to a slight decline in absolute dollar terms
exiting Q2, given that we are in our seasonally
softer quarters. |
 Q2 2011 Financial Outlook
As of February 17, 2011
* Note: Non-GAAP estimates assume exclusion of the same category of items
excluded from Q4 10 non-GAAP results Q2 11
Revenue range (up 9–11% Yr./Yr.)
$545M–555M
Non-GAAP gross margin*
61.5%–62.0%
Non-GAAP operating expenses*
45.5%–46.0%
Non-GAAP operating margin*
15.5%–16.0%
Other income/other expense
($21M)
Non-GAAP tax rate*
24%–25%
Fully diluted shares outstanding
497M–502M
Non-GAAP EPS*
$0.10
Operating cash flow
$90M–$100M
Capital expenditures
$30M–$33M
Free cash flow
$60M–$67M
©
2011 Brocade Communications Systems, Inc.
Page 32 of 41 |
| Given these planning assumptions, in Q2 11 we expect:
•Overall
revenue to be $545M to $555M, flat to up 2% Qtr./Qtr. and up 9% to 11% Yr./Yr.
•Non
-GAAP Gross Margins to be 61.5% to 62.0% •Non-GAAP Operating Expenses to be 45.5% to 46.0%
•Non
-GAAP Operating Margins to be 15.5% to 16.0%
•Other
Income/Expense net to be approximately ($21M)
•Non
-GAAP tax rate to be approximately 24% to 25% •Diluted shares outstanding to be in a range of 497M to 502M shares
•Non
-GAAP EPS to be 10 cents •Operating Cash Flow of $90M to $100M •Capital Expenditures of $30M to $33M •Free Cash Flow of $60M to $67M |
 Financial Summary
Richard Deranleau, CFO
©
2011 Brocade Communications Systems, Inc.
Page 33 of 41 |
| To summarize from a financial perspective, we are pleased with a very
good start to our FY 11. We continue to be focused on delivering
shareholder value by focusing on our FY11 Playbook for this year. We are
looking forward to answering your questions in the Q&A session of our conference call.
|
 Jason Nolet
VP Data Center
and Enterprise
Networking
Live Q&A Call
February 17, 2011, 2:30PM Pacific Time
Richard
Deranleau
CFO
John McHugh
CMO
Ian Whiting
SVP WW Sales
Mike Klayko
CEO
Dave Stevens
CTO
©
2011 Brocade Communications Systems, Inc.
Page 34
of
41 |
| Prepared comments provided by Rob Eggers, Investor Relations
That concludes Brocade’s prepared comments. At 2:30 p.m. Pacific Time on
February 17 Brocade will host a webcast conference call at www.brcd.com primarily devoted to answering questions submitted via email to ir@brocade.com and taken
live from participants via telephone.
Thank you for your interest in Brocade. |
 Appendix and Reconciliations
©
2011 Brocade Communications Systems, Inc.
Page 35 of 41 |
 Quarterly Net Income
GAAP/Non-GAAP Reconciliation
(In Thousands)
Q1 10
Q2 10
Q3 10
Q4 10
Q1 11
Net income on a GAAP basis
51,095
22,380
21,961
23,416
27,179
Adjustments:
Legal fees associated with indemnification obligations
and other related expenses, net
301
277
(74)
(666)
124
Stock-based compensation expense
21,523
30,146
24,682
25,275
19,906
Amortization of intangible assets
34,902
30,657
30,657
30,657
30,656
Acquisition and integration costs
204
–
–
–
–
Loss on sale of property
8,783
(47)
–
–
–
Restructuring costs and facilities lease loss
–
–
–
1,059
–
Legal fees associated with certain pre-acquisition litigation
299
17
13
243
77
Provision for certain pre-acquisition litigation
–
–
1,604
–
–
Interest due to adoption of new standard
2,142
348
–
–
–
Income tax effect of adjustments
(25,239)
(21,044)
(15,217)
(13,975)
(17,208)
Non-GAAP net income
94,010
62,734
63,626
66,009
60,734
©
2011 Brocade Communications Systems, Inc.
Page 36
of
41 |
 Adjusted EBITDA and Sr. Secured Leverage Ratio
As defined in the term credit agreement
Consolidated Senior Secured Leverage Ratio
Q1 FY 10
Q2 FY 10
Q3 FY 10
Q4 FY 10
Q1 FY 11
$ Thousand
Actual
Actual
Actual
Actual
Actual
Consolidated Net Income
$51,095
$22,380
$21,961
$23,416
$27,179
plus
(i) Consolidated Interest Charges
$22,073
$19,522
$22,061
$22,202
$21,546
(ii) Provision for Federal, state, local and foreign income taxes payable
$1,277
$0
$0
$5,988
$0
(iii) Depreciation and amortization expense
$51,012
$46,600
$50,493
$51,532
$52,522
(iv) Fees, costs and expenses incurred on or prior to the Acquisition Closing
Date in connection with the Acquisition and the financing thereof
$0
$0
$0
$0
$0
(v) Any cash restructuring charges and integration costs in connection with the
Acquisition, in an aggregate amount not to exceed $75,000,000
$204
$0
$0
$0
$0
(vi) Non-cash restructuring charges incurred in connection with the
Transaction, all as approved by Arrangers
$1,502
$1,084
$1,006
$930
$848
(vii) Other non-recurring expenses reducing such Consolidated Net Income
which do not represent a cash item in such period or any future period
(in each case of or by the Borrower and its Subsidiaries for such
Measurement Period) $8,783
($47)
$0
$574
$175
(viii) Any non-cash charges for stock compensation expense in compliance
with FAS 123R and amortization of the fair value of unvested options
under the Acquired Business’
employee stock option plan assumed by the Borrower
$21,523
$30,146
$24,682
$25,275
$19,906
(ix)
Legal fees and expenses relating to the Borrower’s indemnification
obligations for the benefit of its former officers and directors in
connection with its historical stock option litigation
$250
724
376
$22
$15
minus
(i)
Federal, state, local and foreign income tax credits
$0
($840)
($15,096)
$0
$5,717
(ii)
All non-cash items increasing Consolidated Net Income (in each case of or
by the Borrower and its Subsidiaries for such Measurement Period)
($3,036)
($3,127)
($4,026)
($2,212)
$1,995
Consolidated EBITDA
$154,683
$116,442
$101,457
$127,727
$114,479
4 Quarter Trailing Consolidated EBITDA
$523,861
$520,429
$502,567
$500,309
$460,105
Consolidated Senior Secured Debt
$1,041,483
$1,015,957
$989,803
$959,491
$919,312
Consolidated Senior Secured Leverage Ratio (x)
1.99
1.95
1.97
1.92
2.00
©
2011 Brocade Communications Systems, Inc.
Page 37 of 41 |
 Q1 2011 Cash and Debt Covenant
Adjusted EBITDA* Performance
(In Millions)
Strong Capital Structure
(In Millions)
Within Debt Covenant
Cash Balance**
(In Millions)
* Note: Adjusted EBITDA is as defined in the term debt credit
agreement ** Cash, equivalents and short term investments
©
2011 Brocade Communications Systems, Inc.
Page 38
of 41 |
 Domestic and International
Reported Revenue
Reported revenue on a ship-to basis
©
2011 Brocade Communications Systems, Inc.
Page 39 of 41 |
 Segment Revenue Detail
Product segment as a percent of revenue
* Reallocation of SAN common hardware altered historic SAN percentages
Q1 10
Q2 10
Q3 10
Q4 10
Q1 11
SAN Business
*
Directors
47%
40%
37%
39%
44%
Switches
41%
46%
49%
46%
41%
Server
12%
14%
14%
15%
15%
Ethernet Business
Chassis
61%
64%
65%
63%
58%
Stackables
39%
36%
35%
37%
42%
©
2011 Brocade Communications Systems, Inc.
Page 40
of 41 |
 Thank You
www.brcd.com
©
2011 Brocade Communications Systems, Inc.
Page 41 of 41 |