Attached files
| file | filename |
|---|---|
| 8-K - FORM 8-K - TOWER BANCORP INC | d8k.htm |
 Tower Bancorp, Inc.
Investor Presentation
First Quarter 2011
Exhibit 99.1 |
 ABOUT
THIS PRESENTATION 2
Safe Harbor Regarding Forward-Looking Statements
This presentation contains forward-looking statements that are intended to be covered by the safe
harbor for forward- looking statements provided by the Private Securities Litigation Reform
Act of 1995. Forward-looking statements are not statements of historical fact, and can
be identified by the use of forward-looking terminology such as “believe,” “expect,”
“may,” “will,” “should,” “project,” “plan,”
“seek,” “target,” “intend” or “anticipate” or the negative thereof or comparable
terminology. Forward-looking statements include discussions of strategy, financial projections
and estimates and their underlying assumptions, statements regarding plans, objectives,
expectations or consequences of various transactions, and statements about the future
performance, operations, products and services of Tower and our subsidiaries. These
forward-looking statements are subject to various assumptions, risks, uncertainties and other
factors including, but not limited to: a continuation or worsening of the current disruption in
credit and other markets; the ineffectiveness of Tower’s business strategy due to
changes in current or future market conditions; the effects of competition, and of changes in laws
and regulations on competition, including industry consolidation and development of competing
financial products and services; interest rate movements; the performance of
Tower’s investment portfolio; changes in rates of deposit and loan growth; asset
quality and the impact on assets from adverse changes in the economy and in credit or other markets and
resulting effects on credit risk and asset values; inability to achieve merger-related
synergies; difficulties in integrating distinct business operations, including information
technology; capital and liquidity strategies; and deteriorating economic
conditions. The foregoing review of important factors should be read in conjunction with the risk factors and
other cautionary statements included in documents filed by Tower Bancorp, Inc. with the Securities and
Exchange Commission, including Tower’s Quarterly Report on Form 10-Q, Annual Report on
Form 10-K and other required filings. Because of these uncertainties, risks and the possibility of changes in these assumptions, actual
results could differ materially from those expressed in any forward-looking statements.
Investors are cautioned not to place undue reliance on these statements. Tower Bancorp,
Inc. assumes no duty or obligation to update any forward-looking statements made in this
presentation. Non-GAAP Financial Measures
This presentation contains the non-GAAP financial measure, ratio of tangible common equity to
tangible assets. In order to calculate tangible common equity and tangible assets,
Tower’s management subtracts intangible assets from both common equity and assets.
Reconciliations of these non-GAAP measures to the most directly comparable GAAP measures are
set forth in the Appendix. |
 CORPORATE PROFILE
3
Corporate Overview
•
High growth community bank headquartered in
Harrisburg, PA
•
49 banking offices located primarily in central and
southeastern Pennsylvania
•
Major Business Lines
•
Small Business Banking
•
Retail Banking
•
Wealth Management
•
Not-for-profit Banking
Financial Highlights 12/31/2010 (unaudited)
Assets:
Deposits:
Loans:
TCE/TA (1)
Market Capitalization(2)
$2.7 billion
$2.3 billion
$2.1 billion
8.55%
$263 million
Source: Company Documents as of 12/31/2010
(1) This
measure is considered to be a Non-GAAP measure. Management uses
this ratio to assess the strength of the Tower Bancorp,
Inc.'s capital position. See the reconciliation of GAAP to Non-GAAP
measures in the appendix to this presentation. (2) Source: SNL Financial as
of January 28, 2011 |
 MISSION, VISION AND VALUES
4
Mission Statement
Tower Bancorp, Inc. will positively impact lives by helping people achieve their
dreams. Vision Statement
Tower Bancorp, Inc. will be a high performing financial services
company that creates
financial success for consumer, business, and not for profit customers in the markets
we choose to serve.
Value Statement
Tower Bancorp, Inc. is committed to attracting and retaining employees who are
passionate about providing uncompromising service to our customers with a sense of
warmth, integrity, friendliness, and company spirit. We value and
respect each other because we truly believe that our success only comes from
working together for our team’s success. |
 5
CORPORATE LEADERSHIP TEAM
Deep and proven management team with average experience of 25 years
|
 6
Potentially attractive growth and expansion opportunities
FOOTPRINT AND CURRENT GROWTH POTENTIAL
Note: Tower believes that a growth opportunity exists for the counties appropriately marked
above based on Tower’s close proximity to those counties, management’s
familiarity with the demographics and businesses and business leaders in those counties and Tower’s reputation in those counties.
1N Bank Division
Graystone Bank and Tower Bank Divisions
Growth Markets |
 7
BUSINESS STRATEGIES
High touch relationship management and exceptional service supported by
technology |
 8
ORGANIC GROWTH
Compelling
Organic
Growth
(1)
Source: FDIC Deposit Data as of 6/30/2010
(2)
Source: Company Documents- Growth % Year Ended 12/31/2010
Excludes $51.5 million participation purchased from First Chester and $24 million loan to First
Chester (both in 4th quarter of 2009). Also excludes loans and deposits acquired from
First Chester County Corporation. (3) Source: Company Documents–
Non-Interest Income Growth year ended 12/31/2010 vs. 12/31/2009 |
 9
•
November
14,
2005
de
novo
Graystone
Bank
opened
with
three
branches
in
Central
Pennsylvania
•
Raised
approximately
$65
million
of
total
capital
via
private
placement
•
Reached
over
$600
million
of
assets
with
9
branches
in
less
than
3
years
•
Achieved
net
income
of
$2.1
million
in
third
full
year
of
operation
2005
-
2008
2009
2010
•
Graystone
completed
a
merger
of
equals
transaction
on
March
31,
2009
with
First
National
Bank
of
Greencastle,
forming
Graystone
Tower
Bank
as
a
subsidiary
of
Tower
Bancorp,
Inc.
•
Immediately
following
the
merger,
Graystone
Tower
Bank
had
25
branches
and
over
$1.2
billion
in
assets
•
NASDAQ
Listed,
Symbol
TOBC
•
Successfully
raised
$57
million
in
public
common
stock
in
August
2009
•
Announced
acquisition
of
First
Chester
County
Corporation
on
December
28,
2009
•
Raised
$21
million
of
subordinated
debt
with
local
investors
in
2009
-
2010
•
Closed
the
First
Chester
County
Corporation
acquisition
on
December
10,
2010
•
Following
the
acquisition,
Graystone
Tower
Bank
has
49
branches,
$2.7
billion
of
assets
and
approximately
$550
million
of
assets
under
administration
•
Completed
$51.2
million
follow-on
common
equity
offering
in
December
2010
TIMELINE OF SIGNIFICANT CORPORATE EVENTS |
 10
BUILDING SHAREHOLDER VALUE |
 11
STRATEGIC GROWTH
•Focused on in-market and contiguous market opportunities
•Disciplined strategic initiative process
•Acquisition Factors
Accretive to EPS in the first year
Meets management IRR parameters
Single digit TBV dilution
Equal or better market demographics |
 12
ASSET GROWTH ($000) (1) (2)
Source: Company Documents as of 12/31/2010
(1)
All
financial
information
for
periods
prior
to
March
31,
2009
represents
historical
financials
for
Graystone
Financial
Corp.,
as
the
accounting
acquirer in the reverse merger with Tower Bancorp Inc.
(2) 2005 financial data reflects the period from September 2, 2005 (inception date)
to December 31, 2005 * unaudited |
 13
DEPOSIT GROWTH ($000) (1) (2)
Source: Company Documents as of 12/31/2010
(1)
All
financial
information
for
periods
prior
to
March
31,
2009
represents
historical
financials
for
Graystone
Financial
Corp.,
as
the
accounting
acquirer in the reverse merger with Tower Bancorp Inc.
(2) 2005 financial data reflects the period from September 2, 2005 (inception date)
to December 31, 2005 * unaudited |
 14
DEPOSIT COMPOSITION
Average Cost of Deposits
2009
2.07%
2010
1.46%
Source: Company Documents as of 12/31/2010 |
 15
DEPOSIT MARKET SHARE
Total
Total
Y/o/Y
Deposits
Market
Growth
Branch
in Market
Share
Rate
Rank
Institution
Count
($000)
(%)
(%)
1
Wells Fargo & Co.
78
6,513,295
11.7
8.0
2
PNC Financial Services Group Inc.
107
5,666,891
10.1
9.6
3
Fulton Financial Corp.
90
4,841,048
8.7
10.8
4
M&T Bank Corp.
110
4,434,564
7.9
6.8
5
Susquehanna Bancshares Inc.
97
4,063,957
7.3
8.5
6
Royal Bank of Scotland Group Plc
73
3,751,832
6.7
(3.4)
7
Banco Santander SA
76
2,690,507
4.8
(8.7)
8
Tower Bancorp Inc.
49
2,304,356
4.1
12.7
9
Toronto-Dominion Bank
26
2,264,615
4.1
5.9
10
Metro Bancorp Inc.
28
1,656,459
3.0
6.1
11
National Penn Bancshares Inc.
29
1,606,095
2.9
(0.3)
12
Orrstown Financial Services Inc.
16
989,223
1.8
42.0
13
Citigroup Inc.
4
901,480
1.6
(16.0)
14
Codorus Valley Bancorp Inc.
21
737,574
1.3
9.2
15
Franklin Financial Services Corp.
27
719,704
1.3
3.1
Total (1-15)
831
43,141,600
77.2
Total (1-85)
1,176
55,870,422
100.0
o
Tower Ranks:
o
8th overall in deposit market share in its counties of operation
o
3rd in total deposit market share, excluding companies with greater than $20
billion in assets o
Significant
opportunities
exist
to
gain
share
within
our
current
markets
Source: SNL Financial
Deposits as of June 30, 2010; Tower deposits and branches pro forma for First
Chester County Corporation acquisition. All other companies pro forma
for pending acquisitions. |
 16
LOAN GROWTH ($000) (1) (2)
Source: Company Documents as of 12/31/2010
(1)
All
financial
information
for
periods
prior
to
March
31,
2009
represents
historical
financials
for
Graystone
Financial
Corp.,
as
the
accounting
acquirer in the reverse merger with Tower Bancorp Inc.
(2) 2005 financial data reflects the period from September 2, 2005 (inception date)
to December 31, 2005 * unaudited |
 17
LOAN COMPOSITION
Loan Detail
Balance ($000)
% of Portfolio
Commercial:
Industrial
$916,360
44%
Real Estate
$441,243
21%
Construction
$185,424
9%
Consumer:
Home Equity
$196,498
9%
Other
$52,412
3%
Residential Mortgage
$279,944
14%
Total Loans
$2,071,881
Source: Company Documents as of 12/31/2010 |
 18
STRONG CREDIT METRICS
Source: Company Documents as of 12/31/2010 and SNL Financial
Note:
Peer
Group
LTM
ended
9/30/2010
and
Tower
Bancorp
LTM
ended
12/31/2010
(unaudited).
Peer
group
companies
are
set
forth
in
the Appendix to this presentation |
 19
STRONG CREDIT METRICS
Source: Company Documents as of 12/31/2010 and SNL Financial
Note:
Peer
Group
LTM
ended
9/30/2010
and
Tower
Bancorp
LTM
ended
12/31/2010
(unaudited).
Peer
group
companies
are
set
forth
in
the
Appendix to this presentation |
 20
NON-INTEREST INCOME
($000) (1) (2)
Source: Company Documents as of 12/31/2010
(1)
All
financial
information
for
periods
prior
to
March
31,
2009
represents
historical
financials
for
Graystone
Financial
Corp.,
as
the
accounting
acquirer in the reverse merger with Tower Bancorp Inc.
(2) 2005 financial data reflects the period from September 2, 2005 (inception date)
to December 31, 2005 * unaudited |
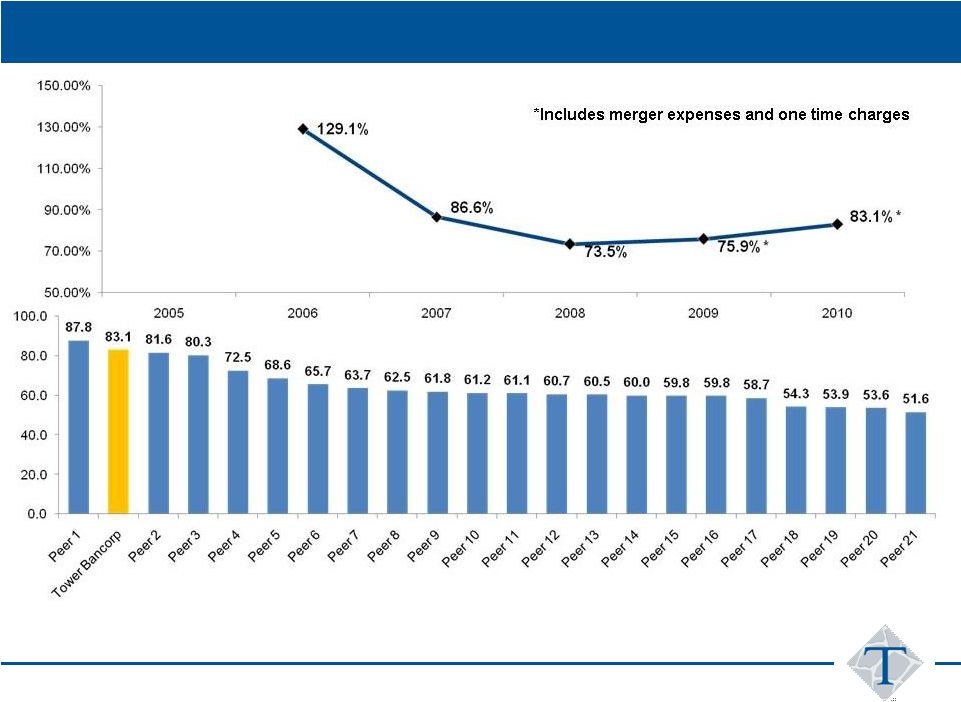 21
FUTURE EFFICIENCY IMPROVEMENT
Source: Company Documents as of 12/31/2010 and SNL Financial
(1) All financial information for periods prior to March 31, 2009 represents historical financials for
Graystone Financial Corp., as the accounting acquirer in the reverse merger (2) Efficiency ratio
is calculated as total non-interest expense divided by the total of net interest income and non-interest income.
Note: Peer Group LTM ended 9/30/2010 and Tower Bancorp LTM ended 12/31/2010 (unaudited). Peer
group companies are set forth in the Appendix to this presentation |
 22
NET INTEREST MARGIN (1) (2)
Source: Company Documents as of 12/31/2010
(1)
All
financial
information
for
periods
prior
to
March
31,
2009
represents
historical
financials
for
Graystone
Financial
Corp.,
as
the
accounting
acquirer in the reverse merger
(2) 2005 financial data reflects the period from September 2, 2005 (inception date)
to December 31, 2005 * unaudited |
 23
FIVE QUARTER REVENUE TREND ($000,000)
4Q09
1Q10
2Q10
3Q10
4Q10
% Chg.
4Q10/
3Q10
%Chg.
4Q10/
4Q09
Net Interest Income
11.26
12.05
12.90
13.37
16.35
22.3
45.2
Total Noninterest
Income
3.32
2.00
2.49
3.08
4.01
30.2
20.8
Total Revenue
14.59
14.05
15.40
16.45
20.36
23.8
39.6
Net Interest Margin (%)
3.53
3.62
3.73
3.64
3.83
19 bps
30 bps
Source: Company Documents as of 12/31/2010 |
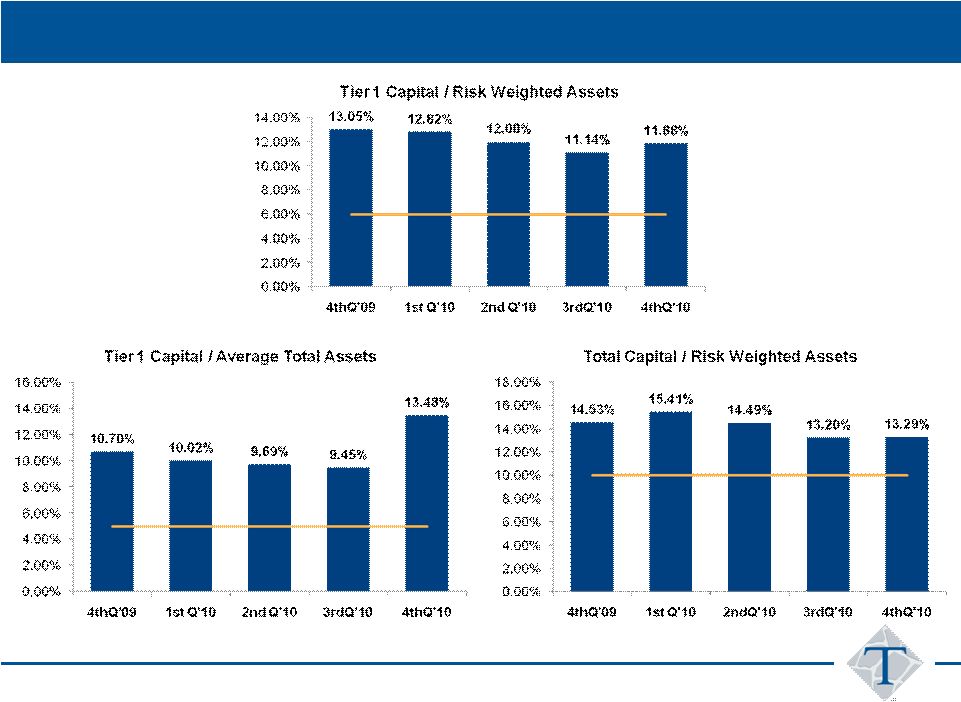 STRONG CAPITAL STRUCTURE
No TARP Funding
24
Source: Company Documents as of 12/31/2010 |
 25
INVESTMENT MERITS
•
Deep and broad management team with extensive in-market experience
•
Successful and proven growth strategy
•
Diversified
credit
portfolio
with
a
conservative
focus
on
credit
quality
•
Significant franchise value
•
First Chester acquisition offers significant anticipated EPS accretion
|
 THANK YOU! |
 APPENDIX |
 28
REGIONAL PEER GROUP COMPANIES
First Financial Bancorp
First Commonwealth Financial Corporation
NBT Bancorp Inc.
Community Bank System, Inc.
S&T Bancorp, Inc.
Sandy Spring Bancorp, Inc.
TowneBank
Sun Bancorp, Inc.
Carter Bank & Trust
Tompkins Financial Corporation
StellarOne Corporation
Hampton Roads Bankshares, Inc.
Virginia Commerce Bancorp, Inc.
Lakeland Bancorp, Inc.
Hudson Valley Holding Corp.
Union First Market Bankshares Corporation
First Community Bancshares, Inc.
Sterling Bancorp
Metro Bancorp, Inc.
Univest Corporation of Pennsylvania
Financial Institutions, Inc. |
 29
FINANCIAL HIGHLIGHTS ($000)
Source: Company Documents as of 12/31/2010
(1) 4Q 2010 was a merger quarter which included purchase accounting adjustments as
well as merger expenses, restructuring charges and operating losses
associated with discontinuing the operations of the American Home Bank
Division. (2) Does not include the impact of purchase accounting loan
marks 4Q
2009
1Q
2010
2Q
2010
3Q
2010
4Q
2010(1)
Year End
2010
Assets
$1,470,583
$1,542,172
$1,588,079
$1,618,841
$2,747,161
$2,747,161
Loans Receivable
$1,138,460
$1,162,212
$1,216,335
$1,321,647
$2,071,881
$2,071,881
Deposits
$1,216,469
$1,276,501
$1,322,342
$1,355,717
$2,299,898
$2,299,898
Shareholder’s Equity
$163,877
$164,387
$165,343
$165,794
$256,664
$256,664
Net Income
$2,056
$1,905
$1,177
$2,502
$(4,512)
$1,072
EPS
$0.29
$0.27
$0.17
$0.35
$(0.56)
$0.15
Net Interest Margin
3.53%
3.62%
3.73%
3.64%
3.83%
3.71%
NPA/Assets
0.53%
0.85%
0.83%
1.00%
0.86%
0.86%
Loan Loss Reserve/Gross Loans
(2)
0.85%
0.94%
0.95%
0.96%
0.65%
0.65%
Total Risk Based Capital Ratio
14.53%
15.41%
14.49%
13.18%
13.29%
13.29% |
 30
NON-GAAP FINANCIAL RECONCILIATION
Tower believes the presentation of these non-GAAP financial measures provide
useful supplemental information that is essential to an investor’s
proper understanding of the operating results of Tower’s core businesses. Our management
uses these non-GAAP financial measures in their analysis of our
performance. These non-GAAP disclosures should not be viewed as a
substitute for financial measures determined in accordance with GAAP, nor are they necessarily
comparable to non-GAAP performance measures that may be presented by other
companies. Reconciliations of GAAP to non-GAAP measures are included in
the table below. Source: Company Documents as of 12/31/2010
December 31,
2010
Reconciliation of Non-GAAP Balance Sheet Data:
Total assets - GAAP
2,747,161
$
Less:
Goodwill and other intangible assets 23,679
Total tangible assets - Non-GAAP
2,723,482
$
Total
Stockholders' equity - GAAP 256,664
$
Less: Goodwill and other intangible assets
23,679
Tangible equity - Non-GAAP
232,985
$
Tower Bancorp, Inc. and Subsidiary
Reconciliation of GAAP to Non-GAAP Measures
(Dollars in thousands, except share data and ratios)
(Unaudited)
December 31,
2010
Capital Ratios:
Total equity to total assets - GAAP
9.34%
Effect of intangible assets
-0.79%
Tangible common equity to tangible assets -Non-GAAP
8.55% |