Attached files
| file | filename |
|---|---|
| 8-K - 8-K - Information Services Group Inc. | a11-5759_28k.htm |
Exhibit 99.1
|
|
NASDAQ: III Deutsche Bank Small and Mid-Cap Growth Conference February 15, 2011 Michael P. Connors, Chairman & CEO David E. Berger, Executive Vice President & CFO |
|
|
Forward-Looking Statement This communication contains “forward-looking statements” which represent the current expectations and beliefs of management of ISG concerning future events and their potential effects. Statements contained herein including words such as “anticipate,” “believe,” “contemplate,” “plan,” “estimate,” “expect,” “intend,” “will,” “continue,” “should,” “may,” and other similar expressions, are “forward-looking statements” under the Private Securities Litigation Reform Act of 1995. These forward-looking statements are not guarantees of future results and are subject to certain risks and uncertainties that could cause actual results to differ materially from those anticipated. Those risks relate to inherent business, economic and competitive uncertainties and contingencies relating to the businesses of ISG and its subsidiaries including without limitation: (1) failure to secure new engagements or loss of important clients; (2) ability to hire and retain enough qualified employees to support operations; (3) ability to maintain or increase billing and utilization rates; (4) management of growth; (5) success of expansion internationally; (6) competition; (7) ability to move the product mix into higher margin businesses; (8) general political and social conditions such as war, political unrest and terrorism; (9) healthcare and benefit cost management; (10) ability to protect ISG and its subsidiaries’ intellectual property and the intellectual property of others; (11) currency fluctuations and exchange rate adjustments; (12) ability to successfully consummate or integrate strategic acquisitions; (13) financial condition of various clients in the financial, automotive and transportation sectors which account for significant portions of ISG’s revenues and may maintain sizable accounts receivables with ISG; and (14) ability to achieve cost reductions and productivity improvements in any future value creation plans. Certain of these and other applicable risks, cautionary statements and factors that could cause actual results to differ from ISG’s forward-looking statements are included in ISG’s filings with the U.S. Securities and Exchange Commission. ISG undertakes no obligation to update or revise any forward-looking statements to reflect subsequent events or circumstances. |
|
|
Agenda ISG Overview and Recent Developments TPI + Compass + STA Investment Thesis Questions and Answers |
|
|
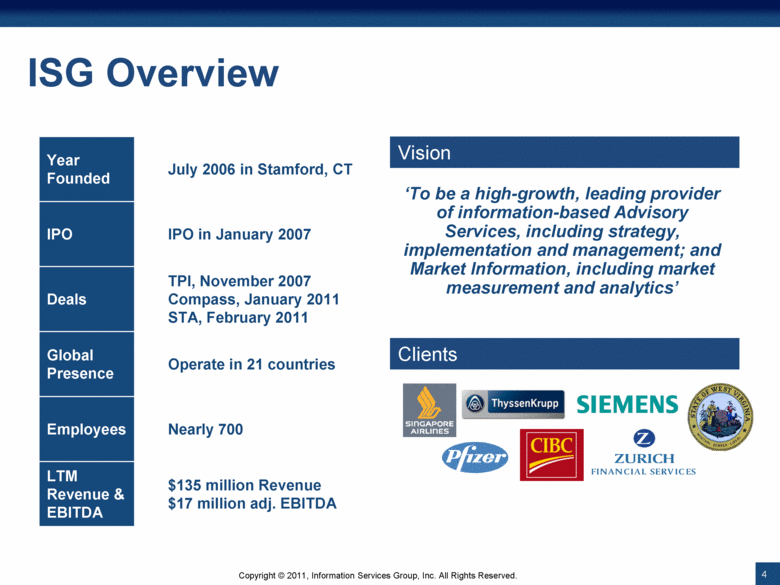
ISG Overview Year Founded July 2006 in Stamford, CT IPO IPO in January 2007 Deals TPI, November 2007 Compass, January 2011 STA, February 2011 Global Presence Operate in 21 countries Employees Nearly 700 LTM Revenue & EBITDA $135 million Revenue $17 million adj. EBITDA ‘To be a high-growth, leading provider of information-based Advisory Services, including strategy, implementation and management; and Market Information, including market measurement and analytics’ Vision Clients |
|
|
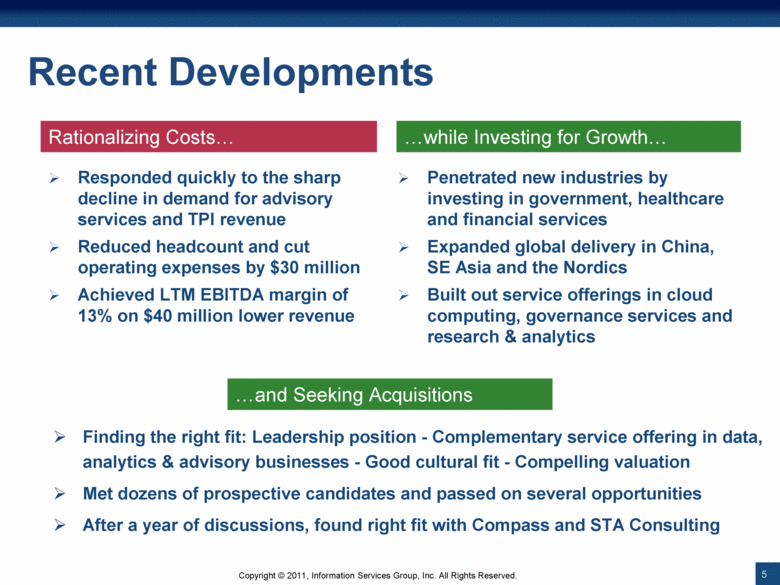
Recent Developments Responded quickly to the sharp decline in demand for advisory services and TPI revenue Reduced headcount and cut operating expenses by $30 million Achieved LTM EBITDA margin of 13% on $40 million lower revenue Penetrated new industries by investing in government, healthcare and financial services Expanded global delivery in China, SE Asia and the Nordics Built out service offerings in cloud computing, governance services and research & analytics Rationalizing Costs while Investing for Growth and Seeking Acquisitions Finding the right fit: Leadership position - Complementary service offering in data, analytics & advisory businesses - Good cultural fit - Compelling valuation Met dozens of prospective candidates and passed on several opportunities After a year of discussions, found right fit with Compass and STA Consulting |
|
|
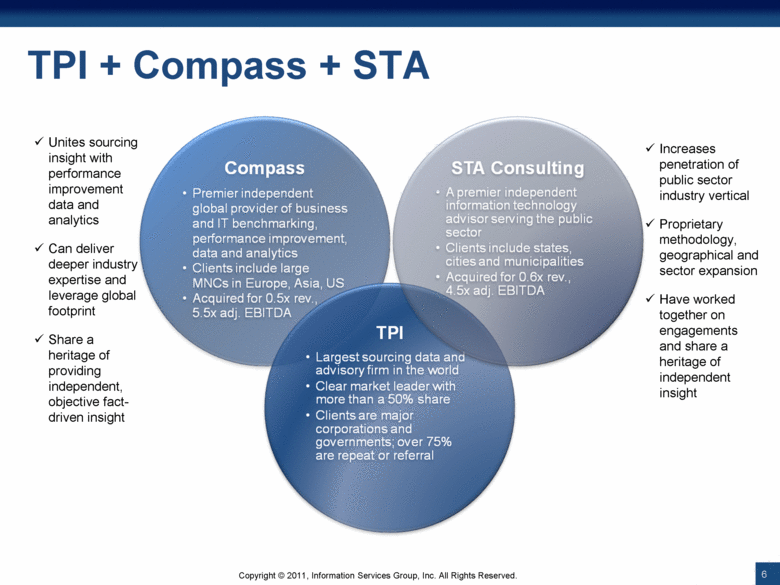
TPI + Compass + STA Unites sourcing insight with performance improvement data and analytics Can deliver deeper industry expertise and leverage global footprint Share a heritage of providing independent, objective fact-driven insight Increases penetration of public sector industry vertical Proprietary methodology, geographical and sector expansion Have worked together on engagements and share a heritage of independent insight |
|
|
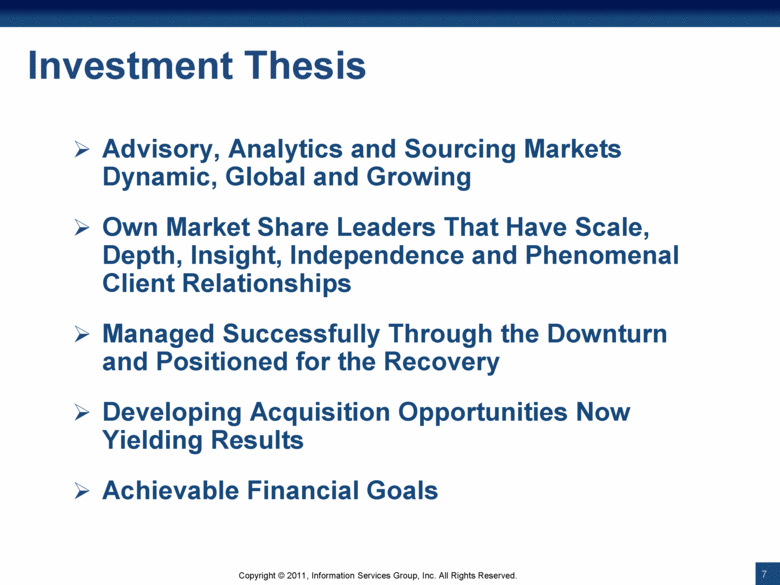
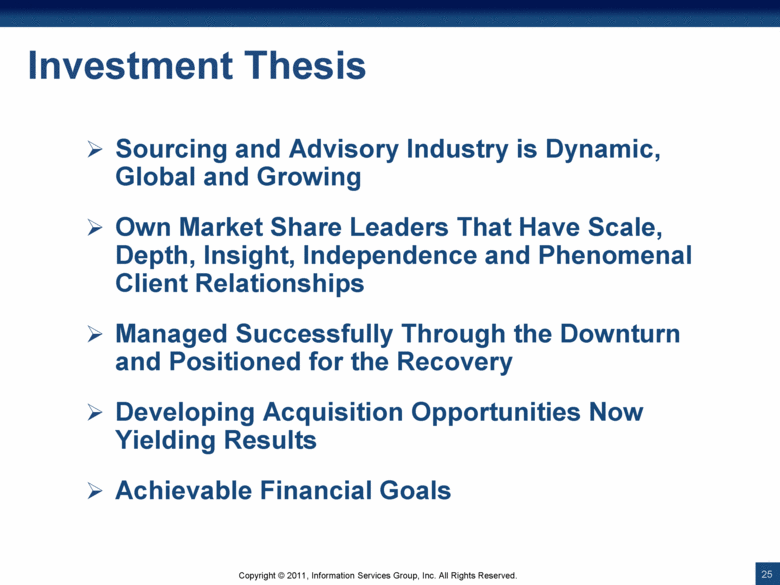
Investment Thesis Advisory, Analytics and Sourcing Markets Dynamic, Global and Growing Own Market Share Leaders That Have Scale, Depth, Insight, Independence and Phenomenal Client Relationships Managed Successfully Through the Downturn and Positioned for the Recovery Developing Acquisition Opportunities Now Yielding Results Achievable Financial Goals |
|
|
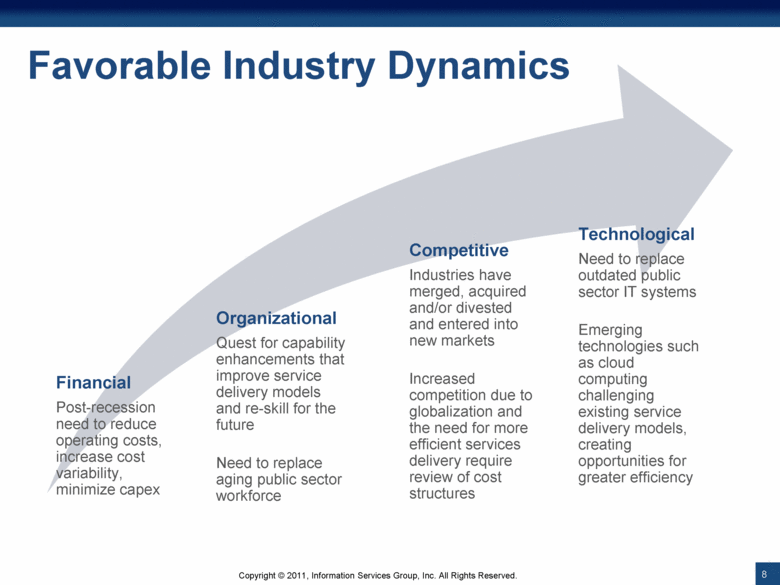
Favorable Industry Dynamics Financial Post-recession need to reduce operating costs, increase cost variability, minimize capex Organizational Quest for capability enhancements that improve service delivery models and re-skill for the future Need to replace aging public sector workforce Competitive Industries have merged, acquired and/or divested and entered into new markets Increased competition due to globalization and the need for more efficient services delivery require review of cost structures Technological Need to replace outdated public sector IT systems Emerging technologies such as cloud computing challenging existing service delivery models, creating opportunities for greater efficiency |
|
|
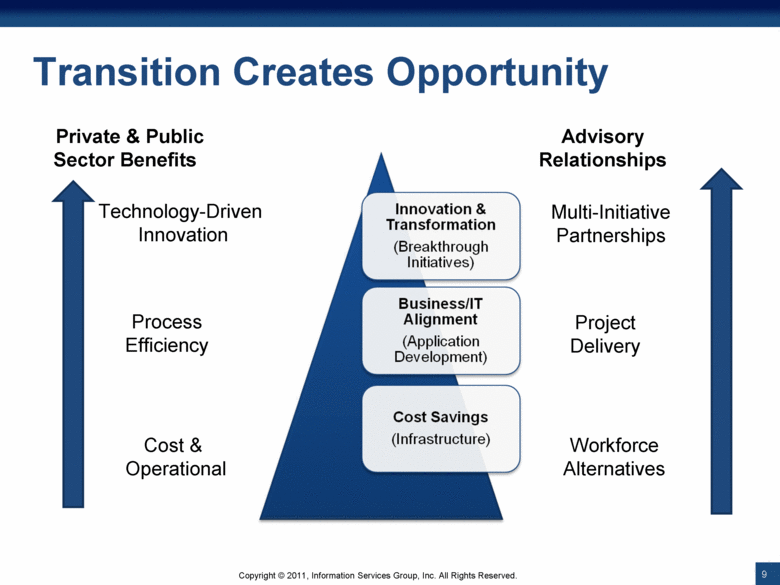
Transition Creates Opportunity Private & Public Sector Benefits Advisory Relationships Cost & Operational Process Efficiency Multi-Initiative Partnerships Technology-Driven Innovation Project Delivery Workforce Alternatives |
|
|
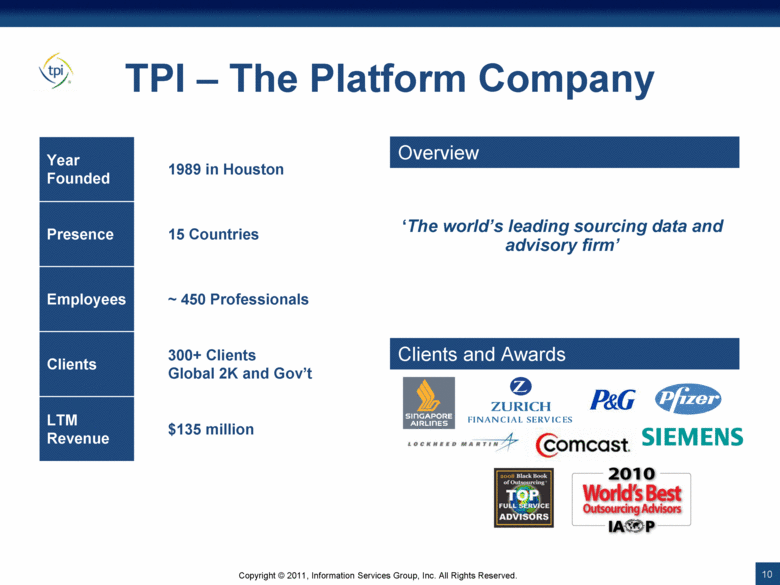
TPI – The Platform Company Year Founded 1989 in Houston Presence 15 Countries Employees ~ 450 Professionals Clients 300+ Clients Global 2K and Gov’t LTM Revenue $135 million ‘The world’s leading sourcing data and advisory firm’ Overview Clients and Awards |
|
|
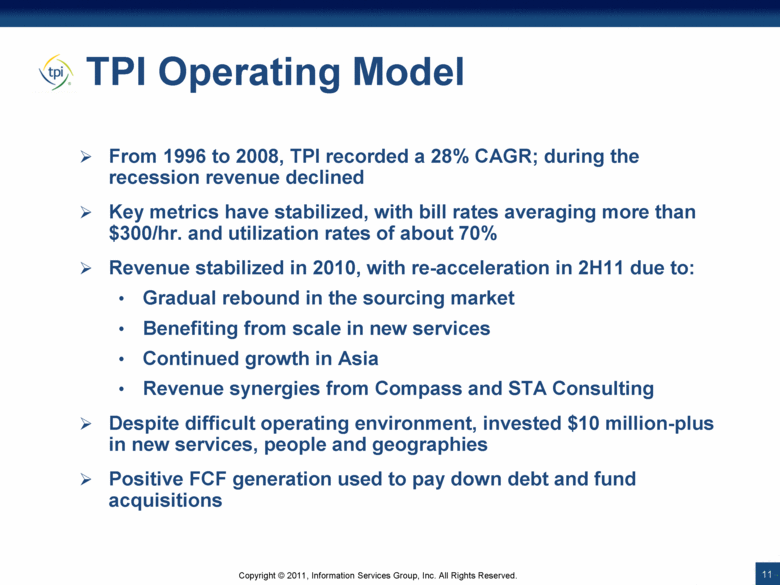
TPI Operating Model From 1996 to 2008, TPI recorded a 28% CAGR; during the recession revenue declined Key metrics have stabilized, with bill rates averaging more than $300/hr. and utilization rates of about 70% Revenue stabilized in 2010, with re-acceleration in 2H11 due to: Gradual rebound in the sourcing market Benefiting from scale in new services Continued growth in Asia Revenue synergies from Compass and STA Consulting Despite difficult operating environment, invested $10 million-plus in new services, people and geographies Positive FCF generation used to pay down debt and fund acquisitions |
|
|
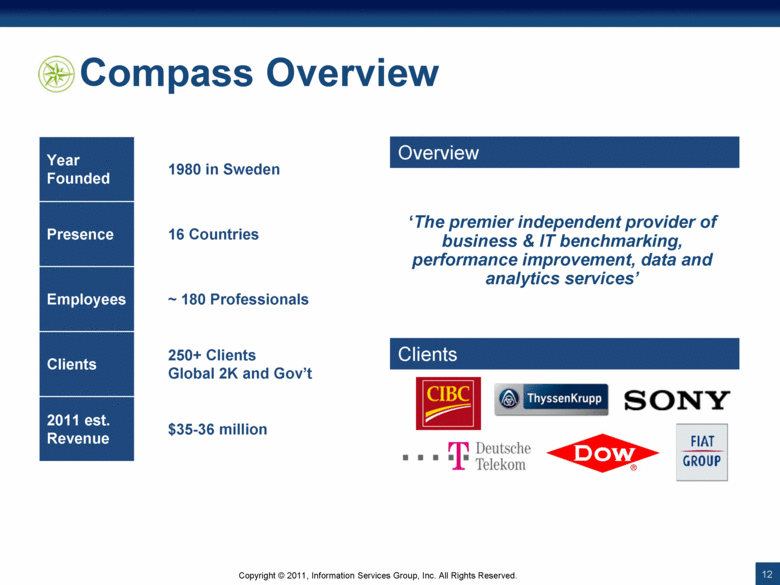
Compass Overview Year Founded 1980 in Sweden Presence 16 Countries Employees ~ 180 Professionals Clients 250+ Clients Global 2K and Gov’t 2011 est. Revenue $35-36 million ‘The premier independent provider of business & IT benchmarking, performance improvement, data and analytics services’ Overview Clients |
|
|
Compass Operating Model Prior to slowdown, Compass grew revenue in the double-digits While revenue declined during the recession, growth is expected to re-accelerate to mid-single digits in 2011 due to: Increased demand for benchmarking services Growth in Asia Pacific, U.S., Nordics Revenue synergies from TPI and STA Consulting Pre-acquisition, Compass recorded break-even EBITDA margins Compass leadership and former investor own more than 10% of ISG shares |
|
|
Compass Synergies Unites sourcing insight with a content database of best-performance and industry-specific assets Complementary industry focus (IT, Insurance, Mortgage Processing and Corporate Benefits) fits with the TPI Manufacturing and Financial Services verticals and STA Consulting public-sector focus Additional data access for TPI and STA Consulting; new data sources for Compass Expansion opportunities in the United States through TPI and into governments through STA Consulting Cost synergies driven by consolidating shared services |
|
|
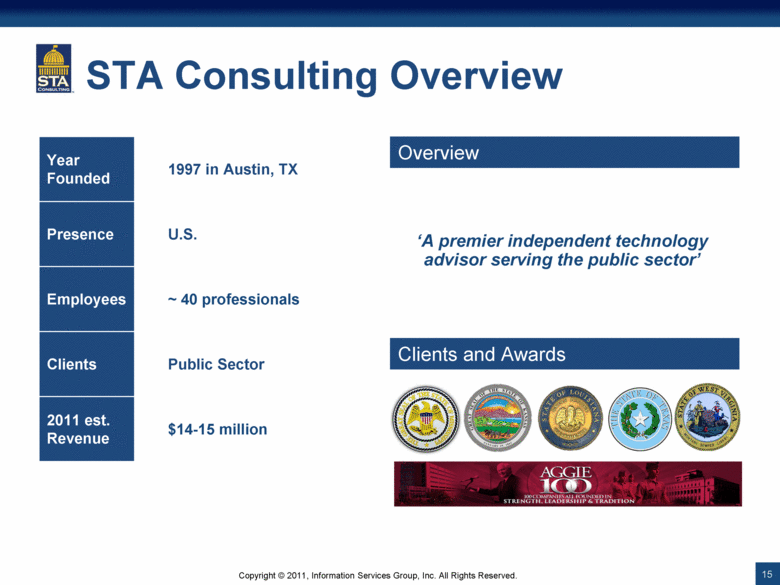
STA Consulting Overview Year Founded 1997 in Austin, TX Presence U.S. Employees ~ 40 professionals Clients Public Sector 2011 est. Revenue $14-15 million ‘A premier independent technology advisor serving the public sector’ Overview Clients and Awards |
|
|
STA Consulting Operating Model STA has delivered double-digit top line growth despite resource constraints Bill rates average ~$175/hr., utilization rates of more than 80% and historically low turnover While revenue growth is expected to slow in 2011 due to the completion of a large client project, STA has several avenues of growth: Adding new public sector clients in new geographies Expanding into non-ERP services Developing private sector client opportunities High revenue visibility generated by long-term, multi-year engagements Unique operating model with strong double-digit EBITDA margins Strong FCF due to low DSOs; balance sheet is debt free |
|
|
STA Consulting Synergies STA Consulting immediately strengthens the public sector vertical, a key focus for ISG Highly complementary geographic footprint STA Consulting can develop and grow its advisory practice into the commercial sector through TPI and Compass Compass can capture the STA Consulting benchmarking data to enhance and extend its performance analytics database to include the public sector Great cultural fit as TPI and STA Consulting have worked together on prior engagements |
|
|
The Opportunity Favorable Industry Dynamics Three Great Go-to-Market Brands Offering Unique Characteristics to Penetrate Industry Substantial Top Line Growth Potential Groundwork Laid for Very Strong Second Half |
|
|
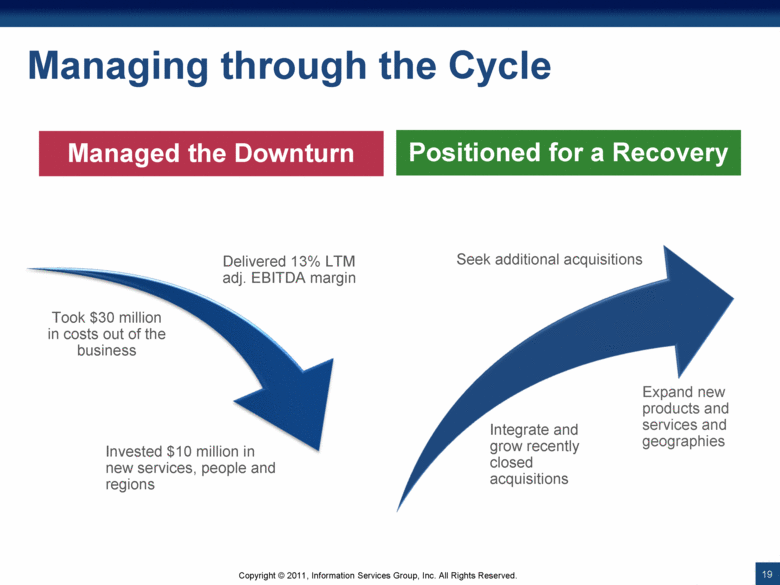
Took $30 million in costs out of the business Delivered 13% LTM adj. EBITDA margin Invested $10 million in new services, people and regions Managing through the Cycle Managed the Downturn Positioned for a Recovery Integrate and grow recently closed acquisitions Expand new products and services and geographies Seek additional acquisitions |
|
|
Acquisition Strategy Participated in dozens of discussions with potential partners over the last two years Remain highly selective, seeking complementary firms with proprietary data or new capabilities that have strong brands and are well-known to us and are attractively priced Long lead times, but results are worth it. Continue to have discussions; deal pipelines are favorable Continued interest in ISG as a partner |
|
|
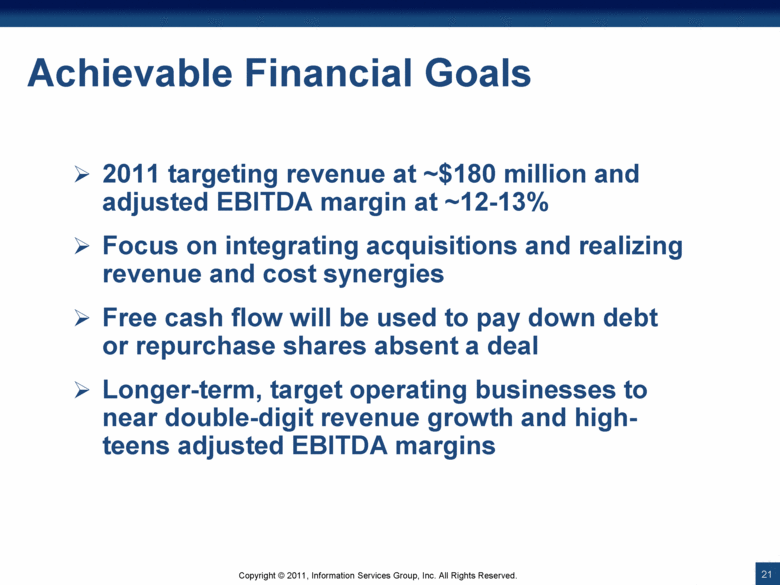
Achievable Financial Goals 2011 targeting revenue at ~$180 million and adjusted EBITDA margin at ~12-13% Focus on integrating acquisitions and realizing revenue and cost synergies Free cash flow will be used to pay down debt or repurchase shares absent a deal Longer-term, target operating businesses to near double-digit revenue growth and high-teens adjusted EBITDA margins |
|
|
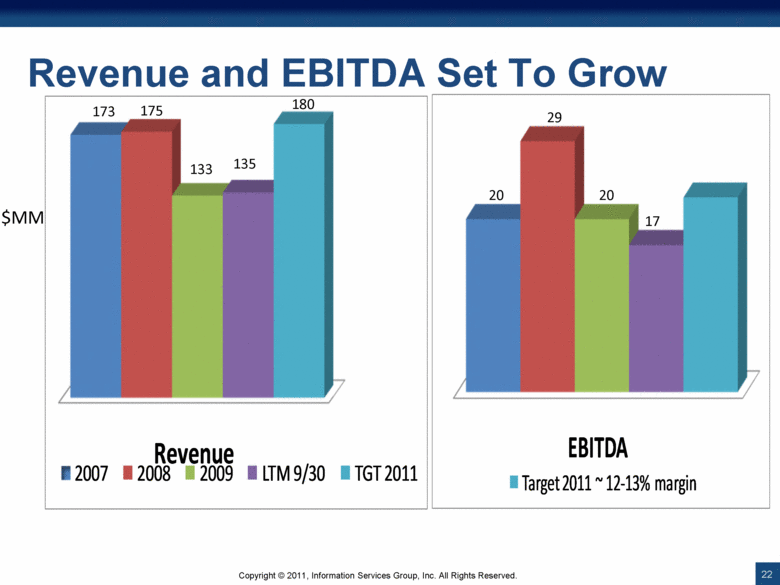
Revenue and EBITDA Set To Grow $MM 173 175 133 135 180 20 29 20 17 Revenue 2007 2008 2009 LTM 9/30 TGT 2011 EBITDA Target 2011 ~ 12 - 13% margin |
|
|
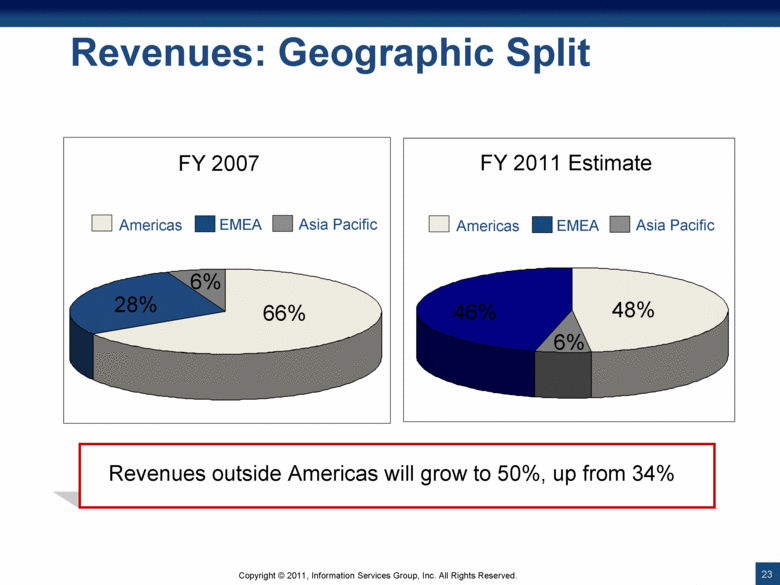
Revenues: Geographic Split Americas EMEA Asia Pacific Americas EMEA Asia Pacific FY 2007 FY 2011 Estimate 6% 48% 46% 6% 66% 28% Revenues outside Americas will grow to 50%, up from 34% |
|
|
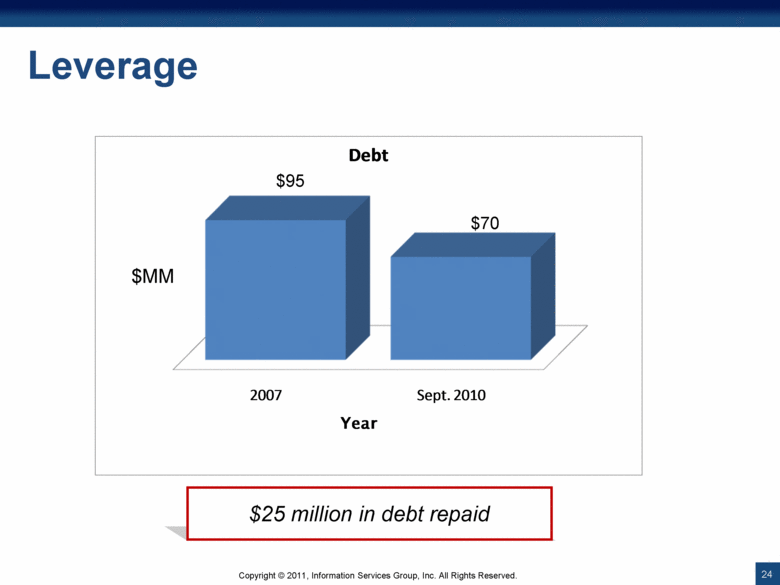
Leverage $95 $70 $25 million in debt repaid $MM 2007 Sept. 2010 Year Debt |
|
|
Investment Thesis Sourcing and Advisory Industry is Dynamic, Global and Growing Own Market Share Leaders That Have Scale, Depth, Insight, Independence and Phenomenal Client Relationships Managed Successfully Through the Downturn and Positioned for the Recovery Developing Acquisition Opportunities Now Yielding Results Achievable Financial Goals |
|
|
NASDAQ: III |

