Attached files
| file | filename |
|---|---|
| EX-31.2 - EXHIBIT 31.2 - Information Services Group Inc. | a2197102zex-31_2.htm |
| EX-24.1 - EXHIBIT 24.1 - Information Services Group Inc. | a2197102zex-24_1.htm |
| EX-32.1 - EXHIBIT 32.1 - Information Services Group Inc. | a2197102zex-32_1.htm |
| EX-31.1 - EXHIBIT 31.1 - Information Services Group Inc. | a2197102zex-31_1.htm |
| EX-23.1 - EXHIBIT 23.1 - Information Services Group Inc. | a2197102zex-23_1.htm |
| EX-32.2 - EXHIBIT 32.2 - Information Services Group Inc. | a2197102zex-32_2.htm |
Use these links to rapidly review the document
TABLE OF CONTENTS
TABLE OF CONTENTS 2
UNITED STATES
SECURITIES AND EXCHANGE COMMISSION
Washington D.C. 20549
FORM 10-K
| (Mark One) | ||
ý |
ANNUAL REPORT PURSUANT TO SECTION 13 OR 15(d) OF THE SECURITIES EXCHANGE ACT OF 1934 |
|
For the fiscal year ended December 31, 2009 |
||
Or |
||
o |
TRANSITION REPORT PURSUANT TO SECTION 13 OR 15(d) OF THE SECURITIES EXCHANGE ACT OF 1934 |
|
For the transition period from to |
||
Commission File Number 001-33287
Information Services Group, Inc.
(Exact name of registrant as specified in its charter)
| Delaware (State of Incorporation) |
20-5261587 (I.R.S. Employer Identification Number) |
Two Stamford Plaza
281 Tresser Boulevard
Stamford, CT 06901
(Address of principal executive offices and zip code)
Registrant's telephone number, including area code: (203) 517-3100
Securities registered pursuant to Section 12(b) of the Act:
| Title of each class | Name of each exchange on which registered | |
|---|---|---|
| Units | The NASDAQ Stock Market LLC | |
| Shares of Common Stock, $0.001 par value | The NASDAQ Stock Market LLC | |
| Warrants | The NASDAQ Stock Market LLC |
Securities registered pursuant to Section 12(g) of the Act: None
Indicate by check mark if the registrant is a well-known seasoned issuer, as defined in Rule 405 of the Securities Act. Yes o No ý
Indicate by check mark if the registrant is not required to file reports pursuant to Section 13 or Section 15(d) of the Act. Yes o No ý
Indicate by check mark whether the registrant: (1) has filed all reports required to be filed by Section 13 or 15(d) of the Securities Exchange Act of 1934 during the preceding 12 months (or for such shorter period that the registrant was required to file such reports), and (2) has been subject to such filing requirements for the past 90 days. Yes ý No o
Indicate by check mark whether the registrant has submitted electronically and posted on its corporate Web site, if any, every Interactive Data File required to be submitted and posted pursuant to Rule 405 of Regulation S-T (§ 232.405 of this chapter) during the preceding 12 months (or for such shorter period that the registrant was required to submit and post such files). Yes o No o
Indicate by check mark if disclosure of delinquent filers pursuant to Item 405 of Regulation S-K is not contained herein, and will not be contained, to the best of registrant's knowledge, in definitive proxy or information statements incorporated by reference in Part III of this Form 10-K or any amendment to this Form 10-K. o
Indicate by check mark whether the registrant is a large accelerated filer, an accelerated filer, a non-accelerated filer, or a smaller reporting company. See the definitions of "large accelerated filer", "accelerated filer" and "smaller reporting company" in Rule 12b-2 of the Exchange Act. (Check one):
| Large accelerated filer o | Accelerated filer ý | Non-accelerated filer o (Do not check if a smaller reporting company) |
Smaller reporting company o |
Indicate by check mark whether the registrant is a shell company (as defined in Rule 12b-2 of the Exchange Act). Yes o No ý
The aggregate market value of the voting common stock, par value $0.001 per share, held by non-affiliates of the registrant computed by reference to the closing sales price for the registrant's common stock on June 30, 2009, as reported on the NASDAQ Stock Market was approximately $77,094,432.
In determining the market value of the voting stock held by any non-affiliates, shares of common stock of the registrant beneficially owned by directors, officers and other holders of non-publicly traded shares of common stock of the registrant have been excluded. This determination of affiliate status is not necessarily a conclusive determination for other purposes.
As of February 26, 2010, the registrant had outstanding 31,952,398 shares of common stock, par value $0.001 per share.
Documents Incorporated by Reference
| Document Description | 10-K Part | |
|---|---|---|
| Portions of the Proxy Statement for the 2010 Annual Meeting of Stockholders (the "Proxy Statement"), to be filed within 120 days of the end of the fiscal year ended December 31, 2009, are incorporated by reference in Part III hereof. Except with respect to information specifically incorporated by reference in this Form 10-K, the Proxy Statement is not deemed to be filed as part hereof. | III (Items 10, 11, 12, 13, 14) |
2
Information services group ('ISG") believes that some of the information in this Annual Report on Form 10-K constitutes forward-looking statements. You can identify these statements by forward-looking words such as "may," "expect," "anticipate," "contemplate," "believe," "estimate," "intends" and "continue" or similar words. You should read statements that contain these words carefully because they:
- •
- discuss future expectations;
- •
- contain projections of future results of operations or financial condition; or
- •
- state other "forward-looking" information.
These forward-looking statements include, but are not limited to, statements relating to:
- •
- ability to retain existing clients and contracts;
- •
- ability to win new clients and engagements;
- •
- ability to implement cost reductions and productivity improvements;
- •
- beliefs about future trends in the sourcing industry;
- •
- expected spending on sourcing services by clients;
- •
- foreign currency exchange rates;
- •
- effective tax rate; and
- •
- competition in the sourcing industry.
ISG believes it is important to communicate its expectations to its stockholders. However, there may be events in the future that ISG is not able to predict accurately or over which it has no control. The risk factors and cautionary language discussed in this annual report provide examples of risks, uncertainties and events that may cause actual results to differ materially from the expectations in such forward-looking statements, including among other things:
- •
- the amount of cash on hand;
- •
- business strategy;
- •
- cost reductions and productivity improvements may not be fully realized or realized within the expected time frame;
- •
- continued compliance with government regulations;
- •
- legislation or regulatory environments, requirements or changes adversely affecting the business in which ISG is engaged;
- •
- fluctuations in client demand;
- •
- management of growth;
- •
- ability to grow the business and effectively manage growth and international operations while maintaining effective
internal controls;
- •
- ISG's relative dependence on clients which operate in the automotive sector (including its largest client) and in
financial services;
- •
- ability to hire and retain enough qualified employees to support operations;
- •
- increases in wages in locations in which ISG has operations;
3
- •
- ability to retain senior management;
- •
- fluctuations in exchange rates between the U.S. dollar and foreign currencies;
- •
- ability to attract and retain clients and the ability to develop and maintain client relationships based on attractive
terms;
- •
- legislation in the United States or elsewhere that adversely affects the performance of sourcing services offshore;
- •
- increased competition in the sourcing industry;
- •
- telecommunications or technology disruptions or breaches, or natural or other disasters;
- •
- ability to protect ISG intellectual property and the intellectual property of others;
- •
- the international nature of ISG's business;
- •
- political or economic instability in countries where ISG has operations;
- •
- worldwide political, economic and business conditions; and
- •
- ability to successfully consummate or integrate strategic acquisitions.
You are cautioned not to place undue reliance on these forward-looking statements, which speak only as of the date of this Annual Report.
All forward-looking statements included herein attributable to us or any person acting on our behalf are expressly qualified in their entirety by the cautionary statements contained or referred to in this section. Except to the extent required by applicable laws and regulations, we undertake no obligation to update these forward-looking statements to reflect events or circumstances after the date of this Annual Report or to reflect the occurrence of unanticipated events.
This Annual Report also contains forward-looking statements attributed to third parties relating to their estimates of the growth of our markets. Although we believe that the expectations reflected in the forward-looking statements are reasonable, we cannot guarantee future results, levels of activity, performance or achievements. Forward-looking statements contained in this Annual Report speak only as of the date of this Annual Report. Unless required by law, we undertake no obligation to update or revise any forward-looking statements, whether as a result of new information, future events or otherwise. You should, however, review the risks and uncertainties we describe in the reports we will file from time to time with the SEC after the date of this Annual Report.
4
As used herein, unless the context otherwise requires, ISG, the registrant, is referred to in this Form 10-K annual report ("Form 10-K") as the "Company," "we," "us" and "our."
Our Company
ISG is organized as a corporation under the laws of the State of Delaware. It was formed for the purpose of acquiring, through a merger, capital stock exchange, stock purchase, asset acquisition or other similar business combination, one or more domestic and/or foreign operating businesses. On February 6, 2007, ISG consummated an initial public offering (the "IPO") of its equity securities from which it received net proceeds of approximately $255.4 million.
On November 16, 2007, ISG completed the acquisition of TPI Advisory Services Americas, Inc. ("TPI"). TPI was the pioneer in developing the market for sourcing advisory services and has done more than almost any other firm to shape the current state of the outsourcing transaction market space, according to a January 2007 report prepared by Forrester Research, Inc. Since its founding, TPI has performed more than 3,500 engagements and has grown to become the leading independent full service outsourcing and offshoring advisory firm focusing on the design, implementation and management of sourcing strategies for major corporate clients. TPI is a fact-based sourcing advisory firm that provides independent analysis and advice to its clients on which services should be sourced and the best provider to use. TPI provides industry knowledge and advice to its clients to help them implement substantial and sustainable improvements in business support operations through a combination of insourcing, offshoring, shared services and outsourcing. Over its history, TPI has developed an integrated global advisory platform, which is distinguished by its comprehensive scope of services; industry expertise; proprietary data and market intelligence; and independence and objectivity.
The current mailing address of ISG's principal executive office is Information Services Group, Inc., Two Stamford Plaza, 281 Tresser Boulevard, Stamford, CT 06901, and its telephone number is (203) 517-3100.
Sourcing Industry
We serve the global sourcing industry, which is comprised of information technology and business process services and outsourcing. We provide our clients with sourcing advisory services that can be broadly defined as the delivery of the internal and external resources necessary to achieve strategic or operational objectives within this global market. Sourcing options are based on the location of the resources (domestic or offshore) as well as the source of the resources (internal or external).
Within the sourcing industry, the terms "outsourcing" and "offshoring" are frequently used synonymously. However, outsourcing refers to transitioning services to an external provider, whether domestic ("domestic outsourcing") or abroad ("offshore outsourcing"). Offshoring relates to the delivery of services from an offshore location and can be performed internally via a subsidiary or joint-venture ("captive offshore") or transitioned to an external party ("offshore outsourcing").
Information Technology Outsourcing
Information technology services are typically delivered via contracts that provide for multi-year relationships between service providers and clients and provide also for the management of all or part of a company's information technology infrastructure, software development and maintenance and operations. Responsibilities transferred to service providers often include managing servers, networks, personal computers, applications and data centers.
5
Business Process Outsourcing
The business services industry typically supports the transfer of one or more discrete business functions to an external service provider. Such functions tend to be high-volume, automated activities, such as payroll processing or benefits administration. More recently, businesses have begun transferring entire business functions, such as human resources, finance and accounting, procurement or client care, to external service providers. The provision of business services has gained increasing importance and visibility in the services industry, as the cost savings it can generate have become a key component of improved competitive advantage and market leadership in an increasingly global economy.
Growth of Offshoring
Offshoring has contributed significantly to the growth in the sourcing market and has expanded the market for our services. Offshoring is broadly defined as the market for providing services to companies in countries with high labor costs (such as the United States and certain countries in Western Europe) by service providers located in countries with lower labor costs (such as India and China). Offshoring came to prominence in the 1980s as large American corporations developed captive offshore centers in order to reap the benefits of the low cost and highly-skilled labor. Since then, the growing capability and acceptance of a global delivery model as well as the inherent benefits of access to lower cost and highly-qualified labor and the sophistication of service providers' capabilities continue to drive the growth of offshore outsourcing. Offshore service providers have over time expanded their service offerings beyond information technology to include business processes and services, helping companies with core business strategies such as increasing revenue, expanding into new product and service areas and improving productivity.
Role of independent sourcing advisors
The demand for and role of independent sourcing advisors is driven by a number of factors. First, the importance of assessing, negotiating, implementing and managing service delivery models has been rising as outsourcing and offshoring have been increasingly utilized in businesses' operating strategies. Second, the scope and complexity of sourcing relationships have increased as organizations have moved from predominantly information technology outsourcing to business process outsourcing. Third, as the scope and availability of sourcing have increased, the duration of sourcing contracts have become shorter, requiring more frequent contract negotiations with service providers. Fourth, the inherent conflicts in the business models of sourcing advisors who represent clients and provide sourcing services highlight the value of independent advisors who provide guidance to companies. Finally, the expansion of the offshoring and outsourcing markets has added significant complexity to the market for these services, as clients seek optimized solutions to their needs.
Our Strengths
We believe that the following strengths differentiate us from our competition:
- •
- Independence and objectivity. We are not a service
provider. We are an independent, fact-based advisory firm with no material conflicting financial interests. This enables us to maintain a trusted advisor relationship with our clients
through our unbiased focus and ability to align our interests with those of our clients.
- •
- Domain expertise. Averaging over 21 years of
experience, our client-facing advisors bring a wealth of industry and domain-specific knowledge and expertise to address our clients most complex sourcing needs and demands.
- •
- Proprietary data and market intelligence. We have assembled a comprehensive, up-to-date and sophisticated database consisting of proprietary market information gathered from our more
6
- •
- Global reach. We possess practical experience in global business operations, and we understand the significance of interconnected economies and companies. Our resources in the Americas, Europe, Asia Pacific and India makes us a truly global advisory firm able to consistently serve the strategic and implementation needs of our global clients. Our international operations accounted for approximately 42% of total revenues in 2009 and are expected to grow.
than 3,500 engagements totaling over $300 billion in total contract value ("TCV"), as well as from other factual industry data sources.
We believe that the strengths disclosed above are central to our ability to successfully deal with the challenges that we face. We face many challenges, which include, or may include: competition from sourcing service providers; the need to maintain and expand our product offerings; the need to retain existing, and attract future, key employees; the need to retain existing, and attract future, clients; the need to continue to secure new engagements; and, generally, any challenges to our ability to pursue the strategy discussed below under the caption, "Our Strategy."
We also face various risks, which are more fully described in the "Risk Factors", including, but not limited to: a decline in the growth rate of the sourcing advisory industry; loss of engagements; outside factors impacting operating results; failure to secure new engagements; maintenance of existing services and products and the introduction of new services and products; inability to respond to market trends; failure to protect intellectual property; failure to compete successfully; loss of key members of our management team; inability to attract skilled employees; loss of a key client; risks inherent in international business activities; currency rate fluctuations; and inability to maintain equity in our brand name.
Our Strategy
We intend to use our competitive strengths to develop new services and products, sustain our growth and strengthen our existing market position by pursuing the following strategies:
- •
- Pursue continued growth of existing service model. We
expect the trend toward offshore delivery models—through captive centers, joint ventures and outsourcing—to play an increasing role in the growth of demand for our services. We
plan to leverage our current operating platform to service the growing number of corporations utilizing outside advisors when negotiating, implementing and maintaining sourcing contracts. In addition,
we will seek to continue to expand our products and services and the geographic markets we serve opportunistically as global competition spurs demand for cost savings and value creation. Growth of the
business process outsourcing and offshoring markets should provide market expansion opportunities for us. We expect to be well-positioned to potentially benefit from any increase by our
clients of corporate "multi-sourcing" strategies, where clients seek one outside advisor to assist them in effectively balancing the concentration risks of third-party dependencies with the need for
regular review and renewal of incumbent relationships.
- •
- Continue to expand geographically. Historically, we generated the majority of our revenues in North America. Over the past several years, we have made significant investments in Europe and Asia Pacific to capitalize on emerging demand for sourcing in these geographic regions. International sales (excluding the Americas) approximated 42%, 45%, and 34% of net sales for the years ended December 31, 2009, 2008, and 2007, respectively. We intend to continue to expand in Europe, Latin America and Asia Pacific and maintain our revenue growth in those markets.
7
- •
- Expand into new industry sectors. We have been successful
in expanding our presence across industries and into state government departments in the United States and national and provincial government units in the United Kingdom, Canada and Australia. Our
management believes the government market, which currently has very low penetration, represents a potential opportunity. Industries possessing characteristics of regulatory oversight and increasing
competition, and benefiting from standardization and automation, include healthcare, pharmaceuticals, and energy. We intend to continue to expand across these industries opportunistically as market
opportunities present themselves.
- •
- Develop knowledge process outsourcing capabilities. To
date, our emphasis has been on certain corporate-wide business functions such as information technology, human resources, and finance and accounting. However, we believe there is also a
potential demand for knowledge process outsourcing. Clients for knowledge process outsourcing comprise those organizations that are challenged by the labor costs and skills shortages for activities
that are inherently expertise-oriented, such as research, engineering, clinical trials, marketing and advertising and legal services. We are involved in early-stage knowledge process outsourcing
engagements and plan to further develop this source of business in the future.
- •
- Provide greater post-implementation support
services. McKinsey estimates historically that almost half of all outsourcing deals fail to realize expected cost or efficiency targets
due to poor management and lack of experience. As companies begin to recognize the importance of managing the post-sourcing-transaction period, service governance has emerged as a
potential revenue driver for us. We believe that our experience with outsourcing transactions makes us uniquely equipped to help our clients manage their outsourcing teams or act as a third-party
administrator. Over 17% of our revenues were generated through service governance and related activities across information technology outsourcing and business processing outsourcing engagements
during 2009. We will continue to pursue opportunities to leverage our experience to make service governance an even greater revenue generator for us. Sourcing management and governance engagements
also provide a source of recurring revenue.
- •
- Productize market data assets. We believe that
productizing our advisory methodologies and data represents an opportunity to achieve potential growth. There are a variety of potential services based on data we have collected over the course of our
engagement history that could be of interest to existing and new clients. We expect to expand our data repository and associated benchmarking (costs and pricing) comparisons to broaden our scope
beyond our current information technology emphasis, and we intend to introduce market pricing comparisons for human resources and finance and accounting services in the future.
- •
- Consider acquisition and other growth opportunities. The
independent sourcing advisory market is highly fragmented. We believe we are well-positioned to leverage our leading market position to expand through acquisitions. Acquiring firms with
complementary services and products will allow us to further develop and broaden our service offerings and domain expertise. We will consider and may pursue opportunities to enter into joint ventures
and to buy or combine with other businesses.
- •
- Expand profit margins. We intend to focus on profitable revenue growth, increase utilization and pricing optimization. In addition, we will continue to seek to employ programs to minimize our selling, general and administrative costs.
8
Our Services
For twenty-one years, our services have helped organizations address complex business challenges. The functional domain experience of our experts and deep empirical data helps clients better understand their sourcing options. The Company provides five key lines of service:
- •
- Operational assessment. We evaluate clients' operating
costs and existing practices against various benchmarks and determine the benefits of changing their current service delivery approaches.
- •
- Strategy development. We determine potential cost savings
and design the clients' most appropriate operating organizations, which lays the foundation for service process transformation and improvement. A given strategy typically includes a combination of the
use of shared service centers, offshoring, insourcing and traditional outsourcing.
- •
- Negotiation and implementation. We help clients manage the
negotiation and implementation of sourcing strategies, including supplier selection, contract negotiation and program management.
- •
- Transition support/execution. We support each transition
phase when clients shift internal operations to new outsourcing providers.
- •
- Service governance. We monitor, manage and benchmark clients' sourcing relationships and shared service center operations.
Proprietary Data and Market Intelligence
We possess proprietary databases of sourcing-related market intelligence that are the product of extensive market research and client engagements. Our extensive data underpins our operational assessments, strategy development, and deal structuring and negotiations and also fuels our marketing programs. This data is proprietary, derived largely from those assignments that we have conducted during the last twenty years, enabling us to provide comprehensive comparative metrics to our clients.
Our comprehensive databases include proprietary market intelligence on key sourcing topics including:
- •
- comparative sourcing economics, benchmarking and best practices;
- •
- service provider profiles, including their global capabilities, performance metrics, strengths and weaknesses,
organizations, contract awards and recent developments;
- •
- contract terms and templates, including pricing, governance, results, revisions, cancellations and renewals; and
- •
- sourcing industry trends, including transaction volumes, developments and innovations by industry, function, geography, client and provider.
We enhance our sourcing-related databases with data accumulated from each client engagement, thus improving our ability to compete for additional client engagements and advise subsequent clients based on updated market intelligence. We supplement our proprietary engagement data with outbound surveys and market research purchased from third parties. Industry service providers participate in the development of our databases, enhancing our ability to influence and educate prospective clients.
We believe that there may be opportunities in the future to acquire complementary advisory, research and database assets and businesses and the potential exists to combine our proprietary data assets with assets to be acquired in subsequent transactions to create products and services such as advisory and research services that could be sold via subscriptions, memberships and other such recurring revenue models. We also publish an overview of global outsourcing market activity called the TPI Index. Since its launch in 2002, the TPI Index has become an industry benchmark that is utilized and referenced by equity research analysts, service providers, clients and media outlets interested in the state of the global sourcing industry.
9
Clients
We provide services to clients in numerous industries such as: financial services, telecom, healthcare and pharmaceuticals, manufacturing, transportation and travel and energy and utilities.
Competition
Competition in the sourcing advisory market is primarily driven by independence and objectivity, expertise, possession of relevant benchmarking data, breadth of service capabilities, reputation and price. We compete with other sourcing advisors, research firms, strategy consultants and sourcing service providers. A significant number of independent sourcing advisory firms offer similar services. However, these firms generally lack the benchmarking data, scale and diversity of expertise that we possess as a result of over twenty years of experience in the sourcing industry. In addition, most research firms do not possess the data repository of recent, comparable transactions and benchmarking data. Strategy consultants bring strategy services capabilities to the sourcing advisory market. However, since they do not focus exclusively on the sourcing market, they lack the depth of experience that sourcing advisory firms such as ISG possess. In addition, strategy consultants do not possess the sourcing implementation expertise or the benchmarking data capabilities that are critical to implementing and managing successful sourcing advisory projects. Other service providers often lack the depth of experience, competitive benchmarking data and independence critical to playing the role of "trusted advisor" to clients.
Employees
As of December 31, 2009, the Company employed 439 people worldwide. These employees are organized into bands including: executive management, service leads, partner, director, senior advisor, advisor, analyst, technical specialist and functional technical support.
We recruit advisors from service providers, consulting firms and clients with direct sourcing experience. These advisors leverage extensive practical expertise derived from experiences in corporate leadership, consulting, research, financial analysis, contract negotiations and operational service delivery.
All employees are required to execute confidentiality, conflict of interest and intellectual property agreements. There are no collective bargaining agreements covering any of our employees.
ISG's voluntary advisor turnover rate ranged between 9% and 12% over the last three years.
Available Information
Our Internet address is www.informationsg.com. The content on our website is available for information purposes only. It should not be relied upon for investment purposes, nor is it incorporated by reference into this Form 10-K. We make available through our Internet website under the heading "Investor Relations," our annual report on Form 10-K, quarterly reports on Form 10-Q, and current reports on Form 8-K after we electronically file any such materials with the Securities and Exchange Commission. Copies of our key corporate governance documents, including our Code of Ethics for Directors, Officers and Employees and charters for our Audit Committee, our Nominating and Corporate Governance Committee and our Compensation Committee are also on our website. Stockholders may request free copies of these documents including our Annual Report to Stockholders by writing to Information Services Group, Inc., Two Stamford Plaza, 281 Tresser Boulevard, Stamford CT 06901, Attention: David E. Berger, or by calling (203) 517-3100.
Our annual and quarterly reports and other information statements are available to the public through the SEC's website at www.sec.gov. In addition, the Notice of Annual Meeting of Stockholders, Proxy Statement and 2009 Annual Report to Stockholders are available free of charge at www.informationsg.com.
10
The loss of key executives could adversely affect our business.
The success of our business is dependent upon the continued service of a relatively small group of our key executives consisting of Mr. Connors, our Chairman and Chief Executive Officer; Mr. Berger, Executive Vice President, Chief Financial Officer; Mr. Doppelt, Executive Vice President, General Counsel and Corporate Secretary; and Mr. Gould, Executive Vice President. Although we currently intend to retain our existing management and may enter into employment or other compensation arrangements with them, the terms of which have not yet been determined, we cannot assure you that such individuals will remain with us for the immediate or foreseeable future. We do not have employment contracts with any of our current executives. The unexpected loss of the services of one or more of these executives could adversely affect our business.
If we are unable to maintain a current prospectus relating to the common stock underlying our warrants, our warrants may have little or no value and the market for our warrants may be limited.
No warrants will be exercisable and we will not be obligated to issue shares of common stock unless at the time a holder seeks to exercise such warrant, a prospectus relating to the common stock issuable upon exercise of the warrants is current and the common stock has been registered or qualified or deemed to be exempt under the securities laws of the state of residence of the holder of the warrants. Under the terms of the warrant agreement between Continental Stock Transfer & Trust Company, as warrant agent, and us, we have agreed to use our reasonable best efforts to maintain a current prospectus relating to the common stock issuable upon exercise of our warrants until the expiration of our warrants. However, we cannot assure you that we will be able to do so. If the prospectus relating to the common stock issuable upon exercise of the warrants is not current or if the common stock is not qualified or exempt from qualification in the jurisdictions in which the holders of the warrants reside, our warrants may not be exercisable before they expire and we will not net-cash settle the warrants. Thus, our warrants may be deprived of any value. The market for our warrants may be limited, and the warrants may expire worthless. Even if warrant holders are not able to exercise their warrants because there is no current prospectus or the common stock is not qualified or exempt from qualification in the jurisdictions in which the holders of the warrants reside, we can exercise our redemption rights.
We may choose to redeem our outstanding warrants at a time that is disadvantageous to our warrant holders.
We may redeem the warrants issued as a part of our units (including warrants issued and outstanding as a result of the exercise of the purchase option that we agreed to sell to the underwriters in the IPO and the warrants sold in the private placement) at any time in whole and not in part, at a price of $0.01 per warrant, upon a minimum of 30 days' prior written notice of redemption, if and only if, the last sales price of our common stock equals or exceeds $11.50 per share for any 20 trading days within a 30-trading-day period ending three business days before we send the notice of redemption. Redemption of the warrants could force the warrant holders (i) to exercise the warrants and pay the exercise price therefore at a time when it may be disadvantageous for the holders to do so, (ii) to sell the warrants at the then current market price when they might otherwise wish to hold the warrants or (iii) to accept the nominal redemption price which, at the time the warrants are called for redemption, is likely to be substantially less than the market value of the warrants.
11
Our outstanding warrants may be exercised in the future, which would increase the number of shares eligible for future resale in the public market and would result in dilution to our stockholders. This might have an adverse effect on the market price of the common stock.
Excluding 6.5 million warrants held collectively by three executive officers and one former executive officer of ISG (the "ISG Inside Stockholders"), outstanding redeemable warrants to purchase an aggregate of 24,147,323 shares of common stock as of December 31, 2009 became exercisable on January 31, 2008. Also, as part of the purchase consideration paid to MCP-TPI Holdings, LLC, a Texas limited liability company ("MCP-TPI"), ISG issued warrants exercisable beginning on November 16, 2008 into 5 million shares of ISG common stock at an exercise price of $9.18 per share. To the extent these warrants are exercised, additional shares of our common stock will be issued, which will result in dilution to our stockholders and increase the number of shares eligible for resale in the public market. In addition, we sold to the underwriters in the IPO an option to purchase up to 1,406,250 units at $9.60 per unit. The exercise of this option, and the exercise of the warrants included in the units issuable upon the exercise of this option, would lead to further dilution and a potential increase in the number of shares eligible for resale in the public market. Sales of substantial numbers of such shares in the public market could adversely affect the market price of our shares.
If the private placement prior to the IPO was not conducted in compliance with applicable law, the ISG Inside Stockholders may have the right to rescind the warrants purchased in the private placement.
On January 31, 2007, we consummated a private placement of 6,500,000 warrants to an affiliate of ISG Inside Stockholders. Although we believe that we conducted the private placement in accordance with applicable law, there is a risk that the warrants should have been registered under the Securities Act of 1933, as amended, and applicable blue sky laws, in which case the securities may have been issued in violation of Section 5 of the Securities Act of 1933, as amended, and such applicable blue sky laws. Although the ISG Inside Stockholders have waived their respective rights, if any, to rescind their warrant purchases as a remedy to our failure to register these securities, their waiver may not be enforceable in light of the public policy underlying federal and state securities laws. If the existing stockholders bring a claim against us and successfully assert rescission rights, we may be required to refund an aggregate of $6.5 million, plus interest, to them.
To complete the acquisition, we incurred a substantial amount of debt, which may limit our ability to fund general corporate requirements and obtain additional financing, limit our flexibility in responding to business opportunities and competitive developments and increase our vulnerability to adverse economic and industry conditions.
We incurred a substantial amount of indebtedness to finance the acquisition, transaction costs, and deferred underwriting fees. On November 16, 2007, our wholly-owned subsidiary International Consulting Acquisition Corp. ("ICAC") entered into a senior secured credit facility comprised of a $95.0 million term loan facility and a $10.0 million revolving credit facility. On November 16, 2007, ICAC borrowed $95.0 million under the term loan facility to finance the purchase price for our acquisition of TPI and to pay transaction costs. As a result of the substantial fixed costs associated with the debt obligations, we expect that:
- •
- a decrease in revenues will result in a disproportionately greater percentage decrease in earnings;
- •
- we may not have sufficient liquidity to fund all of these fixed costs if our revenues decline or costs increase;
- •
- we may have to use our working capital to fund these fixed costs instead of funding general corporate requirements, including capital expenditures;
12
- •
- we may not have sufficient liquidity to respond to business opportunities, competitive developments and adverse economic
conditions; and
- •
- our results of operations will be adversely affected if interest rates increase because, based on our current outstanding term loan borrowings in the amount of $71.8 million, a 1% increase in interest rates would result in a pre-tax impact on earnings of approximately $0.7 million per year.
These debt obligations may also impair our ability to obtain additional financing, if needed, and our flexibility in the conduct of our business. Our indebtedness under the senior secured revolving credit facility is secured by substantially all of our assets, leaving us with limited collateral for additional financing. Moreover, the terms of our indebtedness under the senior secured revolving credit facility restrict our ability to take certain actions, including the incurrence of additional indebtedness, mergers and acquisitions, investments and asset sales. Our ability to pay the fixed costs associated with our debt obligations will depend on our operating performance and cash flow, which in turn depend on general economic conditions and the advisory services market. A failure to pay interest or indebtedness when due could result in a variety of adverse consequences, including the acceleration of our indebtedness. In such a situation, it is unlikely that we would be able to fulfill our obligations under or repay the accelerated indebtedness or otherwise cover our fixed costs. As of December 31, 2009, the total principal outstanding under the term loan facility was $71.8 million. There were no borrowings under the revolving credit facility during fiscal 2009.
Failure to maintain effective internal controls over financial reporting could adversely affect our business and the market price of our Common Stock.
Pursuant to rules adopted by the SEC implementing Section 404 of the Sarbanes-Oxley Act of 2002, we are required to assess the effectiveness of our internal controls over financial reporting and provide a management report on our internal controls over financial reporting in all annual reports. This report contains, among other matters, a statement as to whether or not our internal controls over financial reporting are effective and the disclosure of any material weaknesses in our internal controls over financial reporting identified by management.
The Committee of Sponsoring Organizations of the Treadway Commission (COSO) provides a framework for companies to assess and improve their internal control systems. Auditing Standard No. 5 provides the professional standards and related performance guidance for auditors to attest to, and report on, management's assessment of the effectiveness of internal control over financial reporting under Section 404. Management's assessment of internal controls over financial reporting requires management to make subjective judgments and, some of the judgments will be in areas that may be open to interpretation. Therefore, our management's report on our internal controls over financial reporting may be difficult to prepare, and our auditors may not agree with our management's assessment.
While we currently believe our internal controls over financial reporting are effective, we are required to comply with Section 404 on an annual basis. If, in the future, we identify one or more material weaknesses in our internal controls over financial reporting during this continuous evaluation process, our management will be unable to assert such internal controls are effective. Although we currently anticipate being able to continue to satisfy the requirements of Section 404 in a timely fashion, we cannot be certain as to the timing of completion for our future evaluation, testing and any required remediation due in large part to the fact that there are limited precedents available by which to measure compliance with these new requirements. Therefore, if we are unable to assert that our internal controls over financial reporting are effective in the future, or if our auditors are unable to express an opinion on the effectiveness of our internal controls, our investors could lose confidence in
13
the accuracy and completeness of our financial reports, which could have an adverse effect on our business and the market price of our Common Stock.
Our operating results have been adversely impacted by the worldwide economic crisis and credit tightening.
Beginning in the fourth quarter of 2008, worldwide economic conditions significantly deteriorated due to the credit crisis driven initially by the subprime mortgage crisis and other factors, including slower economic activity, recessionary concerns, increased energy costs, decreased consumer confidence, reduced corporate profits, reduced or canceled capital spending, adverse business conditions and liquidity concerns. Our results of operations are affected by the level of business activity of our clients, which in turn is affected by the level of economic activity in the industries and markets that they serve. A decline in the level of business activity of our clients could have a material adverse effect on our revenue and profit margin. In particular, our exposure to certain industries currently experiencing financial difficulties, including the automobile and financial services industries, could have an adverse affect on our results of operations. Future economic conditions could cause some clients to reduce or defer their expenditures for consulting services. We have implemented and will continue to implement cost-savings initiatives to manage our expenses as a percentage of revenue. However, current and future cost-management initiatives may not be sufficient to maintain our margins if the economic environment should weaken for a prolonged period.
The rate of growth in sourcing activity and/or the use of technology in business may fall significantly below the levels that we currently anticipate.
Our business is dependent upon continued growth in sourcing activity, the use of technology in business by our clients and prospective clients and the continued trend towards sourcing of complex information technology and business process tasks by large and small organizations. If sourcing diminishes as a management and operational tool, the growth in the use of technology slows down or the cost of sourcing alternatives rises, our business could suffer. Companies that have already invested substantial resources in developing in-house information technology and business process functions may be particularly reluctant or slow to move to a sourcing solution that may make some of their existing personnel and infrastructure obsolete.
Our engagements may be terminated, delayed or reduced in scope by clients at any time.
Our clients may decide at any time to abandon, postpone and/or to reduce our involvement in an engagement. Our engagements can therefore terminate, or the scope of our responsibilities may diminish, with limited advance notice. If an engagement is terminated, delayed or reduced unexpectedly, the professionals working on the engagement could be underutilized until we assign them to other projects. Accordingly, the termination or significant reduction in the scope of a single large engagement, or multiple smaller engagements, could harm our business results.
Our operating results may fluctuate significantly from period to period as a result of factors outside of our control.
We expect our revenues and operating results to vary significantly from accounting period to accounting period due to factors including:
- •
- fluctuations in revenues earned on contracts;
- •
- commencement, completion or termination of contracts during any particular period;
- •
- additions and departures of key advisors;
- •
- transitioning of advisors from completed projects to new engagements;
14
- •
- seasonal trends;
- •
- the introduction of new services by us or our competitors;
- •
- changes in fees, pricing policies or compensation arrangements by us or our competitors;
- •
- strategic decisions by us, our clients or our competitors, such as acquisitions, divestitures, spin-offs,
joint ventures, strategic investments or changes in business strategy;
- •
- global economic and political conditions and related risks, including acts of terrorism; and
- •
- conditions in the travel industry that could prevent our advisors from traveling to client sites.
We depend on project-based advisory engagements, and our failure to secure new engagements could lead to a decrease in our revenues.
Advisory engagements typically are project-based. Our ability to attract advisory engagements is subject to numerous factors, including the following:
- •
- delivering consistent, high-quality advisory services to our clients;
- •
- tailoring our advisory services to the changing needs of our clients;
- •
- matching the skills and competencies of our advisory staff to the skills required for the fulfillment of existing or
potential advisory engagements; and
- •
- maintaining a global business operation.
Any material decline in our ability to secure new advisory arrangements could have an adverse impact on our revenues and financial condition.
We may not be able to maintain our existing services and products.
We operate in a rapidly evolving market, and our success depends upon our ability to deliver high quality advice and analysis to our clients. Any failure to continue to provide credible and reliable information and advice that is useful to our clients could have a significant adverse effect on future business and operating results. Further, if our advice proves to be materially incorrect and the quality of service is diminished, our reputation may suffer and demand for our services and products may decline. In addition, we must continue to improve our methods for delivering our products and services in a cost-effective manner.
We may not have the ability to develop and offer the new services and products that we need to remain competitive.
Our future success will depend in part on our ability to offer new services and products. To maintain our competitive position, we must continue to enhance and improve our services and products, develop or acquire new services and products in a timely manner, and appropriately position and price new services and products relative to the marketplace and our costs of producing them. These new services and products must successfully gain market acceptance by addressing specific industry and business sectors and by anticipating and identifying changes in client requirements. The process of researching, developing, launching and gaining client acceptance of a new service or product, or assimilating and marketing an acquired service or product, is risky and costly. We may not be able to introduce new, or assimilate acquired, services and products successfully. Any failure to achieve successful client acceptance of new services and products could have an adverse effect on our business results.
15
We may fail to anticipate and respond to market trends.
Our success depends in part upon our ability to anticipate rapidly changing technologies and market trends and to adapt our advice, services and products to meet the changing sourcing advisory needs of our clients. The range of sourcing options and number of service providers is expanding. This expansion is generating complexity in the industry which adds opportunity and risk to our business. Our clients regularly undergo frequent and often dramatic changes. That environment of rapid and continuous change presents significant challenges to our ability to provide our clients with current and timely analysis, strategies and advice on issues of importance to them. Meeting these challenges requires the commitment of substantial resources. Any failure to continue to respond to developments, technologies, and trends in a manner that meets market needs could have an adverse effect on our business results.
We may be unable to protect important intellectual property rights.
We rely on copyright and trademark laws, as well as nondisclosure and confidentiality arrangements, to protect our proprietary rights in our methods of performing our services and our tools for analyzing financial and other information. There can be no assurance that the steps we have taken to protect our intellectual property rights will be adequate to deter misappropriation of our rights or that we will be able to detect unauthorized use and take timely and effective steps to enforce our rights. If substantial and material unauthorized uses of our proprietary methodologies and analytical tools were to occur, we may be required to engage in costly and time-consuming litigation to enforce our rights. There can be no assurance that we would prevail in such litigation. If others were able to use our intellectual property or were to independently develop our methodologies or analytical tools, our ability to compete effectively and to charge appropriate fees for our services may be adversely affected.
We face competition and our failure to compete successfully could materially adversely affect our results of operations and financial condition.
The market for our sourcing advisory services is competitive, highly fragmented and subject to rapid change. We face competition from many other providers of advisory and sourcing services ranging from large organizations to small firms and independent contractors that provide specialized services. Our competitors include any firm that provides sourcing advisory services, which may include a variety of consulting firms, service providers, niche sourcing advisors, strategy and law firms and, potentially, advisors currently or formerly employed by us. Some of our competitors have significantly more financial and marketing resources, larger professional staffs, closer client relationships, broader geographic presence or more widespread recognition than us.
In addition, limited barriers to entry exist in the markets in which we do business. As a result, additional new competitors may emerge and existing competitors may start to provide additional or complementary services. Additionally, technological advances may provide increased competition from a variety of sources. There can be no assurance that we will be able to successfully compete against current and future competitors and our failure to do so could result in loss of market share, diminished value in our products and services, reduced pricing and increased marketing expenditures. Furthermore, we may not be successful if we cannot compete effectively on quality of advice and analysis, timely delivery of information, client service or the ability to offer services and products to meet changing market needs for information, analysis or price.
We rely heavily on key members of our management team.
We are dependent on our management team. We have entered into subscription and non-competition agreements with a number of these key management personnel. If any of the
16
covenants contained in the subscription and non-competition agreements are violated, the key management personnel will forfeit their shares (or the after-tax proceeds if the shares have been sold). We issued restricted stock units ("RSUs") and stock appreciation rights ("SARs") to key employees. Vesting rights in the RSUs and SARs are subject to compliance with restrictive covenant agreements. Vested and unvested RSUs and SARs will be forfeited upon any violation of the restrictive covenant agreements. Despite the non-competition and restrictive covenant agreements, we may not be able to retain these managers and may not be able to enforce the non-competition and restrictive covenants. If we were to lose a number of key members of our management team and were unable to replace these people quickly, we could have difficulty maintaining our growth and certain key relationships with large clients.
We depend upon our ability to attract, retain and train skilled advisors and other professionals.
Our business involves the delivery of advisory services. Therefore, our continued success depends in large part upon our ability to attract, develop, motivate, retain and train skilled advisors and other professionals who have advanced information technology and business processing domain expertise, financial analysis skills, project management experience and other similar abilities. We do not have non-competition agreements with many non-executive advisors. Consequently, these advisors could resign and join one of our competitors or provide sourcing advisory services to our clients through their own ventures.
We must also recruit staff globally to support our services and products. We face competition for the limited pool of these qualified professionals from, among others, technology companies, market research firms, consulting firms, financial services companies and electronic and print media companies, some of which have a greater ability to attract and compensate these professionals. Some of the personnel that we attempt to hire may be subject to non-compete agreements that could impede our short-term recruitment efforts. Any failure to retain key personnel or hire and train additional qualified personnel as required supporting the evolving needs of clients or growth in our business could adversely affect the quality of our products and services, and our future business and operating results.
We may have agreements with certain clients that limit the ability of particular advisors to work on some engagements for a period of time.
We provide services primarily in connection with significant or complex sourcing transactions and other matters that provide potential competitive advantage and/or involve sensitive client information. Our engagement by a client occasionally precludes us from staffing certain advisors on new engagements because the advisors have received confidential information from a client who is a competitor of the new client. Furthermore, it is possible that our engagement by a client could preclude us from accepting engagements with such client's competitors because of confidentiality concerns.
In many industries in which we provide sourcing advisory services, there has been a trend toward business consolidations and strategic alliances that could limit the pool of potential clients.
Consolidations and alliances reduce the number of potential clients for our services and products and may increase the chances that we will be unable to continue some of our ongoing engagements or secure new engagements.
We derive a significant portion of our revenues from our largest clients (including those in the automobile sector) and could materially and adversely be affected if we lose one or more of our large clients.
Our 20 largest clients accounted for approximately 44% of revenue in 2009 and 48% in 2008. In particular, revenues from clients in the automobile sector collectively accounted for approximately 15% of our 2009 annual revenue. Although only General Motors accounts for more than 10% of our
17
revenues, if one or more of our large clients terminate or significantly reduce their engagements or fail to remain a viable business, then our revenues could be materially and adversely affected. In addition, sizable receivable balances could be jeopardized if large clients fail to remain viable.
Our international operations expose us to a variety of risks which could negatively impact our future revenue and growth.
Approximately 42% of our revenues for 2009 and 45% for 2008 were derived from sales outside of the Americas. Our operating results are subject to the risks inherent in international business activities, including:
- •
- tariffs and trade barriers;
- •
- regulations related to customs and import/export matters;
- •
- restrictions on entry visas required for our advisors to travel and provide services;
- •
- tax issues, such as tax law changes and variations in tax laws as compared to the United States;
- •
- cultural and language differences;
- •
- an inadequate banking system;
- •
- foreign exchange controls;
- •
- restrictions on the repatriation of profits or payment of dividends;
- •
- crime, strikes, riots, civil disturbances, terrorist attacks and wars;
- •
- nationalization or expropriation of property;
- •
- law enforcement authorities and courts that are inexperienced in commercial matters; and
- •
- deterioration of political relations with the United States.
Air travel, telecommunications and entry through international borders are all vital components of our business. If a terrorist attack similar to 9/11 were to occur, our business could be disproportionately impacted because of the disruption a terrorist attack causes on these vital components.
We intend to continue to expand our global footprint in order to meet our clients' needs. This may involve expanding into countries beyond those in which we currently operate. We may involve expanding into less developed countries, which may have less political, social or economic stability and less developed infrastructure and legal systems. As we expand our business into new countries, regulatory, personnel, technological and other difficulties may increase our expenses or delay our ability to start up operations or become profitable in such countries. This may affect our relationships with our clients and could have an adverse affect on our business.
We operate in a number of international areas which exposes us to significant foreign currency exchange rate risk.
We have significant international revenue, which is generally collected in local currency. We currently do not hold or issue forward exchange contracts or other derivative instruments for hedging or speculative purposes. The percentage of total revenues generated outside the Americas increased from 22% in 2004 to 42% in 2009. It is expected that our international revenues will continue to grow as European and Asian markets adopt sourcing solutions. The translation of our revenues into U.S. dollars, as well as our costs of operating internationally, may adversely affect our business, results of operations and financial condition.
18
We may be subject to claims for substantial damages by our clients arising out of disruptions to their businesses or inadequate service and our insurance coverage may be inadequate.
Most of our service contracts with clients contain service level and performance requirements, including requirements relating to the quality of our services. Failure to consistently meet service requirements of a client or errors made by our employees in the course of delivering services to our clients could disrupt the client's business and result in a reduction in revenues or a claim for damages against us. Additionally, we could incur liability if a process we manage for a client were to result in internal control failures or impair our client's ability to comply with our own internal control requirements.
Under our service agreements with our clients, our liability for breach of our obligations is generally limited to actual damages suffered by the client and is typically capped at the greater of an agreed amount or the fees paid or payable to us under the relevant agreement. These limitations and caps on liability may be unenforceable or otherwise may not protect us from liability for damages. In addition, certain liabilities, such as claims of third parties for which we may be required to indemnify our clients or liability for breaches of confidentiality, are generally not limited under those agreements. Although we have commercial general liability insurance coverage, the coverage may not continue to be available on acceptable terms or in sufficient amounts to cover one or more large claims. The successful assertion of one or more large claims against us that exceed available insurance coverage or changes in our insurance policies (including premium increases or the imposition of large deductible or co-insurance requirements) could have a material adverse effect on our business.
We could be liable to our clients for damages and subject to liability and our reputation could be damaged if our client data is compromised.
We may be liable to our clients for damages caused by disclosure of confidential information. We are often required to collect and store sensitive or confidential client data in order to perform the services we provide under our contracts. Many of our contracts do not limit our potential liability for breaches of confidentiality. If any person, including any of our current or former employees, penetrates our network security or misappropriates sensitive data or if we do not adapt to changes in data protection legislation, we could be subject to significant liabilities to our clients or to our clients' customers for breaching contractual confidentiality provisions or privacy laws. Unauthorized disclosure of sensitive or confidential client data, whether through breach of our processes, systems or otherwise, could also damage our reputation and cause us to lose existing and potential clients. We may also be subject to civil actions and criminal prosecution by government or government agencies for breaches relating to such data. Our insurance coverage for breaches or mismanagement of such data may not continue to be available on reasonable terms or in sufficient amounts to cover one or more large claims against us.
Client restrictions on the use of client data could adversely affect our activities.
The majority of the data we use to populate our databases comes from our client engagements. The insight sought by clients from us relates to the contractual data and terms, including pricing and costs, to which we have access in the course of assisting our clients in the negotiation of our sourcing agreements. Data is obtained through the course of our engagements with clients who agree to contractual provisions permitting us to consolidate and utilize on an aggregate basis such information. If we were unable to utilize key data from previous client engagements, our business, financial condition and results of operations could be adversely affected.
19
We may not be able to maintain the equity in our brand name.
We have operated under the brand "TPI" for several years and have legally registered trademarks in certain appropriate jurisdictions. There are other entities providing advisory and similar technology-related services that use "Technology Partners" as, or as part of, their names. There can be no assurance that the resulting confusion and lack of brand-recognition in the marketplace created by this situation will not adversely affect our business.
Nevertheless, we believe that our "TPI" brand, including our independence, is critical to our efforts to attract and retain clients and staff and that the importance of brand recognition will increase as competition increases. We may expand our marketing activities to promote and strengthen the TPI brand and may need to increase our marketing budget, hire additional marketing and public relations personnel, expend additional sums to protect the brand and otherwise increase expenditures to create and maintain client brand loyalty. If we fail to effectively promote and maintain the TPI brand or incur excessive expenses in doing so, our future business and operating results could be adversely impacted.
Item 1B. Unresolved Staff Comments
None.
We maintain our executive offices in Stamford, Connecticut. We do not share our space at our executive offices. The majority of our business activities are performed on client sites. We do not own offices or properties. We have leased offices in the United States, Australia, France, Germany, India, Japan, Netherlands, Sweden, China and the United Kingdom.
We are not aware of any asserted or unasserted legal proceedings or claims that we believe would have a material adverse effect on our financial condition, results of operations or cash flows.
Item 4. Submission of Matters to a Vote of Security Holders
None.
20
Item 5. Market for Registrant's Common Equity, Related Stockholder Matters and Issuer Purchases of Equity Securities
On February 1, 2007, our units began trading on the American Stock Exchange under the symbol "III.U". Each of our units consists of one share of common stock and one warrant. On February 12, 2007, the common stock and warrants underlying our units began to trade separately on the American Stock Exchange under the symbols "III" and "III.WS", respectively. Our securities were traded on the American Stock Exchange until January 31, 2008.
On February 1, 2008, our common stock, warrants and units began trading on The Nasdaq Stock Market LLC under the symbols "III", "IIIW" and "IIIIU", respectively. The following sets forth the high and low closing sales price of our common stock, warrants and units, as reported on the American Stock Exchange or The Nasdaq Stock Market LLC for the periods shown:
| |
Common Stock | Warrants | Units | ||||||||||||||||
|---|---|---|---|---|---|---|---|---|---|---|---|---|---|---|---|---|---|---|---|
| |
High | Low | High | Low | High | Low | |||||||||||||
March 31, 2009 |
$ | 3.48 | $ | 2.80 | $ | 0.08 | $ | 0.05 | $ | 4.00 | $ | 1.94 | |||||||
June 30, 2009 |
3.72 | 2.63 | 0.15 | 0.04 | 3.04 | 2.81 | |||||||||||||
September 30, 2009 |
4.13 | 2.60 | 0.14 | 0.06 | 3.29 | 2.77 | |||||||||||||
December 31, 2009 |
3.95 | 2.86 | 0.12 | 0.04 | 3.21 | 2.14 | |||||||||||||
| |
Common Stock | Warrants | Units | ||||||||||||||||
|---|---|---|---|---|---|---|---|---|---|---|---|---|---|---|---|---|---|---|---|
| |
High | Low | High | Low | High | Low | |||||||||||||
March 31, 2008 |
$ | 6.40 | $ | 5.35 | $ | 0.85 | $ | 0.60 | $ | 7.65 | $ | 5.51 | |||||||
June 30, 2008 |
5.45 | 4.67 | 0.62 | 0.30 | 6.10 | 4.86 | |||||||||||||
September 30, 2008 |
5.03 | 4.21 | 0.54 | 0.25 | 5.60 | 3.92 | |||||||||||||
December 31, 2008 |
5.05 | 2.65 | 0.41 | 0.03 | 6.00 | 1.94 | |||||||||||||
On February 26, 2010, the last reported sale price for our common stock, warrants and units on The Nasdaq Stock Market was $2.97 per share, $0.05 per warrant and $3.00 per unit, respectively.
As of December 31, 2009, there were 358 holders of record of 31,799,927 ISG common stock.
Dividend Policy
We have not paid any dividends on our common stock to date. It is the current intention of ISG's Board of Directors to retain all earnings, if any, for use in our business operations and, accordingly, our board does not anticipate declaring any dividends in the foreseeable future. The payment of dividends in the future will be within the discretion of our then Board of Directors and will be contingent upon our revenues and earnings, if any, capital requirements and general financial condition.
Securities Authorized for Issuance under Equity Compensation Plan
At the special meeting of stockholders held on November 13, 2007, the 2007 Equity Incentive Plan was approved by ISG stockholders. The following table lists information regarding outstanding options and shares reserved for future issuance under our 2007 Equity Incentive Plan as of December 31, 2009.
21
We have not issued any shares of our common stock to employees as compensation under a plan that has not been approved by our stockholders.
Plan Category
|
Number of Shares of Common Stock to be Issued upon Exercise of Outstanding Options, Warrants and Rights |
Weighted Average Exercise Price of Outstanding Options, Warrants and Rights(1) |
Number of Shares of Common Stock Remaining Available for Future Issuance under our Stock Option Plans (Excluding Shares Reflected in Column 1)(2) |
||||||||
|---|---|---|---|---|---|---|---|---|---|---|---|
Approved by Stockholders |
3,242,466 | $ | 5.12 | 1,356,340 | |||||||
Not Approved by Stockholders |
— | — | — | ||||||||
Total |
3,242,466 | $ | 5.12 | 1,356,340 | |||||||
- (1)
- The
weighted-average exercise price does not take into account the shares issuable upon vesting of outstanding stock awards which have no exercise price.
- (2)
- Includes 1,026,034 shares available for future issuance under the Company's Employee Stock Purchase Plan.
The following graph compares the cumulative 34 months total stockholder return on our Common Stock from February 12, 2007 (the day our common stock began publicly trading) through December 31, 2009, with the cumulative total return for the same period of (i) the NASDAQ Composite Index, (ii) the Russell 2000 Index and (iii) the Peer Group described below. The comparison assumes for the same period the investment of $100 on February 12, 2007 in our Common Stock and in each of the indices and, in each case, assumes reinvestment of all dividends.
COMPARISON OF 34 MONTH CUMULATIVE TOTAL RETURN*
Among Information Services Group Inc., The NASDAQ Composite Index,
The Russell 2000 Index And A Peer Group
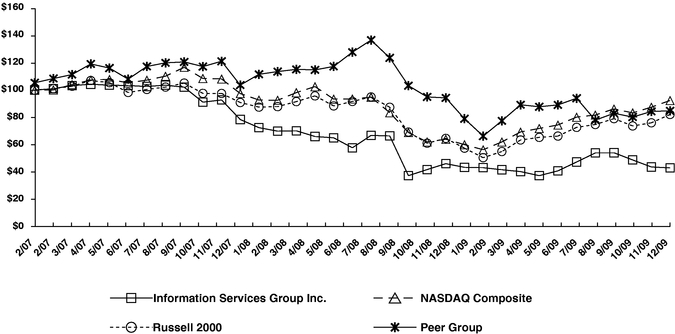
- *
- $100
invested on 2/12/07 in stock or index, including reinvestment of dividends.
Fiscal year ending December 31.
22
Measurement Periods
|
ISG | NASDAQ | Russell 2000 | Peer Group(a) | |||||||||
|---|---|---|---|---|---|---|---|---|---|---|---|---|---|
February 2007 |
$ | 100.14 | $ | 100.00 | $ | 100.00 | $ | 105.44 | |||||
March 2007 |
$ | 101.08 | $ | 100.16 | $ | 101.07 | $ | 108.54 | |||||
April 2007 |
$ | 103.39 | $ | 104.17 | $ | 102.89 | $ | 111.46 | |||||
May 2007 |
$ | 104.34 | $ | 107.44 | $ | 107.10 | $ | 119.23 | |||||
June 2007 |
$ | 103.66 | $ | 107.91 | $ | 105.53 | $ | 116.23 | |||||
July 2007 |
$ | 103.39 | $ | 105.37 | $ | 98.32 | $ | 108.08 | |||||
August 2007 |
$ | 102.71 | $ | 107.37 | $ | 100.54 | $ | 117.40 | |||||
September 2007 |
$ | 103.66 | $ | 110.27 | $ | 102.27 | $ | 120.06 | |||||
October 2007 |
$ | 102.17 | $ | 116.79 | $ | 105.20 | $ | 120.73 | |||||
November 2007 |
$ | 91.19 | $ | 108.59 | $ | 97.65 | $ | 117.32 | |||||
December 2007 |
$ | 92.82 | $ | 108.27 | $ | 97.59 | $ | 121.22 | |||||
January 2008 |
$ | 78.46 | $ | 97.53 | $ | 90.93 | $ | 103.71 | |||||
February 2008 |
$ | 72.49 | $ | 92.76 | $ | 87.56 | $ | 111.63 | |||||
March 2008 |
$ | 69.92 | $ | 92.61 | $ | 87.93 | $ | 113.65 | |||||
April 2008 |
$ | 70.19 | $ | 98.21 | $ | 91.61 | $ | 115.27 | |||||
May 2008 |
$ | 65.99 | $ | 102.64 | $ | 95.82 | $ | 114.88 | |||||
June 2008 |
$ | 65.04 | $ | 93.45 | $ | 88.44 | $ | 117.42 | |||||
July 2008 |
$ | 57.72 | $ | 93.57 | $ | 91.72 | $ | 127.87 | |||||
August 2008 |
$ | 66.80 | $ | 94.88 | $ | 95.03 | $ | 136.76 | |||||
September 2008 |
$ | 66.40 | $ | 83.49 | $ | 87.46 | $ | 123.72 | |||||
October 2008 |
$ | 37.26 | $ | 68.94 | $ | 69.26 | $ | 103.32 | |||||
November 2008 |
$ | 41.73 | $ | 62.04 | $ | 61.07 | $ | 95.04 | |||||
December 2008 |
$ | 46.07 | $ | 63.99 | $ | 64.62 | $ | 94.35 | |||||
January 2009 |
$ | 43.36 | $ | 60.03 | $ | 57.43 | $ | 79.05 | |||||
February 2009 |
$ | 43.09 | $ | 56.27 | $ | 50.45 | $ | 66.31 | |||||
March 2009 |
$ | 41.60 | $ | 62.02 | $ | 54.95 | $ | 77.51 | |||||
April 2009 |
$ | 40.24 | $ | 69.35 | $ | 63.45 | $ | 89.28 | |||||
May 2009 |
$ | 37.26 | $ | 71.91 | $ | 65.36 | $ | 87.83 | |||||
June 2009 |
$ | 40.79 | $ | 74.47 | $ | 66.32 | $ | 89.18 | |||||
July 2009 |
$ | 47.29 | $ | 80.25 | $ | 72.71 | $ | 94.07 | |||||
August 2009 |
$ | 53.93 | $ | 81.76 | $ | 74.79 | $ | 78.01 | |||||
September 2009 |
$ | 54.07 | $ | 86.24 | $ | 79.11 | $ | 83.03 | |||||
October 2009 |
$ | 48.78 | $ | 83.35 | $ | 73.74 | $ | 80.26 | |||||
November 2009 |
$ | 43.63 | $ | 87.53 | $ | 76.05 | $ | 84.37 | |||||
December 2009 |
$ | 42.95 | $ | 92.43 | $ | 82.17 | $ | 84.86 | |||||
- (a)
- The Peer Group consists of the following companies: CRA International Inc., Diamond Management and Technology Consultants, Inc., Forrester Research Inc., FTI Consulting, Inc., Gartner Group, Inc., Huron Consulting Group, Inc., LECG Corporation and The Hackett Group, Inc. The Peer Group is weighted by market capitalization.
Securities Purchased Under Stock Repurchase Program
As of December 31, 2009, ISG repurchased 12.1 million shares of common stock under a stock repurchase plan approved by the Board of Directors on October 16, 2007. This program includes the repurchase of common shares, units and/or warrants. On November 14, 2007, the ISG Board of Directors authorized an additional repurchase program of up to $15.0 million. There were no repurchases that were made during the three months ended December 31, 2009. As of December 31, 2009, there was $10.1 million available under this repurchase program.
23
Item 6. Selected Financial Data
The following historical information was derived from the audited consolidated financial statements of ISG and its subsidiaries for the years ended December 31, 2009, 2008, 2007 and the period beginning with ISG's inception (July 20, 2006) through December 31, 2006. The information for ISG for the year ended December 31, 2007 includes operations for TPI from November 17, 2007 through December 31, 2007. The information is only a summary and should be read in conjunction with the historical consolidated financial statements and related notes. The historical results included below are not indicative of the future performance of ISG.
| |
Years Ended | |
|||||||||||
|---|---|---|---|---|---|---|---|---|---|---|---|---|---|
| |
Period from July 20, 2006 (inception) to December 31, 2006 |
||||||||||||
| |
December 31, 2009 | December 31, 2008 | December 31, 2007 | ||||||||||
| |
(dollars in thousands, except per share data) |
||||||||||||
Statement of Operations Data: |
|||||||||||||
Revenues |
$ | 132,744 | $ | 174,795 | $ | 18,901 | $ | — | |||||
Depreciation and amortization |
9,562 | 10,000 | 910 | 2 | |||||||||
Operating income (loss)(1) |
814 | (1) | (57,642 | )(2) | (1,664 | ) | (51 | ) | |||||
Interest expense |
(4,550 | ) | (6,928 | ) | (1,174 | ) | (4 | ) | |||||
Interest income |
262 | 1,300 | 10,453 | — | |||||||||
Foreign currency transaction (loss) gain |
(140 | ) | 578 | 84 | — | ||||||||
Income tax benefit (provision) |
778 | 4,783 | (3,226 | ) | — | ||||||||
Net (loss) income |
(2,836 | ) | (57,909 | ) | 4,473 | (55 | ) | ||||||
Basic weighted average common shares |
31,491 | 31,282 | 36,465 | 7,096 | |||||||||
Net (loss) income per common share—basic |
(0.09 | ) | (1.85 | ) | 0.12 | (0.01 | ) | ||||||
Diluted weighted average common shares |
31,491 | 31,282 | 38,376 | 7,096 | |||||||||
Net (loss) income per common share—diluted |
(0.09 | ) | (1.85 | ) | 0.12 | (0.01 | ) | ||||||
Cash Flow Data: |
|||||||||||||
Cash provided by (used in): |
|||||||||||||
Operating activities |
$ | 4,056 | $ | 20,481 | $ | 5,921 | $ | (47 | ) | ||||
Investing activities ities |
$ | (1,239 | ) | $ | (1,634 | ) | $ | (203,630 | ) | $ | (48 | ) | |
Financing activities ities |
$ | (22,080 | ) | $ | (3,939 | ) | $ | 244,367 | $ | 184 | |||
Balance Sheet Data (at period end) |
|||||||||||||
Total assets |
$ | 241,973 | $ | 279,588 | $ | 357,290 | $ | 817 | |||||
Debt |
$ | 71,813 | $ | 94,050 | $ | 95,000 | $ | — | |||||
Shareholders' equity (deficit) |
$ | 131,625 | $ | 130,581 | $ | 190,788 | $ | (49 | ) | ||||
- (1)
- As
a result of its intangible asset impairment assessments, ISG recorded an impairment charge of $6.8 million during the third quarter of 2009
associated with intangible assets.
- (2)
- As a result of its goodwill and intangible asset impairment assessments, ISG recorded an impairment charge of $49.4 million during the fourth quarter of 2008 associated with goodwill and $24.8 million related to intangible assets.
The following historical information was derived from the audited consolidated financial statements of TPI and its subsidiaries for the period from January 1, 2007 through November 16, 2007
24
and as of and for the years ended December 31, 2006 and December 31, 2005. The information is only a summary and should be read in conjunction with the historical consolidated financial statements and related notes. The historical results included below are not indicative of the future performance of TPI.
| |
Period From January 1, 2007 to November 16, 2007 |
|
|
|||||||
|---|---|---|---|---|---|---|---|---|---|---|
| |
Years Ended December 31, | |||||||||
| |
2006 | 2005 | ||||||||
| |
(dollars in thousands) |
|||||||||
Statement of Operations Data: |
||||||||||
Revenues |
$ | 153,751 | $ | 161,503 | $ | 146,127 | ||||
Operating expenses: |
||||||||||
Direct costs and expenses for advisors |
91,368 | 95,562 | 83,690 | |||||||
Selling, general, and administrative |
45,287 | 50,585 | 45,100 | |||||||
Profit shares program compensation(1) |
58,175 | — | — | |||||||
Depreciation and amortization |
1,969 | 2,437 | 1,929 | |||||||
Operating (loss) income |
(43,048 | ) | 12,919 | 15,408 | ||||||
Interest income |
204 | 108 | 44 | |||||||
Interest expense |
(3,200 | ) | (3,821 | ) | (3,398 | ) | ||||
Loss on extinguishment of debt |
— | (527 | ) | — | ||||||
Foreign currency transaction gain (loss) |
335 | (136 | ) | (411 | ) | |||||
Income (loss) before taxes |
(45,709 | ) | 8,543 | 11,643 | ||||||
Income tax provision |
(4,948 | ) | (3,457 | ) | (5,176 | ) | ||||
Net (loss) income |
(50,657 | ) | 5,086 | 6,467 | ||||||
Cash Flow Data: |
||||||||||
Cash provided by (used in): |
||||||||||
Operating activities |
$ | 3,248 | $ | 3,437 | $ | 5,945 | ||||
Investing activities |
$ | (1,157 | ) | $ | (777 | ) | $ | (5,469 | ) | |
Financing activities |
$ | (613 | ) | $ | 261 | $ | 700 | |||
Balance Sheet Data: (end of period) |
||||||||||
Cash and cash equivalents |
$ | 9,454 | $ | 5,939 | ||||||
Total assets |
$ | 48,821 | $ | 47,680 | ||||||
Total stockholders' equity (deficit) |
$ | 572 | $ | (7,519 | ) | |||||
- (1)
- Concurrent with the ISG's acquisition of TPI on November 16, 2007, TPI recorded $58.2 million in non-cash compensation charges related to their Management Share Unit and A2 Profit Participation Share programs.
Item 7. Management's Discussion and Analysis of Financial Condition and Results of Operations
You should read the following discussion together with Item 6 "Selected Financial Data" and our audited consolidated financial statements and the related notes included in Item 8 "Financial Statements and Supplementary Data". In addition to historical consolidated financial information, this discussion contains forward-looking statements that reflect our plans, estimates and beliefs. These forward-looking statements are subject to numerous risks and uncertainties. Statements, other than those based on historical facts, which address activities, events or developments that we expect or anticipate may occur in the future are forward-looking statements. Such forward-looking statements are and will be, as the case may be, subject to many risks, uncertainties and factors relating to ISG's operations and business environment that may cause actual results to be materially different from any future results, express or implied, by such forward-looking statements. These forward-looking
25
statements must be understood in the context of numerous risks and uncertainties, including, but not limited to, those described previously in section 1A "Risk Factors."
ISG Overview
ISG was organized as a corporation under the laws of the State of Delaware on July 20, 2006. On November 16, 2007, ISG completed the acquisition of TPI, the largest independent sourcing advisory firm in the world. For the periods prior to the acquisition, ISG was a special purpose acquisition company and, therefore, had no operations. Following the acquisition of TPI, ISG transitioned from being a special-purpose acquisition company to an operating company.
ISG's reported results for the fiscal year ended December 31, 2007 include the operations of TPI for a six-week period from November 17, 2007 to December 31, 2007.
Because ISG had no operations prior to its acquisition of TPI, TPI is considered the accounting predecessor to ISG. Therefore, the standalone results of TPI's operations for the forty-six week period from January 1, 2007 to the consummation of the acquisition on November 16, 2007 are presented.
Results of Operations for the Years Ended December 31, 2009 and December 31, 2008
Revenues
Revenues are generally derived from engagements priced on a time and materials basis and are recorded based on actual time worked as the services are performed. Revenues related to materials (mainly out-of-pocket expenses such as airfare, lodging and meals) required during an engagement generally do not include a profit mark-up and can be charged and reimbursed discretely or as part of the overall fee arrangement. Invoices are issued to clients monthly, semimonthly or in accordance with the specific contractual terms of each project.
The Company operates in one segment, fact-based sourcing advisory services. The Company operates principally in the Americas, Europe, and Asia Pacific. The Company's foreign operations are subject to local government regulations and to the uncertainties of the economic and political conditions of those areas.
Geographical information for the segment is as follows:
| |
Years Ended December 31, | |||||||||||||
|---|---|---|---|---|---|---|---|---|---|---|---|---|---|---|
Geographic Area
|
2009 | 2008 | Change | Percent Change |
||||||||||
| |
(in thousands) |
|||||||||||||
Americas |
$ | 77,007 | $ | 96,548 | $ | (19,541 | ) | (20.2 | )% | |||||
Europe |
44,696 | 64,485 | (19,789 | ) | (30.7 | )% | ||||||||
Asia Pacific |
11,041 | 13,762 | (2,721 | ) | (19.8 | )% | ||||||||
Total revenues |
$ | 132,744 | $ | 174,795 | $ | (42,051 | ) | (24.1 | )% | |||||
The net decrease in revenues of $42.1 million or 24% in 2009 was attributable principally to a 20% decrease in Americas revenues to $77.0 million and a 29% decrease in international revenues to $55.7 million. The decrease in revenues is primarily due to lower levels of sourcing activity, particularly in the U.S. and Europe, attributable to uncertainty and delayed decision making by clients resulting from the prolonged worldwide economic downturn and the impact of foreign currency translation to U.S dollars on reported results. Declines in information technology ("IT") and business process outsourcing ("BPO") related sourcing activity were the primary contributors to this year-over-year decline. Billable staff at December 31, 2009 totaled 328, as compared to 342 at December 31, 2008.
26
Operating Expenses
The following table presents a breakdown of our operating expenses by functional category:
| |
Years Ended December 31, | |||||||||||||
|---|---|---|---|---|---|---|---|---|---|---|---|---|---|---|
Operating Expenses
|
2009 | 2008 | Change | Percent Change |
||||||||||
| |
(in thousands) |
|||||||||||||
Direct costs and expenses for advisors |
$ | 67,674 | $ | 96,311 | $ | (28,637 | ) | (29.7 | )% | |||||
Selling, general and administrative |
47,894 | 51,972 | (4,078 | ) | (7.8 | )% | ||||||||
Goodwill impairment charge |
— | 49,363 | (49,363 | ) | (100.0 | )% | ||||||||
Intangible asset impairment charge |
6,800 | 24,791 | (17,991 | ) | (72.6 | )% | ||||||||
Depreciation and amortization |
9,562 | 10,000 | (438 | ) | (4.4 | )% | ||||||||
Total operating expenses |
$ | 131,930 | $ | 232,437 | $ | (100,507 | ) | (43.2 | )% | |||||
The decrease in direct costs of $28.6 million or 30% was principally attributable to lower compensation due to a lower level of advisory staff, reduced provisions for performance based bonus programs and lower levels of client reimbursable expenses. Foreign currency translation also reduced costs in 2009 compared with the same 2008 period. Compensation costs consist of a mix of fixed and variable salaries, annual bonuses, benefits and pension plan contributions. Bonus compensation is determined based on achievement against Company financial and individual targets, and is accrued monthly throughout the year based on management estimates of target achievement. Statutory and elective pension plans are offered to employees as appropriate. Direct costs also include employee taxes, health insurance, workers compensation and disability insurance.
A portion of compensation expenses for certain billable employees are allocated between direct costs and selling, general and administrative costs based on relative time spent between billable and non-billable activities.
Selling costs consist principally of compensation expense related to business development, proposal preparation and delivery, and negotiation of new client contracts. Costs also include travel expenses relating to the pursuit of sales opportunities, expenses for hosting periodic client conferences, public relations activities, participation in industry conferences, industry relations, website maintenance and business intelligence activities. Additionally, the Company maintains a dedicated global marketing function responsible for developing and managing sales campaigns, brand promotion, the TPI Index and assembling proposals.
The Company maintains a comprehensive program for training and professional development. Related expenses include product training, updates on new service offerings or methodologies and development of client project management skills. Also included in training and professional development are expenses associated with the development, enhancement and maintenance of our proprietary methodologies and tools and the systems that support them.
General and administrative expenses consist principally of executive management compensation, allocations of billable employee compensation related to general management activities, IT infrastructure, and costs for the finance, accounting, information technology and human resource functions. General and administrative costs also reflect continued investment associated with implementing and operating client and employee management systems. Because our billable personnel operate primarily on client premises, all occupancy expenses are recorded as general and administrative.
The decrease of $4.1 million or 8% in selling and general and administrative ("SG&A") expenses was principally attributable to cost reductions of $2.4 million related to headcount and fixed and variable compensation levels, $1.1 million related to spending for outside professional services,
27
$0.7 million related to travel expenses, $0.6 million related to training, client development activity and the impact of foreign currency translation to U.S dollars on reported results. This reduction was partially offset by an increase of $1.1 million for severance charges, $0.8 million in share-based compensation, $0.3 million in computer related expenses and $0.2 million in bad debt reserves.
Depreciation and Amortization Expense
This decrease of $0.4 million was primarily due to the reduction of amortization expense for intangible assets impaired as part of the Company's intangible assets impairment testing conducted in 2008. The Company's fixed assets consist of furniture, fixtures, equipment (mainly personal computers) and leasehold improvements. Depreciation expense is generally computed by applying the straight-line method over the estimated useful lives of assets. The Company also capitalizes some costs associated with the purchase and development of internal-use software, system conversions and website development costs. These costs are amortized over the estimated useful life of the software or system.
The Company amortizes its intangible assets (e.g. client relationships and databases) over their estimated useful lives. Goodwill and trademark and trade names related to acquisitions is not amortized but is subject to annual impairment testing.
Impairment of goodwill and intangible assets
As a result of declining revenue, driven by a global recession which has impacted and reduced sourcing industry activity, the Company determined a triggering event had occurred requiring a goodwill and indefinite-lived intangibles impairment test be performed in the third quarter of 2009. The Company recorded a non-cash impairment charge of $6.8 million associated with indefinite-lived intangible assets. During the fourth quarter of 2008, the Company also recorded non-cash impairment charges of $49.4 million associated with goodwill and $24.8 million related to intangible assets as a result of its annual impairment testing.
Other (Expense), Net
The following table presents a breakdown of other (expense), net:
| |
Years Ended December 31, | |||||||||||||
|---|---|---|---|---|---|---|---|---|---|---|---|---|---|---|
| |
2009 | 2008 | Change | Percent Change |
||||||||||
| |
(in thousands) |
|||||||||||||
Interest income |
$ | 262 | $ | 1,300 | $ | (1,038 | ) | (79.8 | )% | |||||
Interest expense |
(4,550 | ) | (6,928 | ) | 2,378 | 34.3 | % | |||||||
Foreign currency (loss) gain |
(140 | ) | 578 | (718 | ) | (124.2 | )% | |||||||
Total other (expense), net |
$ | (4,428 | ) | $ | (5,050 | ) | $ | 622 | 12.3 | % | ||||
The decrease of $0.6 million was primarily the result of lower interest expense primarily due to $22.2 million of debt repayments partially offset by foreign currency related losses and lower interest income.
Income Tax Expense
The Company's effective tax rate varies from period to period based on the mix of earnings among the various state and foreign tax jurisdictions in which business is conducted and the level of non-deductible expenses incurred in any given period. The Company recorded an income tax benefit for 2009 of $0.8 million. The Company's effective tax rate for the year ended December 31, 2009 was 21.5% compared to 7.6% for the year ended December 31, 2008. The increase in the effective rate was primarily due to the impact of the goodwill impairment recorded in 2008 and the derecognition of deferred tax asset previously recorded on stock awards and booking of valuation allowance on foreign net operating losses in 2009.
28
Results of Operations for the Years Ended December 31, 2008 and December 31, 2007
ISG's financials for the year ended December 31, 2008 are not comparable to the year ended December 31, 2007 because the year ended December 31, 2007 comprised of only 6 weeks of operations for TPI as compared to 52 weeks for the year ended December 31, 2008. Also, ISG's financials for the year ended December 31, 2008 are not comparable to TPI's financials for the year ended December 31, 2007 since TPI's financials for the year ended December 31, 2007 comprised of only 46 weeks versus 52 weeks for ISG's financials for the year ended December 31, 2008.
Revenues
Revenues for the year ended December 31, 2008 was $174.8 million as compared to $18.9 million for the year ended December 31, 2007 which was primarily attributable to TPI being included in the results of operations for only six weeks during 2007. TPI's revenue for the 46 Week Period of 2007 was $153.8 million. The net increase of $2.1 million or 1.2% in 2008 was attributable principally to a 15% increase from international operations offset by an 8% revenue decline in the Americas region. The increase in ISG's international operations was fueled by the continuing expansion of demand for advisory services to support growing sourcing activity by companies in these regions. The decrease in revenues in the Americas was driven by lower booking activity in the third and fourth quarter of 2008 attributable primarily to uncertainty and delayed decision making by clients resulting from the U.S. economic downturn. Billable staff at December 31, 2008 totaled 342, as compared to 360 at December 31, 2007.
Operating Expenses
Direct costs were $96.3 million (55% of revenue) in 2008 as compared to $12.2 million (65% of revenue) which were primarily attributable to the last six weeks of ISG's 2007 operations consisting primarily of compensation related costs for revenue-generating professionals and client-related reimbursable expenses. TPI's direct costs for the 46 Week Period of 2007 were $91.4 million. The net decrease of $7.3 million or 7.0% was principally the result of cost reduction actions taken under the Value Creation Plan ("VCP") program in 2008, somewhat offset by investments in new product and service offerings and an increase in provisions for performance based bonuses.
SG&A expenses of $52.0 million in 2008 as compared to $7.4 million which were primarily attributable to the last six weeks of ISG's 2007 operations consist primarily of personnel costs related to sales and marketing staff, training and professional development programs, and general and administrative expenses for corporate staff and billable advisors. TPI's SG&A expenses for the 46 Week Period of 2007 were $45.3 million. The net decrease of $0.7 million in SG&A for fiscal 2008 were due primarily to the factors outlined below:
- •
- Selling and marketing expenses decreased approximately $3.2 million due primarily to a reduction in staffing level;
- •
- Expenses for training and professional development decreased approximately $0.7 million due to the increased
efficiencies in the planning and execution of training-related events and other timing related factors; and
- •
- General and administrative expenses increased approximately $3.2 million attributable to increased stock based compensation expense of $2.0 million, increased provisions of $1.7 million for performance based variable incentive bonuses and higher professional fees of $0.5 million. These were partially offset by decrease of $0.8 million in severance payments and a $0.3 million reduction in staffing level.
29
Depreciation and Amortization Expense
Depreciation and amortization expense for 2008 was $10.0 million as compared to $0.9 million in 2007 which was primarily attributable to TPI only being included for only six weeks of operations in 2007.
TPI's depreciation and amortization expense for the 46 Week Period of 2007 was $2.0 million. This net increase of $7.1 million in the fiscal 2008 is primarily attributable to the amortization of intangible assets acquired in connection with the acquisition of TPI.
Impairment of goodwill and intangible assets
The Company recorded a non-cash impairment charge of $49.4 million associated with goodwill and $24.8 million related to intangible assets as a result of its annual impairment test during the fourth quarter of 2008. The impairment primarily resulted from the sustained decline in the market value of Company's common stock during the fourth quarter as well as the challenging macro-economic factors impacting industry conditions, actual results and our projections.
Other Income (Expense), Net
Other expense, net, for 2008 totaled $5.1 million consisting mainly of interest expense incurred in conjunction with ISG's debt facilities as compared to other income, net of $9.4 million for 2007, which consists mainly of interest income accumulated on cash balances raised through the IPO of ISG which were used primarily for the Acquisition. Other expense, net for TPI for the 46 Week Period of 2007 was $2.7 million, which was primarily interest expense, related to its debt facilities.
Income Tax Expense
Income tax benefit for 2008 was $4.8 million. The Company's effective tax rate for the year ended December 31, 2008 was 7.6% compared to 41.9% for the year ended December 31, 2007. The decrease in the effective rate was primarily due to the impact of the goodwill impairment recorded in the fourth quarter of 2008.
Liquidity and Capital Resources
Liquidity
The Company's primary sources of liquidity are cash flows from operations and existing cash and cash equivalents. Operating assets and liabilities consist primarily of receivables from billed and unbilled services, accounts payable, accrued expenses, and accrued payroll and related benefits. The volume of billings and timing of collections and payments affect these account balances.
30
The following table summarizes ISG's cash flows for the years ended December 31, 2009, 2008 and 2007:
| |
Years Ended (in thousands) |
|||||||||||
|---|---|---|---|---|---|---|---|---|---|---|---|---|
| |
December 31, 2009 |
December 31, 2008 |
December 31, 2007 |
|||||||||
Net cash provided by (used in): |
||||||||||||
Operating activities |
$ | 4,056 | $ | 20,481 | $ | 5,921 | ||||||
Investing activities, including acquisitions |
(1,239 | ) | (1,634 | ) | (203,630 | ) | ||||||
Financing activities |
(22,080 | ) | (3,939 | ) | 244,367 | |||||||
Effect of exchange rate changes on cash |
903 | (939 | ) | 430 | ||||||||
Net (decrease) increase in cash and cash equivalents |
$ | (18,360 | ) | $ | 13,969 | $ | 47,088 | |||||
As of December 31, 2009, the Company's liquidity and capital resources included cash and cash equivalents of $42.8 million compared to $61.1 million as of December 31, 2008, a net decrease of $18.4 million, which was primarily attributable to the following:
- •
- Our operating activities provided net cash of $4.1 million for the year ended December 31, 2009. Net cash
provided from operations is primary attributable to net income, adjusted for non-cash charges totaling approximately $12.0 million. Our cash collections in 2009 provided cash from
operations of approximately $2.9 million was more than offset by payments of $1.2 million for severance payments and $8.9 million for the payout of bonuses earned during 2008;
- •
- capital expenditures for property, plant and equipment of $1.2 million; and
- •
- payment of principal on the Company's term loan debt of $22.2 million.
Capital Resources
On November 16, 2007, in connection with the acquisition of TPI, International Consulting Acquisition Corp., a wholly-owned indirect subsidiary of ISG (the "Borrower"), entered into a senior secured credit facility comprised of a $95.0 million term loan facility and a $10.0 million revolving credit facility (collectively referred to as the 2007 Credit Agreement). On November 16, 2007, the Borrower borrowed $95.0 million under the term loan facility to finance a portion of the purchase price for the TPI acquisition and to pay transaction costs. The material terms of the 2007 Credit Agreement are as follows:
- •
- The 2007 Credit Agreement has a maturity date of seven years from the closing of the TPI acquisition.
- •
- The 2007 Credit Agreement is secured by all of the equity interests owned by the newly formed holding company of the
Borrower, International Advisory Holdings Corp. ("Holdings") and its direct and indirect domestic subsidiaries and, subject to agreed exceptions, its direct and indirect "first-tier"
foreign subsidiaries and a perfected first priority security interest in all of Holdings' and its direct and indirect domestic subsidiaries' tangible and intangible assets.
- •
- Holdings and the Borrower's existing direct and indirect subsidiaries and future wholly-owned domestic subsidiaries serve
as guarantors to the Borrower's obligations under the 2007 Credit Agreement.
- •
- At the Borrower's option, the 2007 Credit Agreement bears interest at a rate per annum equal to either (i) the "Base Rate" (which is the higher of (a) the rate publicly announced from time to time by the administrative agent as its "prime rate" and (b) the Federal Funds Rate plus
31
- •
- Mandatory repayments of term loans shall be required from (subject to agreed exceptions) (i) 100% of the proceeds
from asset sales by Holdings and its subsidiaries, (ii) 100% of the net proceeds from issuances of debt by Holdings and its subsidiaries, (iii) so long as the total leverage ratio is 3.0
to 1.0 or higher, 50% of annual excess cash flow of Holdings and its subsidiaries and (iv) 100% of the net proceeds from insurance recovery and condemnation events of Holdings and its
subsidiaries.
- •
- The 2007 Credit Agreement contains a number of covenants that, among other things, place restrictions on matters
customarily restricted in senior secured credit facilities, including restrictions on indebtedness (including guarantee obligations), liens, fundamental changes, sales or disposition of property or
assets, investments (including loans, advances, guarantees and acquisitions), transaction with affiliates, dividends and other payments in respect of capital stock, optional payments and modifications
of other material debt instruments, negative pledges and agreements restricting subsidiary distributions and changes in line of business. In addition, the Borrower is required to comply with a total
leverage ratio as defined in the 2007 Credit Agreement. The total leverage ratio is defined as the ratio of consolidated indebtedness to consolidated EBITDA.
- •
- The 2007 Credit Agreement contains customary events of default, including cross-default to other material agreements, judgment default and change of control.
0.5% per annum), plus the applicable margin (as defined below) or (ii) Eurodollar Rate (adjusted for maximum reserves) as determined by the Administrative Agent, plus the applicable margin. The applicable margin shall be a percentage per annum equal to 2.5% for the term loans and the revolving loans maintained as Base Rate loans or 3.5% for the term loans and revolving loans maintained as Eurodollar loans.
As of December 31, 2009, the total principal outstanding under the term loan facility was $71.8 million. There were no borrowings under the revolving credit facility during fiscal 2009.
Under the 2007 Credit Agreement, the Company is required to hedge at least 40% of borrowings outstanding under the term loan facility. Subsequent to December 31, 2007, the Company entered into an agreement to cap the interest rate at 7% on $38.0 million of the LIBOR component of our borrowings under the term loan facility for a period of three years. The expense related to this interest rate cap was nominal.
On June 29, 2009, the Company made a voluntary principal prepayment of $12.0 million against its outstanding term loan balance of $93.8 million. In conjunction with this prepayment, our lenders consented to the following conditions: (1) agreement to execute the Company's UK tax planning strategy to reduce future potential cash taxes, (2) exclusion of the impact in the calculation of EBITDA of up to $5.0 million of restructuring charges relating to the Borrower's previously announced 2009 restructuring plan through December 31, 2009 and (3) exclusion of the impact in the calculation of EBITDA of establishing, if necessary, a reserve in respect of certain accounts receivable and work in progress due from General Motors Corporation for worked performed on or before June 1, 2009.
On September 11, 2009, our lenders agreed to amend the total leverage ratio (as defined) for the remaining life of the 2007 Credit Agreement to provide the Company with greater financing flexibility in return for additional debt repayments. In accordance with the terms of the amended 2007 Credit Agreement, the Company made $5.0 million of principal repayments on September 30, 2009 and December 31, 2009 to reduce the outstanding term loan balance to $71.8 million. The principal repayments were made from excess cash balances generated through the Company's normal business operations. An additional mandatory principal repayment of $2.0 million is due on March 31, 2010. The remaining mandatory term loan principal repayment will be due on November 16, 2014, which is the maturity date for the term loan.
32
Contractual Obligations
The following table summarizes the Company's contractual obligations as of December 31, 2009, and the timing and effect that such obligations are expected to have on the Company's liquidity and capital requirements in future periods.
Contractual Obligations
|
Total | Less than 1 Year |
1 – 3 Years | 3 – 5 Years | More Than 5 Years |
|||||||||||
|---|---|---|---|---|---|---|---|---|---|---|---|---|---|---|---|---|
| |
(In Thousands) |
|||||||||||||||
Debt obligations, principal and interest |
$ | 86,140 | $ | 4,947 | $ | 8,804 | $ | 72,389 | $ | — | ||||||
Operating lease obligations |
3,588 | 1,119 | 1,914 | 555 | — | |||||||||||
Total |
$ | 89,728 | $ | 6,066 | $ | 10,718 | $ | 72,944 | $ | — | ||||||
Excluded from the above table is a $0.2 million liability (or reserve) for uncertain tax positions TPI has taken or is expected to take on its tax returns. The reserve was recorded as a result of TPI's adoption of accounting standard related to accounting for uncertainty in income taxes on January 1, 2007 and recorded by the Company in its purchase accounting for TPI.
The Company believes that cash flows generated from operations, existing cash and cash equivalents and borrowing capacity under our new senior secured credit facility are sufficient to finance the requirements of our business during future periods.
Off-Balance Sheet Arrangements
ISG does not have any off-balance sheet financing arrangements or liabilities, guarantee contracts, retained or contingent interests in transferred assets or any obligation arising out of a material variable interest in an unconsolidated entity.
Employee Retirement Plans
The Company maintains a qualified defined contribution profit-sharing plan (the "Plan") for U.S.-based employees. Prior to January 1, 2008, contributions to the Plan were made by the Company up to a maximum per eligible employee of 12.75% of total cash compensation or $25,500, whichever was less. Post January 1, 2008, the annual contribution was adjusted to be 3% of total cash compensation or $7,350, whichever is less. Employees are generally eligible to participate in the Plan after six months of service, and are 100% vested upon entering the Plan. For the fiscal years ended December 31, 2009, December 31, 2008 and the 46 Week Period ended November 16, 2007, TPI contributed $1.6 million, $1.5 million and $5.9 million, respectively, to the Plan. These amounts were invested by the participants in a variety of investment options under an arrangement with a third party asset manager. All current and future financial risks associated with the gains and losses on investments are borne by Plan participants.
Seasonality and Quarterly Results
The negotiation of sourcing transactions and, as a result, our revenue and earnings are subject to seasonal fluctuations. As a result of year-end holidays, macro-economic factors and client budget and spending patterns, our revenues have historically been weighted toward the second half of each year. Our earnings track this revenue seasonality and are also impacted by the timing of the adoption of annual price increases and certain costs and, as a result, have historically been higher in the second half of each year. Due to the seasonality of our business, results for any quarter are not necessarily indicative of the results that may be achieved for a full fiscal year.
33
Critical Accounting Policies and Estimates
The preparation of consolidated financial statements in conformity with generally accepted accounting principles requires the appropriate application of certain accounting policies, many of which require management to make estimates and assumptions about future events and their impact on amounts reported in our consolidated financial statements and related notes. Since future events and their impact cannot be determined with certainty, the actual results may differ from estimates. Such differences may be material to the consolidated financial statements.
The Company believes the application of accounting policies, and the estimates inherently required therein, are reasonable. These accounting policies and estimates are periodically reevaluated, and adjustments are made when facts and circumstances dictate a change. Historically, the Company has found the application of accounting policies to be appropriate, and actual results have not differed materially from those determined using necessary estimates.
The Company's accounting policies are more fully described in Note 2 "Summary of Significant Accounting Policies" in the "Notes to the Consolidated Financial Statements." The Company has identified the following critical accounting policies:
Revenue Recognition
In accordance with the provisions of accounting standard for revenue recognition, we recognize our revenues for the sale of services and products when persuasive evidence of an arrangement exists, services have been rendered or delivery has occurred, the fee is fixed or determinable and the collectability of the related revenue is reasonably assured.
The Company principally derives revenues from fees for services generated on a project-by-project basis. Prior to the commencement of a project, the Company reaches agreement with the client on rates for services based upon the scope of the project, staffing requirements and the level of client involvement. It is the Company's policy to obtain written agreements from new clients prior to performing services. In these agreements, the clients acknowledge that they will pay based upon the amount of time spent on the project or an agreed upon fee structure. Revenues for services rendered are recognized on a time and materials basis or on a fixed-fee or capped-fee basis in accordance with accounting and disclosure requirements for revenue recognition.
Fees for services that have been performed, but for which the Company has not invoiced the customers are recorded as unbilled receivables in the accompanying consolidated balance sheets. Invoices issued before the related services have been performed are recorded as deferred revenue in the accompanying consolidated balance sheets.
Revenues for time and materials contracts are recognized based on the number of hours worked by the Company's advisors at an agreed upon rate per hour and are recognized in the period in which services are performed. Revenues for time and materials contracts are billed monthly, semimonthly or in accordance with the specific contractual terms of each project.
Revenues related to fixed-fee or capped-fee contracts are recognized into revenue as value is delivered to the customer. The pattern of revenue recognition for these contracts varies depending on the terms of the individual contracts, and may be recognized proportionally or deferred until the end of the contract term and recognized when our obligations have been fulfilled with the customer. The pattern of revenue recognition for the proportional contracts is recognized on the proportional performance method of accounting based on the ratio of labor hours incurred to estimated total labor hours, which the Company considers to be the best available indicator of the pattern and timing in which contract obligations are fulfilled. This percentage is multiplied by the contracted dollar amount of the project to determine the amount of revenue to recognize in an accounting period. The contracted amount used in this calculation typically excludes the amount the client pays for
34
reimbursable expenses. There are situations where the number of hours to complete projects may exceed the Company's original estimate as a result of an increase in project scope or unforeseen events. On regular basis, the Company reviews the hours incurred and estimated total labor hours to complete. The results of any revisions in these estimates are reflected in the period in which they become known. The Company believes it has a demonstrated history of successfully estimating the total labor hours to complete a project.
The agreements entered into in connection with a project, whether on a time and materials basis or fixed-fee or capped-fee basis, typically allow the Company's clients to terminate early due to breach or for convenience with 30 days' notice. In the event of termination, the client is contractually required to pay for all time, materials and expenses incurred by the Company through the effective date of the termination. In addition, from time to time, the Company enters into agreements with clients that limit the Company's right to enter into business relationships with specific competitors of that client for a specific time period. These provisions typically prohibit the Company from performing a defined range of services that it might otherwise be willing to perform for potential clients. These provisions are generally limited to six to twelve months and usually apply only to specific employees or the specific project team.
Accounts and Unbilled Receivables and Allowance for Doubtful Accounts
Our trade receivables primarily consist of amounts due for services already performed via fixed fee or time and materials arrangements. The Company maintains an allowance for doubtful accounts for estimated losses resulting from the inability of clients to pay fees or for disputes that affect its ability to fully collect billed accounts receivable. The allowance for these risks is prepared by reviewing the status of all accounts and recording reserves on a specific identification method based on previous experiences and historical bad debts. However, our actual experience may vary significantly from these estimates. If the financial condition of our clients were to deteriorate, resulting in their inability or unwillingness to pay their invoices, we may need to record additional allowances or write-offs in future periods. To the extent the provision relates to a client's inability or unwillingness to make required payments, the provision is recorded as bad debt expense, which is classified within selling, general and administrative expense in the accompanying consolidated statement of operations.
The provision for unbilled services is recorded as a reduction to revenues to the extent the provision relates to fee adjustments and other discretionary pricing adjustments.
Direct Costs and Expenses for Advisors
Direct costs and expenses for advisors include payroll expenses and advisory fees directly associated with the generation of revenues and other program expenses. Direct costs and expenses for advisors are expensed as incurred.
Direct costs and expenses for advisors also include expense accruals for discretionary bonus payments. Bonus accrual levels are adjusted throughout the year based on actual and projected individual and company performance.
Income Taxes
The Company uses the asset and liability method to account for income taxes, including recognition of deferred tax assets and liabilities for the anticipated future tax consequences attributable to differences between financial statement amounts and their respective tax basis. The Company reviews its deferred tax assets for recovery. A valuation allowance is established when the Company believes that it is more likely than not that some portion of its deferred tax assets will not be realized. Changes in the valuation allowance from period to period are included in the Company's tax provision in the period of change.
35
In June 2006, the Financial Accounting Standards Board ("FASB") issued authoritative guidance for uncertain income tax positions recognized in an enterprise's financial statements in accordance with the Income Tax Topic of the Accounting Standards Codification ("ASC"). This interpretation requires companies to use a prescribed model for assessing the financial recognition and measurement of all tax positions taken or expected to be taken in its tax returns. This guidance provides clarification on derecognition, classification, interest and penalties, accounting in interim periods, disclosures and transition. We adopted this guidance on January 1, 2007.
Business Combinations
In December 2007, the FASB revised the authoritative guidance for business combinations, establishing principles and requirements for how an acquirer recognizes and measures in its financial statements the identifiable assets acquired (including goodwill), the liabilities assumed, and any noncontrolling interest in the acquiree. Subsequently, on April 1, 2009, the FASB amended and clarified certain aspects of its authoritative guidance on initial recognition and measurement, subsequent measurement and accounting, and disclosure of assets and liabilities arising from contingencies in a business combination. We apply the FASB authoritative guidance to all business combinations for which the acquisition date is on or after January 1, 2009, and to certain future income tax effects related to our prior business combinations, should they arise. In these acquisitions, tangible and intangible assets acquired and liabilities assumed are recorded at fair value and goodwill is recognized for any difference between the price of the acquisition and our fair value determination.
Goodwill and Intangible Assets
The Company's goodwill represents the cost of businesses acquired less the fair value of the net assets acquired at the date of acquisition. The primary other identifiable intangible assets of the Company with indefinite lives are trademark and trade name. These assets are not amortized but rather tested for impairment at least annually by applying a fair-value based test in accordance with accounting and disclosure requirement for goodwill and other intangible assets. This test is performed by the Company during its fourth fiscal quarter or more frequently if the Company believes impairment indicators are present.
The provisions require that we perform a two-step impairment test on goodwill. In the first step, we compare the fair value of the reporting unit to its carrying amount, including goodwill. If the carrying value of the reporting unit exceeds the fair value of the reporting unit, then we must perform the second step of the impairment test whereby the carrying value of the reporting unit's goodwill is compared to its implied fair value. If the carrying value of the goodwill exceeds the implied fair value, an impairment loss equal to the difference is recorded. As a result of declining revenue, driven by a global recession which has impacted and reduced sourcing industry activity, the Company determined a triggering event had occurred requiring a goodwill impairment test be performed during the third quarter of 2009.
The estimates of fair value of a reporting unit are determined using a combination of valuation techniques, primarily by an income approach using a discounted cash flow analysis and a market-based approach. The income approach utilizes a discounted cash flow model and is based on management's projections of future operations as of the valuation date. A discounted cash flow analysis requires the use of various assumptions, including expectations of future cash flows, growth rates, discount rates and tax rates in developing the present value of future cash flow projections. Many of the factors used in assessing fair value are outside of the control of management, and these assumptions and estimates can change in future periods. Changes in assumptions or estimates could materially affect the determination
36
of the fair value of a reporting unit, and therefore could affect the amount of potential impairment. The following assumptions are significant to our discounted cash flow analysis:
- •
- Business projections—the assumptions of expected future cash
flows and growth rates are based on assumptions about the level of business activity in the marketplace as well as applicable cost levels that drive our budget and business plans. The budget and
business plans are updated at least annually and are frequently reviewed by management and our Board of Directors.
- •
- Long-term growth rates—the assumed
long-term growth rate representing the expected rate at which a reporting unit's earnings stream, beyond that of the budget and business plan period, is projected to grow. These rates are
used to calculate the terminal value, or value at the end of the future earnings stream, of our reporting units, and are added to the cash flows projected for the budget and business plan period.
- •
- Discount rates—the reporting unit's combined future cash flows are discounted at a rate that is consistent with a weighted-average cost of capital that is likely to be used by market participants. The weighted-average cost of capital is our estimate of the overall after-tax rate of return required by equity and debt holders of a business enterprise.
We also use a market-based approach in estimating the fair value of our reporting unit. The market approach is based on the Company's stock price and provides a direct indication of fair value. Under the market approach, we determined the fair value of the reporting unit utilizing a relevant average of the Company's common stock price for the measurement period plus a control premium based upon recent transactions of comparable companies.
Our indefinite-lived intangible assets impairment tests involve estimates and management's judgment. The fair value of trademarks and trade name assets were determined using the relief from royalty method by discounting the cash flows that represent a savings as compared to a royalty fee for use of the trademarks and trade names. The discounted cash flow valuation uses the same projections and assumptions under the income approach method described above. Due to the challenging macro-economic factors impacting industry conditions in the third quarter of 2009, we concluded that the indefinite life trademarks and trade names were impaired by $6.8 million. This impairment charge was measured as the excess of the carrying value over the fair value of the asset. The intangible assets impairment charge is non-cash in nature and does not affect the Company's liquidity, cash flows from operations or its debt covenants.
The Company tested the fair values of the goodwill and indefinite-lived intangible assets during our scheduled annual impairment testing in the fourth quarter of 2009 and determined there was no additional impairment.
The Company will continue to monitor its market capitalization for evidence of further impairment. Future downturn in our business, continued deterioration of economic conditions, or a continued decline in our market capitalization may result in additional impairment charge or charges in future periods which could adversely affect our results of operations for those periods.
Long-Lived Assets
Long-lived assets, excluding goodwill and indefinite-lived intangibles, to be held and used by the Company are reviewed to determine whether any significant change in the long-lived asset's physical condition, a change in industry conditions or a reduction in cash flows associated with the use of the long-lived asset. If these or other factors indicate the carrying amount of the asset may not be recoverable, the Company determines whether an impairment has occurred through the use of an undiscounted cash flow analysis of the asset at the lowest level for which identifiable cash flows exist. If an impairment has occurred, the Company recognizes a loss for the difference between the carrying amount and the fair value of the asset. The fair value of the asset is measured using market prices or,
37
in the absence of market prices, an estimate of discounted cash flows. Cash flows are generally discounted at an interest rate commensurate with our weighted average cost of capital for a similar asset. Assets are classified as held for sale when the Company has a plan for disposal of certain assets and those assets meet the held for sale criteria of accounting and disclosure requirement for the impairment or disposal of long-lived assets.
Stock-Based Compensation
Stock Appreciation Rights ("SARs") for a fixed number of shares are granted to certain employees and directors with an exercise price based on the closing trading price of the Company's common stock on the grant date. The Company uses the Black-Scholes option pricing model to determine the fair value of each option award on the date of grant. The volatility calculation is based on the most recent trading day average volatility of a representative sample of nine companies with market capitalizations of approximately $65 million to $645 million that management believes to be engaged in the business of information services (the "Sample Companies"). Because the Company does not have a trading history, the Company needed to estimate the potential volatility of its common stock price, which depends on a number of factors which cannot be ascertained at this time. The Company referred to the average volatility of the Sample Companies because management believes that the average volatility of such companies is a reasonable benchmark to use in estimating the expected volatility of the Company's common stock post-business combination. The risk-free interest rate is determined based upon the interest rate on a U.S. Treasury Bill with a term equal to the expected life of the option at the time the option was granted. An expected life of five years was taken into account for purposes of assigning a fair value to the option. The expected life represents the period of time the awards granted are expected to be outstanding.
The Company also grants restricted stock with a fair value that is determined based on the closing price of the Company's common stock on the date of grant. SARs and restricted stock generally vest over a four-year period. Stock-based compensation expense is recognized ratably over the applicable service period.
The Company follows the provisions of accounting and disclosures requirement for share-based payments, requiring the measurement and recognition of all share-based compensation under the fair value method.
Recent Accounting Pronouncements
See Note 2 to our consolidated financial statements included elsewhere in this report.
Item 7A. Quantitative and Qualitative Disclosures About Market Risk
The Company is exposed to financial market risks primarily related to changes in interest rates and manages these risks by employing a variety of debt instruments. Although we do not believe a change in interest rates will materially affect our financial position or results of financial operations, it has purchased an interest rate cap to limit our exposure for forty percent of the total term loan value to an increase in LIBOR rates beyond seven percent. A 100 basis point change in interest rates would result in an annual change in the results of operations of $0.7 million pre-tax.
We operate in a number of international areas which exposes us to significant foreign currency exchange rate risk. We have significant international revenue, which is generally collected in local currency. We currently do not hold or issue forward exchange contracts or other derivative instruments for hedging or speculative purposes. The percentage of total revenues generated outside the Americas increased from 22% in 2004 to 42% in 2009. It is expected that our international revenues will continue to grow as European, Asian and other market adopt sourcing solutions. We recorded a foreign exchange transaction loss of $0.1 million for the year ended December 31, 2009. The translation of our
38
revenues into U.S. dollars, as well as our costs of operating internationally, may adversely affect our business, results of operations and financial condition.
The Company has not invested in foreign operations in highly inflationary economies; however, we may do so in future periods.
Concentrations of credit risk consist primarily of cash and cash equivalents and accounts receivable. All cash and cash equivalents are on deposit in fully liquid form in high quality financial institutions. We extend credit to our clients based on an evaluation of each client's financial condition.
TPI's 20 largest clients accounted for approximately 44% of revenue in 2009 and 48% in 2008. In particular, revenues from clients in the automobile sector collectively accounted for approximately 15% of our 2009 annual revenue. Although only General Motors accounts for more than 10% of our revenues, if one or more of our large clients terminate or significantly reduce their engagements or fail to remain a viable business, then our revenues could be materially and adversely affected. In addition, our large clients generally maintain sizable receivable balances at any given time and our ability to collect such receivables could be jeopardized if such client fails to remain a viable business.
Item 8. Financial Statements and Supplementary Data.
Reference is made to our financial statements beginning on page F-3 of this report.
Item 9. Changes in and Disagreements with Accountants on Accounting and Financial Disclosure
None
Item 9A. Controls and Procedures
Disclosure Controls and Procedures
Our disclosure controls and procedures are designed to ensure that information required to be disclosed in the reports that we file or submit under the Securities Exchange Act of 1934 as amended (the "Exchange Act") is recorded, processed, summarized and reported within the time periods specified in the rules and forms of the Securities and Exchange Commission, and that such information is accumulated and communicated to ISG's management, including our Chief Executive Officer and Chief Financial Officer, as appropriate, to allow timely decisions regarding required disclosure. Our management, with the participation of our Chief Executive Officer and Chief Financial Officer, evaluated the effectiveness of our disclosure controls and procedures as of December 31, 2009, as required by the Rule 13a-15(b) under the Exchange Act. Based on that evaluation, the Chief Executive Officer and Chief Financial Officer concluded that the Company's disclosure controls and procedures were effective as of December 31, 2009.
Management's Report on Internal Control Over Financial Reporting
Management of ISG is responsible for establishing and maintaining adequate internal control over financial reporting, as such term is defined in Rule 13a-15(f) under the Exchange Act. Our internal control over financial reporting is a process designed to provide reasonable assurance regarding the reliability of financial reporting and the preparation of ISG's financial statements for external reporting purposes in accordance with US generally accepted accounting principles. Because of its inherent limitations, internal control over financial reporting may not prevent or detect misstatements. Also, projections of any evaluation of effectiveness to future periods are subject to the risk that controls may become inadequate because of changes in conditions, or that the degree of compliance with the policies or procedures may deteriorate.
39
Under the supervision and with the participation of ISG's management, including ISG's Chief Executive Officer and Chief Financial Officer, we conducted an evaluation of the effectiveness of the internal control over financial reporting of ISG as of December 31, 2009, as required by Rule 13a-15(c) under the Exchange Act. In making this assessment, ISG used the criteria set forth in the framework in Internal Control—Integrated Framework issued by the Committee of Sponsoring Organizations of the Treadway Commission. Based on its evaluation under the framework in Internal Control—Integrated Framework, management concluded that ISG's internal control over financial reporting was effective as of December 31, 2009.
The effectiveness of the Company's internal control over financial reporting as of December 31, 2009, has been audited by PricewaterhouseCoopers LLP, an independent registered public accounting firm, as stated in their report which appears herein.
Changes in Internal Control Over Financial Reporting
There have not been any changes in the Company's internal control over financial reporting (as such term is defined in Rules 13a-15(f) and 15d-15(f) under the Exchange Act) during the quarter ended December 31, 2009 that have materially affected, or are reasonably likely to materially affect, the Company's internal control over financial reporting.
None.
40
Item 10. Directors, Executive Officers and Corporate Governance
- (a)
- Identification of Director's and Executive Officers.
The information required hereunder is incorporated by reference from the sections of ISG's Proxy Statement filed in connection with our 2010 Annual Meeting of Stockholders under the caption "Management."
- (b)
- Compliance with Section 16(a) of the Exchange Act.
The information required hereunder is incorporated by reference from the sections ISG's Proxy Statement filed in connection with our 2010 Annual Meeting of Stockholders under the caption "Section 16(a) Beneficial Ownership Reporting Compliance."
- (c)
- Code of Ethics.
The information required hereunder is incorporated by reference from the sections of ISG's Proxy Statement filed in connection with our 2010 Annual Meeting of Stockholders under the caption "Corporate Governance."
- (d)
- Nominating Committee, Audit Committee, Audit Committee Financial Expert.
The information required hereunder is incorporated by reference from the sections of ISG's Proxy Statement filed in connection with our 2010 Annual Meeting of Stockholders under the caption "Corporate Governance."
Item 11. Executive Compensation
The information required hereunder is incorporated by reference from the sections of the ISG's Proxy Statement filed in connection with its 2010 Annual Meeting of Stockholders under the caption "Compensation of Officers and Directors."
Item 12. Security Ownership of Certain Beneficial Owners and Management and Related Stockholder Matters
The information required hereunder is incorporated by reference from the sections of the ISG's Proxy Statement filed in connection with its 2010 Annual Meeting of Stockholders under the caption "Security Ownership of Certain Beneficial Owners."
Item 13. Certain Relationships and Related Transactions and Director Independence
The information required hereunder is incorporated by reference from the sections in ISG's Proxy Statement filed in connection with its 2010 Annual Meeting of the Stockholders under the caption "Corporate Governance."
Item 14. Principal Accounting Fees and Services
The information required hereunder is incorporated by reference from the sections in ISG's Proxy Statement filed in connection with its 2010 Annual Meeting of the Stockholders under the caption "Proposal No. 2 Ratification of Engagement of Independent Registered Public Accounting Firm."
41
Item 15. Exhibits and Financial Statement Schedules
(a)(1) Documents filed as a part of this report:
Financial Statements of Information Services Group, Inc.: |
|||||
Reports of Independent Registered Public Accounting Firm |
F-1 |
||||
Consolidated Balance Sheets |
F-2 |
||||
Consolidated Statement of Operations |
F-3 |
||||
Consolidated Statement of Stockholders' Equity |
F-4 |
||||
Consolidated Statement of Cash Flows |
F-5 |
||||
Notes to Consolidated Financial Statements |
F-6 |
||||
Financial Statements of Technology Partners International, Inc. and Subsidiaries: |
|||||
Reports of Independent Registered Public Accounting Firm |
F-39 |
||||
Consolidated Statement of Operations |
F-40 |
||||
Consolidated Statement of Stockholders' Equity (Deficit) |
F-41 |
||||
Consolidated Statement of Cash Flows |
F-42 |
||||
Notes to Consolidated Financial Statements |
F-43 |
||||
(a)(2) Financial Statement Schedules
Schedule II—Valuation and Qualifying Accounts
(a)(3) Exhibits:
We hereby file as part of this Annual Report on Form 10-K the Exhibits listed in the attached Exhibit Index.
42
Report of Independent Registered Public Accounting Firm
To
the Board of Directors and Stockholders of
Information Services Group, Inc:
In our opinion, the accompanying consolidated balance sheets and the related consolidated statements of operations, stockholders' equity and cash flows present fairly, in all material respects, the financial position of Information Services Group, Inc. and its subsidiaries at December 31, 2009 and 2008, and the results of their operations and their cash flows for each of the three years in the period ended December 31, 2009 in conformity with accounting principles generally accepted in the United States of America. In addition, in our opinion, the financial statement schedule listed in the index appearing under Item 15 (a)(2) presents fairly, in all material respects, the information set forth therein when read in conjunction with the related consolidated financial statements. Also in our opinion, the Company maintained, in all material respects, effective internal control over financial reporting as of December 31, 2009, based on criteria established in Internal Control—Integrated Framework issued by the Committee of Sponsoring Organizations of the Treadway Commission (COSO). The Company's management is responsible for these financial statements and financial statement schedule, for maintaining effective internal control over financial reporting and for its assessment of the effectiveness of internal control over financial reporting, included in Management's Report on Internal Control Over Financial Reporting appearing under Item 9A. Our responsibility is to express opinions on these financial statements, on the financial statement schedule and on the Company's internal control over financial reporting based on our audits (which were integrated audits in 2009 and 2008). We conducted our audits in accordance with the standards of the Public Company Accounting Oversight Board (United States). Those standards require that we plan and perform the audits to obtain reasonable assurance about whether the financial statements are free of material misstatement and whether effective internal control over financial reporting was maintained in all material respects. Our audits of the financial statements included examining, on a test basis, evidence supporting the amounts and disclosures in the financial statements, assessing the accounting principles used and significant estimates made by management, and evaluating the overall financial statement presentation. Our audit of internal control over financial reporting included obtaining an understanding of internal control over financial reporting, assessing the risk that a material weakness exists, and testing and evaluating the design and operating effectiveness of internal control based on the assessed risk. Our audits also included performing such other procedures as we considered necessary in the circumstances. We believe that our audits provide a reasonable basis for our opinions.
A company's internal control over financial reporting is a process designed to provide reasonable assurance regarding the reliability of financial reporting and the preparation of financial statements for external purposes in accordance with generally accepted accounting principles. A company's internal control over financial reporting includes those policies and procedures that (i) pertain to the maintenance of records that, in reasonable detail, accurately and fairly reflect the transactions and dispositions of the assets of the company; (ii) provide reasonable assurance that transactions are recorded as necessary to permit preparation of financial statements in accordance with generally accepted accounting principles, and that receipts and expenditures of the company are being made only in accordance with authorizations of management and directors of the company; and (iii) provide reasonable assurance regarding prevention or timely detection of unauthorized acquisition, use, or disposition of the company's assets that could have a material effect on the financial statements.
Because of its inherent limitations, internal control over financial reporting may not prevent or detect misstatements. Also, projections of any evaluation of effectiveness to future periods are subject to the risk that controls may become inadequate because of changes in conditions, or that the degree of compliance with the policies or procedures may deteriorate.
/s/ PricewaterhouseCoopers LLP
Houston,
Texas
March 8, 2010
F-1
INFORMATION SERVICES GROUP, INC.
CONSOLIDATED BALANCE SHEETS
(in thousands, except par value)
| |
December 31, 2009 |
December 31, 2008 |
|||||||
|---|---|---|---|---|---|---|---|---|---|
ASSETS |
|||||||||
Current assets |
|||||||||
Cash and cash equivalents |
$ | 42,786 | $ | 61,146 | |||||
Accounts and unbilled receivables, net of allowance of $206 and $132, respectively |
26,273 | 29,105 | |||||||
Deferred tax asset |
2,137 | 2,577 | |||||||
Prepaid expense and other current assets |
1,424 | 1,313 | |||||||
Total current assets |
72,620 | 94,141 | |||||||
Furniture, fixtures and equipment, net of accumulated depreciation of $2,941 and $1,337, respectively |
2,586 |
2,771 |
|||||||
Goodwill |
95,065 | 95,249 | |||||||
Intangible assets, net |
70,072 | 85,016 | |||||||
Other assets |
1,630 | 2,411 | |||||||
Total assets |
$ | 241,973 | $ | 279,588 | |||||
LIABILITIES AND STOCKHOLDERS' EQUITY |
|||||||||
Current liabilities |
|||||||||
Accounts payable |
$ | 1,859 | $ | 2,635 | |||||
Current maturities of long-term debt |
2,000 | 950 | |||||||
Deferred revenue |
1,672 | 1,472 | |||||||
Accrued expenses |
9,392 | 19,948 | |||||||
Total current liabilities |
14,923 | 25,005 | |||||||
Long-term debt, net of current maturities |
69,813 |
93,100 |
|||||||
Deferred tax liability |
25,411 | 30,902 | |||||||
Other liabilities |
201 | — | |||||||
Total liabilities |
110,348 | 149,007 | |||||||
Commitments and contingencies (Note 14) |
|||||||||
Stockholders' equity |
|||||||||
Preferred stock, $.001 par value; 10,000 shares authorized; none issued |
— | — | |||||||
Common stock, $.001 par value, 100,000 shares authorized; 31,816 shares issued and 31,800 outstanding at December 31, 2009 and 31,358 shares issued and 31,308 outstanding at December 31, 2008 |
32 | 31 | |||||||
Additional paid-in capital |
189,601 | 186,716 | |||||||
Treasury stock (16 and 50 common shares, respectively, at cost) |
(57 | ) | (249 | ) | |||||
Accumulated other comprehensive loss |
(1,521 | ) | (2,412 | ) | |||||
Accumulated deficit |
(56,430 | ) | (53,505 | ) | |||||
Total stockholders' equity |
131,625 | 130,581 | |||||||
Total liabilities and shareholders' equity |
$ | 241,973 | $ | 279,588 | |||||
The accompanying notes are an integral part of these consolidated financial statements.
F-2
INFORMATION SERVICES GROUP, INC.
CONSOLIDATED STATEMENT OF OPERATIONS
(in thousands, except per share data)
| |
Years Ended December 31, | ||||||||||
|---|---|---|---|---|---|---|---|---|---|---|---|
| |
2009 | 2008 | 2007 | ||||||||
Revenues |
$ | 132,744 | $ | 174,795 | $ | 18,901 | |||||
Operating expenses |
|||||||||||
Direct costs and expenses for advisors |
67,674 | 96,311 | 12,246 | ||||||||
Selling, general and administrative |
47,894 | 51,972 | 7,409 | ||||||||
Goodwill impairment charge |
— | 49,363 | — | ||||||||
Intangible assets impairment charge |
6,800 | 24,791 | — | ||||||||
Depreciation and amortization |
9,562 | 10,000 | 910 | ||||||||
Operating income (loss) |
814 | (57,642 | ) | (1,664 | ) | ||||||
Interest income |
262 |
1,300 |
10,453 |
||||||||
Interest expense |
(4,550 | ) | (6,928 | ) | (1,174 | ) | |||||
Foreign currency transaction (loss) gain |
(140 | ) | 578 | 84 | |||||||
(Loss) income before taxes |
(3,614 | ) | (62,692 | ) | 7,699 | ||||||
Income tax (benefit) provision |
(778 | ) | (4,783 | ) | 3,226 | ||||||
Net (loss) income |
$ | (2,836 | ) | $ | (57,909 | ) | $ | 4,473 | |||
Weighted average shares outstanding: |
|||||||||||
Basic |
31,491 | 31,282 | 36,465 | ||||||||
Diluted |
31,491 | 31,282 | 38,376 | ||||||||
Earnings (loss) per share: |
|||||||||||
Basic |
$ | (0.09 | ) | $ | (1.85 | ) | $ | 0.12 | |||
Diluted |
$ | (0.09 | ) | $ | (1.85 | ) | $ | 0.12 | |||
The accompanying notes are an integral part of these consolidated financial statements.
F-3
INFORMATION SERVICES GROUP, INC.
CONSOLIDATED STATEMENT OF STOCKHOLDERS' EQUITY
(in thousands)
| |
Common Stock | |
|
Accumulated Other Comprehensive Loss |
|
|
|||||||||||||||||
|---|---|---|---|---|---|---|---|---|---|---|---|---|---|---|---|---|---|---|---|---|---|---|---|
| |
Additional Paid-in- Capital |
Treasury Stock |
(Accumulated Deficit) |
Total Stockholders' Equity |
|||||||||||||||||||
| |
Shares | Amount | |||||||||||||||||||||
Balance, December 31, 2006 |
8,086 | $ | 8 | $ | (2 | ) | $ | — | $ | — | $ | (55 | ) | $ | (49 | ) | |||||||
Comprehensive income: |
|||||||||||||||||||||||
Net income |
— | — | — | — | — | 4,473 | 4,473 | ||||||||||||||||
Foreign currency translation, net of tax of $281 |
— | — | — | — | (739 | ) | — | (739 | ) | ||||||||||||||
Total comprehensive income |
3,734 | ||||||||||||||||||||||
Sale of 32,344 units on February 6, 2007 at a price of $8 per unit (each unit consisting of one share of common stock and one warrant to purchase a share of common stock), net underwriters' discount and offering costs of $17,773 (including 6,469 shares subject to possible redemption) |
32,344 | 32 | 240,945 | — | — | — | 240,977 | ||||||||||||||||
Shares redeemed and retired |
(4,094 | ) | (4 | ) | (32,538 | ) | — | — | — | (32,542 | ) | ||||||||||||
Issuance of 6,500 warrants in private placement |
— | — | 6,500 | — | — | — | 6,500 | ||||||||||||||||
Issuance of options to underwriters to purchase 1,406 units |
— | — | — | — | — | — | — | ||||||||||||||||
Equity securities repurchased and retired |
(7,852 | ) | (8 | ) | (62,343 | ) | — | — | — | (62,351 | ) | ||||||||||||
Warrants issued for acquisition |
— | — | 13,600 | — | — | — | 13,600 | ||||||||||||||||
Issuance of common stock for acquisition |
2,882 | 3 | 20,746 | — | — | — | 20,749 | ||||||||||||||||
Stock based compensation |
— | — | 170 | — | — | — | 170 | ||||||||||||||||
Balance December 31, 2007 |
31,366 | 31 | 187,078 | — | (739 | ) | 4,418 | 190,788 | |||||||||||||||
Comprehensive loss: |
|||||||||||||||||||||||
Net loss |
— | — | — | — | — | (57,909 | ) | (57,909 | ) | ||||||||||||||
Foreign currency translation, net of tax of $1,197 |
— | — | — | — | (1,673 | ) | — | (1,673 | ) | ||||||||||||||
Total comprehensive loss |
(59,582 | ) | |||||||||||||||||||||
Restricted stocks units granted |
— | — | 401 | — | — | — | 401 | ||||||||||||||||
Equity securities repurchased |
(8 | ) | — | (2,496 | ) | (739 | ) | — | — | (3,235 | ) | ||||||||||||
Issuance of treasury shares |
— | — | (230 | ) | 490 | — | (14 | ) | 246 | ||||||||||||||
Stock based compensation |
— | — | 1,963 | — | — | — | 1,963 | ||||||||||||||||
Balance December 31, 2008 |
31,358 | 31 | 186,716 | (249 | ) | (2,412 | ) | (53,505 | ) | 130,581 | |||||||||||||
Comprehensive loss: |
|||||||||||||||||||||||
Net loss |
— | — | — | — | — | (2,836 | ) | (2,836 | ) | ||||||||||||||
Foreign currency translation, net of tax of $546 |
— | — | — | — | 891 | — | 891 | ||||||||||||||||
Total comprehensive loss |
(1,945 | ) | |||||||||||||||||||||
Issuance of common stock |
458 | 1 | 81 | — | — | — | 82 | ||||||||||||||||
Equity securities repurchased |
— | — | — | (86 | ) | — | — | (86 | ) | ||||||||||||||
Issuance of treasury shares |
— | — | (27 | ) | 278 | — | (89 | ) | 162 | ||||||||||||||
Stock based compensation |
— | — | 2,831 | — | — | — | 2,831 | ||||||||||||||||
Balance December 31, 2009 |
31,816 | $ | 32 | $ | 189,601 | $ | (57 | ) | $ | (1,521 | ) | $ | (56,430 | ) | $ | 131,625 | |||||||
The accompanying notes are an integral part of these consolidated financial statements.
F-4
INFORMATION SERVICES GROUP, INC.
CONSOLIDATED STATEMENT OF CASH FLOWS
(in thousands)
| |
Years Ended December 31, | ||||||||||
|---|---|---|---|---|---|---|---|---|---|---|---|
| |
2009 | 2008 | 2007 | ||||||||
Cash flows from operating activities |
|||||||||||
Net (loss) income |
$ | (2,836 | ) | $ | (57,909 | ) | $ | 4,473 | |||
Adjustments to reconcile net (loss) income to net cash provided by operating activities: |
|||||||||||
Depreciation expense |
1,419 | 1,529 | 187 | ||||||||
Goodwill impairment charge |
— | 49,363 | — | ||||||||
Intangible assets impairment charge |
6,800 | 24,791 | — | ||||||||
Amortization of intangible assets |
8,143 | 8,471 | 722 | ||||||||
Amortization of deferred financing costs |
784 | 529 | 73 | ||||||||
Stock-based compensation |
2,831 | 1,963 | 170 | ||||||||
Bad debt expense |
510 | 275 | — | ||||||||
Deferred tax benefit |
(5,653 | ) | (12,152 | ) | (298 | ) | |||||
Loss on disposal of fixed assets |
5 | 8 | 5 | ||||||||
Changes in operating assets and liabilities: |
|||||||||||
Accounts receivable |
2,856 | 4,761 | 186 | ||||||||
Prepaid expense and other current assets |
(112 | ) | 1,268 | (1,072 | ) | ||||||
Accounts payable |
(776 | ) | (2,125 | ) | 2,777 | ||||||
Deferred revenue |
200 | (656 | ) | 1,941 | |||||||
Accrued expenses |
(10,115 | ) | 365 | (3,243 | ) | ||||||
Net cash provided by operating activities |
4,056 | 20,481 | 5,921 | ||||||||
Cash flows from investing activities |
|||||||||||
Purchase of furniture, fixtures and equipment |
(1,239 | ) | (1,634 | ) | (237 | ) | |||||
Acquisition, net of cash acquired |
— | — | (203,393 | ) | |||||||
Net cash used in investing activities |
(1,239 | ) | (1,634 | ) | (203,630 | ) | |||||
Cash flows from financing activities |
|||||||||||
Proceeds from debt |
— | — | 95,000 | ||||||||
Principal payments on borrowings |
(22,238 | ) | (950 | ) | — | ||||||
Debt issuance costs |
— | — | (2,967 | ) | |||||||
Payment of notes payable to stockholder |
— | — | (250 | ) | |||||||
Proceeds from issuance of ESPP shares |
82 | — | — | ||||||||
Proceeds from issuance of warrants in private placement |
— | — | 6,500 | ||||||||
Gross proceeds from public offering |
— | — | 258,750 | ||||||||
Payments for underwriters' discount and offering cost |
— | — | (17,773 | ) | |||||||
Redemption of shares |
— | — | (32,542 | ) | |||||||
Issuance of treasury stock |
162 | 246 | — | ||||||||
Equity securities repurchased |
(86 | ) | (3,235 | ) | (62,351 | ) | |||||
Net cash (used in) provided by financing activities |
(22,080 | ) | (3,939 | ) | 244,367 | ||||||
Effect of exchange rate changes on cash |
903 | (939 | ) | 430 | |||||||
Net (decrease) increase in cash and cash equivalents |
(18,360 | ) | 13,969 | 47,088 | |||||||
Cash and cash equivalents, beginning of period |
61,146 | 47,177 | 89 | ||||||||
Cash and cash equivalents, end of period |
$ | 42,786 | $ | 61,146 | $ | 47,177 | |||||
Supplemental disclosures of cash flow information: |
|||||||||||
Cash paid for: |
|||||||||||
Interest |
$ | 4,157 | $ | 6,240 | $ | 477 | |||||
Taxes |
$ | 5,205 | $ | 5,499 | $ | 394 | |||||
Noncash investing and financing activities: |
|||||||||||
Warrants issued for acquisition |
$ | — | $ | — | $ | 13,600 | |||||
Issuance of common stock for acquisition |
$ | — | $ | — | $ | 20,749 | |||||
Accrual of transaction costs |
$ | — | $ | — | $ | 4,468 | |||||
Purchase price adjustments |
$ | 240 | $ | 1,721 | $ | — | |||||
Issuance of restricted stock units in connection with VCP |
$ | — | $ | 401 | $ | — | |||||
Issuance of treasury stock for ESPP and vested restricted stock awards |
$ | 117 | $ | 244 | $ | — | |||||
The accompanying notes are an integral part of these consolidated financial statements.
F-5
INFORMATION SERVICES GROUP, INC.
NOTES TO CONSOLIDATED FINANCIAL STATEMENTS
(tabular amounts in thousands, except per share data)
NOTE 1—DESCRIPTION OF ORGANIZATION AND BUSINESS OPERATIONS
Information Services Group, Inc. (the "Company") was incorporated in Delaware on July 20, 2006. The Company was formed to acquire, through a merger, capital stock exchange, asset or stock acquisition or other similar business combination one or more domestic or international operating businesses.
The registration statement for the Company's initial public offering (the "Offering") (as described in Note 3) was declared effective on January 31, 2007. The Company consummated the Offering on February 6, 2007. Preceding the consummation of the Offering, an affiliate of the Company's officers purchased 6,500,000 warrants at $1 per warrant in a private placement (the "Private Placement") (see Note 15). The Company received net proceeds of $255.4 million from the Private Placement and the Offering. The Company's management had broad discretion with respect to the specific application of the net proceeds of the Offering, although substantially all of the net proceeds of the Offering were to be applied toward consummating a business combination with (or acquisition of) an operating business in the information services industry ("Business Combination"). This operating company was subsequently identified as TPI Advisory Services Americas, Inc., a Texas corporation ("TPI").
On November 16, 2007 (the "Acquisition Date"), the Company consummated the acquisition of TPI (the "Acquisition"), pursuant to a Purchase Agreement (the "Purchase Agreement") dated April 24, 2007, as amended on September 30, 2007, by and between MCP-TPI Holdings, LLC, a Texas limited liability company ("MCP-TPI"), and the Company. For accounting purposes, the Acquisition has been treated as a business combination. The results of TPI are included in the consolidated financial statements subsequent to the Acquisition Date. During the periods prior to the Acquisition Date, the Company was in the development stage.
We have evaluated subsequent events for recognition or disclosure through March 8, 2010, which was the date we filed this Form 10-K with the SEC.
The Company operates as a fact-based sourcing advisory firm specializing in the assessment, evaluation, negotiation and management of service contracts between our clients and those clients' outside service providers and their internal shared service organizations. These service contracts typically involve the clients' information technology ("IT") infrastructure or software applications development, data and voice communications, or IT-enabled business processes such as the clients' internal finance and accounting functions, human resources, call center operations, or supply chain procurement. Over 40% of our clients are Forbes Global 2000 corporations in the United States, Canada, Western Europe, Asia and Australia who are seeking to enter into or streamline their third-party outsourcing contracts. Clients are primarily charged on an hourly basis plus expenses. We also enter into a limited number of fixed fee arrangements. Services are rendered by our consultants who are primarily based throughout the Americas, Europe, and Asia Pacific.
NOTE 2—SUMMARY OF SIGNIFICANT ACCOUNTING POLICIES
Basis of Presentation and Principles of Consolidation
The consolidated financial statements include the accounts of the Company and its wholly-owned subsidiaries. All significant intercompany accounts and transactions have been eliminated in consolidation. Unless the context requires otherwise, references to the Company include ISG and its consolidated subsidiaries.
F-6
INFORMATION SERVICES GROUP, INC.
NOTES TO CONSOLIDATED FINANCIAL STATEMENTS (Continued)
(tabular amounts in thousands, except per share data)
NOTE 2—SUMMARY OF SIGNIFICANT ACCOUNTING POLICIES (Continued)
Accounting Standards Codification
The Consolidated financial statements of the Company have been prepared in accordance with accounting principles generally accepted in the United States. In June 2009, the Financial Accounting Standards Board ("FASB") established the FASB Accounting Standards Codification ("ASC" or "Codification") as the source of authoritative U.S. GAAP recognized by the FASB to be applied by non-governmental entities. Following the Codification, the FASB will not issue new standards in the form of Statements, FASB Staff Positions or Emerging Issues Task Force ("EITF') Abstracts. Instead, it will issue Accounting Standards Updates to update the Codification. The Codification is effective for interim or annual financial periods ending after September 15, 2009. We adopted the Codification in the third quarter of 2009, and its adoption did not impact our consolidated financial statements.
Use of Estimates
The preparation of financial statements in conformity with accounting principles generally accepted in the United States of America requires management to make estimates and assumptions that affect the reported amounts of assets and liabilities and the disclosure of contingent assets and liabilities at the date of the financial statements and revenues and expenses during the periods reported. Actual results may differ from those estimates. The complexity of the estimation process and issues related to the assumptions, risks and uncertainties inherent in the application of the proportional performance method of accounting affect the amounts of revenues, expenses, unbilled receivables and deferred revenue. Numerous internal and external factors can affect estimates. Estimates are also used for but not limited to: allowance for doubtful accounts, useful lives of furniture, fixtures and equipment, depreciation expense, fair value assumptions in analyzing goodwill and intangible asset impairments, income taxes and deferred tax asset valuation, and the valuation of stock based compensation.
Business Combinations
In December 2007, the FASB revised the authoritative guidance for business combinations, establishing principles and requirements for how an acquirer recognizes and measures in its financial statements the identifiable assets acquired (including goodwill), the liabilities assumed, and any noncontrolling interest in the acquiree. Subsequently, on April 1, 2009, the FASB amended and clarified certain aspects of its authoritative guidance on initial recognition and measurement, subsequent measurement and accounting, and disclosure of assets and liabilities arising from contingencies in a business combination. We apply the FASB authoritative guidance to all business combinations for which the acquisition date is on or after January 1, 2009, and to certain future income tax effects related to our prior business combinations, should they arise. In these acquisitions, tangible and intangible assets acquired and liabilities assumed are recorded at fair value and goodwill is recognized for any difference between the price of the acquisition and our fair value determination.
Cash and Cash Equivalents
The Company considers all highly liquid instruments with an original maturity of three months or less to be cash equivalents, including certain money market accounts. The Company principally maintains its cash in money market and bank deposit accounts in the United States of America which typically exceed applicable insurance limits. The Company believes it is not exposed to any significant credit risk on cash and cash equivalents.
F-7
INFORMATION SERVICES GROUP, INC.
NOTES TO CONSOLIDATED FINANCIAL STATEMENTS (Continued)
(tabular amounts in thousands, except per share data)
NOTE 2—SUMMARY OF SIGNIFICANT ACCOUNTING POLICIES (Continued)
Accounts and Unbilled Receivables and Allowance for Doubtful Accounts
Our trade receivables primarily consist of amounts due for services already performed via fixed fee or time and materials arrangements. The Company maintains an allowance for doubtful accounts for estimated losses resulting from the inability of clients to pay fees or for disputes that affect its ability to fully collect billed accounts receivable. The allowance for these risks is prepared by reviewing the status of all accounts and recording reserves on a specific identification method based on previous experiences and historical bad debts. However, our actual experience may vary significantly from these estimates. If the financial condition of our clients were to deteriorate, resulting in their inability or unwillingness to pay their invoices, we may need to record additional allowances or write-offs in future periods. To the extent the provision relates to a client's inability or unwillingness to make required payments, the provision is recorded as bad debt expense, which is classified within selling, general and administrative expense in the accompanying consolidated statement of operations.
The provision for unbilled services is recorded as a reduction to revenues to the extent the provision relates to fee adjustments and other discretionary pricing adjustments.
Prepaid Expenses and Other Assets
Prepaid expenses and other assets consist primarily of prepaid expenses for insurance, conferences as well as deposits for facilities, programs and promotion items.
Furniture, Fixtures and Equipment, net
Furniture, fixtures and equipment is recorded at cost. Depreciation is computed by applying the straight-line method over the estimated useful life of the assets, which range from two to five years. Leasehold improvements are depreciated over the lesser of the useful life of the underlying asset or the lease term, which generally range from three to five years. Expenditures for renewals and betterments are capitalized. Repairs and maintenance are charged to expense as incurred. The cost and accumulated depreciation of assets sold or otherwise disposed of are removed from the accounts and any associated gain or loss thereon is reflected in the accompanying consolidated statement of operations.
Internal-Use Software and Website Development Costs
The Company capitalizes internal-use software and website development costs and records these amounts within furniture, fixtures and equipment. Accounting standards require that certain costs related to the development or purchase of internal-use software and systems as well as the costs incurred in the application development stage related to its website be capitalized and amortized over the estimated useful life of the software or system. They also require that costs related to the preliminary project stage, data conversion and post implementation/operation stage of an internal-use software development project be expensed as incurred.
During the year ended December 31, 2009 and 2008 the Company capitalized $0.3 and $1.1 million of costs associated with the system conversion and website development, respectively.
F-8
INFORMATION SERVICES GROUP, INC.
NOTES TO CONSOLIDATED FINANCIAL STATEMENTS (Continued)
(tabular amounts in thousands, except per share data)
NOTE 2—SUMMARY OF SIGNIFICANT ACCOUNTING POLICIES (Continued)
Goodwill and Intangible Assets
The Company's goodwill represents the cost of businesses acquired less the fair value of the net assets acquired at the date of acquisition. The primary other identifiable intangible assets of the Company with indefinite lives are trademark and trade name. These assets are not amortized but rather tested for impairment at least annually by applying a fair-value based test in accordance with accounting and disclosure requirement for goodwill and other intangible assets. This test is performed by the Company during its fourth fiscal quarter or more frequently if the Company believes impairment indicators are present.
The provisions require that we perform a two-step impairment test on goodwill. In the first step, we compare the fair value of the reporting unit to its carrying amount, including goodwill. If the carrying value of the reporting unit exceeds the fair value of the reporting unit, then we must perform the second step of the impairment test whereby the carrying value of the reporting unit's goodwill is compared to its implied fair value. If the carrying value of the goodwill exceeds the implied fair value, an impairment loss equal to the difference is recorded. As a result of declining revenue, driven by a global recession which has impacted and reduced sourcing industry activity, the Company determined a triggering event had occurred requiring a goodwill impairment test be performed during the third quarter of 2009.
The estimates of fair value of a reporting unit are determined using a combination of valuation techniques, primarily by an income approach using a discounted cash flow analysis and a market-based approach. The income approach utilizes a discounted cash flow model and is based on management's projections of future operations as of the valuation date. A discounted cash flow analysis requires the use of various assumptions, including expectations of future cash flows, growth rates, discount rates and tax rates in developing the present value of future cash flow projections. Many of the factors used in assessing fair value are outside of the control of management, and these assumptions and estimates can change in future periods. Changes in assumptions or estimates could materially affect the determination of the fair value of a reporting unit, and therefore could affect the amount of potential impairment. The following assumptions are significant to our discounted cash flow analysis:
- •
- Business projections—the assumptions of expected future cash
flows and growth rates are based on assumptions about the level of business activity in the marketplace as well as applicable cost levels that drive our budget and business plans. The budget and
business plans are updated at least annually and are frequently reviewed by management and our Board of Directors.
- •
- Long-term growth rates—the assumed
long-term growth rate representing the expected rate at which a reporting unit's earnings stream, beyond that of the budget and business plan period, is projected to grow. These rates are
used to calculate the terminal value, or value at the end of the future earnings stream, of our reporting units, and are added to the cash flows projected for the budget and business plan period.
- •
- Discount rates—the reporting unit's combined future cash flows are discounted at a rate that is consistent with a weighted-average cost of capital that is likely to be used by market participants. The weighted-average cost of capital is our estimate of the overall after-tax rate of return required by equity and debt holders of a business enterprise.
F-9
INFORMATION SERVICES GROUP, INC.
NOTES TO CONSOLIDATED FINANCIAL STATEMENTS (Continued)
(tabular amounts in thousands, except per share data)
NOTE 2—SUMMARY OF SIGNIFICANT ACCOUNTING POLICIES (Continued)
We also use a market-based approach in estimating the fair value of our reporting unit. The market approach is based on the Company's stock price and provides a direct indication of fair value. Under the market approach, we determined the fair value of the reporting unit utilizing a relevant average of the Company's common stock price for the measurement period plus a control premium based upon recent transactions of comparable companies.
Our indefinite-lived intangible assets impairment tests involve estimates and management's judgment. The fair value of trademarks and trade name assets were determined using the relief from royalty method by discounting the cash flows that represent a savings as compared to a royalty fee for use of the trademarks and trade names. The discounted cash flow valuation uses the same projections and assumptions under the income approach method described above. Due to the challenging macro-economic factors impacting industry conditions in the third quarter of 2009, we concluded that the indefinite life trademarks and trade names were impaired by $6.8 million. This impairment charge was measured as the excess of the carrying value over the fair value of the asset. The intangible assets impairment charge is non-cash in nature and does not affect the Company's liquidity, cash flows from operations or its debt covenants.
The Company tested the fair values of the goodwill and indefinite-lived intangible assets during our scheduled annual impairment testing in the fourth quarter of 2009 and determined there was no additional impairment.
The Company will continue to monitor its market capitalization for evidence of further impairment. Future downturn in our business, continued deterioration of economic conditions, or a continued decline in our market capitalization may result in additional impairment charge or charges in future periods which could adversely affect our results of operations for those periods.
Long-Lived Assets
Long-lived assets, excluding goodwill and indefinite-lived intangibles, to be held and used by the Company are reviewed to determine whether any significant change in the long-lived asset's physical condition, a change in industry conditions or a reduction in cash flows associated with the use of the long-lived asset. If these or other factors indicate the carrying amount of the asset may not be recoverable, the Company determines whether an impairment has occurred through the use of an undiscounted cash flow analysis of the asset at the lowest level for which identifiable cash flows exist. If an impairment has occurred, the Company recognizes a loss for the difference between the carrying amount and the fair value of the asset. The fair value of the asset is measured using market prices or, in the absence of market prices, an estimate of discounted cash flows. Cash flows are generally discounted at an interest rate commensurate with our weighted average cost of capital for a similar asset. Assets are classified as held for sale when the Company has a plan for disposal of certain assets and those assets meet the held for sale criteria of accounting and disclosure requirement for the impairment or disposal of long-lived assets.
Debt Issuance Costs
Costs directly incurred in obtaining long-term financing, typically bank and attorney fees, are deferred and are amortized over the life of the related loan using the effective interest method. Deferred issuance costs are classified as other assets in the accompanying consolidated balance sheet.
F-10
INFORMATION SERVICES GROUP, INC.
NOTES TO CONSOLIDATED FINANCIAL STATEMENTS (Continued)
(tabular amounts in thousands, except per share data)
NOTE 2—SUMMARY OF SIGNIFICANT ACCOUNTING POLICIES (Continued)
Amortization of debt issuance costs is included in interest expense and totaled $0.8 million and $0.5 million for the years ended December 31, 2009 and 2008, respectively.
Revenue Recognition
In accordance with the provisions of accounting standard for revenue recognition, we recognize our revenues for the sale of services and products when persuasive evidence of an arrangement exists, services have been rendered or delivery has occurred, the fee is fixed or determinable and the collectability of the related revenue is reasonably assured.
The Company principally derives revenues from fees for services generated on a project-by-project basis. Prior to the commencement of a project, the Company reaches agreement with the client on rates for services based upon the scope of the project, staffing requirements and the level of client involvement. It is the Company's policy to obtain written agreements from new clients prior to performing services. In these agreements, the clients acknowledge that they will pay based upon the amount of time spent on the project or an agreed upon fee structure. Revenues for services rendered are recognized on a time and materials basis or on a fixed-fee or capped-fee basis in accordance with accounting and disclosure requirements for revenue recognition.
Fees for services that have been performed, but for which the Company has not invoiced the customers are recorded as unbilled receivables in the accompanying consolidated balance sheets. Invoices issued before the related services have been performed are recorded as deferred revenue in the accompanying consolidated balance sheets.
Revenues for time and materials contracts are recognized based on the number of hours worked by the Company's advisors at an agreed upon rate per hour and are recognized in the period in which services are performed. Revenues for time and materials contracts are billed monthly, semimonthly or in accordance with the specific contractual terms of each project.
Revenues related to fixed-fee or capped-fee contracts are recognized into revenue as value is delivered to the customer. The pattern of revenue recognition for these contracts varies depending on the terms of the individual contracts, and may be recognized proportionally or deferred until the end of the contract term and recognized when our obligations have been fulfilled with the customer. The pattern of revenue recognition for the proportional contracts is recognized on the proportional performance method of accounting based on the ratio of labor hours incurred to estimated total labor hours, which the Company considers to be the best available indicator of the pattern and timing in which contract obligations are fulfilled. This percentage is multiplied by the contracted dollar amount of the project to determine the amount of revenue to recognize in an accounting period. The contracted amount used in this calculation typically excludes the amount the client pays for reimbursable expenses. There are situations where the number of hours to complete projects may exceed the Company's original estimate as a result of an increase in project scope or unforeseen events. On regular basis, the Company reviews the hours incurred and estimated total labor hours to complete. The results of any revisions in these estimates are reflected in the period in which they become known. The Company believes it has a demonstrated history of successfully estimating the total labor hours to complete a project.
The agreements entered into in connection with a project, whether on a time and materials basis or fixed-fee or capped-fee basis, typically allow the Company's clients to terminate early due to breach
F-11
INFORMATION SERVICES GROUP, INC.
NOTES TO CONSOLIDATED FINANCIAL STATEMENTS (Continued)
(tabular amounts in thousands, except per share data)
NOTE 2—SUMMARY OF SIGNIFICANT ACCOUNTING POLICIES (Continued)
or for convenience with 30 days' notice. In the event of termination, the client is contractually required to pay for all time, materials and expenses incurred by the Company through the effective date of the termination. In addition, from time to time, the Company enters into agreements with clients that limit the Company's right to enter into business relationships with specific competitors of that client for a specific time period. These provisions typically prohibit the Company from performing a defined range of services that it might otherwise be willing to perform for potential clients. These provisions are generally limited to six to twelve months and usually apply only to specific employees or the specific project team.
Reimbursable Expenditures
Amounts billed to customers for reimbursable expenditures are included in revenues and the associated costs incurred by the Company are included in direct costs and expenses for advisors in the accompanying consolidated statement of operations. Non-reimbursable amounts are expensed as incurred. Reimbursable expenditures totaled $9.8 million and $14.3 million for the years ended December 31, 2009 and 2008, respectively.
Direct Costs and Expenses for Advisors
Direct costs and expenses for advisors include payroll expenses and advisory fees directly associated with the generation of revenues and other program expenses. Direct costs and expenses for advisors are expensed as incurred.
Direct costs and expenses for advisors also include expense accruals for discretionary bonus payments. Bonus accrual levels are adjusted throughout the year based on actual and projected individual and company performance.
Stock-Based Compensation
Stock Appreciation Rights ("SARs") for a fixed number of shares are granted to certain employees and directors with an exercise price based on the closing trading price of the Company's common stock on the grant date. The Company uses the Black-Scholes option pricing model to determine the fair value of each option award on the date of grant. The volatility calculation is based on the most recent trading day average volatility of a representative sample of nine companies with market capitalizations of approximately $65 million to $645 million that management believes to be engaged in the business of information services (the "Sample Companies"). Because the Company does not have a trading history, the Company needed to estimate the potential volatility of its common stock price, which depends on a number of factors which cannot be ascertained at this time. The Company referred to the average volatility of the Sample Companies because management believes that the average volatility of such companies is a reasonable benchmark to use in estimating the expected volatility of the Company's common stock post-business combination. The risk-free interest rate is determined based upon the interest rate on a U.S. Treasury Bill with a term equal to the expected life of the option at the time the option was granted. An expected life of five years was taken into account for purposes of assigning a fair value to the option. The expected life represents the period of time the awards granted are expected to be outstanding.
F-12
INFORMATION SERVICES GROUP, INC.
NOTES TO CONSOLIDATED FINANCIAL STATEMENTS (Continued)
(tabular amounts in thousands, except per share data)
NOTE 2—SUMMARY OF SIGNIFICANT ACCOUNTING POLICIES (Continued)
The Company also grants restricted stock with a fair value that is determined based on the closing price of the Company's common stock on the date of grant. SARs and restricted stock generally vest over a four-year period. Stock-based compensation expense is recognized ratably over the applicable service period.
The Company follows the provisions of accounting and disclosures requirement for share-based payments, requiring the measurement and recognition of all share-based compensation under the fair value method.
Concentration of Credit Risk
Financial instruments that potentially subject the Company to significant concentrations of credit risk consist principally of cash and accounts receivable. The Company places its cash investments with high quality financial institutions. The Company extends credit to its customers based upon an evaluation of the customer's financial condition and credit history and generally does not require collateral.
Treasury Stock
The Company makes treasury stock purchases in the open market pursuant to the share repurchase program, which was approved by the Board of Directors on November 14, 2007.
Treasury stock is recorded on the consolidated balance sheet at cost as a reduction of stockholders' equity. Shares are released from Treasury at original cost on a first-in, first-out basis, with any gain on the sale reflected as an adjustment to additional paid-in capital. Losses are reflected as an adjustment to additional paid-in capital to the extent of gains previously recognized, otherwise as an adjustment to retained earnings.
Foreign Currency Translation
The assets and liabilities of the Company's foreign subsidiaries are translated into U.S. dollars at exchange rates in effect at the end of the reporting period. Revenue and expense items are translated at average exchange rates for the reporting period. Resulting translation adjustments are included in the accompanying statement of stockholders' equity as a component of Accumulated Other Comprehensive Loss.
The functional currency of the Company and its subsidiaries is the respective local currency. The Company has contracts denominated in foreign currencies and therefore, a portion of the Company's revenues are subject to foreign currency risks. Transactional currency gains and losses that arise from transactions denominated in currencies other than the functional currencies of our operations are recorded in Foreign Currency Transaction (Loss) Gain in the accompanying consolidated statement of operations.
Fair Value of Financial Instruments
In September 2006, the Financial Accounting Standards Board ("FASB') issued accounting and disclosure requirement for fair value measurements which establishes a framework for measuring fair value and requires expanded disclosures regarding fair value measurements. This standard does not
F-13
INFORMATION SERVICES GROUP, INC.
NOTES TO CONSOLIDATED FINANCIAL STATEMENTS (Continued)
(tabular amounts in thousands, except per share data)
NOTE 2—SUMMARY OF SIGNIFICANT ACCOUNTING POLICIES (Continued)
require any new fair value measurements; however, it eliminates inconsistencies in the guidance provided in previous accounting pronouncements. The carrying value of the Company's cash and cash equivalents, receivables, accounts payable, long-term debt, other current liabilities, and accrued interest approximate fair value.
As defined in the ASC, fair value is the price that would be received upon a sale of an asset or paid upon a transfer of a liability in an orderly transaction between market participants at the measurement date (exit price). Market participants can use market data or assumptions in pricing the asset or liability, including assumptions about risk and the risks inherent in the inputs to the valuation technique. These inputs can be readily observable, market-corroborated, or generally unobservable. The use of unobservable inputs is intended to allow for fair value determinations in situations where there is little, if any, market activity for the asset or liability at the measurement date. Under the fair-value hierarchy
- •
- Level 1 measurements include unadjusted quoted market prices for identical assets or liabilities in an active
market;
- •
- Level 2 measurements include quoted market prices for identical assets or liabilities in an active market that have
been adjusted for items such as effects of restrictions for transferability and those that are not quoted but are observable through corroboration with observable market data, including quoted market
prices for similar assets; and
- •
- Level 3 measurements include those that are unobservable and of a highly subjective measure.
Income Taxes
The Company uses the asset and liability method to account for income taxes, including recognition of deferred tax assets and liabilities for the anticipated future tax consequences attributable to differences between financial statement amounts and their respective tax basis. The Company reviews its deferred tax assets for recovery. A valuation allowance is established when the Company believes that it is more likely than not that some portion of its deferred tax assets will not be realized. Changes in the valuation allowance from period to period are included in the Company's tax provision in the period of change.
In June 2006, the FASB issued authoritative guidance for uncertain income tax positions recognized in an enterprise's financial statements in accordance with the Income Tax Topic of the ASC. This interpretation requires companies to use a prescribed model for assessing the financial recognition and measurement of all tax positions taken or expected to be taken in its tax returns. This guidance provides clarification on derecognition, classification, interest and penalties, accounting in interim periods, disclosures and transition. We adopted this guidance on January 1, 2007.
Earnings Per Share
Basic earnings per share is computed by dividing net income (loss) available to common stockholders by the weighted average number of common shares outstanding for the period. Diluted earnings per share reflects the potential dilution that could occur if securities or other contracts to issue common stock were exercised or converted into common stock or resulted in the issuance of common stock that would share in the net income of the Company. For the year ended December 31,
F-14
INFORMATION SERVICES GROUP, INC.
NOTES TO CONSOLIDATED FINANCIAL STATEMENTS (Continued)
(tabular amounts in thousands, except per share data)
NOTE 2—SUMMARY OF SIGNIFICANT ACCOUNTING POLICIES (Continued)
2009, the effect of 35.6 million warrants, 0.3 million stock appreciation rights and 1.4 million Units (each Unit comprising one common share and one warrant) associated with the Company's IPO underwriters purchase option have not been considered in the diluted earnings per share calculation, since the market price of the Company's common stock was less than the exercise price during the period in the computation. Also, 0.8 million restricted shares have not been considered in the diluted earnings per share calculation for the year ended December 31, 2009, as the effect would be anti-dilutive. For the year ended December 31, 2008, the effect of 35.6 million warrants, 0.3 million stock appreciation rights and 1.4 million Units (each Unit comprising one common share and one warrant) associated with the Company's IPO underwriters purchase option have not been considered in the diluted earnings per share calculation, since the market price of the Company's common stock was less than the exercise price during the period in the computation. Also, 0.3 million stock appreciation rights and 2.0 million restricted shares have not been considered in the diluted earnings per share calculation for the year ended December 31, 2008, as the effect would be anti-dilutive. For the year ended December 31, 2007, the effect of 43.6 million warrants and 1.4 million Units (each Unit comprising one common share and one warrant) associated with the Company's IPO underwriters purchase option have not been considered in the diluted earnings per share calculation, since the market price of the Company's common stock was less than the exercise price during the period in the computation.
The following tables set forth the computation of basic and diluted earnings per share:
| |
Years Ended December 31, | ||||||||||
|---|---|---|---|---|---|---|---|---|---|---|---|
| |
2009 | 2008 | 2007 | ||||||||
Numerator: |
|||||||||||
Net (loss) income |
$ | (2,836 | ) | $ | (57,909 | ) | $ | 4,473 | |||
Denominator: |
|||||||||||
Basic weighted average common shares outstanding |
31,491 | 31,282 | 36,465 | ||||||||
Diluted effects of SARs, restricted shares, Employee Stock Purchase Plan shares and warrants |
— | — | 1,911 | ||||||||
|
31,491 | 31,282 | 38,376 | ||||||||
(Loss) income per share: |
|||||||||||
Basic |
$ | (0.09 | ) | $ | (1.85 | ) | $ | 0.12 | |||
Diluted |
$ | (0.09 | ) | $ | (1.85 | ) | $ | 0.12 | |||
Common stock
On January 29, 2007, the Company effected a one-for-two stock dividend for each issued and outstanding share of the Company's common stock, par value $0.001 per share. All transactions and disclosures in the financial statements related to the Company's common stock have been adjusted to reflect the effect of the stock dividend.
F-15
INFORMATION SERVICES GROUP, INC.
NOTES TO CONSOLIDATED FINANCIAL STATEMENTS (Continued)
(tabular amounts in thousands, except per share data)
NOTE 2—SUMMARY OF SIGNIFICANT ACCOUNTING POLICIES (Continued)
Recently Issued Accounting Pronouncements
In September 2006, the FASB issued accounting and disclosure requirement for fair value measurements, which defines fair value, establishes a framework for measuring fair value, and expands disclosures about fair value measurements. This standard was effective for financial statements issued for fiscal years beginning after November 15, 2007, and interim periods within those fiscal years. In February 2008, the FASB issued guidance related to the effective date of fair value accounting standard, which delays the effective date for all non-financial assets and non-financial liabilities, except for those items that are recognized or disclosed at fair value in the financial statements on a recurring basis, until fiscal years beginning after November 15, 2008. The partial adoption of this standard for financial assets and liabilities did not have a material impact on the Company's consolidated financial statements. Based on the accounting standard for non-financial assets and liabilities, the Company began following the guidance with respect to its non-financial assets and liabilities that are measured at fair value on a non-recurring basis in the quarter ended March 31, 2009. The adoption of this standard for non-financial assets and liabilities did not have a significant impact on the Company's consolidated financial statements.
In December 2007, the FASB issued accounting and disclosure requirements for non-controlling interests in consolidated financial statements. This standard addresses the accounting and reporting framework for non-controlling interests by a parent company. The adoption of this standard did not have an impact on its consolidated financial statements.
In December 2007, the FASB issued guidance related to the accounting for business combinations and related disclosures which is effective for fiscal years beginning on or after December 15, 2008. This new guidance addresses the recognition and accounting for identifiable assets acquired, liabilities assumed, and non-controlling interests in business combinations. The guidance also establishes expanded disclosure requirements for business combinations. Accordingly, we will apply this new guidance prospectively to all business combinations subsequent to January 1, 2009. The nature and magnitude of the specific effects of this standard will depend upon the nature, terms and size of the acquisitions we complete after the effective date, if any.
In December 2008, the FASB issued a staff position regarding the employer disclosures for postretirement benefit plan assets. This standard requires enhanced disclosures about postretirement benefit plan assets, including how investment decisions are made, the major categories of plan assets, inputs and valuation techniques used to measure the fair value of plan assets, and significant concentrations of risk within plan assets. This standard is effective for fiscal years ending after December 15, 2009. The adoption of this standard did not have a material impact on our business, results of operations or financial condition.
In April 2009, the FASB issued accounting and disclosure requirement for determining fair value when volume and level of activity for the asset or liability have significantly decreased and identifying transactions that are not orderly. Under this standard, if an entity determines that there has been a significant decrease in the volume and level of activity for the asset or the liability in relation to the normal market activity for the asset or liability (or similar assets or liabilities), then transactions or quoted prices may not accurately reflect fair value. In addition, if there is evidence that the transaction for the asset or liability is not orderly, the entity shall place little, if any, weight on that transaction
F-16
INFORMATION SERVICES GROUP, INC.
NOTES TO CONSOLIDATED FINANCIAL STATEMENTS (Continued)
(tabular amounts in thousands, except per share data)
NOTE 2—SUMMARY OF SIGNIFICANT ACCOUNTING POLICIES (Continued)
price as an indicator of fair value. The adoption of this standard did not have any material impact on the Company's consolidated financial statements.
In April 2009, the FASB issued accounting and disclosure requirement for recognition and presentation of other-than-temporary impairments. This standard requires entities to separate other-than-temporary impairment of a debt security into two components when there are credit related losses associated with the impaired debt security for which management asserts that it does not have the intent to sell the security, and it is more likely than not that it will not be required to sell the security before recovery of its cost basis. The amount of the other-than-temporary impairment related to a credit loss is recognized in earnings, and the amount of the other-than-temporary impairment related to other factors is recorded in other comprehensive loss. The adoption of this standard did not have any material impact on the Company's consolidated financial statements.
In April 2009, the FASB issued accounting and disclosure requirement for interim disclosures about fair value of financial instruments. This standard requires disclosures about fair value of financial instruments in interim and annual financial statements. The adoption of this standard did not have any material impact on the Company's consolidated financial statements.
In September 2009, new guidance was issued related to the revenue recognition of multiple element arrangements. The new guidance states that if vendor specific objective evidence or third party evidence for deliverables in an arrangement cannot be determined, companies will be required to develop a best estimate of the selling price to separate deliverables and allocate arrangement consideration using the relative selling price method. The new guidance is effective for revenue arrangements entered into or materially modified beginning on November 1, 2011. The adoption of this standard did not have any material impact on the Company's consolidated financial statements.
In January 2010, FASB issued accounting standards update that clarifies that the stock portion of a distribution to shareholders that allows them to elect to receive cash or stock with a potential limitation on the total amount of cash that all shareholders can elect to receive in the aggregate is considered a share issuance that is reflected in EPS prospectively and is not a stock dividend. This update is effective for fiscal years beginning after December 15, 2009. Early application is prohibited. This update will not have a material impact on the consolidated financial statements of the Company.
NOTE 3—OFFERING
On February 6, 2007, the Company sold 28,125,000 units ("Units") at a price of $8.00 per Unit in the Offering. Each Unit consists of one share of the Company's common stock, $0.001 par value, and one redeemable common stock purchase warrant ("Warrants"). Each Warrant entitles the holder to purchase from the Company one share of common stock at an exercise price of $6.00 commencing on the later of (i) one year from the date of the final prospectus for the Offering or (ii) the completion of a Business Combination with a target business, and will expire four years from the date of the prospectus. The Warrants are redeemable at a price of $0.01 per Warrant, upon 30 days prior notice, after the Warrants become exercisable, only in the event that the last sale price of the common stock is at least $11.50 per share for any 20 trading days within a 30 trading day period ending on the third business day prior to the date on which notice of redemption is given. If the Company is unable to deliver registered shares of common stock to the holder upon exercise of warrants during the exercise period, there will be no cash settlement of the warrants and the warrants will expire worthless.
F-17
INFORMATION SERVICES GROUP, INC.
NOTES TO CONSOLIDATED FINANCIAL STATEMENTS (Continued)
(tabular amounts in thousands, except per share data)
NOTE 3—OFFERING (Continued)
On February 5, 2007, the underwriters for the Company's initial public offering exercised their over-allotment option and on February 6, 2007 purchased an additional 4,218,750 units at a price of $8.00 per Unit.
In connection with the Offering, the Company paid an underwriting discount of approximately 3.78% ($9.9 million) of the public unit offering price to the underwriters at the closing of the Offering and Over-Allotment Option Exercise, with an additional fee of approximately 3.22% ($7.9 million) of the gross offering proceeds payable upon the Company's consummation of a Business Combination. The underwriters were not be entitled to any interest accrued on the deferred discount.
On February 6, 2007, the Company sold to the underwriters, for $100, a four-year option to purchase up to a total of 1,406,250 units at a per-unit price of $9.60. The units issuable upon exercise of this option are also identical to those offered in the Offering except that warrants included in the option have an exercise price of $7.50. The Company has determined, based upon a Black-Scholes model, that the fair value of the underwriters option on the date of sale would be approximately $3.58 per unit, or approximately $5.0 million in total, using an expected life of four years, volatility of 58.8% and a risk-free interest rate of 4.87%. The Company has accounted for the fair value of the option, inclusive of the receipt of the $100 cash payment, as an expense of the Offering resulting in a charge directly to stockholder's equity.
The volatility calculation of 58.8% was based on the most recent trading day average volatility of a representative sample of nine (9) companies with market capitalizations of approximately $65 million to $645 million that management believes to be engaged in the business of information services (the "Sample Companies"). Because the Company did not have a trading history, the Company needed to estimate the potential volatility of its common stock price, which would depend on a number of factors which could not be ascertained at that time. The Company referred to the average volatility of the Sample Companies because management believes that the average volatility of such companies is a reasonable benchmark to use in estimating the expected volatility of the Company's common stock post-business combination. An expected life of four years was taken into account for purposes of assigning a fair value to the option.
NOTE 4—ACQUISITION
On November 16, 2007, the Company completed its acquisition of TPI, the largest independent sourcing advisory firm in the world, focusing on the design, implementation and management of sourcing strategies for major corporate and government clients. The transaction was approved by ISG stockholders on November 13, 2007. The acquisition was made pursuant to an agreement by and among the Company and MCP-TPI Holding LLC, pursuant to which the Company acquired 100% of the shares of TPI.
The purchase price for the shares of TPI of $214.3 million was paid in cash, plus 2,881,752 shares issued to TPI's employees at $7.20 per share and warrants exercisable into 5 million shares of the Company's common stock at an exercise price of $9.18 per share. The cash generated by TPI operations between the signing of the Purchase Agreement and the closing date remained in TPI for the benefit of the Company.
F-18
INFORMATION SERVICES GROUP, INC.
NOTES TO CONSOLIDATED FINANCIAL STATEMENTS (Continued)
(tabular amounts in thousands, except per share data)
NOTE 4—ACQUISITION (Continued)
The allocation of the purchase price of the assets acquired and liabilities assumed is as follows:
Cash |
$ | 214,251 | ||
Common Stock* |
20,749 | |||
Warrants** |
13,600 | |||
Accrued transaction costs |
5,018 | |||
Total allocable purchase price |
$ | 253,618 | ||
- *
- 2,881,752
shares issued to TPI's employees at $7.20 per share as part of the acquisition.
- **
- ISG has determined, based upon a Black-Scholes model that the fair value of the warrants on September 30, 2007, the date of the amendment, was $2.72 per warrant, or an aggregate of $13.6 million. The warrants, each convertible into one share of common stock at an exercise price of $9.18 per share, were valued using an expected life of 5 years, volatility of 40.1% and a risk-free interest rate of 4.25%.
The purchase price has been allocated to the assets acquired and liabilities assumed based upon their estimated fair values as of the Acquisition Date. The purchase price allocation was based upon a valuation completed by third-party valuation specialists using an income approach and estimates and assumptions provided by management. The excess of the purchase price over the net tangible and identifiable intangible assets was recorded as goodwill. Goodwill of $144.8 million acquired in the acquisition is not deductible for tax purposes.
The following table summarizes the final allocation of the aggregate purchase price to the fair value of the assets acquired and liabilities assumed as of the Acquisition Date:
Allocation of Purchase Price: |
||||
Cash |
$ | 11,408 | ||
Accounts receivable |
34,728 | |||
Receivables from related parties |
73 | |||
Prepaid expenses and other assets |
2,762 | |||
Furniture, fixtures and equipment, net |
2,581 | |||
Other assets |
1,381 | |||
Goodwill |
144,428 | |||
Intangible assets |
119,000 | |||
Accounts payable |
(1,982 | ) | ||
Accrued expenses and other |
(13,160 | ) | ||
Restructuring accrual (see Note 11) |
(4,237 | ) | ||
Deferred income tax liability |
(43,364 | ) | ||
TPI net assets acquired |
$ | 253,618 | ||
The intangible assets acquired include the TPI Index and database, the TPI trademark and trade name, customer relationships, backlog, computer software and goodwill. Some of these assets, such as goodwill and the TPI trademark and trade name are not subject to amortization but rather an annual
F-19
INFORMATION SERVICES GROUP, INC.
NOTES TO CONSOLIDATED FINANCIAL STATEMENTS (Continued)
(tabular amounts in thousands, except per share data)
NOTE 4—ACQUISITION (Continued)
test for possible impairment; other intangible assets that are amortized over their useful lives are reviewed when events or changes or circumstances indicate the carrying amount of the asset may not be recoverable.
Under the purchase method of accounting, the total purchase price of $253.6 million was allocated to TPI's net tangible and intangible assets based on their estimated fair values as of the Acquisition Date. Intangible assets are amortized utilizing the estimated pattern of the consumption of the economic benefit over their estimated lives, ranging from one to ten weighted average years. Based on the valuation and other factors as described above, the purchase price assigned to intangible assets and the amortization period were as follows:
| |
Purchase Price Allocation |
Asset Life | |||
|---|---|---|---|---|---|
Amortizable intangible assets: |
|||||
Customer relationships |
$ | 42,500 | 10 years | ||
Covenants not-to-compete |
5,500 | 4 years | |||
Databases—Financial Data Repository |
6,500 | 7 years | |||
Databases—Other |
3,000 | 4 years | |||
Backlog |
3,000 | 1 year | |||
Computer software |
1,500 | 4 years | |||
Non-amortizable intangible assets: |
|||||
Trademark and trade name |
57,000 | Indefinite | |||
Total intangible assets |
$ | 119,000 | |||
The following unaudited pro forma financial information for the year ended December 31, 2007, assumes that the Acquisition occurred at the beginning of the period presented. The unaudited proforma financial information is presented for information purposes only. Such information is based upon the stand alone historical results of each company and does not reflect the actual results that
F-20
INFORMATION SERVICES GROUP, INC.
NOTES TO CONSOLIDATED FINANCIAL STATEMENTS (Continued)
(tabular amounts in thousands, except per share data)
NOTE 4—ACQUISITION (Continued)
would have been reported had the acquisition been completed when assumed, nor is it indicative of the future results of operations for the combined enterprise.
Proforma
|
Year Ended December 31, 2007 |
||||
|---|---|---|---|---|---|
| |
(unaudited) |
||||
Revenues |
$ | 172,652 | |||
Direct costs and expenses for advisors |
103,614 | ||||
Selling, general and administrative |
49,624 | ||||
Profit share program |
58,175 | ||||
Depreciation and amortization |
9,493 | ||||
Operating loss |
(48,254 | ) | |||
Other expense, net |
(6,976 | ) | |||
Net loss before taxes |
(55,230 | ) | |||
Income tax (provision) benefit |
(1,178 | ) | |||
Net loss |
$ | (56,408 | ) | ||
Basic loss per share |
$ | (1.46 | ) | ||
Diluted loss per share |
$ | (1.46 | ) | ||
NOTE 5—ACCOUNTS AND UNBILLED RECEIVABLES
Accounts and unbilled receivables consisted of the following:
| |
December 31, 2009 |
December 31, 2008 |
|||||
|---|---|---|---|---|---|---|---|
Accounts receivable |
$ | 16,717 | $ | 19,118 | |||
Unbilled revenue |
9,506 | 9,980 | |||||
Receivables from related parties |
50 | 7 | |||||
|
$ | 26,273 | $ | 29,105 | |||
NOTE 6—PREPAID EXPENSE AND OTHER CURRENT ASSETS
Prepaid expense and other current assets consisted of the following:
| |
December 31, 2009 |
December 31, 2008 |
|||||
|---|---|---|---|---|---|---|---|
Prepaid rent |
$ | 67 | $ | 134 | |||
Prepaid insurance |
318 | 532 | |||||
Security deposit |
174 | 138 | |||||
Other |
865 | 509 | |||||
|
$ | 1,424 | $ | 1,313 | |||
F-21
INFORMATION SERVICES GROUP, INC.
NOTES TO CONSOLIDATED FINANCIAL STATEMENTS (Continued)
(tabular amounts in thousands, except per share data)
NOTE 7—FURNITURE, FIXTURES AND EQUIPMENT
Furniture, fixtures and equipment consisted of the following:
| |
Estimated Useful Lives |
December 31, 2009 |
December 31, 2008 |
||||||
|---|---|---|---|---|---|---|---|---|---|
Computer hardware, software and other office equipment |
2 to 5 years | $ | 3,941 | $ | 2,990 | ||||
Furniture, fixtures and leasehold improvements |
2 to 5 years | 604 | 390 | ||||||
Internal-use software and development costs |
3 to 5 years | 981 | 728 | ||||||
Accumulated depreciation |
(2,940 | ) | (1,337 | ) | |||||
|
$ | 2,586 | $ | 2,771 | |||||
Depreciation expense was $1.4 million, $1.5 million and $0.2 million for the years ended December 31, 2009, 2008 and 2007, respectively.
NOTE 8—GOODWILL
The changes in the carrying amount of goodwill for the years ended December 31, 2009 and 2008 are as follows:
| |
2009 | 2008 | |||||
|---|---|---|---|---|---|---|---|
Balance as of January 1 |
|||||||
Goodwill |
$ | 144,612 | $ | 146,333 | |||
Accumulated impairment losses |
(49,363 | ) | — | ||||
|
95,249 | 146,333 | |||||
Purchase price adjustments related to acquisition |
(184 |
) |
(1,721 |
) |
|||
Impairment losses |
— | (49,363 | ) | ||||
|
(184 | ) | (51,084 | ) | |||
Balance as of December 31 |
|||||||
Goodwill |
144,428 | 144,612 | |||||
Accumulated impairment losses |
(49,363 | ) | (49,363 | ) | |||
|
$ | 95,065 | $ | 95,249 | |||
In 2008 and 2009, the Company adjusted its goodwill for purchase price allocation charges related principally to the restructuring accrual. In accordance with accounting and disclosure requirement for goodwill and other intangible assets, the Company applied impairment tests to its intangible assets, including goodwill during the fourth quarter of 2008. As a result of this testing, the Company recorded a pre-tax non-cash impairment charge of $49.4 million associated with goodwill. As a result of declining revenue, driven by a global recession which has impacted and reduced sourcing industry activity, the Company determined a triggering event had occurred requiring a goodwill impairment test be performed during the third quarter of 2009. The Company determined there was no impairment as a result of the testing.
F-22
INFORMATION SERVICES GROUP, INC.
NOTES TO CONSOLIDATED FINANCIAL STATEMENTS (Continued)
(tabular amounts in thousands, except per share data)
NOTE 8—GOODWILL (Continued)
The Company tested the fair values of the goodwill and indefinite-lived intangible assets during our scheduled annual impairment testing in the fourth quarter of 2009 and determined there was no additional impairment.
NOTE 9—INTANGIBLE ASSETS
The carrying amount of intangible assets, net of accumulated amortization and impairment charges, as of December 31, 2009 and 2008 consisted of the following:
| |
2009 | |||||||||||||
|---|---|---|---|---|---|---|---|---|---|---|---|---|---|---|
| |
Gross Carrying Amount |
Accumulated Amortization |
Impairment Losses |
Net Book Value |
||||||||||
Amortizable intangibles: |
||||||||||||||
Customer relationships |
$ | 42,500 | $ | (8,915 | ) | $ | — | $ | 33,585 | |||||
Noncompete agreements |
5,500 | (2,922 | ) | — | 2,578 | |||||||||
Software |
1,500 | (797 | ) | — | 703 | |||||||||
Backlog |
3,000 | (3,000 | ) | — | — | |||||||||
Databases |
9,500 | (1,703 | ) | (6,391 | ) | 1,406 | ||||||||
|
62,000 | (17,337 | ) | (6,391 | ) | 38,272 | ||||||||
Indefinite-lived: |
||||||||||||||
Trademark and trade names |
57,000 | — | (25,200 | ) | 31,800 | |||||||||
Intangibles |
$ | 119,000 | $ | (17,337 | ) | $ | (31,591 | ) | $ | 70,072 | ||||
| |
2008 | |||||||||||||
|---|---|---|---|---|---|---|---|---|---|---|---|---|---|---|
| |
Gross Carrying Amount |
Accumulated Amortization |
Impairment Losses |
Net Book Value |
||||||||||
Amortizable intangibles: |
||||||||||||||
Customer relationships |
$ | 42,500 | $ | (3,271 | ) | $ | — | $ | 39,229 | |||||
Noncompete agreements |
5,500 | (1,547 | ) | — | 3,953 | |||||||||
Software |
1,500 | (422 | ) | — | 1,078 | |||||||||
Backlog |
3,000 | (3,000 | ) | — | — | |||||||||
Databases |
9,500 | (953 | ) | (6,391 | ) | 2,156 | ||||||||
|
62,000 | (9,193 | ) | (6,391 | ) | 46,416 | ||||||||
Indefinite-lived: |
||||||||||||||
Trademark and trade names |
57,000 | — | (18,400 | ) | 38,600 | |||||||||
Intangibles |
$ | 119,000 | $ | (9,193 | ) | $ | (24,791 | ) | $ | 85,016 | ||||
F-23
INFORMATION SERVICES GROUP, INC.
NOTES TO CONSOLIDATED FINANCIAL STATEMENTS (Continued)
(tabular amounts in thousands, except per share data)
NOTE 9—INTANGIBLE ASSETS (Continued)
Amortization expense was $8.1 million, $8.5 million and $0.7 million for the years ended December 31, 2009, 2008 and 2007, respectively. The estimated future amortization expense subsequent to December 31, 2009, is as follows:
2010 |
$ | 7,912 | ||
2011 |
7,279 | |||
2012 |
4,642 | |||
2013 |
4,296 | |||
2014 |
4,014 | |||
Thereafter |
10,129 | |||
|
$ | 38,272 | ||
As a result of declining revenue, driven by a global recession which has impacted and reduced sourcing industry activity, the Company determined a triggering event had occurred requiring a goodwill and indefinite-lived intangibles impairment test be performed during the third quarter of 2009. As a result of this testing, the Company recorded a pre-tax non-cash impairment charge of $6.8 million associated with intangible assets compared to $24.8 million recorded in the fourth quarter of 2008.
NOTE 10—ACCRUED LIABILITIES
The components of accrued liabilities at December 31, 2009 and 2008 are as follows:
| |
December 31, 2009 |
December 31, 2008 |
|||||
|---|---|---|---|---|---|---|---|
Accrued payroll and vacation pay |
$ | 3,502 | $ | 11,085 | |||
Accrued payroll related taxes |
2,959 | 4,364 | |||||
Accrued restructuring |
— | 1,172 | |||||
Other |
2,931 | 3,327 | |||||
|
$ | 9,392 | $ | 19,948 | |||
NOTE 11—RESTRUCTURING ACCRUAL
2007 VCP Plan
Concurrent with the closing of the Acquisition on November 16, 2007, the Company initiated a Value Creation Plan ("VCP") focused on implementing selected cost reductions and productivity improvements to achieve best in class economics and investing in new products and services to accelerate organic growth. Cost reductions and productivity measures center on increasing and/or optimizing the utilization of current billable personnel; implementing a more leveraged staffing and resource model as well as eliminating unnecessary positions, and reducing selected sales, marketing and administrative costs. In addition, compensation and benefit programs will be compared and aligned with industry best practices to ensure competitiveness. The VCP was implemented during 2008 and completed in the second quarter of 2009. The Company reduced $1.8 million of the original $6.0 million to reflect the final remaining restructuring costs applicable to the VCP which were
F-24
INFORMATION SERVICES GROUP, INC.
NOTES TO CONSOLIDATED FINANCIAL STATEMENTS (Continued)
(tabular amounts in thousands, except per share data)
NOTE 11—RESTRUCTURING ACCRUAL (Continued)
recorded as part of the purchase price of the Acquisition in accordance with accounting and disclosure requirement for recognition of liabilities in connection with a purchase business combination.
A summary of the activity affecting the Company's accrued restructuring liability for the years ended December 31, 2009 and December 31, 2008 is as follows:
| |
Workforce Reductions | ||||
|---|---|---|---|---|---|
Balance at December 31, 2007 |
$ | 5,825 | |||
Adjustments |
(1,523 | ) | |||
Amounts paid |
(3,130 | ) | |||
Balance at December 31, 2008 |
1,172 | ||||
Adjustments |
(240 | ) | |||
Amounts paid |
(932 | ) | |||
Balance at December 31, 2009 |
$ | — | |||
2009 Cost Productivity Plan
As a result of the continuing global economic recession, the Company initiated a program in the second quarter of 2009 to (i) further reduce or eliminate the impact of under-utilized advisory resources, (ii) adjust certain fixed and variable compensation levels, and (iii) lower discretionary general and administrative expenses. The program was completed in the third quarter of 2009.
A summary of the activity affecting the Company's accrued restructuring liability related to the 2009 cost productivity plan for the year ended December 31, 2009 is as follows:
| |
Workforce Reductions | ||||
|---|---|---|---|---|---|
Balance at December 31, 2008 |
$ | — | |||
Amounts accrued |
1,620 | ||||
Amounts paid |
(1,050 | ) | |||
Adjustment |
(570 | ) | |||
Balance at December 31, 2009 |
$ | — | |||
NOTE 12—SHARE REPURCHASE PROGRAM
As of December 31, 2009, the Company repurchased 12.1 million shares of common stock under a stock repurchase plan approved by the Board of Directors on October 16, 2007. This program includes the repurchase of common shares, units and/or warrants. On November 14, 2007, the Board of Directors authorized an additional repurchase program of up to $15.0 million. As of December 31, 2009, there was $10.1 million available under this repurchase program.
F-25
INFORMATION SERVICES GROUP, INC.
NOTES TO CONSOLIDATED FINANCIAL STATEMENTS (Continued)
(tabular amounts in thousands, except per share data)
NOTE 13—FINANCING ARRANGEMENTS AND LONG-TERM DEBT
On November 16, 2007, in connection with the acquisition of TPI, International Consulting Acquisition Corp., a wholly-owned indirect subsidiary of ISG (the "Borrower"), entered into a senior secured credit facility comprised of a $95.0 million term loan facility and a $10.0 million revolving credit facility (collectively referred to as the 2007 Credit Agreement). On November 16, 2007, the Borrower borrowed $95.0 million under the term loan facility to finance a portion of the purchase price for the Acquisition and to pay transaction costs. The material terms of the 2007 Credit Agreement are as follows:
- •
- The 2007 Credit Agreement has a maturity date of seven years from the Closing.
- •
- The 2007 Credit Agreement is secured by all of the equity interests owned by the newly formed holding company of the
Borrower, International Advisory Holdings Corp. ("Holdings") and its direct and indirect domestic subsidiaries and, subject to agreed exceptions, its direct and indirect "first-tier"
foreign subsidiaries and a perfected first priority security interest in all of Holdings' and its direct and indirect domestic subsidiaries' tangible and intangible assets.
- •
- Holdings and the Borrower's direct and indirect subsidiaries existing and future wholly-owned domestic subsidiaries serve
as guarantors to the Borrower's obligations under the 2007 Credit Agreement.
- •
- At the Borrower's option, the 2007 Credit Agreement bears interest at a rate per annum equal to either (i) the
"Base Rate" (which is the higher of (a) the rate publicly announced from time to time by the administrative agent as its "prime rate" and (b) the Federal Funds Rate plus 0.5% per annum),
plus the applicable margin (as defined below) or (ii) Eurodollar Rate (adjusted for maximum reserves) as determined by the Administrative Agent, plus the applicable margin. The applicable
margin shall be a percentage per annum equal to 2.5% for the term loans and the revolving loans maintained as Base Rate loans or 3.5% for the term loans and revolving loans maintained as Eurodollar
loans.
- •
- Mandatory repayments of term loans shall be required from (subject to agreed exceptions) (i) 100% of the proceeds
from asset sales by Holdings and its subsidiaries, (ii) 100% of the net proceeds from issuances of debt by Holdings and its subsidiaries, (iii) so long as the total leverage ratio is 3.0
to 1.0 or higher, 50% of annual excess cash flow of Holdings and its subsidiaries and (iv) 100% of the net proceeds from insurance recovery and condemnation events of Holdings and its
subsidiaries.
- •
- The 2007 Credit Agreement contains a number of covenants that, among other things, place restrictions on matters customarily restricted in senior secured credit facilities, including restrictions on indebtedness (including guarantee obligations), liens, fundamental changes, sales or disposition of property or assets, investments (including loans, advances, guarantees and acquisitions), transaction with affiliates, dividends and other payments in respect of capital stock, optional payments and modifications of other material debt instruments, negative pledges and agreements restricting subsidiary distributions and changes in line of business. In addition, the Borrower is required to comply with a total leverage ratio as defined in the 2007 Credit Agreement. The total leverage ratio is defined as the ratio of consolidated indebtedness to consolidated Earnings before Interest, Taxes, Depreciation, and Amortization ("EBITDA").
F-26
INFORMATION SERVICES GROUP, INC.
NOTES TO CONSOLIDATED FINANCIAL STATEMENTS (Continued)
(tabular amounts in thousands, except per share data)
NOTE 13—FINANCING ARRANGEMENTS AND LONG-TERM DEBT (Continued)
- •
- The 2007 Credit Agreement contains customary events of default, including cross-default to other material agreements, judgment default and change of control.
As of December 31, 2009, the total principal outstanding under the term loan facility was $71.8 million. There were no borrowings under the revolving credit facility during fiscal 2009. The carrying amount of long-term debt to banks approximates fair value based on interest rates that are currently available to the Company for issuance of debt with similar terms and remaining maturities.
Under the 2007 Credit Agreement, the Company is required to hedge at least 40% of borrowings outstanding under the term loan facility. Subsequent to December 31, 2007, the Company entered into an agreement to cap the interest rate at 7% on $38.0 million of the LIBOR component of our borrowings under the term loan facility for a period of three years. The expense related to this interest rate cap was nominal.
On June 29, 2009, the Company made a voluntary principal prepayment of $12.0 million against its outstanding term loan balance of $93.8 million. In conjunction with this prepayment, our lenders consented to the following conditions: (1) agreement to execute the Company's UK tax planning strategy to reduce future potential cash taxes, (2) exclusion of the impact in the calculation of EBITDA of up to $5.0 million of restructuring charges relating to the Borrower's previously announced 2009 restructuring plan through December 31, 2009 and (3) exclusion of the impact in the calculation of EBITDA of establishing, if necessary, a reserve in respect of certain accounts receivable and work in progress due from General Motors Corporation for worked performed on or before June 1, 2009.
On September 11, 2009, our lenders agreed to amend the total leverage ratio (as defined) for the remaining life of the 2007 Credit Agreement to provide the Company with greater financing flexibility in return for additional debt repayments. In accordance with the terms of the amended 2007 Credit Agreement, the Company made $5.0 million of principal repayments on September 30, 2009 and December 31, 2009 to reduce the outstanding term loan balance to $71.8 million. The principal repayments were made from excess cash balances generated through the Company's normal business operations. An additional mandatory principal repayment of $2.0 million is due on March 31, 2010. The remaining mandatory term loan principal repayment will be due on November 16, 2014, which is the maturity date for the term loan.
Aggregate annual maturities of debt obligations by calendar year, are as follows:
| |
Debt | |||
|---|---|---|---|---|
2010 |
$ | 2,000 | ||
2011 |
— | |||
2012 |
— | |||
2013 |
— | |||
2014 |
69,813 | |||
|
$ | 71,813 | ||
F-27
INFORMATION SERVICES GROUP, INC.
NOTES TO CONSOLIDATED FINANCIAL STATEMENTS (Continued)
(tabular amounts in thousands, except per share data)
NOTE 14—COMMITMENTS AND CONTINGENCIES
Employee Retirement Plans
The Company's TPI subsidiary maintains a qualified profit-sharing plan (the "Plan"). Prior to January 1, 2008, the provisions of the Plan provide for a maximum employer contribution per eligible employee of the lesser of 12.75% of compensation or $25,500. Effective January 1, 2008, the contribution was adjusted to 3% of total cash compensation or $7,350, whichever is less. Employees are generally eligible to participate in the Plan after six months of service and are 100% vested upon entering the Plan. For the year ended December 31, 2009 and 2008, $1.6 million and $1.5 million were contributed to the Plan by the Company, respectively.
Leases
The Company leases its office space under long-term operating lease agreements which expire at various dates through December 2014. Under the operating leases, the Company pays certain operating expenses relating to the leased property and monthly base rent.
Aggregate future minimum payments under noncancelable leases with initial or remaining terms of one year or more consist of the following at December 31, 2009:
| |
Operating Leases | |||
|---|---|---|---|---|
2010 |
$ | 1,119 | ||
2011 |
1,050 | |||
2012 |
864 | |||
2013 |
310 | |||
2014 |
245 | |||
Total minimum lease payments |
$ | 3,588 | ||
The Company's rental expense for operating leases was $1.5 million, $1.3 million and $0.3 million, in 2009, 2008 and 2007, respectively.
NOTE 15—RELATED PARTY TRANSACTIONS
From time to time, the Company may have receivables and payables with employees and shareholders. All related party transactions have been conducted in the normal course of business as if the parties were unrelated. As of December 31, 2009 and December 31, 2008, the Company had outstanding receivables from related parties, including shareholders, totaling $0.1 million and $0.01 million and no outstanding payables, respectively.
On February 6, 2007, Oenoke Partners, LLC ("Oenoke"), a principal stockholder and affiliate of the Company's officers, purchased in a Private Placement, 6,500,000 warrants at $1 per warrant. The warrants can be exercised on a cashless basis and have terms and provisions that are identical to those of the warrants sold in the Offering (see Note 3), except that these warrants will not be subject to redemption. Oenoke also agreed that it will not sell or otherwise transfer the warrants until one year after the Company consummates a Business Combination, which occurred on November 16, 2007. Oenoke LLC was dissolved on December 17, 2008 and the shares and warrants were transferred to ISG's Executive Officers.
F-28
INFORMATION SERVICES GROUP, INC.
NOTES TO CONSOLIDATED FINANCIAL STATEMENTS (Continued)
(tabular amounts in thousands, except per share data)
NOTE 16—INCOME TAXES
The components of income (loss) before income taxes for the years ended December 31, 2009, 2008 and 2007 consists of the following:
| |
Years Ended December 31, |
||||||||||
|---|---|---|---|---|---|---|---|---|---|---|---|
| |
2009 | 2008 | 2007 | ||||||||
Domestic |
$ | (8,290 | ) | $ | (75,482 | ) | $ | 4,422 | |||
Foreign |
4,676 | 12,790 | 3,277 | ||||||||
Total income (loss) before income taxes |
$ | (3,614 | ) | $ | (62,692 | ) | $ | 7,699 | |||
The components of the 2009, 2008 and 2007 income tax (benefit) provision are as follows:
| |
Years Ended December 31, |
||||||||||||
|---|---|---|---|---|---|---|---|---|---|---|---|---|---|
| |
2009 | 2008 | 2007 | ||||||||||
Current: |
|||||||||||||
Federal |
$ | 2,715 | $ | 2,357 | $ | 1,516 | |||||||
State |
566 | 954 | 1,025 | ||||||||||
Foreign |
1,594 | 4,058 | 983 | ||||||||||
Total current provision |
4,875 | 7,369 | 3,524 | ||||||||||
Deferred: |
|||||||||||||
Federal |
(5,360 | ) | (11,258 | ) | (250 | ) | |||||||
State |
(233 | ) | (894 | ) | (48 | ) | |||||||
Foreign |
(60 | ) | — | — | |||||||||
Total deferred benefit |
(5,653 | ) | (12,152 | ) | (298 | ) | |||||||
Total |
$ | (778 | ) | $ | (4,783 | ) | $ | (3,226 | ) | ||||
The differences between the effective tax rates reflected in the total provision for income taxes and the U.S. federal statutory rate of 35% for the year ended December 31, 2009, 2008 and 2007 were as follows:
| |
Years Ended December 31, | |||||||||
|---|---|---|---|---|---|---|---|---|---|---|
| |
2009 | 2008 | 2007 | |||||||
Tax (benefit) provision computed at 35% |
$ | (1,265 | ) | $ | (21,942 | ) | $ | 2,695 | ||
Nondeductible goodwill impairment |
— | 17,277 | — | |||||||
Nondeductible expenses |
107 | 168 | 83 | |||||||
State income taxes, net of federal benefit |
151 | (233 | ) | 619 | ||||||
Derecognition of stock compensation deferred tax asset |
117 | — | — | |||||||
Valuation allowance |
118 | — | — | |||||||
Other |
(6 | ) | (53 | ) | (171 | ) | ||||
Income tax (benefit) expense |
$ | (778 | ) | $ | (4,783 | ) | $ | 3,226 | ||
Effective income tax rates |
21.5 | % | 7.6 | % | 41.9 | % | ||||
F-29
INFORMATION SERVICES GROUP, INC.
NOTES TO CONSOLIDATED FINANCIAL STATEMENTS (Continued)
(tabular amounts in thousands, except per share data)
NOTE 16—INCOME TAXES (Continued)
The tax effects of temporary differences that give rise to significant portions of the deferred tax assets and liabilities were as follows:
| |
December 31, 2009 | December 31, 2008 | |||||
|---|---|---|---|---|---|---|---|
Current deferred tax asset |
|||||||
Restructuring reserve |
$ | — | $ | 474 | |||
Compensation related expenses |
887 | 480 | |||||
Foreign currency translation |
932 | 1,478 | |||||
Other |
648 | 512 | |||||
Total current deferred tax asset |
2,467 | 2,944 | |||||
Current deferred tax liability |
|||||||
Prepaids |
(330 | ) | (367 | ) | |||
Total current deferred tax liability |
(330 | ) | (367 | ) | |||
Net current deferred tax asset |
$ | 2,137 | $ | 2,577 | |||
Noncurrent deferred tax asset |
|||||||
Compensation related expenses |
$ | 529 | $ | 364 | |||
Foreign tax credit carryovers |
450 | — | |||||
Foreign net operating loss carryovers |
279 | — | |||||
Valuation allowance for deferred tax assets |
(118 | ) | — | ||||
Total noncurrent deferred tax asset |
1,140 | 364 | |||||
Noncurrent deferred tax liability |
|||||||
Depreciable assets |
(176 | ) | 134 | ||||
Intangible assets |
(26,096 | ) | (31,400 | ) | |||
Other |
(279 | ) | — | ||||
Total noncurrent deferred tax liability |
(26,551 | ) | (31,266 | ) | |||
Net noncurrent deferred tax liability |
(25,411 | ) | (30,902 | ) | |||
Net deferred tax liability |
$ | (23,274 | ) | $ | (28,325 | ) | |
A valuation allowance was established at December 31, 2009 due to estimates of future utilization of net operating loss carryovers in certain foreign jurisdictions.
Effective January 1, 2007, the Company adopted an accounting standard for accounting for uncertainty in income taxes. This standard prescribes a recognition threshold and a measurement attribute for the financial statement recognition and measurement of a tax position taken or expected to be taken in a tax return. Benefits from tax positions should be recognized in the financial statements only when it is more likely than not that the tax position will be sustained upon examination by the appropriate taxing authority that would have full knowledge of all relevant information. A tax position that meets the more-likely-than-not recognition threshold is measured at the largest amount of benefit that is greater than fifty percent likely of being realized upon ultimate settlement. Tax positions that
F-30
INFORMATION SERVICES GROUP, INC.
NOTES TO CONSOLIDATED FINANCIAL STATEMENTS (Continued)
(tabular amounts in thousands, except per share data)
NOTE 16—INCOME TAXES (Continued)
previously failed to meet the more-likely-than-not recognition threshold should be recognized in the first subsequent financial reporting period in which that threshold is met. Previously recognized tax positions that no longer meet the more-likely-than-not recognition threshold should be derecognized in the first subsequent financial reporting period in which that threshold is no longer met. This standard also provides guidance on the accounting for and disclosure of unrecognized tax benefits, interest and penalties. It is the Company's policy to accrue for interest and penalties related to its uncertain tax positions within income tax expense.
The Company reported no adjustments related to its adoption of this standard as of January 1, 2007. However, the Company acquired TPI and its subsidiaries on November 16, 2007. The standard was also adopted by TPI before it was acquired by the Company. The cumulative effect of applying the provisions of this standard was a decrease to TPI's pre-acquisition retained earnings by $0.2 million as of January 1, 2007. TPI's accrued tax liability was assumed by the Company upon its acquisition of TPI on November 16, 2007.
For the years ended December 31, 2009, 2008 and 2007, the Company updated its assessment of its tax positions in the taxing jurisdictions where it has operations and determined that additional accruals were required for the year ended December 31, 2009.
A tabular reconciliation of the total amounts of unrecognized tax benefits at the beginning and end of the period is as follows:
| |
December 31, | ||||||||||
|---|---|---|---|---|---|---|---|---|---|---|---|
| |
2009 | 2008 | 2007 | ||||||||
Balance, beginning of year |
$ | 282 | $ | 225 | $ | 213 | |||||
Additions as a result of tax positions taken during the current period |
2 | 75 | — | ||||||||
Reductions relating to tax settlements with taxing authorities |
(36 | ) | (93 | ) | — | ||||||
Total unrecognized tax benefit |
248 | 207 | 213 | ||||||||
Interest and penalties associated with uncertain tax positions |
75 | 75 | 12 | ||||||||
Balance, end of year |
$ | 323 | $ | 282 | $ | 225 | |||||
The amount of unrecognized tax benefit, if recognized, that would affect the effective tax rate is immaterial. With few exceptions, the Company is no longer subject to U.S. federal, state, local, or non-U.S. income tax examinations by tax authorities for years before 2003.
The Company is currently under audit by the Internal Revenue Service for its federal tax returns filed for the periods ended November 16, 2007 and December 31, 2006. The Company is responding to a "Notice of Proposed Adjustment" received from the IRS on February 22, 2010 and expects no significant changes to its tax liabilities reported for those tax years.
NOTE 17—STOCK-BASED COMPENSATION PLANS
At the special meeting of stockholders held on November 13, 2007, the 2007 Equity Incentive Plan ("Incentive Plan") and 2007 Employee Stock Purchase Plan ("ESPP") were approved by the Company's stockholders. The Incentive Plan authorizes the grant of awards to participants with respect
F-31
INFORMATION SERVICES GROUP, INC.
NOTES TO CONSOLIDATED FINANCIAL STATEMENTS (Continued)
(tabular amounts in thousands, except per share data)
NOTE 17—STOCK-BASED COMPENSATION PLANS (Continued)
to a maximum of 4.0 million shares of the Company's common stock, subject to adjustment to avoid dilution or enlargement of intended benefits in the event of certain significant corporate events, which awards may be made in the form of (i) nonqualified stock options; (ii) stock options intended to qualify as incentive stock options under Section 422 of the Internal Revenue Code (stock options described in clause (i) and (ii), "options"); (iii) stock appreciation rights ("SARs"); (iv) restricted stock and/or restricted stock units; (v) performance awards; and (vi) other stock based awards; provided that the maximum number of shares with respect to which stock options and stock appreciation rights may be granted in the equity incentive plan to any one participant in any given calendar year may not exceed $0.8 million, and the maximum amount payable to a participant in the equity plan in connection with the settlement of any of any award(s) designated as a "performance compensation awards" in respect of a single performance period shall be: (x) with respect to performance compensation awards that are paid in shares, 500,000 shares and (y) with respect to performance compensation awards that are paid in cash, $5.0 million. The issuance of shares or the payment of cash upon the exercise of an award or in consideration of the cancellation or termination of an award shall reduce the total number of shares available under the equity incentive plan, as applicable. The provisions of each award will vary based on the type of award granted and will be specified by the Compensation Committee of the Board of Directors. Those awards which are based on a specific contractual term will be granted with a term not to exceed ten years. The SARs granted under the Incentive Plan are granted with an exercise price equal to the fair market value of the Common Shares at the time the SARs are granted. As of December 31, 2009, there were 330,306 and 1,026,034 shares available for grant under the Incentive Plan and ESPP, respectively.
The Company recognized $2.8 million, $2.0 million and $0.2 million in employee stock-based compensation expense during the years ended December 31, 2009, 2008 and 2007, respectively.
Stock Appreciation Rights
The Compensation Committee may grant (i) a stock appreciation right independent of an option or (ii) a stock appreciation right in connection with an option, or a portion thereof. A stock appreciation right granted pursuant to clause (ii) of the preceding sentence (A) may be granted at the time the related option is granted or at any time prior to the exercise or cancellation of the related option, (B) shall cover the same number of shares covered by an option (or such lesser number of shares as the Compensation Committee may determine) and (C) shall be subject to the same terms and conditions as such option except for such additional limitations as are contemplated above (or such additional limitations as may be included in an award agreement).
SARs granted pursuant to the Incentive Plan are granted with an exercise price equal to the fair market value of the Common Shares at the time the SARs are granted. Pursuant to the applicable award agreements, the SARs vest and become exercisable with respect to 25% of the shares subject to the SARs on the first four anniversaries of the grant date, so long as the employee remains employed with the Company on each such date. If the employee's employment with the Company is terminated as a result of the employee's death or disability, all unvested SARs will be fully vested. If the employee retires, the SARs will continue to vest on the same schedule as if the employee had remains employed with the Company. Any vested SARs will expire upon the earliest to occur of the following: (i) the tenth anniversary of the grant date; (ii) one year following the date of the employee's termination of
F-32
INFORMATION SERVICES GROUP, INC.
NOTES TO CONSOLIDATED FINANCIAL STATEMENTS (Continued)
(tabular amounts in thousands, except per share data)
NOTE 17—STOCK-BASED COMPENSATION PLANS (Continued)
services as a result of death or permanent disability; (iii) 90 days following the fourth anniversary of the grant date, following the participant's retirement; (iv) 30 days following the date of the participant's termination of employment for any reason (other than as a result of death, disability or retirement); and (v) immediately upon a termination for cause. SARs will be settled in the form of shares of the Company's common stock upon exercise.
A summary of the status of the Company's SARs issued under its Incentive Plan is presented below:
| |
SARs | Weighted- Average Exercise Price |
Weighted- Average Remaining Contractual Life |
Aggregate Intrinsic Value |
||||||||||
|---|---|---|---|---|---|---|---|---|---|---|---|---|---|---|
| |
|
|
(in years) |
|
||||||||||
Outstanding at December 31, 2006 |
— | $ | — | |||||||||||
Granted |
355 | $ | 7.20 | |||||||||||
Exercised |
— | $ | — | |||||||||||
Forfeited |
— | $ | 7.20 | |||||||||||
Outstanding at December 31, 2007 |
355 | $ | 7.20 | 9.9 | $ | — | ||||||||
Granted |
320 | $ | 3.18 | |||||||||||
Exercised |
— | $ | — | |||||||||||
Forfeited |
(34 | ) | $ | 7.20 | ||||||||||
Outstanding at December 31, 2008 |
641 | $ | 5.19 | 6.4 | $ | 70 | ||||||||
Granted |
12 | $ | 3.15 | |||||||||||
Exercised |
— | $ | — | |||||||||||
Forfeited |
(59 | ) | $ | 5.51 | ||||||||||
Outstanding at December 31, 2009 |
594 | $ | 5.12 | 8.4 | $ | — | ||||||||
Vested and expected to vest at December 31, 2009 |
594 | $ | 5.12 | 8.4 | $ | — | ||||||||
Exercisable at December 31, 2009 |
239 | $ | 5.58 | 8.3 | $ | — | ||||||||
The weighted-average grant date fair value for SARs granted during the years ended December 31, 2009, 2008 and 2007 was $1.90, $1.86 and $2.93, respectively. The total fair value of the SARs vested during the years ended December 31, 2009, 2008 and 2007 was $0.4 million, $0.2 million and $0, respectively. As of December 31, 2009, there was $0.8 million of total unrecognized compensation cost related to the Company's unvested SARs and that cost is expected to be recognized over a weighted-average period of 2.4 years.
The Company uses the Black-Scholes option pricing model to determine the fair value of each SAR award on the date of grant. The estimated fair value of the SARs is amortized to expense on a straight-line basis over the vesting period. The specific assumptions used in determining the fair values for the SARs granted during the years ended December 31, 2009 and December 31, 2008 are discussed in more detail below and are noted in the following table.
F-33
INFORMATION SERVICES GROUP, INC.
NOTES TO CONSOLIDATED FINANCIAL STATEMENTS (Continued)
(tabular amounts in thousands, except per share data)
NOTE 17—STOCK-BASED COMPENSATION PLANS (Continued)
The volatility calculation is based on the most recent trading day average volatility of a representative sample of nine companies with market capitalizations of approximately $65 million to $645 million that management believes to be engaged in the business of information services (the "Sample Companies"). Because the Company does not have a trading history, the Company needed to estimate the potential volatility of its common stock price, which will depend on a number of factors which cannot be ascertained at this time given the Company's limited operating and trading history. The Company referred to the average volatility of the Sample Companies because management believes that the average volatility of such companies is a reasonable benchmark to use in estimating the expected volatility of the Company's common stock post-business combination. The risk-free interest rate is determined based upon the interest rate on a U.S. Treasury Bill with a term equal to the expected life of the SARs at the time the SARs was granted. An expected life of five years was taken into account for purposes of assigning a fair value to the SARs. The expected life represents the period of time the awards granted are expected to be outstanding.
| |
Years Ended December 31, | |||||||||
|---|---|---|---|---|---|---|---|---|---|---|
| |
2009 | 2008 | 2007 | |||||||
Expected stock volatility |
73.2 | % | 70.1 | % | 40.2 | % | ||||
Risk-free interest rate |
1.7 | % | 1.6 | % | 3.6 | % | ||||
Expected term (in years) |
5.0 | 5.0 | 5.0 | |||||||
Dividend yield |
0.0 | % | 0.0 | % | 0.0 | % | ||||
The Company has never issued any options as of December 31, 2009.
Restricted Share Awards/Units
The Incentive Plan provides for the granting of restricted share awards ("RSA") or restricted share units ("RSU"), the vesting of which is subject to conditions and limitations established at the time of the grant. Upon the grant of an RSA, the participant has the rights of a shareholder, including but not limited to the right to vote such shares and the right to receive any dividends paid on such shares. Recipients of RSU awards will not have the rights of a shareholder of the Company until such date as the Common Shares are issued or transferred to the recipient. The Company granted 175,932 RSAs valued at $3,500 for each employee worldwide employed as of November 16, 2007 and otherwise receiving RSU under existing programs. Subject to the employee's continued employment, the restricted shares will vest with respect to 25% of the shares on each of the first four anniversaries of the grant date. If the employee retires (at the normal retirement age stated in the applicable retirement plan or applicable law, if there is a mandatory retirement age), the restricted shares will continue to vest on the same schedule as if the employee remained employed with the Company. Upon a change in control, or upon a termination of employment due to employee's death or permanent disability, the restricted shares become 100% vested. Dividends will accrue and be paid if and when the restricted shares vest.
The Company also granted RSUs to specific employees which have the following characteristics:
- •
- Performance-Based RSU Vesting: Provided the employee continues to be employed through March 31, 2011, the RSUs will vest on such date with respect to 75% of the RSUs if the Company achieve 80% of its 2010 EBITDA target, and thereafter up to 100% of the RSUs if
F-34
INFORMATION SERVICES GROUP, INC.
NOTES TO CONSOLIDATED FINANCIAL STATEMENTS (Continued)
(tabular amounts in thousands, except per share data)
NOTE 17—STOCK-BASED COMPENSATION PLANS (Continued)
- •
- Time-Based RSU Vesting: So long as the employee continues to be employed through the fourth anniversary of the grant date, the RSUs will become 100% vested on such date.
the Company achieves 100% of its 2010 EBITDA target, with the vesting percentages in between such two target numbers being interpolated based on the achievement thereof. In the event that less than 80% of the 2010 EBITDA target is achieved, the RSUs will be forfeited.
If the employee's employment is terminated (i) at any time during the vesting period due to the employee's death, disability or retirement prior to the applicable vesting date or (ii) without cause by the Company after 50% of the relevant period has elapsed, then the RSUs will vest prorata based on the period of time worked relative to such period. However, no shares will be distributed until the applicable pro rata vesting date (and, in the case of the Performance-Based RSUs, only if and to the extent that the EBITDA target is achieved). In all other terminations occurring prior to the applicable vesting date, the RSUs will expire. All RSUs will be payable in shares of the Company's common stock immediately upon vesting. No dividend equivalents will be paid with respect to any RSUs.
The fair value of RSAs and RSUs is determined based on the closing price of the Company's shares on the grant date. The total fair value is amortized to expense on a straight-line basis over the vesting period.
A summary of the status of the Company's RSAs and RSUs issued under its Incentive Plan as of December 31, 2009 and changes during the year then ended, is presented below:
| |
RSA | Weighted- Average Grant Date Fair Value |
RSU | Weighted- Average Grant Date Fair Value |
||||||||||
|---|---|---|---|---|---|---|---|---|---|---|---|---|---|---|
Non-vested at December 31, 2006 |
— | $ | — | — | $ | — | ||||||||
Granted |
176 | $ | 7.20 | 619 | $ | 7.20 | ||||||||
Vested |
— | $ | — | — | $ | — | ||||||||
Forfeited |
(1 | ) | $ | 7.20 | — | $ | — | |||||||
Non-vested at December 31, 2007 |
175 | $ | 7.20 | 619 | $ | 4.50 | ||||||||
Granted |
— | $ | — | 1,484 | $ | 4.08 | ||||||||
Vested |
(36 | ) | $ | 7.20 | — | $ | — | |||||||
Forfeited |
(36 | ) | $ | 7.20 | (107 | ) | $ | 4.38 | ||||||
Non-vested at December 31, 2008 |
103 | $ | 7.20 | 1,996 | $ | 4.20 | ||||||||
Granted |
— | $ | — | 1,165 | $ | 3.13 | ||||||||
Vested |
(30 | ) | $ | 7.20 | (406 | ) | $ | 4.29 | ||||||
Forfeited |
(14 | ) | $ | 7.20 | (210 | ) | $ | 4.36 | ||||||
Non-vested at December 31, 2009 |
59 | $ | 7.20 | 2,545 | $ | 3.67 | ||||||||
The total fair value of RSAs and RSUs vested during the years ended December 31, 2009, 2008 and 2007 was $2.0 million, $0.3 million and $0, respectively. As of December 31, 2009, there was $0.4 million and $7.2 million of unrecognized compensation cost related to RSAs and RSUs, which is expected to be recognized over a weighted-average period of 1.9 years and 2.9 years, respectively.
F-35
INFORMATION SERVICES GROUP, INC.
NOTES TO CONSOLIDATED FINANCIAL STATEMENTS (Continued)
(tabular amounts in thousands, except per share data)
NOTE 17—STOCK-BASED COMPENSATION PLANS (Continued)
Employee Stock Purchase Plan
The ESPP provides that a total of 1.2 million shares of Common Stock are reserved for issuance under the plan. The ESPP, which is intended to qualify as an "employee stock purchase plan" under Section 423 of the Internal Revenue Code, is implemented utilizing three-month offerings with purchases occurring at three-month intervals. The ESPP administration is overseen by the Company's Compensation Committee. Employees are eligible to participate if they are employed by the Company for at least 20 hours per week and more than five months in a calendar year. The ESPP permits eligible employees to purchase Common Stock through payroll deductions, ranging from one to ten percent of their eligible earnings subject to IRS regulated cap of $25,000. The price of Common Stock purchased under the ESPP is 90% of the fair market value of the Common Stock on the applicable purchase date. Employees may end their participation in an offering at any time during the offering period, and participation ends automatically upon termination of employment. The Compensation Committee may at any time amend or terminate the ESPP, except that no such amendment or termination may adversely affect shares previously granted under the ESPP. The Company may issue new shares for ESPP using treasury shares or newly issued shares. For the year ended December 31, 2009, the Company issued 81,770 shares for ESPP of which 59,044 came from treasury shares. There were 1,026,034 shares available for purchase at December 31, 2009 under the ESPP.
NOTE 18—WARRANTS AND DERIVATIVE INSTRUMENTS
The Company issued warrants to purchase 28,125,000 units at a price of $8.00 per unit and the underwriters for the Company's initial public offering exercised their over-allotment option and purchased an additional 4,218,750 units (See Note 3). Each unit includes one share of common stock and a warrant to purchase one share of common stock at an exercise price of $6.00.
On February 6, 2007, Oenoke Partners, LLC purchased, in a Private Placement, 6,500,000 warrants at $1 per warrant. The warrants can be exercised on a cashless basis and have terms and provisions that are identical to those of the warrants sold in the Offering (see Note 3), except that these warrants will not be subject to redemption. Oenoke Partners, LLC also agreed that it will not sell or otherwise transfer the warrants until one year after the Company consummates a business combination, which occurred on November 16, 2007. Oenoke LLC was dissolved on December 17, 2008 and the shares and warrants were transferred to ISG's Executive Officers.
The Company also sold to the underwriters, for $100, a four-year option to purchase up to a total of 1,406,250 units at a per-unit price of $9.60. The units issuable upon exercise of this option are also identical to those offered in the Offering except that warrants included in the option have an exercise price of $7.50.
Pursuant to the acquisition of TPI, the Company issued 5,000,000 warrants valued at $13.6 million ($2.72 per warrant) at an exercise price of $9.18 per share. The warrants will be exercisable at any time after the first anniversary of the closing and will expire on the fifth anniversary of the closing.
F-36
INFORMATION SERVICES GROUP, INC.
NOTES TO CONSOLIDATED FINANCIAL STATEMENTS (Continued)
(tabular amounts in thousands, except per share data)
NOTE 18—WARRANTS AND DERIVATIVE INSTRUMENTS (Continued)
A summary of the warrant activity as of December 31, 2009, 2008 and 2007 and changes during the years then ended, is presented below:
| |
Number of Warrants |
Weighted- Average Exercise Price |
||||||
|---|---|---|---|---|---|---|---|---|
Warrants outstanding as of December 31, 2006 |
— | $ | — | |||||
IPO warrants issued |
32,344 | 6.00 | ||||||
Private placement warrants issued |
6,500 | 6.00 | ||||||
Underwriters purchase option issued |
1,406 | 7.50 | ||||||
Acquisition warrants issued |
5,000 | 9.18 | ||||||
Warrants repurchased |
(278 | ) | 6.00 | |||||
Warrants outstanding as of December 31, 2007 |
44,972 | $ | 6.40 | |||||
Warrants repurchased |
(7,919 | ) | 6.00 | |||||
Warrants outstanding as of December 31, 2008 |
37,053 | $ | 6.49 | |||||
Warrants repurchased |
— | — | ||||||
Warrants outstanding as of December 31, 2009 |
37,053 | $ | 6.49 | |||||
NOTE 19—SEGMENT AND GEOGRAPHICAL INFORMATION
The Company operates in one segment, fact-based sourcing advisory services. The Company operates principally in the Americas, Europe, and Asia Pacific. The Company's foreign operations are subject to local government regulations and to the economic and political uncertainties of those areas.
Geographical information for the segment is as follows:
| |
Years Ended December 31, | |||||||||
|---|---|---|---|---|---|---|---|---|---|---|
| |
2009 | 2008 | 2007 | |||||||
Revenues |
||||||||||
Americas |
$ | 77,007 | $ | 96,548 | $ | 12,003 | ||||
Europe |
44,696 | 64,485 | 5,643 | |||||||
Asia Pacific |
11,041 | 13,762 | 1,255 | |||||||
|
$ | 132,744 | $ | 174,795 | $ | 18,901 | ||||
Identifiable long-lived assets |
||||||||||
Americas |
$ | 2,359 | $ | 2,480 | $ | 2,270 | ||||
Europe |
118 | 111 | 178 | |||||||
Asia Pacific |
109 | 180 | 225 | |||||||
|
$ | 2,586 | $ | 2,771 | $ | 2,673 | ||||
The segregation of revenues by geographic region is based upon the location of the legal entity performing the services. The Company does not measure or monitor gross profit or operating income by geography for the purposes of making operating decisions or allocating resources.
F-37
INFORMATION SERVICES GROUP, INC.
NOTES TO CONSOLIDATED FINANCIAL STATEMENTS (Continued)
(tabular amounts in thousands, except per share data)
NOTE 20—UNAUDITED QUARTERLY INFORMATION
| |
Quarters Ended | |||||||||||||
|---|---|---|---|---|---|---|---|---|---|---|---|---|---|---|
| |
March 31, 2009 |
June 30, 2009 |
September 30, 2009 |
December 31, 2009 |
||||||||||
Fiscal 2009: |
||||||||||||||
Net sales |
$ | 34,299 | $ | 31,518 | $ | 32,462 | $ | 34,465 | ||||||
Gross profit |
$ | 19,434 | $ | 13,904 | $ | 15,494 | $ | 16,238 | ||||||
Operating income (loss)(1)(3) |
$ | 2,053 | $ | 1,376 | $ | (4,204 | ) | $ | 1,589 | |||||
Other expense, net |
$ | (1,152 | ) | $ | (1,206 | ) | $ | (1,179 | ) | $ | (891 | ) | ||
Income (loss) from operations |
$ | 901 | $ | 170 | $ | (5,383 | ) | $ | 698 | |||||
Net income (loss) |
$ | 541 | $ | 98 | $ | (3,597 | ) | $ | 122 | |||||
Basic earnings (loss) per share |
$ |
0.02 |
$ |
0.00 |
$ |
(0.11 |
) |
$ |
0.00 |
|||||
Diluted earnings (loss) per share |
$ | 0.02 | $ | 0.00 | $ | (0.11 | ) | $ | 0.00 | |||||
Basic weighted average common shares |
31,418 | 31,471 | 31,478 | 31,595 | ||||||||||
Diluted weighted average common shares |
31,465 | 31,559 | 31,478 | 31,992 | ||||||||||
| |
Quarters Ended | |||||||||||||
|---|---|---|---|---|---|---|---|---|---|---|---|---|---|---|
| |
March 31, 2008 |
June 30, 2008 |
September 30, 2008 |
December 31, 2008 |
||||||||||
Fiscal 2008: |
||||||||||||||
Net sales |
$ | 45,554 | $ | 50,693 | $ | 41,123 | $ | 37,425 | ||||||
Gross profit |
$ | 19,740 | $ | 22,451 | $ | 18,352 | $ | 17,941 | ||||||
Operating income (loss)(2) |
$ | 3,912 | $ | 5,552 | $ | 3,804 | $ | (70,910 | ) | |||||
Other income, net |
$ | (1,096 | ) | $ | (1,430 | ) | $ | (1,268 | ) | $ | (1,256 | ) | ||
Income (loss) from operations |
$ | 2,816 | $ | 4,122 | $ | 2,536 | $ | (72,166 | ) | |||||
Net income (loss) |
$ | 1,663 | $ | 2,424 | $ | 1,457 | $ | (63,453 | ) | |||||
Basic earnings (loss) per share |
$ |
0.05 |
$ |
0.08 |
$ |
0.05 |
$ |
(2.03 |
) |
|||||
Diluted earnings (loss) per share |
$ | 0.05 | $ | 0.08 | $ | 0.05 | $ | (2.03 | ) | |||||
Basic weighted average common shares |
31,359 | 31,307 | 31,208 | 31,259 | ||||||||||
Diluted weighted average common shares |
31,359 | 31,307 | 31,281 | 31,259 | ||||||||||
- (1)
- As
a result of its intangible asset impairment assessments, ISG recorded an impairment charge of $6.8 million during the third quarter of 2009
associated with intangible assets.
- (2)
- As
a result of its goodwill and intangible asset impairment assessments, ISG recorded an impairment charge of $49.4 million during the fourth quarter
of 2008 associated with goodwill and $24.8 million related to intangible assets.
- (3)
- The Company recorded a decrease to expense in the fourth quarter of 2009 totaling $0.2 million relating to employee benefits that were incurred in prior periods.
F-38
Report of Independent Registered Public Accounting Firm
To
the Board of Directors and Shareholders of
Technology Partners International, Inc. and Subsidiaries
In our opinion, the accompanying consolidated statements of operations, stockholders' equity (deficit) and cash flows present fairly, in all material respects, the results of Technology Partners International, Inc. and subsidiaries operations and their cash flows for the period from January 1, 2007 to November 16, 2007 in conformity with accounting principles generally accepted in the United States of America. In addition, in our opinion, the financial statement schedule listed in the index appearing under Item 15 (a)(2) presents fairly, in all material respects, the information set forth therein when read in conjunction with the related consolidated financial statements. These financial statements and financial statement schedule are the responsibility of the Company's management. Our responsibility is to express an opinion on these financial statements and financial statement schedule based on our audits. We conducted our audits of these statements in accordance with the standards of the Public Company Accounting Oversight Board (United States). Those standards require that we plan and perform the audit to obtain reasonable assurance about whether the financial statements are free of material misstatement. An audit includes examining, on a test basis, evidence supporting the amounts and disclosures in the financial statements, assessing the accounting principles used and significant estimates made by management, and evaluating the overall financial statement presentation. We believe that our audits provide a reasonable basis for our opinion.
As discussed in Note 2 to the consolidated financial statements, effective January 1, 2007, the Company adopted Financial Accounting Standards Board ('FASB") Interpretation No. 48, Accounting For Uncertainty in Income Taxes.
As discussed in Note 1 to the consolidated financial statements, the Company was acquired on November 16, 2007.
/s/ PricewaterhouseCoopers LLP
Houston,
Texas
March 27, 2008
F-39
TECHNOLOGY PARTNERS INTERNATIONAL, INC. AND SUBSIDIARIES
CONSOLIDATED STATEMENTS OF OPERATIONS
(in thousands except per share data)
| |
For the period January 1, 2007 to November 16, 2007 |
|||
|---|---|---|---|---|
Revenue |
$ | 153,751 | ||
Operating expenses |
||||
Direct costs and expenses for advisors |
91,368 | |||
Selling, general and administrative |
45,287 | |||
Profit share program charge |
58,175 | |||
Depreciation and amortization |
1,969 | |||
Operating (loss) income |
(43,048 | ) | ||
Interest income |
204 | |||
Interest expense |
(3,200 | ) | ||
Loss on extinguishment of debt |
— | |||
Foreign currency transaction gain (loss) |
335 | |||
(Loss) income before taxes |
(45,709 | ) | ||
Income tax provision |
(4,948 | ) | ||
Net (loss) income |
$ | (50,657 | ) | |
The accompanying notes are an integral part of these consolidated financial statements.
F-40
TECHNOLOGY PARTNERS INTERNATIONAL, INC. AND SUBSIDIARIES
CONSOLIDATED STATEMENTS OF STOCKHOLDERS' EQUITY (DEFICIT)
(in thousands)
| |
Common Stock | |
|
Treasury Stock | Accumulated Other Comprehensive Income (Loss) |
Retained Earnings (Accumulated Deficit) |
Total Stockholders' Equity (Deficit) |
|||||||||||||||||||||
|---|---|---|---|---|---|---|---|---|---|---|---|---|---|---|---|---|---|---|---|---|---|---|---|---|---|---|---|---|
| |
Additional Paid-in Capital |
Deferred Compensation |
||||||||||||||||||||||||||
| |
Shares | Amount | Shares | Amount | ||||||||||||||||||||||||
Balances at December 31, 2006 |
6,394 | 64 | 5,967 | — | — | — | 791 | (6,250 | ) | 572 | ||||||||||||||||||
Comprehensive income: |
||||||||||||||||||||||||||||
Net loss |
— | — | — | — | — | — | — | (50,657 | ) | (50,657 | ) | |||||||||||||||||
Translation adjustment |
— | — | — | — | — | — | 1,520 | — | 1,520 | |||||||||||||||||||
Total comprehensive income |
(49,137 | ) | ||||||||||||||||||||||||||
Adjustment to adopt FIN 48 on January 1, 2007 |
— | — | — | — | — | — | — | (225 | ) | (225 | ) | |||||||||||||||||
Issuance of equity to lenders |
— | — | 46 | — | — | — | — | — | 46 | |||||||||||||||||||
Balances at November 16, 2007 |
6,394 | $ | 64 | $ | 6,013 | $ | — | — | $ | — | $ | 2,311 | $ | (57,132 | ) | $ | (48,744 | ) | ||||||||||
The accompanying notes are an integral part of these consolidated financial statements.
F-41
TECHNOLOGY PARTNERS INTERNATIONAL, INC. AND SUBSIDIARIES
CONSOLIDATED STATEMENTS OF CASH FLOWS
(in thousands)
| |
For the period January 1, 2007 to November 16, 2007 |
||||||
|---|---|---|---|---|---|---|---|
Cash flows from operating activities |
|||||||
Net (loss) income |
$ | (50,657 | ) | ||||
Adjustments to reconcile net (loss) income to net cash provided by operating activities |
|||||||
Depreciation |
1,211 | ||||||
Amortization of intangibles |
758 | ||||||
Amortization of debt discount |
83 | ||||||
Profit share program charge |
58,175 | ||||||
Amortization of deferred financing costs |
110 | ||||||
Loss on extinguishment of debt |
— | ||||||
Bad debt expense |
169 | ||||||
Deferred tax benefit |
(406 | ) | |||||
Loss on disposal of fixed assets |
23 | ||||||
Changes in assets and liabilities |
|||||||
Increase in accounts receivable |
(6,696 | ) | |||||
(Increase) decrease in receivables from related parties |
365 | ||||||
(Increase) decrease in prepaid expenses and other assets |
350 | ||||||
Increase (decrease) in accounts payable |
(343 | ) | |||||
Increase (decrease) in accrued liabilities |
62 | ||||||
Increase (decrease) in deferred revenue |
44 | ||||||
Net cash provided by operating activities |
3,248 | ||||||
Cash flows from investing activities |
|||||||
Purchases of furniture, fixtures and equipment |
(1,157 | ) | |||||
Acquisition of subsidiary, net of cash acquired |
— | ||||||
Net (increase) decrease in restricted cash |
— | ||||||
Net cash used in investing activities |
(1,157 | ) | |||||
Cash flows from financing activities |
|||||||
Proceeds from borrowings |
4,500 | ||||||
Principal payments on borrowings |
(5,113 | ) | |||||
Deferred financing costs |
— | ||||||
Contributed capital from MCP-TPI Holdings, LLC |
— | ||||||
Net cash provided by (used in) financing activities |
(613 | ) | |||||
Effect of exchange rate changes on cash |
476 | ||||||
Net increase in cash and cash equivalents |
1,954 | ||||||
Cash and cash equivalents |
|||||||
Beginning of period |
9,454 | ||||||
End of period |
$ | 11,408 | |||||
Supplemental disclosures of cash flow information |
|||||||
Cash paid for |
|||||||
Interest |
$ | 3,056 | |||||
Income taxes |
$ | 4,007 | |||||
Noncash investing and financing activities |
|||||||
Issuance of equity to lenders |
46 | ||||||
Cancellation of equity to lenders |
— | ||||||
Exchange of parent company stock inconsideration for Gildner acquisition |
— | ||||||
The accompanying notes are an integral part of these consolidated financial statements.
F-42
TECHNOLOGY PARTNERS INTERNATIONAL, INC. AND SUBSIDIARIES
NOTES TO CONSOLIDATED FINANCIAL STATEMENTS
(tabular amounts in thousands, except per share data)
NOTE 1—DESCRIPTION OF ORGANIZATION AND BUSINESS OPERATIONS
Technology Partners International, Inc. (the "Company" or "TPI"), is a Texas corporation. The Company was originally incorporated on October 4, 1990, as an S Corporation. On January 1, 1995, the Company changed to a C Corporation, and effective November 1, 1998, changed back to an S Corporation. Effective June 14, 2004, the Company elected to be taxed as a C Corporation.
In June 2005, the Company acquired Gildner & Associates, Inc. ("Gildner"), a firm specializing in the assessment, evaluation, negotiation and management of service contracts between clients and those clients' outside contractors. These service contracts typically involve the clients' human resource processes. The majority of Gildner's clients are Global 1000 corporations in the United States, who are seeking to enter into or streamline their third-party outsourcing contracts. Services are rendered by consultants who are primarily based throughout the United States.
TPI operates as a fact-based sourcing advisory firm specializing in the assessment, evaluation, negotiation and management of service contracts between TPI's clients and those clients' outside service providers and their internal shared service organizations. These service contracts typically involve the clients' information technology ("IT") infrastructure or software applications development, data and voice communications, or IT-enabled business processes such as the clients' internal finance and accounting functions, human resources, call center operations, or supply chain procurement. The majority of TPI's clients are Forbes Global 2000 corporations in the United States, Canada, Western Europe, Asia and Australia who are seeking to enter into or streamline their third-party outsourcing contracts. Clients are primarily charged on an hourly basis plus expenses. During 2006 and 2005, the Company also entered into a limited number of fixed fee arrangements. Services are rendered by TPI's consultants who are primarily based throughout the Americas, Europe and Australia.
On April 24, 2007, MCP-TPI Holdings, LLC ("MCP-TPI") announced that it had signed a definitive agreement ("Purchase Agreement") with Information Services Group, Inc. ("ISG"), pursuant to which ISG will acquire 100% of the shares of TPI Advisory Services, Inc. ("TPI"), a wholly-owned subsidiary of the Company. The Purchase Agreement was amended on September 30, 2007. The purchase price for the shares of TPI is $230.0 million in cash, plus warrants exercisable into 5 million shares of ISG common stock at an exercise price of $9.18 per share. In addition, MCP-TPI will receive TPI's cash balance on April 23, 2007, which the parties agree shall equal $5.0 million. The cash generated by TPI operations between the signing of the Purchase Agreement and the closing date will remain in TPI for the benefit of ISG. The warrants were valued at $2.72 per warrant or an aggregate of $13.6 million based on a Black-Scholes model using an expected life of 5 years, volatility of 40.1% and a risk-free interest rate of 4.25%. The acquisition of TPI was consummated by ISG on November 16, 2007. These TPI consolidated financial statements are being provided because TPI is considered the predecessor to ISG.
NOTE 2—SUMMARY OF SIGNIFICANT ACCOUNTING POLICIES
Principles of Consolidation
The accompanying consolidated financial statements include the accounts of Technology Partners International, Inc., and its wholly owned subsidiaries. All significant intercompany transactions and balances have been eliminated in consolidation.
F-43
TECHNOLOGY PARTNERS INTERNATIONAL, INC. AND SUBSIDIARIES
NOTES TO CONSOLIDATED FINANCIAL STATEMENTS (Continued)
(tabular amounts in thousands, except per share data)
NOTE 2—SUMMARY OF SIGNIFICANT ACCOUNTING POLICIES (Continued)
Use of Estimates
The preparation of financial statements in conformity with accounting principles generally accepted in the United States requires management to make estimates and assumptions that affect the reported amounts of assets and liabilities and the disclosure of contingent assets and liabilities at the date of the financial statements and revenues and expenses during the periods reported. Actual results could differ from those estimates. The complexity of the estimation process and issues related to the assumptions, risks and uncertainties inherent in the application of the proportional performance method of accounting affect the amounts of revenues, expenses, unbilled receivables and deferred revenue. Numerous internal and external factors can affect estimates. Estimates are also used for but not limited to: receivables, allowance for doubtful accounts, useful lives of furniture, fixtures and equipment, depreciation, fair value assumptions in analyzing goodwill and intangible asset impairments, income taxes and deferred tax asset valuation and the valuation of common stock and stock options.
Cash and Cash Equivalents
Cash equivalents are highly liquid investments with original maturities of three months or less and are stated at cost, which approximates fair value.
Prepaid Expenses and Other Assets
Prepaid expenses and other assets consist primarily of prepaid expenses for insurance, value-added tax ("VAT") and conferences and deposits for facilities, programs and promotion items.
Furniture, fixtures and equipment
Furniture, fixtures and equipment includes computers, leasehold improvements and capitalized software and is stated at cost less accumulated depreciation. Depreciation is computed by applying the straight-line method over the estimated useful lives of assets, which range from two to five years. Leasehold improvements are depreciated over the lesser of the useful lives of the underlying assets or the lease term. Expenditures for renewals and betterments are capitalized. Repairs and maintenance are charged to expense as incurred. The cost and accumulated depreciation of assets sold or otherwise disposed of are removed from the accounts and any associated gain or loss thereon is reflected in the consolidated statements of operations.
The Company reviews its long-lived assets for impairment whenever events or changes in circumstances indicate that the carrying amount of an asset may not be recoverable. No such impairment indicator has occurred.
Internal-Use Software and Website Development Costs
The Company capitalizes internal-use software and website development costs and records these amounts within furniture, fixtures and equipment. Accounting standards require that certain costs related to the development or purchase of internal-use software and systems as well as the costs incurred in the application development stage related to its website be capitalized and amortized over the estimated useful life of the software or system. They also require that costs related to the
F-44
TECHNOLOGY PARTNERS INTERNATIONAL, INC. AND SUBSIDIARIES
NOTES TO CONSOLIDATED FINANCIAL STATEMENTS (Continued)
(tabular amounts in thousands, except per share data)
NOTE 2—SUMMARY OF SIGNIFICANT ACCOUNTING POLICIES (Continued)
preliminary project stage, data conversion and post implementation/operation stage of an internal-use software development project be expensed as incurred.
During the period from January 1, 2007 to November 16, 2007 the Company capitalized $0.2 million of costs associated with the system conversion or website development. Amortization expense for the period from January 1, 2007 to November 16, 2007 totaled $0.5 million.
Revenue Recognition
In accordance with the provisions of accounting standard for revenue recognition, we recognize our revenues for the sale of services and products when persuasive evidence of an arrangement exists, services have been rendered or delivery has occurred, the fee is fixed or determinable and the collectability of the related revenue is reasonably assured.
The Company principally derives revenues from fees for services generated on a project-by-project basis. Prior to the commencement of a project, the Company reaches agreement with the client on rates for services based upon the scope of the project, staffing requirements and the level of client involvement. It is the Company's policy to obtain written agreements from new clients prior to performing services. In these agreements, the clients acknowledge that they will pay based upon the amount of time spent on the project or an agreed upon fee structure. Revenues for services rendered are recognized on a time and materials basis or on a fixed-fee or capped-fee basis in accordance with accounting and disclosure requirements for revenue recognition.
Fees for services that have been performed, but for which the Company has not invoiced the customers are recorded as unbilled receivables in the accompanying consolidated balance sheets. Invoices issued before the related services have been performed are recorded as deferred revenue in the accompanying consolidated balance sheets.
Revenues for time and materials contracts are recognized based on the number of hours worked by the Company's consultants at an agreed upon rate per hour and are recognized in the period in which services are performed. Revenues for time and materials contracts are billed monthly, semimonthly or in accordance with the specific contractual terms of each project.
Revenues related to fixed-fee or capped-fee contracts are recognized into revenue as value is delivered to the customer. The pattern of revenue recognition for these contracts varies depending on the terms of the individual contracts, and may be recognized proportionally or deferred until the end of the contract term and recognized when our obligations have been fulfilled with the customer. The pattern of revenue recognition for the proportional contracts is recognized on the proportional performance method of accounting based on the ratio of labor hours incurred to estimated total labor hours, which the Company considers to be the best available indicator of the pattern and timing in which contract obligations are fulfilled. This percentage is multiplied by the contracted dollar amount of the project to determine the amount of revenue to recognize in an accounting period. The contracted amount used in this calculation typically excludes the amount the client pays for reimbursable expenses. There are situations where the number of hours to complete projects may exceed the Company's original estimate as a result of an increase in project scope or unforeseen events. On regular basis, the Company reviews the hours incurred and estimated total labor hours to complete. The results of any revisions in these estimates are reflected in the period in which they become known.
F-45
TECHNOLOGY PARTNERS INTERNATIONAL, INC. AND SUBSIDIARIES
NOTES TO CONSOLIDATED FINANCIAL STATEMENTS (Continued)
(tabular amounts in thousands, except per share data)
NOTE 2—SUMMARY OF SIGNIFICANT ACCOUNTING POLICIES (Continued)
The Company believes it has a demonstrated history of successfully estimating the total labor hours to complete a project.
The agreements entered into in connection with a project, whether on a time and materials basis or fixed-fee or capped-fee basis, typically allow the Company's clients to terminate early due to breach or for convenience with 30 days' notice. In the event of termination, the client is contractually required to pay for all time, materials and expenses incurred by the Company through the effective date of the termination. In addition, from time to time, the Company enters into agreements with clients that limit the Company's right to enter into business relationships with specific competitors of that client for a specific time period. These provisions typically prohibit the Company from performing a defined range of services that it might otherwise be willing to perform for potential clients. These provisions are generally limited to six to twelve months and usually apply only to specific employees or the specific project team.
Reimbursable Expenditures
The Company accounts for reimbursable expenditures in accordance with accounting and disclosure requirement for income statement characterization of reimbursements received for "out-of-pocket" expenses incurred. Amounts billed to customers for reimbursable expenditures are included in revenues and the associated costs incurred by the Company are included in direct costs and expenses for advisors in the accompanying consolidated statement of operations. Non-reimbursable amounts are expensed as incurred. Reimbursable expenditures totaled $13.7 million for the period from January 1, 2007 to November 16, 2007.
Direct Costs and Expenses for Advisors
Direct costs and expenses for advisors include payroll expenses and subcontractor fees directly associated with the generation of revenues and other program expenses. Direct costs and expenses for advisors are expensed as incurred.
Deferred Financing Costs
Costs directly incurred in obtaining long-term financing are deferred and are amortized over the life of the related loan using an approximation of the effective interest method. Amortization of deferred financing costs is included in interest expense
Income Taxes
In 2003, TPI was an S Corporation, and as such, all United States federal and certain state income taxes were the responsibility of the stockholders and not TPI. Any material state income taxes that are the responsibility of TPI were provided for as an income tax provision.
On June 14, 2004, the Company changed to a C Corporation and as such, United States federal and all state income taxes then became the responsibility of the Company. Additionally, TPI is subject to foreign income taxes on taxable income in the countries in which it operates.
F-46
TECHNOLOGY PARTNERS INTERNATIONAL, INC. AND SUBSIDIARIES
NOTES TO CONSOLIDATED FINANCIAL STATEMENTS (Continued)
(tabular amounts in thousands, except per share data)
NOTE 2—SUMMARY OF SIGNIFICANT ACCOUNTING POLICIES (Continued)
TPI accounts for income taxes in accordance with Statement of Financial Accounting Standards ("SFAS") No. 109, Accounting for Income Taxes. Under this method, deferred tax assets and liabilities are determined based upon differences between the financial statement and tax basis of assets and liabilities using enacted income tax rates in effect for the year in which the differences are expected to reverse. The Company records a valuation allowance to reduce deferred tax assets if it is more likely than not that some or all of the deferred tax assets will not be realized.
Effective January 1, 2007, the Company adopted Financial Interpretation No. 48, Accounting for Uncertainty in Income Taxes, an Interpretation of FASB Statement No. 109 ("FIN 48"). Interpretation 48 prescribes a recognition threshold and a measurement attribute for the financial statement recognition and measurement of a tax position taken or expected to be taken in a tax return. Benefits from tax positions should be recognized in the financial statements only when it is more likely than not that the tax position will be sustained upon examination by the appropriate taxing authority that would have full knowledge of all relevant information. A tax position that meets the more-likely-than-not recognition threshold is measured at the largest amount of benefit that is greater than fifty percent likely of being realized upon ultimate settlement. Tax positions that previously failed to meet the more-likely-than-not recognition threshold should be recognized in the first subsequent financial reporting period in which that threshold is met. Previously recognized tax positions that no longer meet the more-likely-than-not recognition threshold should be derecognized in the first subsequent financial reporting period in which that threshold is no longer met. Interpretation 48 also provides guidance on the accounting for and disclosure of unrecognized tax benefits, interest and penalties.
The cumulative effect of adopting the provisions of FIN 48 has been reported as an adjustment to the opening balance of retained earnings as of January 1, 2007. The adoption of FIN 48 reduced the Company's retained earnings by $0.2 million. The unrecognized tax benefits relate primarily to state income tax issues.
It is the Company's policy to record interest and penalties associated with FIN 48 items in the tax expense line on the consolidated statements of operations.
Foreign Currency Translation
The assets and liabilities of the Company's foreign subsidiaries are translated into U.S. dollars at exchange rates in effect at the end of the reporting period. Revenue and expense items are translated at average exchange rates for the reporting period. Resulting translation adjustments are included in the accompanying statement of stockholders' equity as a component of Accumulated Other Comprehensive Loss.
The functional currency of the Company and its subsidiaries is the respective local currency. The Company has contracts denominated in foreign currencies and therefore, a portion of the Company's revenues are subject to foreign currency risks. Transactional currency gains and losses that arise from transactions denominated in currencies other than the functional currencies of our operations are recorded in Foreign Currency Transaction (Loss) Gain in the accompanying consolidated statement of operations.
F-47
TECHNOLOGY PARTNERS INTERNATIONAL, INC. AND SUBSIDIARIES
NOTES TO CONSOLIDATED FINANCIAL STATEMENTS (Continued)
(tabular amounts in thousands, except per share data)
NOTE 2—SUMMARY OF SIGNIFICANT ACCOUNTING POLICIES (Continued)
Fair Value of Financial Instruments
The reported amounts of certain of the Company's financial instruments including cash and cash equivalents, accounts receivable and accounts payable approximate fair value due to their short maturities. The fair value was estimated using market interest rates for similar types of investments.
Concentration of Credit Risk
Financial instruments that potentially subject the Company to significant concentrations of credit risk consist principally of cash and accounts receivable. The Company places its cash investments with high quality financial institutions. The Company extends credit to its customers based upon an evaluation of the customer's financial condition and credit history and generally does not require collateral.
Goodwill and Intangible Assets
Goodwill represents the excess of the purchase price of purchased businesses over the estimated fair value of the acquired businesses' net assets. Goodwill and intangible assets with indefinite-lives are not amortized, but are reviewed annually for impairment. Intangible assets that are not deemed to have indefinite-lives are amortized over their useful lives. The Company reviews the carrying value of goodwill and other long-lived assets annually to determine whether an impairment has occurred from the date of relevant acquisition. The Company has elected to make December 31 the annual impairment assessment date and will perform additional impairment tests if a change in circumstances occurs that would more likely than not reduce the fair value of the long-lived assets below their carrying amount. The Company did not record any impairment charges for the year ended December 31, 2006.
Stock-Based Compensation
The Company has stock-based employee compensation plans, which are more fully described in Note 5. Effective January 1, 2006, the Company adopted the fair value recognition provisions of accounting standard for share-based payment using the prospective transition method. Under this transition method, only new awards (or awards modified, repurchased, or cancelled after the effective date) are accounted for under this provision.
As discussed in Note 5, the awards granted under our stock-based employee compensation plans are only fully vested and exercisable upon a liquidity event. Accordingly, the Company treated the awards as "variable performance awards" and given that the performance condition (a liquidity event) was outside the control of the Company, concluded that such performance condition was not probable. As a result, there was no impact to the Company's consolidated financial statements.
Prior to the completion of the ISG acquisition of TPI on November 16, 2007, no compensation expense has been recorded since the same performance condition (a liquidity event) had not been deemed probable.
During the 46 Week period ended November 16, 2007 all management share units were issued at the estimated fair value of the Company's common stock at the date of grant. The Company granted
F-48
TECHNOLOGY PARTNERS INTERNATIONAL, INC. AND SUBSIDIARIES
NOTES TO CONSOLIDATED FINANCIAL STATEMENTS (Continued)
(tabular amounts in thousands, except per share data)
NOTE 2—SUMMARY OF SIGNIFICANT ACCOUNTING POLICIES (Continued)
no awards during the 46 Week Period ended November 16, 2007. No awards were granted to nonemployees during these periods. The weighted average remaining contractual life for options and management share units outstanding was 7.42 years for the 46 Week period ended November 16, 2007. The fair value of each award is estimated on the date of grant using the Black-Scholes option-pricing model that uses the assumptions for the risk-free interest rate, volatility, dividend yield and the expected term of the options. The risk-free interest rate is based on the U.S. Treasury yield curve in effect at the time of grant for a period equal to the expected term of the option. The following reflects the assumptions used for the awards for 2006 awards.
| |
For the period January 1, 2007 to November 16, 2007 |
|||
|---|---|---|---|---|
Risk-free interest rate |
3.6 | % | ||
Volatility |
40.20 | |||
Dividend yield |
0.00 | |||
Term |
8 years | |||
The Company considered an estimated forfeiture rate when determining the fair value of the 2006 awards. The forfeiture rate is based on historical experience. Estimated forfeitures will be adjusted to reflect actual forfeitures in future periods. However, as noted above, these awards are considered performance awards for which the performance condition is not deemed probable and no compensation expense will be recognized related to such awards until a liquidity event occurs.
NOTE 3—LEASES
TPI leased its office space under long-term operating lease agreements. TPI's rental expense for operating leases for the period from January 1, 2007 to November 16, 2007 was $0.8 million.
NOTE 4—INCOME TAXES
The components of TPI's provision for income taxes for the period ended November 16, 2007 is as follows:
| |
For the period January 1, 2007 to November 16, 2007 |
|||
|---|---|---|---|---|
Current |
||||
Federal |
$ | 2,764 | ||
State and local |
407 | |||
Foreign |
2,183 | |||
|
5,354 | |||
Deferred |
||||
Federal |
(414 | ) | ||
State and local |
8 | |||
|
(406 | ) | ||
Total income tax provision |
$ | 4,948 | ||
F-49
TECHNOLOGY PARTNERS INTERNATIONAL, INC. AND SUBSIDIARIES
NOTES TO CONSOLIDATED FINANCIAL STATEMENTS (Continued)
(tabular amounts in thousands, except per share data)
NOTE 4—INCOME TAXES (Continued)
The differences between the effective tax rate reflected in the total provision for income taxes and the U.S. federal statutory rate of 35% for the period ended November 16, 2007 is as follows:
| |
For the period January 1, 2007 to November 16, 2007 |
|||
|---|---|---|---|---|
Federal statutory rate |
35.0 | % | ||
Expenses related to profit share program charges |
(45.1 | ) | ||
State income taxes |
(0.6 | ) | ||
Valuation allowance on foreign tax credits |
0.0 | |||
Release of valuation allowance on foreign tax credit |
0.0 | |||
Effect of rates different than statutory |
0.2 | |||
Foreign taxes |
(0.3 | ) | ||
|
(10.8 | )% | ||
Foreign net operating loss carryforwards have been fully reserved until realized due to uncertainty regarding their realization.
NOTE 5—STOCK-BASED COMPENSATION PLANS
2000 Stock Plan
Certain options granted to purchase common stock under the Company's 2000 Stock Plan contained terms that prevented the option holders from exercising vested options. As a result of this contingency, the Company determined these options did not have a measurement date.
There were no grants pursuant to the 2000 Stock Plan in 2007.
2004 Management Share Plan
MCP-TPI Holdings, LLC, the Company's ultimate parent, adopted the 2004 Management Share Plan (the "Management Share Plan"), which provides for grants of shares of MCP-TPI Holdings, LLC. The purpose of the Management Share Plan is to contract and retain the best available personnel, provide additional incentives to the Company's employees and promote the success of the business. These shares vest over periods ranging from one to four years, are subject to the "liquidity event" performance conditions described below and have an aggregate repurchase price at the option of MCP-TPI Holdings, LLC of $1. The contractual term of the shares is ten years. The total numbers of management shares that may be granted under the plan are not limited by the plan.
Concurrent with the recapitalization of the Company in 2004, certain of the unvested options from the Company's former 2000 Stock Plan totaling 2,256,511 options were rolled over into 2,666,723 management share units of MCP-TPI Holdings, LLC based upon a conversion ratio. These options held the same vesting terms as previously held. MCP-TPI Holdings, LLC granted an additional 2,251,000, 3,094,178 and 6,400,842 shares during the years ended December 31, 2004, 2005 and 2006, respectively. These management shares were granted on the condition that they may be exercised only after
F-50
TECHNOLOGY PARTNERS INTERNATIONAL, INC. AND SUBSIDIARIES
NOTES TO CONSOLIDATED FINANCIAL STATEMENTS (Continued)
(tabular amounts in thousands, except per share data)
NOTE 5—STOCK-BASED COMPENSATION PLANS (Continued)
MCP-TPI Holdings, LLC transacts a liquidity event defined as consummation of (i) the sale of all or substantially all of the assets of MCP-TPI Holdings, LLC and its wholly owned subsidiaries, taken as a whole, in a single transaction or a series of one or more related transactions to one or more persons who are not affiliates of MCP-TPI Holdings, LLC, (ii) an Initial Public Offering of MCP-TPI Holdings, LLC, (iii) a complete liquidation of MCP-TPI Holdings, LLC and its wholly owned subsidiaries, (iv) a merger or consolidation, or (v) the sale of at least 95% of the issued and outstanding shares MCP-TPI Holdings, LLC to one or more persons who are not affiliates of MCP-TPI Holdings, LLC. Such management shares were contingent grants and as a result of this contingency, the Company determined that the management shares issued with these terms did not yet have a measurement date, with respect to grants made prior to January 1, 2006 under APB 25. While a measurement date has been established for grants made on or after January 1, 2006 under FAS 123(R), no compensation expense has been recorded in the years ended 2006 and 2005 for these grants as they contained performance conditions that management deemed not probable during those periods. On November 16, 2007, as a result of the transaction discussed in Note 1, these performance conditions were met and the contingencies were realized, therefore the Company recorded a noncash compensation charge of $55.5 million related to the Management Share Plan for the 46 Week Period ended November 16, 2007.
| |
Shares | Weighted Average Exercise Price |
|||||
|---|---|---|---|---|---|---|---|
Management Share Units outstanding as of December 31, 2005 |
7,895 | $ | 7.76 | ||||
Granted |
6,401 | $ | 13.12 | ||||
Forfeited |
(292 | ) | $ | 11.92 | |||
Exercised |
— | $ | — | ||||
Management Share Units outstanding as of December 31, 2006 |
14,004 | $ | 10.13 | ||||
Granted |
— | $ | — | ||||
Forfeited |
(277 | ) | $ | 11.83 | |||
Exercised |
— | $ | — | ||||
Management Share Units outstanding as of November 16, 2007 |
13,727 | $ | 10.09 | ||||
F-51
TECHNOLOGY PARTNERS INTERNATIONAL, INC. AND SUBSIDIARIES
NOTES TO CONSOLIDATED FINANCIAL STATEMENTS (Continued)
(tabular amounts in thousands, except per share data)
NOTE 5—STOCK-BASED COMPENSATION PLANS (Continued)
| |
Outstanding Management Share Units |
Options Exercisable | ||||||||||||||
|---|---|---|---|---|---|---|---|---|---|---|---|---|---|---|---|---|
Range of Exercise Prices
|
Outstanding as of November 16, 2007 |
Weighted Average Remaining Contractual Life (In Years) |
Weighted Average Exercise Price |
Exercisable | Weighted Average Exercise Price |
|||||||||||
$ 7.08 – $7.13 |
4,772 | 6.55 | $ | 7.10 | 4,678 | $ | 7.10 | |||||||||
$ 8.80 |
2,978 | 7.15 | $ | 8.80 | 2,978 | $ | 8.80 | |||||||||
$13.12 |
5,977 | 8.25 | $ | 13.12 | 3,561 | $ | 13.12 | |||||||||
|
13,727 | 7.42 | $ | 10.09 | 11,217 | $ | 9.46 | |||||||||
Profit Participation Share Plan
In 2005, MCP-TPI Holdings, LLC, the Company's ultimate parent, adopted the Profit Participation Share Plan. Pursuant to this Plan, 291,264 Class A-2 profit participation shares were issued to a single executive on March 16, 2005. These shares are time vested at 20% annually over a 5 year period. These profit participation shares were granted on the condition that they may be exercised only after MCP-TPI Holdings, LLC transacts a liquidity event defined as consummation of (i) the sale of all or substantially all of the assets of MCP-TPI Holdings, LLC and its wholly owned subsidiaries, taken as a whole, in a single transaction or a series of one or more related transactions to one or more persons who are not affiliates of MCP-TPI Holdings, LLC, (ii) an Initial Public Offering of MCP-TPI Holdings, LLC, (iii) a complete liquidation of MCP-TPI Holdings, LLC and its wholly owned subsidiaries, (iv) a merger or consolidation, or (v) the sale of at least 95% of the issued and outstanding shares of MCP-TPI Holdings, LLC to one or more persons who are not affiliates of MCP-TPI Holdings, LLC. Such profit participation shares are contingent grants and as a result of this performance contingency, the Company deemed that prior to the completion of the ISG acquisition of TPI on November 16, 2007 (see Note 1), these profit participation shares did not yet have a measurement date. As a result of the transaction, these performance conditions were met and the contingencies were realized, therefore the Company recorded a noncash compensation charge of $2.7 million related to the class A-2 profit participation shares for the 46 week period ended November 16, 2007.
NOTE 6—COMMITMENTS AND CONTINGENCIES
Employee Retirement Plans
TPI maintains a qualified profit-sharing plan (the "Plan"). During 2006, the provisions of the Plan provide for a maximum employer contribution per eligible employee of the lesser of 12.75% of compensation or $25,500. Employees are eligible to participate in the Plan upon the next entry date following six months of service and are 100% vested upon entering the Plan.
NOTE 7—RELATED PARTY TRANSACTIONS
The Company's related party transactions primarily consisted of subcontract relationships with an affiliated company to provide consulting services to a third-party customer. From time to time, the
F-52
TECHNOLOGY PARTNERS INTERNATIONAL, INC. AND SUBSIDIARIES
NOTES TO CONSOLIDATED FINANCIAL STATEMENTS (Continued)
(tabular amounts in thousands, except per share data)
NOTE 7—RELATED PARTY TRANSACTIONS (Continued)
Company also has receivables and payables with employees and shareholders. All related party transactions have been conducted in the normal course of business as if the parties were unrelated. The Company recognized no revenue or expenses during the period from January 1, 2007 to November 16, 2007 with related parties that are reflected within the accompanying consolidated statements of operations.
NOTE 8—SEGMENT AND GEOGRAPHICAL INFORMATION
The Company operates in one segment, which includes providing fact-based sourcing advisory services. The Company operates principally in the Americas, Europe and Asia Pacific. The Company's foreign operations are subject to local government regulations and to the uncertainties of the economic and political conditions of those areas.
Geographical information for the segment is as follows:
| |
For the period January 1, 2007 to November 16, 2007 |
|||
|---|---|---|---|---|
Revenue |
||||
Americas |
$ | 102,794 | ||
Europe |
42,434 | |||
Asia Pacific |
8,523 | |||
|
$ | 153,751 | ||
The segregation of revenues by geographic region is based upon the location of the legal entity performing the services. The Company does not measure or monitor gross profit or operating income by geography for the purposes of making operating decisions or allocating resources.
F-53
| Exhibit Number | Description | ||
|---|---|---|---|
| 2.0 | Purchase Agreement, dated as of April 24, 2007, as amended, by and between Registrant and MCP-TPI holdings, LLC (previously filed as Annex A to the Registrant's Definitive Proxy Statement filed with the SEC on October 17, 2007 (Commission File Number: 001-33287), and incorporated herein by reference). | ||
3.1 |
Amended and Restated Certificate of Incorporation of the Company (previously filed as Exhibit 3.1 to Amendment No. 5 to the Registrant's Registration Statement on Form S-1 filed with the SEC on January 29, 2007 (Commission File Number: 333-136536), and incorporated herein by reference). |
||
3.2 |
Amended and Restated By-Laws previously filed as Exhibit 3.2 to the Registrant's Form 8-K filed with the SEC on December 10, 2008 (Commission File Number: 001-33287), and incorporated herein by reference. |
||
4.1 |
Specimen Unit Certificate (previously filed as Exhibit 4.1 to Amendment No. 3 to the Registrant's Registration Statement on Form S-1 filed with the SEC on December 22, 2006 (Commission File Number: 333-136536), and incorporated herein by reference). |
||
4.2 |
Specimen Common Stock Certificate (previously filed as Exhibit 4.2 to Amendment No. 3 to the Registrant's Registration Statement on Form S-1 filed with the SEC on December 22, 2006 (Commission File Number: 333-136536), and incorporated herein by reference). |
||
4.3 |
Specimen Warrant Certificate (previously filed as Exhibit 4.3 to Amendment No. 3 to the Registrant's Registration Statement on Form S-1 filed with the SEC on December 22, 2006 (Commission File Number: 333-136536), and incorporated herein by reference). |
||
4.4 |
Warrant Agreement between Continental Stock Transfer & Trust Company and the Registrant dated as of February 6, 2007 (previously filed as Exhibit 4.4 to Amendment No. 5 to the Registrant's Registration Statement on Form S-1 filed with the SEC on January 29, 2007 (Commission File Number: 333-136536), and incorporated herein by reference). |
||
4.5 |
Form of Unit Purchase Option (previously filed as Exhibit 4.5 to Amendment No. 5 to the Registrant's Registration Statement on Form S-1 filed with the SEC on January 29, 2007 (Commission File Number: 333-136536), and incorporated herein by reference). |
||
4.8 |
Common Stock Purchase Warrant, dated as of November 16, 2007, issued to MCP-TPI Holdings, LLC (previously filed as Exhibit 4.8 to the Registrant's Form 8-K filed with the SEC on November 27, 2007 (Commission File Number: 001-33287), and incorporated herein by reference). |
||
10.1 |
Office Lease Agreement (previously filed as Exhibit 10.2 to Amendment No. 1 to the Registrant's Registration Statement on Form S-1 filed with the SEC on October 2, 2006 (Commission File Number: 333-136536), and incorporated herein by reference). |
||
10.2 |
Management Unit Purchase Agreement by and between the Registrant and Oenoke Partners, LLC, dated August 2, 2006 (previously filed as Exhibit 10.3 to Amendment No. 3 to the Registrant's Registration Statement on Form S-1 filed with the SEC on December 22, 2006 (Commission File Number: 333-136536), and incorporated herein by reference). |
||
10.3 |
Amendment to Management Unit Purchase Agreement by and between the Registrant and Oenoke Partners, LLC, dated September 29, 2006 (previously filed as Exhibit 10.4 to Amendment No. 3 to the Registrant's Registration Statement on Form S-1 filed with the SEC on December 22, 2006 (Commission File Number: 333-136536), and incorporated herein by reference). |
||
| Exhibit Number | Description | ||
|---|---|---|---|
| 10.4 | Redemption Agreement by and between the Registrant and Oenoke Partners, LLC, dated September 29, 2006 (previously filed as Exhibit 10.5 to Amendment No. 3 to the Registrant's Registration Statement on Form S-1 filed with the SEC on December 22, 2006 (Commission File Number: 333-136536), and incorporated herein by reference). | ||
10.5 |
Second Amended and Restated Private Placement Purchase Agreement dated January 29, 2007 between the Registrant and Oenoke Partners, LLC (previously filed as Exhibit 10.6 to Amendment No. 5 to the Registrant's Registration Statement on Form S-1 filed with the SEC on January 29, 2007 (Commission File Number: 333-136536), and incorporated herein by reference). |
||
10.6 |
Stock Escrow Agreement by and among Continental Stock Transfer & Trust Company, the Registrant, and Initial Stockholders dated as of February 6, 2007 (previously filed as Exhibit 10.8 to Amendment No. 5 to the Registrant's Registration Statement on Form S-1 filed with the SEC on January 29, 2007 (Commission File Number: 333-136536), and incorporated herein by reference). |
||
10.7 |
Registration Rights Agreement between the Registrant and the existing Stockholders dated as of February 6, 2007 (previously filed as Exhibit 10.9 to Amendment No. 3 to the Registrant's Registration Statement on Form S-1 filed with the SEC on December 22, 2006 (Commission File Number: 333-136536), and incorporated herein by reference). |
||
10.8 |
Stock Transfer Agreement between Oenoke Partners, the Registrant and Robert E. Weissman, dated December 21, 2006 (previously filed as Exhibit 10.11 to Amendment No. 3 to the Registrant's Registration Statement on Form S-1 filed with the SEC on December 22, 2006 (Commission File Number: 333-136536), and incorporated herein by reference). |
||
10.9 |
Stock Transfer Agreement between Oenoke Partners, the Registrant and Robert J. Chrenc, dated December 21, 2006 (previously filed as Exhibit 10.12 to Amendment No. 3 to the Registrant's Registration Statement on Form S-1 filed with the SEC on December 22, 2006 (Commission File Number: 333-136536), and incorporated herein by reference). |
||
10.10 |
Stock Transfer Agreement between Oenoke Partners, the Registrant and R. Glenn Hubbard, dated December 21, 2006 (previously filed as Exhibit 10.13 to Amendment No. 3 to the Registrant's Registration Statement on Form S-1 filed with the SEC on December 22, 2006 (Commission File Number: 333-136536), and incorporated herein by reference). |
||
10.11 |
Stock Transfer Agreement between Oenoke Partners, the Registrant and Francis B. Barker, dated December 21, 2006 (previously filed as Exhibit 10.14 to Amendment No. 3 to the Registrant's Registration Statement on Form S-1 filed with the SEC on December 22, 2006 (Commission File Number: 333-136536), and incorporated herein by reference). |
||
10.12 |
Stock Transfer Agreement between Oenoke Partners, the Registrant and Barry Holt, dated December 21, 2006 (previously filed as Exhibit 10.15 to Amendment No. 3 to the Registrant's Registration Statement on Form S-1 filed with the SEC on December 22, 2006 (Commission File Number: 333-136536), and incorporated herein by reference). |
||
10.13 |
Stock Transfer Agreement between Oenoke Partners, the Registrant and William Fitzgerald, dated December 21, 2006 (previously filed as Exhibit 10.16 to Amendment No. 5 to the Registrant's Registration Statement on Form S-1 filed with the SEC on January 29, 2007 (Commission File Number: 333-136536), and incorporated herein by reference). |
||
10.14 |
Senior Advisor Agreement by and among the Registrant and Barry Holt, dated December 21, 2006 (previously filed as Exhibit 10.17 to Amendment No. 3 to the Registrant's Registration Statement on Form S-1 filed with the SEC on December 22, 2006 (Commission File Number: 333-136536), and incorporated herein by reference). |
||
| Exhibit Number | Description | ||
|---|---|---|---|
| 10.15 | Senior Advisor Agreement by and among the Registrant and Francis B. Barker, dated December 21, 2006 (previously filed as Exhibit 10.18 to Amendment No. 3 to the Registrant's Registration Statement on Form S-1 filed with the SEC on December 22, 2006 (Commission File Number: 333-136536), and incorporated herein by reference). | ||
10.16 |
Amended and Restated Officer's Letter Agreement by Michael P. Connors, dated January 29, 2007 (previously filed as Exhibit 10.19 to Amendment No. 5 to the Registrant's Registration Statement on Form S-1 filed with the SEC on January 29, 2007 (Commission File Number: 333-136536), and incorporated herein by reference). |
||
10.17 |
Amended and Restated Officer's Letter Agreement by Frank Martell, dated January 29, 2007 (previously filed as Exhibit 10.20 to Amendment No. 5 to the Registrant's Registration Statement on Form S-1 filed with the SEC on January 29, 2007 (Commission File Number: 333-136536), and incorporated herein by reference). |
||
10.18 |
Amended and Restated Officer's Letter Agreement by Earl H. Doppelt, dated January 29, 2007 (previously filed as Exhibit 10.21 to Amendment No. 5 to the Registrant's Registration Statement on Form S-1 filed with the SEC on January 29, 2007 (Commission File Number: 333-136536), and incorporated herein by reference). |
||
10.19 |
Amended and Restated Officer's Letter Agreement by Richard G. Gould, dated January 29, 2007 (previously filed as Exhibit 10.22 to Amendment No. 5 to the Registrant's Registration Statement on Form S-1 filed with the SEC on January 29, 2007 (Commission File Number: 333-136536), and incorporated herein by reference). |
||
10.20 |
Stockholder's Letter Agreement by Robert E. Weissman, dated December 21, 2006 (previously filed as Exhibit 10.23 to Amendment No. 3 to the Registrant's Registration Statement on Form S-1 filed with the SEC on December 22, 2006 (Commission File Number: 333-136536), and incorporated herein by reference). |
||
10.21 |
Stockholder's Letter Agreement by Robert J. Chrenc, dated December 21, 2006 (previously filed as Exhibit 10.24 to Amendment No. 3 to the Registrant's Registration Statement on Form S-1 filed with the SEC on December 22, 2006 (Commission File Number: 333-136536), and incorporated herein by reference). |
||
10.22 |
Stockholder's Letter Agreement by R. Glenn Hubbard, dated December 21, 2006 (previously filed as Exhibit 10.25 to Amendment No. 3 to the Registrant's Registration Statement on Form S-1 filed with the SEC on December 22, 2006 (Commission File Number: 333-136536), and incorporated herein by reference). |
||
10.23 |
Stockholder's Letter Agreement by Francis B. Barker, dated December 21, 2006 (previously filed as Exhibit 10.26 to Amendment No. 3 to the Registrant's Registration Statement on Form S-1 filed with the SEC on December 22, 2006 (Commission File Number: 333-136536), and incorporated herein by reference). |
||
10.24 |
Stockholder's Letter Agreement by Barry Holt, dated December 21, 2006(previously filed as Exhibit 10.27 to Amendment No. 3 to the Registrant's Registration Statement on Form S-1 filed with the SEC on December 22, 2006 (Commission File Number: 333-136536), and incorporated herein by reference). |
||
10.25 |
Amended and Restated Stockholder's Letter Agreement by William Fitzgerald, dated January 29, 2007 (previously filed as Exhibit 10.28 to Amendment No. 5 to the Registrant's Registration Statement on Form S-1 filed with the SEC on January 29, 2007 (Commission File Number: 333-136536), and incorporated herein by reference). |
||
| Exhibit Number | Description | ||
|---|---|---|---|
| 10.26 | Amended and Restated Stockholder's Letter Agreement by Oenoke Partners, LLC, dated January 29, 2007 (previously filed as Exhibit 10.29 to Amendment No. 5 to the Registrant's Registration Statement on Form S-1 filed with the SEC on January 29, 2007 (Commission File Number: 333-136536), and incorporated herein by reference). | ||
10.27 |
Management Stock Purchase Agreement, dated December 21, 2006 (previously filed as Exhibit 10.30 to Amendment No. 3 to the Registrant's Registration Statement on Form S-1 filed with the SEC on December 22, 2006 (Commission File Number: 333-136536), and incorporated herein by reference). |
||
10.28 |
2007 Equity Incentive Plan (previously filed as Annex B to the Registrant's Definitive Proxy Statement filed with the SEC on October 17, 2007 (Commission File Number: 001-33287), and incorporated herein by reference). |
||
10.29 |
2007 Employee Stock Purchase Plan (previously filed as Annex C to the Registrant's Definitive Proxy Statement filed with the SEC on October 17, 2007 (Commission File Number: 001-33287), and incorporated herein by reference). |
||
10.30 |
Credit Agreement, dated as of November 16, 2007, among International Advisory Holdings Corp., International Consulting Acquisition Corp., various lenders and Deutsche Bank Trust Company Americas, as Administrative Agent (previously filed as Exhibit 10.30 to the Registrant's Form 8-K filed with the SEC on November 27, 2007 (Commission File Number: 001-33287), and incorporated herein by reference). |
||
10.31 |
Amendment to 2007 Equity Incentive Plan (previously filed as Exhibit 10.31 to the Registrant's Form 10-K filed with the SEC on March 27, 2008) (Commission File Number: 001-33287), and incorporated herein by reference). |
||
10.32 |
First Amendment to Credit Agreement dated September 11, 2009 (previously filed as Exhibit 10.1 to the Registrant's Form 10-Q filed with the SEC on November 6, 2009) (Commission File Number: 001-33287), and incorporated herein by reference). |
||
10.33 |
** |
Employment Letter dated as of September 24, 2009, between the Company and David E. Berger (previously filed as Exhibit 10.1 to the Registrant's Form 8-K filed with the SEC on September 29, 2009) (Commission File Number: 001-33287), and incorporated herein by reference). |
|
10.34 |
** |
Form of Restricted Stock Unit Award Agreement (Time-Based), (previously filed as Exhibit 10.2 to the Registrant's Form 8-K filed with the SEC on September 29, 2009) (Commission File Number: 001-33287), and incorporated herein by reference). |
|
10.35 |
** |
Form of Restricted Covenant Agreement, (previously filed as Exhibit 10.3 to the Registrant's Form 8-K filed with the SEC on September 29, 2009) (Commission File Number: 001-33287), and incorporated herein by reference). |
|
10.36 |
** |
Severance Agreement dated as of October 5, 2009, between the Company and David E. Berger (previously filed as Exhibit 10.4 to the Registrant's Form 8-K filed with the SEC on September 29, 2009) (Commission File Number: 001-33287), and incorporated herein by reference). |
|
11.0 |
* |
Computation of Earnings Per Share (included in Consolidated Statement of Operations to the Consolidated Financial Statements included in Part II—Item 8 herein). |
|
14.0 |
Code of Ethics (previously filed as Exhibit 14.0 to the Registrant's Form 10-K filed with the SEC on March 27, 2008) (Commission File Number: 001-33287), and incorporated herein by reference). |
||
| Exhibit Number | Description | ||
|---|---|---|---|
| 16.1 | Letter of Rothstein, Kass and Company, P.C. regarding change in certifying accountant (previously filed as Exhibit 16.1 to the Registrant's Form 8-K filed with the SEC on January 9, 2008 (Commission File Number: 001-33287), and incorporated herein by reference). | ||
21.1 |
Subsidiaries of the Company (previously filed as Exhibit 21.1 to the Registrant's Form 8-K filed with the SEC on November 27, 2007 (Commission File Number: 001-33287), and incorporated herein by reference). |
||
23.1 |
* |
Consent of Independent Registered Public Accounting Firm. |
|
24.1 |
* |
Power of Attorney. |
|
31.1 |
* |
Certification of Chief Executive Officer Pursuant to SEC Rule 13a-14(a)/15d-14(a). |
|
31.2 |
* |
Certification of Chief Financial Officer Pursuant to SEC Rule 13a-14(a)/15d-14(a). |
|
32.1 |
* |
Certification of Chief Executive Officer Pursuant to 18 U.S.C. §1350. |
|
32.2 |
* |
Certification of Chief Financial Officer Pursuant to 18 U.S.C. §1350. |
|
- *
- Filed
herewith.
- **
- Indicates Item 15(a)(3) exhibit (management contract or compensation plan or arrangement).
Pursuant to the requirements of the Section 13 or 15(d) of the Securities Exchange Act of 1934, the Registrant has duly caused this report to be signed on its behalf by the undersigned, thereunto duly authorized, in the city of Stamford, in the State of Connecticut on March 8, 2010.
INFORMATION SERVICES GROUP, INC. |
||||
By: |
/s/ MICHAEL P. CONNORS |
|||
|
Michael P. Connors Chairman and Chief Executive Officer |
||||
Pursuant to the requirements of the Securities Exchange Act of 1934, this report has been signed below by the following persons on behalf and in the capacities and on the dates indicated.
Name
|
Position
|
Date
|
||||
|---|---|---|---|---|---|---|
| /s/ MICHAEL P. CONNORS Michael P. Connors |
Chairman and Chief Executive Officer (Principal Executive Officer) | March 8, 2010 | ||||
/s/ DAVID E. BERGER David E. Berger |
Executive Vice President, Chief Financial Officer (Principal Financial Officer and Principal Accounting Officer) |
March 8, 2010 |
||||
*ROBERT J. CHRENC Robert J. Chrenc |
Director |
March 8, 2010 |
||||
*GERALD S. HOBBS Gerald S. Hobbs |
Director |
March 8, 2010 |
||||
*KALPANA RAINA Kalpana Raina |
Director |
March 8, 2010 |
||||
*DONALD C. WAITE III Donald C. Waite III |
Director |
March 8, 2010 |
||||
*ROBERT E. WEISSMAN Robert E. Weissman |
Director |
March 8, 2010 |
||||
*By: |
/s/ MICHAEL P. CONNORS Michael P. Connors** |
|||||
- **
- By authority of the power of attorney filed as Exhibit 24.1 hereto
INFORMATION SERVICES GROUP, INC.
SCHEDULE II—VALUATION AND QUALIFYING ACCOUNTS
(in thousands)
Description
|
Balance at Beginning of Period |
Balance Assumed in Acquisitions |
Charges to Costs and Expenses |
Deductions | Balance at End of Period |
||||||||||||
|---|---|---|---|---|---|---|---|---|---|---|---|---|---|---|---|---|---|
Year ended December 31, 2009: |
|||||||||||||||||
Allowance for doubtful accounts |
$ | 132 | — | 510 | (436 | ) | $ | 206 | |||||||||
Allowance for tax valuation |
$ | — | — | 118 | — | $ | 118 | ||||||||||
Year ended December 31, 2008: |
|||||||||||||||||
Allowance for doubtful accounts |
$ | — | — | 275 | (143 | ) | $ | 132 | |||||||||
Allowance for tax valuation |
$ | 411 | — | — | (411 | ) | $ | — | |||||||||
Year ended December 31, 2007: |
|||||||||||||||||
Allowance for doubtful accounts |
$ | — | 613 | — | (613 | ) | $ | — | |||||||||
Allowance for tax valuation |
$ | — | 411 | — | — | $ | 411 | ||||||||||