Exhibit 13

|
|
|
|
|
|
|
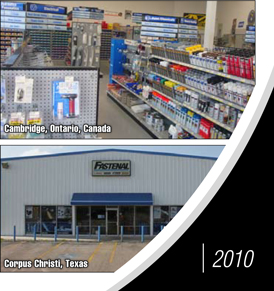
| Fastenal was founded in 1967. As of December 31, 2010, we operated 2,490 stores located primarily in North America with
additional locations in Asia, Europe, and Central America and employed 9,146 people at these sites. In addition, there were 4,139 people employed in various support positions. We sell different types of industrial and construction supplies in eleven
product categories: |
|
|
|
| CATEGORY |
|
NUMBER
OF
STOCK
ITEMS
|
|
|
| Fasteners |
|
|
456,000 |
|
|
| Tools |
|
|
147,000 |
|
|
| Cutting Tools |
|
|
276,000 |
|
|
| Hydraulics & Pneumatics |
|
|
86,000 |
|
|
| Material Handling |
|
|
19,000 |
|
|
| Janitorial |
|
|
17,000 |
|
|
| Electrical |
|
|
28,000 |
|
|
| Welding (excluding welding gases) |
|
|
39,000 |
|
|
| Safety |
|
|
37,000 |
|
|
| Metals |
|
|
13,000 |
|
|
| Office Supplies |
|
|
3,000 |
|
|
| TOTAL SUPPLIES SOLD |
|
|
1,121,000 |
|
|
| As of December 31, 2010, we operated eleven
distribution centers in the United States - Minnesota, Indiana, Ohio, Pennsylvania, Texas, Georgia, Washington, California, Utah, North Carolina and Kansas, and three outside the United States – Ontario, Canada; Alberta, Canada; and Nuevo Leon,
Mexico. During 2010, approximately 94% of our sales were attributable to products manufactured by others, and approximately 6% were related to items manufactured, modified, or repaired by either our manufacturing division or one of our support
services. Since December 31, 2010, we have opened additional stores. |
|
|
TABLE OF CONTENTS
|
|
|
|
|
|
|
|
|
| 1-4 |
|
8 |
| President’s Letter to Shareholders |
|
2010 Customer & Market Highlights |
|
|
| 5 |
|
9 |
| 10-Year Selected Financial Data & Financial |
|
Form 10-K |
| Highlights |
|
(Note: Page numbers in Form 10-K are not |
|
|
consecutive with the remainder of this |
| 6 |
|
Annual Report) |
| Stock and Financial Data |
|
|
|
|
Inside Back Cover Directors, Executive Officers & Corporate Information |
| 7 |
|
| Stock Performance Highlights |
|


“Our net earnings for
2010 were $265.4 million, versus $184.4 million in 2009, an increase of 43.9%.”
|
|
|

|
|
I started my 2009 president’s letter by explaining that, while we may not have produced great numbers, I believed we had done many things that positioned us for strong
results in the future. Our team has proven that in 2010. Although the year began with very low sales growth, we had good momentum. By May, our annual daily sales growth exceeded 20%, and our daily sales growth averaged 21.7% over the last eight
months of 2010 to end the year with $2.27 billion in total revenue, an increase of 17.6% over 2009. We are very focused on carrying this momentum into 2011. |
Our net earnings for 2010 were $265.4 million, versus $184.4 million in 2009, an increase of 43.9%. This improvement was made possible by a combination of sales growth, expense control, and margin
improvement. Our gross margin for 2010 was 51.8%, compared to 50.9% for 2009 – a solid gain but one I believe we can improve upon. This will be a high priority for our company in the year ahead.
Overall, our expenses grew just 8.5% (versus 17.6% sales growth), but that number doesn’t tell the complete story. Non-payroll related expenses were
down 1.8% from 2009, reflecting a lot of smart decision making across the company which allowed us to hit our goals while managing expenses. As you read through this letter, you’ll come across numerous examples of our people’s ability to
accomplish more with less. Although our payroll and related expenses grew 14.6%, more in line with our sales growth, this is directly related to the way our incentive pay is structured. We’ve worked hard to develop a program that pays well when
we perform well.
I’d like to share a little background about our employee incentives. Early in 2009, we spent a great deal of time
communicating with our employees about how tough the year would likely be, and what they should plan for from a pay and benefits standpoint. We expressed our commitment to minimize headcount reductions, and shared our belief that if we worked hard
and made good decisions, we had a realistic
opportunity to rebound in 2010 and recoup a good part of the bonus compensation lost due to the economic
slowdown. As I mentioned earlier, our incentive pay did recover in 2010. In fact, based on our sales growth, expense control, and earnings growth, the commission and bonus formulas calculated in 2010 produced record commissions and bonuses for most
areas of the company. Our calculation for the company’s 2010 401(k) profit-sharing contribution, which is based on achieving certain profitability goals, approached our record payout in 2008. I am proud that we were able to keep our promise to
all of the hard-working people who stuck with us in 2009 and made 2010 such a good year in so many ways.
As we returned to growth, we were
able to make good progress with our ‘pathway to profit’ strategic growth plan. Introduced in 2007, this plan calls for us to continue to add stores, but at a slower pace, and to use the savings to hire additional sales people in the
stores. Through this balanced approach, we originally projected that we could grow our average monthly store sales from $80,000 to $125,000 over a five-year period from 2007 to 2012, in turn increasing our pre-tax earnings one percentage point each
year, from 18 to 23% of sales, by 2012. A year ago, in the midst of the recession, it was estimated that an additional 24–30 months would be required to achieve our 23% pre-tax earnings goal, which would have extended the ‘pathway to
profit’ timeline from 2012 to almost 2015. However, after analyzing our performance over the past year, we now believe our 23% pre-tax earnings goal can be achieved with an average monthly store size of $100,000–$110,000, which we
anticipate will be achieved in 2013.
Because of the financial stress many companies were experiencing at the beginning of the year, I had
been concerned about higher bad debt risk and lengthened days sales outstanding. I am pleased to say that we actually saw lower days sales outstanding and write-offs, thanks in large part to the hard work of our accounts receivable team and their
increased utilization of electronic billing, which shortens the payment cycle.

“I believe that 2010 will go down as the year our Fastenal Automated Supply Technology (FAST)
program really gained traction and took off.”
It wasn’t the only area of our business that played out a little differently than I had expected. When
the year began, I predicted our inventory would grow very slowly throughout 2010. But as the year progressed, our inventory growth increased, and we ended the year with $557.4 million in inventory, an increase of 9.6% over the ending number in 2009.
Although our inventory grew at a slower rate than sales, I believe we will see greater improvement in inventory utilization in the coming year.
At the beginning of 2010, our focus was on positioning the company for renewed sales growth, and yet we knew it was important to be cautious with
expenses because of the uncertain economic picture. With this in mind, we sought to identify investment strategies that would produce the best growth at the lowest possible cost. This included developing a plan that would allow us to start out the
year opening stores at a lower rate and adjust the rate as the year progressed. Using this plan, we opened 45 stores in the first half of the year and 82 in the second half, an overall increase of 5.4% over 2009.
In an effort to drive growth faster with a smaller investment in personnel, we made a decision to hire fewer store-based sales people and instead add
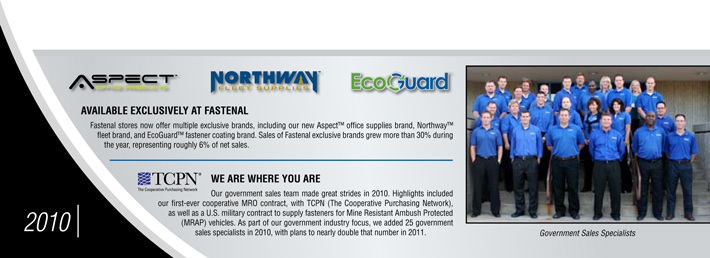
more sales specialists focused on specific opportunities. After reviewing many different growth and market opportunities, this investment was primarily focused in four basic areas: national accounts sales specialists, government sales specialists,
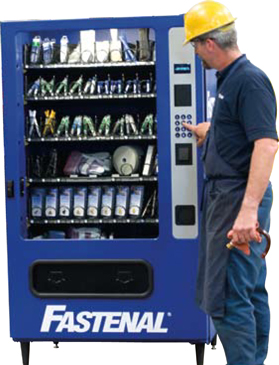
manufacturing sales specialists, and specialists to demonstrate and sell our Fastenal Automated Supply Technology (vending solutions - see photos below). In all, more than 150 sales specialists were added in these four areas during 2010, providing
our stores and customers with a new level of expert support in the field. Based on the early results, we’ve decided to increase our investment in sales specialists in all of these areas in 2011.
It was a strong year for our national accounts program, which focuses on providing value and solutions to large corporate customers. Sales through this
program grew at a rate faster than company-wide sales, and it seemed like every time I talked to one of our national accounts people during the year, they had just brought another
high-quality customer into the program, creating new local opportunities for our stores. In addition to adding new customers, this team continued to grow our partnerships with our largest
accounts and take our relationships with customers of all sizes to the next level. I’m not alone in my belief that this is the best national accounts group we’ve ever had, and I expect continued success with this important area of our
business moving forward.
As part of our initiative to grow our sales to federal, state, and local government entities, we created a new
position – vice president of government sales. His responsibility is to first learn and understand the various purchasing systems used at each level of government, and then formulate and implement a plan to grow this business. Our initial focus
has been on state and local government, and we’ve had some very good success. Much of the purchasing spend for these government entities is driven through purchasing cooperatives, which work with several states to leverage their buying power
and help smaller entities save money on needed supplies. Our team spent the year meeting with numerous state purchasing agencies and several cooperatives. They’ve won several contracts, and more are pending as this letter goes to print. We feel
very good about these opportunities because we continue to hear that, if given a choice, state and local governments would prefer to buy locally – and none of our competitors can match our local presence.
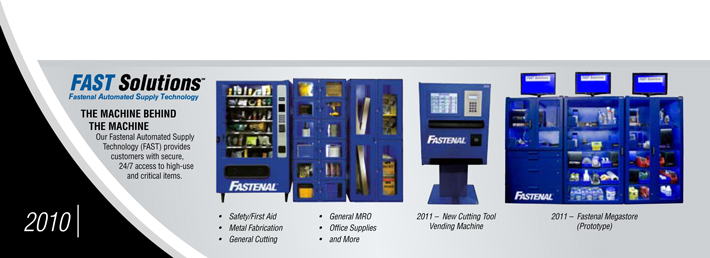
I believe 2010 will go down as the year our Fastenal Automated Supply Technology (FAST) program really gained traction and took off. Our flagship FAST
solution is the FAST 5000 industrial vending program. From the customer’s perspective, it’s like having a 24/7 Fastenal store within their facility, custom-stocked with needed items and continually replenished by local Fastenal personnel.
This solution provides many benefits for the customer – reduced inventory, automated ordering, improved productivity – but probably the biggest advantage is that it makes it easy to track usage and control wasteful consumption. The program
was designed to be extremely cost-effective for customers, in turn creating new opportunities for our stores; and in fact we’re now seeing exceptional growth at customer sites where FAST 5000 machines are placed. In my opinion, this will be a
big part of the future of industrial supply, and it will become an increasingly important part of our business in 2011 and beyond.

“We’re one of very few companies that can receive a web order from a customer and have it
ready
for local pick-up or delivery in a matter of minutes.”
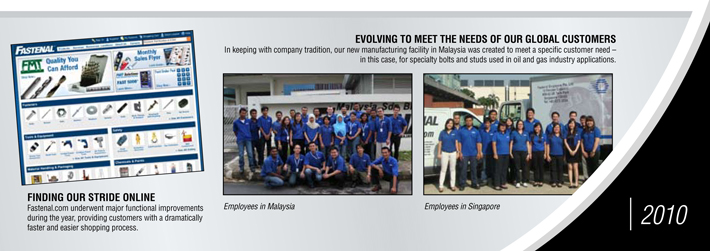
We continued to make progress with fastenal.com, which seems to improve every day. The web development team
has designed the site to be very user-friendly and fast, with an intuitive layout that makes it easy to drill down and find everything. I encourage you to go online and try it out for yourself; I think you’ll be impressed. Internally, we view
our web site not as a separate business but rather as another way for customers to place orders with their local Fastenal stores. We’re one of very few companies that can receive a web order from a customer and have it ready for local pick-up
or delivery in a matter of minutes. For the customer, this is like having the best of both worlds – the convenience of electronic ordering, along with a local sales representative who’s right there to help out if something goes wrong or
the order needs to be changed. I believe that as we introduce this service to more customers, we will continue to see a steady migration to fastenal.com.
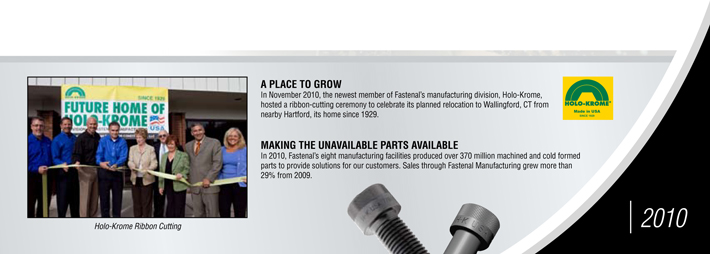
Our manufacturing division had a busy year. At the end of 2009, we completed the purchase of Holo-Krome from the Danaher Corporation. Located in West Hartford, Connecticut since 1929, Holo-Krome is a
leading producer of socket head products. This acquisition greatly increased our capacity to produce high-quality domestic fasteners, and the transition has gone very well. During the year, we purchased a new facility for Holo-Krome located in
Wallingford, Connecticut, within 20 miles of Hartford. The new building is 187,000 square feet and is set on a 51-acre lot, giving us plenty of room to grow our Holo-Krome business in the future.
Our entire manufacturing business now consists of eight locations totaling over 532,000 square feet and employing 468 people at year’s end. This
team grew their business by 29% in 2010, contributing $91 million in revenue for the year. Along the way, they produced more than 1,000 orders per week, many of them manufactured and shipped in less than 24 hours to meet the needs of our customers.
With the additional equipment we added in 2010, we can now produce fasteners from #0 to 4 inches in diameter, giving us even more opportunities to ‘make the unavailable part available.’
Another area that provided excellent growth was our international business. We are now located in nine
countries outside of the United States, and as a group our international locations saw their business grow by 35% over 2009, generating more than $200 million. We opened in two countries during 2010, Panama and the United Kingdom. We’re growing
nicely in all of the countries we’re located in, and profit growth is outpacing sales growth. To me, this is a good indication that our people know how to operate in these markets, and that future prospects are very promising. The people who
lead these businesses spent the year not only producing great results but also traveling to identify other countries that will support the Fastenal business model in the future. Based on their research, our plan is to open in more countries in 2011.
For the people in our distribution centers, 2010 was a year of fine tuning. We didn’t start any major projects or move any facilities,
but it was nonetheless a busy year of improvement and innovation. Much of the focus was on developing procedures that would allow our distribution personnel to provide error-free service, even earlier in the day. They found that by streamlining
processes they were able to provide better service at a lower cost. For the year, our distribution expense grew by only 3.7% while supporting sales growth of 17.6%.
Improving service while controlling expenses was also the theme of our transportation team. In 2009, we had to cut back on some routes and reduce service in some cases. This year we were able to
reintroduce some of this service, but the routing group worked hard to accomplish this while still reducing expenses. Because of the hard work of our transportation managers and our drivers, we had the lowest transportation costs as compared to
revenue in the company’s history.
Our purchasing and product development team spent much of the year working with suppliers to
streamline the flow of product. They have completed, and are now testing, a new information system that was designed to save thousands of hours during the receiving process. This system also provides much more accurate information regarding the
location of inbound product, allowing us to improve service

During 2010, FASTCO
sourced and purchased more than 5,060 containers of product, an increase of 81% over 2009.
to our stores and, in turn, our customers. Our FASTCO trading company, located in Shanghai, China,
continued to focus on identifying and building strong relationships with manufacturers throughout the world that are capable of producing high-quality product at a competitive price. During 2010, FASTCO sourced more than 5,060 containers of product,
an increase of 81% over 2009.
Some of the most important leaders in our company are our district sales managers. On average, district
managers manage twelve stores, although this number varies depending on experience and geography. An experienced district manager can manage up to 20 stores, and the larger districts generate revenue exceeding $3 million per month. In 2010, our
district managers continued to focus on improving their underperforming stores, using our internal benchmarking data to identify areas of opportunity in every store, then working with store personnel to make necessary changes. This group has done a
very good job of improving the overall performance of our stores, and it shows in the numbers we report.
Because of the wages lost during the
business slowdown in 2009, it was more important than ever to provide meaningful benefits at an affordable price to employees. During the year, our benefits team spent a great deal of time working with our health providers to control the cost we pay
for health care. Thanks to their efforts, we were able to make improvements to our already high-quality health package, while still keeping it affordable for our people to provide coverage for themselves and their families. This same team also led
the implementation of our new hiring system, which is designed to improve the process by better screening and qualifying potential candidates, while also automating the record keeping required by law. This change required a great deal of work up
front, but the early information we’re seeing with regards to employee retention looks very promising.
The Fastenal School of Business
(FSB) had a breakthrough year with our new online LearnCenter. In all, employees participated in more
than 45,000 FSB courses (nearly 40,000 online) during the year – up from 7,343 in 2008, the year prior to the LearnCenter’s launch. In 2011, we anticipate that employees will
participate in more than 60,000 FSB courses – through the LearnCenter, but also via WebEx and in traditional classroom and shop settings – as they work to improve their product knowledge and service skills.
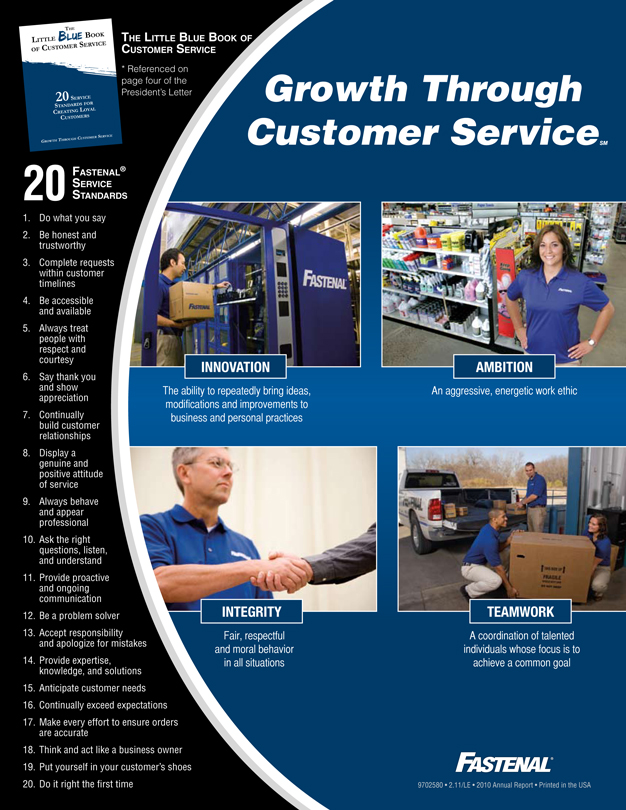
At FSB, they’re always striving to identify the most important things to teach to our employees. As part of this effort, they created a customer
research group in late 2009. This group interviewed nearly 20,000 customers over the past twelve months, gaining valuable insight into how our customers view our service, our strengths, as well as some areas where we need to improve. Based on this
research, the team worked with FSB to create a list of customer service standards. They took the initiative to turn this list into an easy-to-read book, a picture of which is featured on the back of this report, then they had it printed and
distributed a copy in the Christmas goody box we send to every employee. To me, this project exemplifies the Fastenal culture of entrepreneurship and problem solving.
I want to thank all of our employees for the great year we had in 2010. I also want to express to all of our stakeholders that I am fully committed to fostering an entrepreneurial culture that encourages
our employees to make good decisions that benefit themselves, our customers, and our shareholders – while creating greater opportunities for everyone involved. Here’s to another year of Growth Though Customer Service.
|

|
|
| Willard D. Oberton |
| President & CEO |

(Amounts in Thousands Except Per Share Information)
|
|
|
|
|
|
|
|
|
|
|
|
|
|
|
|
|
|
|
|
|
|
|
|
|
|
|
|
|
|
|
|
|
|
|
|
|
|
|
|
|
|
|
|
|
| Operating Results |
|
2010 |
|
|
Percent
Change |
|
|
2009 |
|
|
2008 |
|
|
2007 |
|
|
2006 |
|
|
2005 |
|
|
2004 |
|
|
2003 |
|
|
2002 |
|
|
2001 |
|
| Net sales |
|
$ |
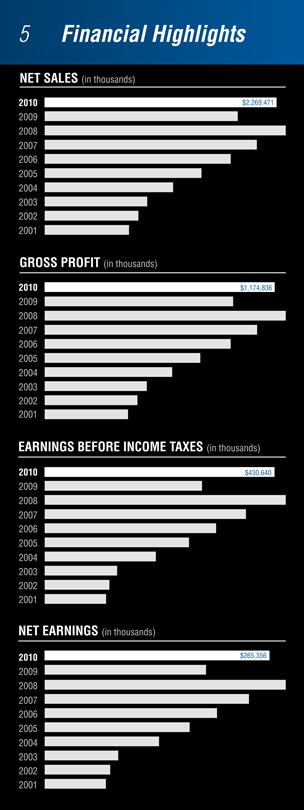
2,269,471 |
|
|
|
17.6 |
% |
|
$ |
1,930,330 |
|
|
$ |
2,340,425 |
|
|
$ |
2,061,819 |
|
|
$ |
1,809,337 |
|
|
$ |
1,523,333 |
|
|
$ |
1,238,492 |
|
|
$ |
994,928 |
|
|
$ |
905,438 |
|
|
$ |
818,283 |
|
| Gross profit |
|
$ |
1,174,836 |
|
|
|
19.5 |
% |
|
|
983,435 |
|
|
|
1,236,092 |
|
|
|
1,047,574 |
|
|
|
907,675 |
|
|
|
758,103 |
|
|
|
615,886 |
|
|
|
482,103 |
|
|
|
442,138 |
|
|
|
406,699 |
|
| Earnings before income taxes |
|
$ |
430,640 |
|
|
|
44.8 |
% |
|
|
297,490 |
|
|
|
451,167 |
|
|
|
377,899 |
|
|
|
321,029 |
|
|
|
269,056 |
|
|
|
208,336 |
|
|
|
136,336 |
|
|
|
121,207 |
1 |
|
|
113,634 |
|
| Net earnings |
|
$ |
265,356 |
|
|
|
43.9 |
% |
|
|
184,357 |
|
|
|
279,705 |
|
|
|
232,622 |
|
|
|
199,038 |
|
|
|
166,814 |
|
|
|
130,989 |
|
|
|
84,120 |
|
|
|
75,542 |
2 |
|
|
70,112 |
|
| Basic and diluted net earnings per share |
|
$ |
1.80 |
|
|
|
45.2 |
% |
|
|
1.24 |
|
|
|
1.88 |
|
|
|
1.55 |
|
|
|
1.32 |
|
|
|
1.10 |
|
|
|
0.86 |
|
|
|
0.56 |
|
|
|
0.50 |
2 |
|
|
0.46 |
|
| Dividends |
|
$ |
182,814 |
|
|
|
70.9 |
% |
|
|
106,943 |
|
|
|
117,474 |
|
|
|
66,216 |
|
|
|
60,548 |
|
|
|
46,935 |
|
|
|
30,350 |
|
|
|
15,935 |
|
|
|
3,794 |
|
|
|
3,414 |
|
| % of net earnings |
|
|
68.9 |
% |
|
|
|
|
|
|
58.0 |
% |
|
|
42.0 |
% |
|
|
28.5 |
% |
|
|
30.4 |
% |
|
|
28.1 |
% |
|
|
23.2 |
% |
|
|
18.9 |
% |
|
|
5.0 |
% |
|
|
4.9 |
% |
| Dividends per share |
|
$ |
1.24 |
|
|
|
72.2 |
% |
|
|
0.72 |
|
|
|
0.79 |
|
|
|
0.44 |
|
|
|
0.40 |
|
|
|
0.31 |
|
|
|
0.20 |
|
|
|
0.105 |
|
|
|
0.025 |
|
|
|
0.0225 |
|
| Value of shares repurchased |
|
|
— |
|
|
|
|
|
|
|
41,104 |
|
|
|
25,958 |
|
|
|
87,311 |
|
|
|
17,294 |
|
|
|
18,739 |
|
|
|
— |
|
|
|
— |
|
|
|
— |
|
|
|
— |
|
| % of earnings |
|
|
— |
|
|
|
|
|
|
|
22.3 |
% |
|
|
9.3 |
% |
|
|
37.5 |
% |
|
|
8.7 |
% |
|
|
11.2 |
% |
|
|
— |
|
|
|
— |
|
|
|
— |
|
|
|
— |
|
| Number of shares repurchased |
|
|
— |
|
|
|
|
|
|
|
1,100 |
|
|
|
590 |
|
|
|
2,086 |
|
|
|
474 |
|
|
|
700 |
|
|
|
— |
|
|
|
— |
|
|
|
— |
|
|
|
— |
|
| Basic-weighted average shares outstanding |
|
|
147,431 |
|
|
|
|
|
|
|
148,358 |
|
|
|
148,831 |
|
|
|
150,555 |
|
|
|
151,034 |
|
|
|
151,270 |
|
|
|
151,755 |
|
|
|
151,755 |
|
|
|
151,755 |
|
|
|
151,755 |
|
| Diluted-weighted average shares outstanding3 |
|
|
147,431 |
|
|
|
|
|
|
|
148,358 |
|
|
|
148,831 |
|
|
|
150,555 |
|
|
|
151,165 |
|
|
|
151,508 |
|
|
|
151,972 |
|
|
|
151,784 |
|
|
|
151,755 |
|
|
|
151,755 |
|
|
|
|
|
|
|
|
|
|
|
|
|
| Operating Results (as a
percentage of net sales) |
|
2010 |
|
|
|
|
|
2009 |
|
|
2008 |
|
|
2007 |
|
|
2006 |
|
|
2005 |
|
|
2004 |
|
|
2003 |
|
|
2002 |
|
|
2001 |
|
| Gross profit |
|
|
51.8 |
% |
|
|
|
|
|
|
50.9 |
% |
|
|
52.8 |
% |
|
|
50.8 |
% |
|
|
50.2 |
% |
|
|
49.8 |
% |
|
|
49.7 |
% |
|
|
48.5 |
% |
|
|
48.8 |
% |
|
|
49.7 |
% |
| Earnings before income taxes |
|
|
19.0 |
% |
|
|
|
|
|
|
15.4 |
% |
|
|
19.3 |
% |
|
|
18.3 |
% |
|
|
17.7 |
% |
|
|
17.7 |
% |
|
|
16.8 |
% |
|
|
13.7 |
% |
|
|
13.4 |
% |
|
|
13.9 |
% |
| Net earnings |
|
|
11.7 |
% |
|
|
|
|
|
|
9.6 |
% |
|
|
12.0 |
% |
|
|
11.3 |
% |
|
|
11.0 |
% |
|
|
11.0 |
% |
|
|
10.6 |
% |
|
|
8.5 |
% |
|
|
8.3 |
% |
|
|
8.6 |
% |
|
|
|
|
|
|
|
|
|
|
|
|
| Financial Position on
December 31 |
|
2010 |
|
|
Percent
Change |
|
|
2009 |
|
|
2008 |
|
|
2007 |
|
|
2006 |
|
|
2005 |
|
|
2004 |
|
|
2003 |
|
|
2002 |
|
|
2001 |
|
| Accounts receivable plus inventory |
|
$ |
827,502 |
|
|
|
14.5 |
% |
|
$ |
722,574 |
|
|
$ |
809,187 |
|
|
$ |
740,923 |
|
|
$ |
665,529 |
|
|
$ |
545,117 |
|
|
$ |
469,833 |
|
|
$ |
361,640 |
|
|
$ |
322,815 |
|
|
$ |
254,062 |
|
| Net working capital |
|
$ |
923,513 |
|
|
|
7.0 |
% |
|
|
862,855 |
|
|
|
827,410 |
|
|
|
742,980 |
|
|
|
663,880 |
|
|
|
557,470 |
|
|
|
466,883 |
|
|
|
393,255 |
|
|
|
349,422 |
|
|
|
300,680 |
|
| Total assets |
|
$ |
1,468,283 |
|
|
|
10.6 |
% |
|
|
1,327,358 |
|
|
|
1,304,149 |
|
|
|
1,163,061 |
|
|
|
1,039,016 |
|
|
|
890,035 |
|
|
|
775,362 |
|
|
|
652,875 |
|
|
|
563,384 |
|
|
|
475,244 |
|
| Total stockholders’ equity |
|
$ |
1,282,512 |
|
|
|
7.7 |
% |
|
|
1,190,843 |
|
|
|
1,142,259 |
|
|
|
1,010,161 |
|
|
|
992,093 |
|
|
|
783,549 |
|
|
|
684,369 |
|
|
|
576,740 |
|
|
|
499,871 |
|
|
|
424,888 |
|
All information contained in this
Annual Report reflects the 2-for-1 stock splits effected in the form of a stock dividend in each of 2002 and 2005.
| 1 |
Amount includes a gain on the sale of the Do-It-Yourself (DIY) Business of $5,934. |
| 2 |
Amount includes an extraordinary gain, net of tax, of $716. |
| 3 |
Reflects impact of stock options issued by the Company in April 2010, April 2009, April 2008, April 2007, and May 2003 that were in-the-money and
outstanding during the period. |


Common Stock Data
Our shares are traded on The NASDAQ Stock Market under the symbol ‘FAST’. The following table sets forth, by quarter, the high and low closing sale price of our shares on The NASDAQ Stock Market
for the last two years.
|
|
|
|
|
|
|
|
|
|
|
|
|
|
|
|
|
|
|
| 2010 |
|
High |
|
|
Low |
|
|
2009 |
|
High |
|
|
Low |
|
| First quarter |
|
$ |
49.00 |
|
|
$ |
41.21 |
|
|
First quarter |
|
$ |
37.53 |
|
|
$ |
26.16 |
|
| Second quarter |
|
|
56.48 |
|
|
|
48.33 |
|
|
Second quarter |
|
|
38.74 |
|
|
|
32.15 |
|
| Third quarter |
|
|
53.80 |
|
|
|
45.09 |
|
|
Third quarter |
|
|
40.13 |
|
|
|
30.56 |
|
| Fourth quarter |
|
|
60.11 |
|
|
|
51.22 |
|
|
Fourth quarter |
|
|
42.19 |
|
|
|
34.50 |
|
As of February 1, 2011, there
were approximately 1,400 record holders of our common stock which includes nominees or broker dealers holding stock on behalf of an estimated 80,000 beneficial owners.
In 2010, we paid semi-annual dividends of $0.40 and $0.42 per share, and we paid a special one-time dividend of $0.42 per share (total 2010 dividend equals $1.24 per share). In 2009, we paid semi-annual
dividends of $0.35 and $0.37 per share (total 2009 dividend equals $0.72 per share). On January 17, 2011, we announced a dividend of $0.50 per share to be paid on February 25, 2011 to shareholders of record at the close of business on
February 15, 2011. We expect that we will continue to pay comparable cash dividends in the foreseeable future, provided that any future determination as to payment of dividends will depend upon our financial condition and results of our
operations and such other factors as are deemed relevant by our board of directors.
Selected Quarterly Financial Data (Unaudited)
(Amounts in Thousands except Per Share Information)
|
|
|
|
|
|
|
|
|
|
|
|
|
|
|
|
|
|
|
|
|
| 2010 |
|
Net sales |
|
|
Gross
profit |
|
|
Pre-tax
earnings |
|
|
Net
earnings |
|
|
Basic net earnings
per share |
|
| First quarter |
|
$ |
520,772 |
|
|
|
265,913 |
|
|
|
90,669 |
|
|
|
56,034 |
|
|
|
.38 |
|
| Second quarter |
|
|
571,183 |
|
|
|
297,658 |
|
|
|
112,125 |
|
|
|
69,167 |
|
|
|
.47 |
|
| Third quarter |
|
|
603,750 |
|
|
|
312,648 |
|
|
|
120,702 |
|
|
|
74,994 |
|
|
|
.51 |
|
| Fourth quarter |
|
|
573,766 |
|
|
|
298,617 |
|
|
|
107,144 |
|
|
|
65,161 |
|
|
|
.44 |
|
|
|
|
|
|
|
|
|
|
|
|
|
|
|
|
|
|
|
|
|
|
| Total |
|
$ |
2,269,471 |
|
|
|
1,174,836 |
|
|
|
430,640 |
|
|
|
265,356 |
|
|
|
1.80 |
|
|
|
|
|
|
|
|
|
|
|
|
|
|
|
|
|
|
|
|
|
|
|
|
|
|
|
|
| 2009 |
|
Net sales |
|
|
Gross
profit |
|
|
Pre-tax
earnings |
|
|
Net
earnings |
|
|
Basic net earnings
per share |
|
| First quarter |
|
$ |
489,347 |
|
|
|
258,648 |
|
|
|
78,667 |
|
|
|
48,694 |
|
|
|
.33 |
|
| Second quarter |
|
|
474,894 |
|
|
|
242,505 |
|
|
|
70,402 |
|
|
|
43,538 |
|
|
|
.29 |
|
| Third quarter |
|
|
489,339 |
|
|
|
244,567 |
|
|
|
77,002 |
|
|
|
47,589 |
|
|
|
.32 |
|
| Fourth quarter |
|
|
476,750 |
|
|
|
237,715 |
|
|
|
71,419 |
|
|
|
44,536 |
|
|
|
.30 |
|
|
|
|
|
|
|
|
|
|
|
|
|
|
|
|
|
|
|
|
|
|
| Total |
|
$ |
1,930,330 |
|
|
|
983,435 |
|
|
|
297,490 |
|
|
|
184,357 |
|
|
|
1.24 |
|
|
|
|
|
|
|
|
|
|
|
|
|
|
|
|
|
|
|
|
|
|

|
|
|
| Initial Public Offering (IPO) |
|
|
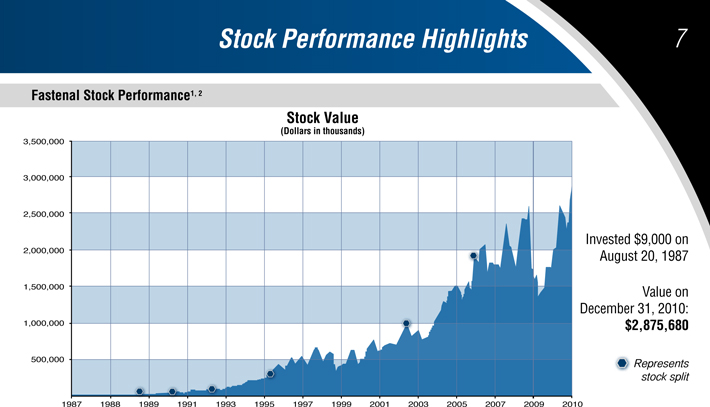
| On August 20, 1987 (date of our initial public offering),
1,000 shares of our stock sold for $9,000. Approximately 23 years later, on December 31, 2010, those 1,000 shares, having split six times, were 48,000 shares worth $2,875,680, for a gain of approximately 28.5% compounded annually. (In addition,
the holder of these shares would have received $207,264 in dividends since August 20, 1987.) |
|
| Ten Years |
|
| On December 31, 2000, 1,000 shares of our stock sold for
$54,880. Ten years later on December 31, 2010, those 1,000 shares, having split twice, were 4,000 shares worth $239,640, for a gain of approximately 15.9% compounded annually. (In addition, the holder of these shares would have received $17,010
in dividends since December 2000.) |
|
| Five Years |
|
| On December 31, 2005, 1,000 shares of our stock sold for
$39,130. Five years later, on December 31, 2010, those 1,000 shares, were worth $59,910 for a gain of approximately 8.9% compounded annually. (In addition, the holder of these shares would have received $7,180 in dividends since December
2005.) |
|
| Dividends and Stock Repurchases |
|
| We have paid dividends in
every year since 1991. |
|
| In July 2009, our board of directors authorized purchases by us of
up to 2,000,000 shares of our common stock. This authorization replaced any unused authorization previously granted by the board of directors. During 2009, we purchased 1,100,000 shares of our outstanding stock at an average price of approximately
$37.37 per share. These purchases occurred in the fourth quarter of 2009. We did not purchase any stock in 2010. As of February 9, 2011, we have remaining authority to purchase up to 900,000 additional shares of our common
stock. |
|
|
1 The share data featured represents past performance, which is no
guarantee of future results. |
|
| 2 The share data is presented in whole amounts versus thousands or millions as is
prevalent in the remainder of this document. |
|

|
|
|

|
|
“Previously, we simply had cases of batteries in closets, and they may disappear a case at a time. Now, there’s none
of that. Batteries are stocked in the machines, we don’t run out, and we only pay for what we use through Fastenal.”
- Tom Webber, Operations Manager, City of Sacramento Dept. of Transportation, Traffic Signs and Markings |
“[The FAST 5000] has freed up time for crib purchasing and allowed us to bring accountability and control to our high-volume
production MRO items. We’ve controlled our costs, and we know exactly where product is being used on a daily basis.”
- Mark Vascic, Purchasing and Maintenance Manager, Cooper Standard Automotive, Bowling Green
|
|
|
| “We’ve cut inventory by at least 75%, and we’ve seen a huge drop in consumption, because people are accountable for
what they’re using. ... from a reporting standpoint, [we are] able to clearly see that usage jibes with what it’s supposed to be. That’s huge for us.”
- Ricardo Lopez, VP of Operations, Lakeshore Technologies |
|
|
| “Fastenal offers a great VMI opportunity
through its vending machine service. The implementation process went quickly and without a hitch. The machines have performed very well. Anytime we have needed their assistance with service, they have been quick to respond. I would recommend the
Fastenal [FAST 5000] program to anyone needing a quality vending solution.” - Doug Johnson, Xcel Energy Category Manager, Sourcing |
|
| “This program has taken all the negatives of crib
transactions and made them non-existent. Heavy-use products are always available, always visible, and you can’t get them without proper coding, which allows you to track activity in a meaningful way.”
- Wayne Young, Purchasing Supervisor, Sulzer Pumps, Portland,
OR |
|
2010 IN THE NEWS…
Fastenal was named one of the ‘10 Most Trustworthy’ large-cap companies in America. The listing was based on an analysis by Audit Integrity designed to measure the true quality of
companies’ corporate accounting and management practices.
THE STREET
Fastenal was selected as one of ‘10 Cash-Rich Companies with No Debt. ’
CHIEF EXECUTIVE MAGAZINE
Fastenal was ranked as the 9th best ‘wealth
creator’ in the S&P index (up from #40 in 2009). The ranking is designed to identify companies that are creating true economic value.
BLOOMBERG BUSINESSWEEK
Fastenal CEO Will Oberton was found to be the 10th most underpaid public company chief executive officer, making just 15% of what would have been considered fair pay based on Bloomberg’s methodology.
TWIN CITIES BUSINESS MONTHLY
Fastenal founder Bob Kierlin was named one of ‘200 Minnesotans You Should Know’ – people who, according to the magazine, shape your world – whether you recognize it or not –
people who come up in casual discussions, who frame points of view, whose very names form points of reference.


DIRECTORS
|
|
|
|
|
| Robert A. Kierlin
Chairman of the Board Former Chief Executive Officer and President, Fastenal Company Former Minnesota State
Senator Stephen M. Slaggie
Former Secretary, Shareholder Relations
Director, and Insurance Risk Manager, Fastenal Company Michael M.
Gostomski Chief Executive
Officer, Winona Heating & Ventilating Company (sheet metal and roofing contractor) Willard D. Oberton |
|
Michael J. Dolan
Self-Employed Business Consultant Former Executive Vice President and Chief Operating Officer, The Smead Manufacturing Company (document management company)
Reyne K. Wisecup Hugh L. Miller Chief Executive Officer, RTP Company (thermoplastics materials manufacturer) Michael J. Ancius Director of Finance, Strategic Planning, and Taxation, Kwik Trip, Inc. (retail convenience store operator)
Scott A. Satterlee
Senior Vice President of Transportation, C.H. Robinson Worldwide, Inc. (logistics and distribution
company) |
|

Board of Directors (left to right):
(top) Hugh Miller, Michael Gostomski, Scott Satterlee and Michael Dolan (bottom) Michael Ancius, Will Oberton,
Bob Kierlin, Reyne Wisecup and Stephen Slaggie |
EXECUTIVE OFFICERS
|
|
|
|
|
| Willard D. Oberton
Chief Executive Officer and President
Daniel L. Florness
Executive Vice President and Chief Financial Officer
Nicholas J. Lundquist
Executive Vice President - Sales
Leland J. Hein
Executive Vice President - Sales
Steven A. Rucinski
Executive Vice President - Sales |
|
Reyne K. Wisecup
Executive Vice President - Human Resources
James C. Jansen
Executive Vice President - Operations
Michael S. Camp
Executive Vice President -
Product & Procurement Ashok Singh
Executive Vice President - Information Technology |
|

Will Oberton speaking at the Fastenal employee show |
CORPORATE INFORMATION
|
|
|
|
|
| Annual Meeting
The annual meeting of shareholders will be held at 10:00 a.m., central time, Tuesday, April 19, 2011, at our home offices located at 2001 Theurer
Boulevard, Winona, Minnesota Home Office
Fastenal Company 2001 Theurer Boulevard Winona, Minnesota 55987-0978
Phone: (507) 454-5374 Fax:
(507) 453-8049 Legal Counsel
Faegre & Benson LLP Minneapolis, Minnesota
Streater & Murphy, PA Winona,
Minnesota |
|
Transfer Agent
Wells Fargo Bank, National Association Minneapolis, Minnesota
Form 10-K A copy of our 2010 Annual Report on Form 10-K to the Securities and Exchange Commission is available without charge to shareholders upon written request to internal audit at the address listed on this
page for our home office. Copies of our latest press release, unaudited
supplemental company information, and monthly sales information are available at: http://investor.fastenal.com Independent Registered Public Accounting Firm KPMG LLP Minneapolis, Minnesota |
|
Winona, Minnesota Headquarters |