Attached files
| file | filename |
|---|---|
| 8-K - FORM 8-K - Primerica, Inc. | d8k.htm |
| EX-99.1 - PRESS RELEASE - Primerica, Inc. | dex991.htm |
EXHIBIT 99.2

Supplemental Financial Information
Fourth Quarter 2010
| Table of Contents | PRIMERICA, INC. | |
| Financial Supplement |
| Page | ||
| Preface, definition of Non-GAAP financial measures |
3 | |
| Balance sheets and reconciliation of balance sheet Non-GAAP to GAAP financial measures |
4 | |
| Financial results and other statistical data |
5 | |
| Statements of income |
6 | |
| Reconciliation of statement of income Non-GAAP to GAAP financial measures |
7 | |
| Segment operating results |
8 | |
| Term Life Insurance segment - financial results, key statistics, and financial analysis |
9-10 | |
| Investment and Savings Products segment - financial results, key statistics, and financial analysis |
11 | |
| Investment portfolio |
12-15 | |
| Five-year historical key statistics |
16 | |
This document may contain forward-looking statements and information. Additional information on factors that could cause results to differ materially from any forward-looking statements or information in this document is available in our Registration Statement on Form S-1, originally filed with the U.S. Securities and Exchange Commission (SEC) on November 5, 2009, as amended through March 31, 2010 and as updated in our Quarterly Report on Form 10-Q for the quarter ended September 30, 2010.
2 of 16
| Preface | PRIMERICA, INC. | |
| Financial Supplement |
FOURTH QUARTER 2010
This document is a financial supplement to our fourth quarter 2010 earnings release. It is designed to enable comprehensive analysis of our ongoing business using the same core metrics that our management utilizes in assessing our business and making strategic and operational decisions. Throughout this document we provide financial information that is derived from our U.S. GAAP financial statements and adjusted for two different purposes, as follows:
| • | Operating adjustments exclude the impact of realized investment gains and losses, the expense associated with equity awards granted in connection with our initial public offering (“IPO”), and other items believed by management not to be indicative of ongoing operations, including amounts related to agreements to recover ceded premium payments not previously passed through to our reinsurers. For periods ending on or before March 31, 2010, operating adjustments reflect the impact of our reinsurance and reorganization activities as if they had occurred at the beginning of the respective calendar year. |
| • | Adjusted when used in describing stockholders’ equity refers to the removal of the impact of net unrealized gains and losses on invested assets. |
Management utilizes certain non-GAAP financial measures in managing the business and believes they present relevant and meaningful analytical metrics for evaluating the ongoing business. Reconciliations of Non-GAAP to GAAP financial measures are included in this financial supplement.
During the quarter ended December 31, 2010, we accrued certain items that previously had been accounted for on a cash basis. These items contributed less than $0.8 million to net income in the quarter, or approximately $0.01 per diluted share, and also were insignificant to prior periods. The corrections reflect one-time adjustments that impact various line items and segments as follows:
| • | Term Life Insurance: increase in insurance expenses of $4.0 million primarily related to premium taxes; |
| • | Investment and Savings Products: increase in commissions and fees revenues of $11.6 million with a corresponding increase in sales commission expense of $6.8 million both primarily related to 12b-1 commissions; and |
| • | Corporate and Other Distributed Products: increase in commissions and fees revenues of $0.4 million. |
The impact of these corrections is reflected in both our actual and operating results. These corrections will not have an ongoing impact on earnings.
The following transactions were executed in conjunction with our IPO in March and April 2010 (the “IPO-related Transactions”) and are included in our actual and/or operating results as appropriate.
IPO-related Transactions executed in first quarter 2010:
| • | On March 31, 2010, we reinsured between 80% and 90% of our business that was in-force at year-end 2009 to various affiliates of Citigroup Inc. (“Citi”) and declared extraordinary dividends to Citi. |
IPO-related Transactions executed in second quarter 2010:
| • | On April 1, 2010, Citi contributed the legal entities comprising our business to us. We issued approximately 75.0 million shares of common stock and warrants exercisable for approximately 4.1 million additional shares of our common stock to Citi. Additionally, we issued a $300.0 million note to Citi, due March 31, 2015 and bearing interest at 5.5% annually. |
| • | On April 1, 2010, our common stock began trading under the ticker symbol “PRI” on the New York Stock Exchange. |
| • | On April 1, 2010, Citi sold approximately 24.6 million shares of our common stock (after giving effect to the over-allotment option) to the public in the IPO. |
| • | On April 1, 2010, Citi contributed approximately 5.0 million shares back to us, which we granted in the form of equity awards to certain of our management and sales force leaders. Of these, approximately 200,000 shares were granted to replace unvested Citi awards. |
| • | On April 15, 2010, Citi sold approximately 16.4 million shares and the warrants to purchase approximately 4.1 million additional shares of our common stock to private equity funds managed by Warburg Pincus LLC (“Warburg Pincus”) for a purchase price of $230.0 million (the “private sale”). Following the IPO and the private sale, certain historical Citi equity awards immediately vested. |
| • | Effective as of April 1, 2010, we made elections under Section 338(h)(10) of the Internal Revenue Code, which resulted in changes to our deferred tax balances and reduced stockholders’ equity. |
| • | Prior to April 8, 2010, our federal income tax return was consolidated into Citi’s federal income tax return. In anticipation of our corporate reorganization, we entered into a tax separation agreement with Citi and prepaid our estimated tax liability through March 31, 2010. In accordance with the tax separation agreement, Citi will indemnify the Company and its subsidiaries against any federal, state or local income tax liability for any taxable period ending on or before April 7, 2010, the closing date of the IPO. Our advance tax payments paid to Citi exceeded our actual tax liabilities. As a result, we recorded the overpayment as a return of capital resulting in a reduction of tax assets and a reduction of stockholders’ equity. |
Certain items throughout this supplement may not add due to rounding. Certain items throughout this supplement are noted as ‘na’ to indicate not applicable. Certain variances are noted as ‘nm’ to indicate not meaningful. Certain reclassifications have been made to prior-period amounts to conform to current-period reporting classifications. These reclassifications had no impact on net income or total stockholders’ equity.
3 of 16
| Quarterly Balance Sheets and Reconciliation of Balance Sheet Non-GAAP to GAAP Financial Measures | PRIMERICA, INC. | |
| Financial Supplement |
| (Dollars in thousands) |
Mar 31, 2009 |
Jun 30, 2009 |
Sep 30, 2009 |
Dec 31, 2009 |
(3) Mar 31, 2010 |
(4) Jun 30, 2010 |
Sep 30, 2010 |
(5) Dec 31, 2010 |
||||||||||||||||||||||||
| Balance Sheets |
||||||||||||||||||||||||||||||||
| Assets: |
||||||||||||||||||||||||||||||||
| Investments and cash |
$ | 5,848,854 | $ | 6,343,144 | $ | 6,863,473 | $ | 7,073,971 | $ | 2,983,780 | $ | 2,275,564 | $ | 2,284,127 | $ | 2,279,621 | ||||||||||||||||
| Due from reinsurers |
833,696 | 837,726 | 849,665 | 867,242 | 3,595,239 | 3,639,298 | 3,694,015 | 3,731,634 | ||||||||||||||||||||||||
| Deferred policy acquisition costs |
2,718,724 | 2,757,143 | 2,797,269 | 2,789,905 | 702,429 | 745,322 | 798,335 | 853,211 | ||||||||||||||||||||||||
| Income taxes |
— | — | — | — | 56,114 | — | — | — | ||||||||||||||||||||||||
| Other assets (1) |
781,179 | 842,699 | 921,167 | 890,685 | 523,584 | 554,950 | 610,518 | 569,314 | ||||||||||||||||||||||||
| Separate account assets |
1,536,367 | 1,766,928 | 2,033,119 | 2,093,342 | 2,222,267 | 2,098,936 | 2,301,896 | 2,446,786 | ||||||||||||||||||||||||
| Total assets |
$ | 11,718,820 | $ | 12,547,640 | $ | 13,464,693 | $ | 13,715,145 | $ | 10,083,413 | $ | 9,314,070 | $ | 9,688,891 | $ | 9,880,566 | ||||||||||||||||
| Liabilities: |
||||||||||||||||||||||||||||||||
| Future policy benefits |
$ | 4,038,781 | $ | 4,100,628 | $ | 4,161,925 | $ | 4,197,454 | $ | 4,248,277 | $ | 4,286,258 | $ | 4,349,375 | $ | 4,409,183 | ||||||||||||||||
| Other policy liabilities |
570,327 | 574,991 | 597,617 | 604,343 | 630,294 | 608,307 | 609,047 | 592,711 | ||||||||||||||||||||||||
| Income taxes |
647,037 | 740,985 | 873,367 | 890,617 | — | 129,776 | 127,732 | 126,260 | ||||||||||||||||||||||||
| Other liabilities |
318,360 | 342,052 | 349,028 | 475,514 | 1,106,834 | 412,141 | 395,762 | 386,181 | ||||||||||||||||||||||||
| Note payable |
— | — | — | — | — | 300,000 | 300,000 | 300,000 | ||||||||||||||||||||||||
| Payable under securities lending (1) |
372,084 | 436,381 | 518,331 | 510,101 | 129,042 | 161,056 | 208,765 | 181,726 | ||||||||||||||||||||||||
| Separate account liabilities |
1,536,367 | 1,766,928 | 2,033,119 | 2,093,342 | 2,222,267 | 2,098,936 | 2,301,896 | 2,446,786 | ||||||||||||||||||||||||
| Total liabilities |
7,482,956 | 7,961,965 | 8,533,387 | 8,771,372 | 8,336,714 | 7,996,474 | 8,292,577 | 8,442,847 | ||||||||||||||||||||||||
| Stockholders’ equity: |
||||||||||||||||||||||||||||||||
| Common stock (2) |
— | — | — | — | — | 727 | 727 | 728 | ||||||||||||||||||||||||
| Paid-in capital |
1,086,861 | 1,095,756 | 1,097,843 | 1,124,096 | 1,312,072 | 870,706 | 882,676 | 889,394 | ||||||||||||||||||||||||
| Retained earnings |
3,447,196 | 3,565,166 | 3,683,697 | 3,648,801 | 300,531 | 304,075 | 342,920 | 395,057 | ||||||||||||||||||||||||
| Treasury stock |
— | — | — | — | — | — | — | — | ||||||||||||||||||||||||
| Accumulated other comprehensive income (loss), net: |
||||||||||||||||||||||||||||||||
| Net unrealized investment gains (losses) not other-than-temporarily impaired |
(268,721 | ) | (67,583 | ) | 134,720 | 146,105 | 85,265 | 97,505 | 120,949 | 98,322 | ||||||||||||||||||||||
| Net unrealized investment losses other-than-temporarily impaired |
(17,174 | ) | (16,521 | ) | (17,966 | ) | (16,120 | ) | (4,245 | ) | (3,703 | ) | (2,883 | ) | (2,275 | ) | ||||||||||||||||
| Cumulative translation adjustment |
(12,298 | ) | 8,857 | 33,012 | 40,891 | 53,076 | 48,286 | 51,925 | 56,493 | |||||||||||||||||||||||
| Total stockholders’ equity |
4,235,864 | 4,585,675 | 4,931,306 | 4,943,773 | 1,746,699 | 1,317,596 | 1,396,314 | 1,437,719 | ||||||||||||||||||||||||
| Total liabilities and stockholders equity |
$ | 11,718,820 | $ | 12,547,640 | $ | 13,464,693 | $ | 13,715,145 | $ | 10,083,413 | $ | 9,314,070 | $ | 9,688,891 | $ | 9,880,566 | ||||||||||||||||
| Reconciliation of Adjusted Stockholders’ Equity to Total Stockholders’ Equity |
||||||||||||||||||||||||||||||||
| Adjusted stockholders’ equity |
$ | 4,521,759 | $ | 4,669,779 | $ | 4,814,552 | $ | 4,813,788 | $ | 1,665,679 | $ | 1,223,794 | $ | 1,278,248 | $ | 1,341,672 | ||||||||||||||||
| Reconciling items: |
||||||||||||||||||||||||||||||||
| Net unrealized investment gains (losses) not other-than-temporarily impaired |
(268,721 | ) | (67,583 | ) | 134,720 | 146,105 | 85,265 | 97,505 | 120,949 | 98,322 | ||||||||||||||||||||||
| Net unrealized investment losses other-than-temporarily impaired |
(17,174 | ) | (16,521 | ) | (17,966 | ) | (16,120 | ) | (4,245 | ) | (3,703 | ) | (2,883 | ) | (2,275 | ) | ||||||||||||||||
| Total reconciling items |
(285,895 | ) | (84,104 | ) | 116,754 | 129,985 | 81,020 | 93,802 | 118,066 | 96,047 | ||||||||||||||||||||||
| Total stockholders’ equity |
$ | 4,235,864 | $ | 4,585,675 | $ | 4,931,306 | $ | 4,943,773 | $ | 1,746,699 | $ | 1,317,596 | $ | 1,396,314 | $ | 1,437,719 | ||||||||||||||||
| Deferred Policy Acquisition Costs Rollforward |
||||||||||||||||||||||||||||||||
| Balance, beginning of period |
$ | 2,727,422 | $ | 2,718,724 | $ | 2,757,143 | $ | 2,797,269 | $ | 2,789,905 | $ | 702,429 | $ | 745,322 | $ | 798,335 | ||||||||||||||||
| General expenses deferred |
13,416 | 14,563 | 21,006 | 15,552 | 16,095 | 15,061 | 14,876 | 14,481 | ||||||||||||||||||||||||
| Commission costs deferred |
79,506 | 87,314 | 83,228 | 76,496 | 77,208 | 56,831 | 57,232 | 65,285 | ||||||||||||||||||||||||
| Amortization of deferred policy acquisition costs |
(94,814 | ) | (86,234 | ) | (88,736 | ) | (111,506 | ) | (91,756 | ) | (22,899 | ) | (23,844 | ) | (29,536 | ) | ||||||||||||||||
| Transferred to reinsurers |
— | — | — | — | (2,099,941 | ) | — | — | — | |||||||||||||||||||||||
| Foreign currency impact and other, net |
(6,806 | ) | 22,777 | 24,629 | 12,094 | 10,918 | (6,100 | ) | 4,750 | 4,646 | ||||||||||||||||||||||
| Balance, end of period |
$ | 2,718,724 | $ | 2,757,143 | $ | 2,797,269 | $ | 2,789,905 | $ | 702,429 | $ | 745,322 | $ | 798,335 | $ | 853,211 | ||||||||||||||||
| (1) | Payable under securities lending reflects cash collateral received in our securities lending program. Prior periods have been adjusted to conform to current period presentation. These adjustments increase other assets and establish the liability, payable under securities lending. These adjustments do not impact the income statement or stockholders’ equity. |
| (2) | Common stock reflects $.01 par value. Outstanding common shares exclude restricted stock units. |
| (3) | The balance sheet as of March 31, 2010 reflects the impact of the Citi reinsurance transactions executed on March 31, 2010. The Citi reinsurance transactions were given retroactive effect to January 1, 2010. As a result, the first quarter 2010 balance sheet includes a return of capital to Citi equally offsetting the income attributable to the underlying policies earned between January 1, 2010 and March 31, 2010. The first quarter 2010 balance sheet also reflects the extraordinary dividends declared on March 31, 2010. |
| (4) | The balance sheet as of June 30, 2010 reflects the issuance of the Citi note, reductions to stockholders’ equity and corresponding changes in deferred tax balances as a result of the 338(h)(10) elections, and a reduction in stockholders’ equity as a result of reflecting our overpayment of estimated taxes to Citi as a return of capital. |
| (5) | The balance sheet as of December 31, 2010 reflects the effects of the cash basis accounting corrections made in the fourth quarter of 2010. See the preface for additional information. |
4 of 16
| Financial Results and Other Statistical Data | PRIMERICA, INC. | |
| Financial Supplement |
| (Dollars in thousands, except per-share data) |
||||||||||||||||||||||||||||||||
| Q1 2009 |
Q2 2009 |
Q3 2009 |
Q4 2009 |
Q1 2010 |
Q2 2010 |
Q3 2010 |
Q4 2010 |
|||||||||||||||||||||||||
| Earnings per Share |
||||||||||||||||||||||||||||||||
| Basic earnings per share: |
||||||||||||||||||||||||||||||||
| Weighted average common shares and fully vested equity awards |
na | na | na | na | na | 71,843,588 | 72,259,352 | 72,453,126 | ||||||||||||||||||||||||
| Net income |
na | na | na | na | na | $ | 22,008 | $ | 39,595 | $ | 52,889 | |||||||||||||||||||||
| Less income attributable to unvested participating securities |
na | na | na | na | na | (928 | ) | (1,540 | ) | (2,051 | ) | |||||||||||||||||||||
| Net income used in computing basic EPS |
na | na | na | na | na | $ | 21,080 | $ | 38,055 | $ | 50,839 | |||||||||||||||||||||
| Basic earnings per share |
na | na | na | na | na | $ | 0.29 | $ | 0.53 | $ | 0.70 | |||||||||||||||||||||
| Net operating income |
na | na | na | na | na | $ | 37,199 | $ | 40,913 | $ | 45,217 | |||||||||||||||||||||
| Less operating income attributable to unvested participating securities |
na | na | na | na | na | (1,569 | ) | (1,591 | ) | (1,753 | ) | |||||||||||||||||||||
| Net operating income used in computing basic operating EPS |
na | na | na | na | na | $ | 35,631 | $ | 39,322 | $ | 43,464 | |||||||||||||||||||||
| Basic net operating income per share |
na | na | na | na | na | $ | 0.50 | $ | 0.54 | $ | 0.60 | |||||||||||||||||||||
| Diluted earnings per share: |
||||||||||||||||||||||||||||||||
| Weighted average common shares and fully vested equity awards |
na | na | na | na | na | 71,843,588 | 72,259,352 | 72,453,126 | ||||||||||||||||||||||||
| Diluted impact of warrants |
na | na | na | na | na | 890,777 | 660,066 | 786,628 | ||||||||||||||||||||||||
| Shares used to calculate diluted EPS |
na | na | na | na | na | 72,734,365 | 72,919,418 | 73,239,754 | ||||||||||||||||||||||||
| Net income |
na | na | na | na | na | $ | 22,008 | $ | 39,595 | $ | 52,889 | |||||||||||||||||||||
| Less income attributable to unvested participating securities |
na | na | na | na | na | (917 | ) | (1,527 | ) | (2,030 | ) | |||||||||||||||||||||
| Net income used in computing diluted EPS |
na | na | na | na | na | $ | 21,091 | $ | 38,068 | $ | 50,859 | |||||||||||||||||||||
| Diluted earnings per share |
na | na | na | na | na | $ | 0.29 | $ | 0.52 | $ | 0.69 | |||||||||||||||||||||
| Net operating income |
na | na | na | na | na | $ | 37,199 | $ | 40,913 | $ | 45,217 | |||||||||||||||||||||
| Less operating income attributable to unvested participating securities |
na | na | na | na | na | (1,550 | ) | (1,578 | ) | (1,735 | ) | |||||||||||||||||||||
| Net operating income used in computing diluted operating EPS |
na | na | na | na | na | $ | 35,649 | $ | 39,335 | $ | 43,482 | |||||||||||||||||||||
| Diluted net operating income per share |
na | na | na | na | na | $ | 0.49 | $ | 0.54 | $ | 0.59 | |||||||||||||||||||||
In April 2010, Primerica issued shares, warrants, and equity awards to complete the transactions related to our corporate reorganization. Both the vested and unvested equity awards maintain nonforfeitable dividend rights that result in dividend payment obligations on a one-to-one ratio with common shares for any future dividend declarations. These awards are deemed participating securities for calculating EPS.
As a result of issuing equity awards that are deemed participating securities, we calculate EPS using the two-class method. Under the two-class method, we allocate earnings to common shares and to fully vested equity awards. Earnings attributable to unvested equity awards, along with the corresponding share counts, are excluded from EPS reflected on our consolidated statements of income. In calculating basic EPS, we deduct any dividends on and undistributed earnings allocated to unvested equity awards from net income and then divide the result by the weighted average number of common shares and fully vested equity awards outstanding for the period.
We determine the potential dilutive effect of warrants on EPS using the treasury-stock method. Under this method, we utilize the exercise price to determine the amount of cash that would be available to repurchase shares if the warrants were exercised. We then use the average market price of our common shares during the reporting period to determine how many shares we could repurchase with the cash raised from the exercise. The net incremental share count issued represents the potential dilutive securities. We then reallocate earnings to common shares and fully vested equity awards incorporating the increased, fully diluted share count to determine diluted EPS.
| Q1 2009 |
Q2 2009 |
Q3 2009 |
Q4 2009 |
Q1 2010 |
Q2 2010 |
Q3 2010 |
Q4 2010 |
|||||||||||||||||||||||||
| Annualized Return on Equity |
||||||||||||||||||||||||||||||||
| Average stockholders’ equity |
na | na | na | na | na | $ | 1,296,220 | $ | 1,356,955 | $ | 1,417,017 | |||||||||||||||||||||
| Average adjusted stockholders’ equity |
na | na | na | na | na | $ | 1,208,809 | $ | 1,251,021 | $ | 1,309,960 | |||||||||||||||||||||
| Net income return on stockholders’ equity |
na | na | na | na | na | 6.8 | % | 11.7 | % | 14.9 | % | |||||||||||||||||||||
| Net income return on adjusted stockholders’ equity |
na | na | na | na | na | 7.3 | % | 12.7 | % | 16.1 | % | |||||||||||||||||||||
| Net operating income return on adjusted stockholders’ equity |
na | na | na | na | na | 12.3 | % | 13.1 | % | 13.8 | % | |||||||||||||||||||||
| Capital Structure |
||||||||||||||||||||||||||||||||
| Debt-to-capital (1) |
na | na | na | na | na | 18.5 | % | 17.7 | % | 17.3 | % | |||||||||||||||||||||
| Cash and invested assets to stockholders’ equity |
na | na | na | na | na | 1.7 | 1.6 | 1.6 | ||||||||||||||||||||||||
| Cash and invested assets to adjusted stockholders’ equity |
na | na | na | na | na | 1.9 | 1.8 | 1.7 | ||||||||||||||||||||||||
| Share count, end of period (2) |
na | na | na | na | na | 72,729,617 | 72,727,173 | 72,843,213 | ||||||||||||||||||||||||
| Adjusted stockholders’ equity per share |
na | na | na | na | na | $ | 16.83 | $ | 17.58 | $ | 18.42 | |||||||||||||||||||||
| Financial Strength Ratings |
||||||||||||||||||||||||||||||||
| Primerica Life Insurance Company: |
||||||||||||||||||||||||||||||||
| S&P |
AA | AA | AA | AA | AA | AA- | AA- | AA- | ||||||||||||||||||||||||
| A.M. Best |
A+ | A+ | A+ | A+ | A+ | A+ | A+ | A+ | ||||||||||||||||||||||||
| Fitch |
A+ | A+ | A+ | A+ | A+ | A+ | A+ | A+ | ||||||||||||||||||||||||
| (1) | Capital in the debt-to-capital ratio includes stockholders’ equity and the note payable. |
| (2) | Share count reflects outstanding common shares, including restricted shares, but excludes restricted stock units (RSUs). The RSUs will deliver common shares in the future as the restrictions lift. |
5 of 16
| Statements of Income | PRIMERICA, INC. | |
| Financial Supplement |
| (Dollars in thousands) |
Q1 2009 |
Q2 2009 |
Q3 2009 |
Q4 2009 |
Q1 2010 |
(4) Q2 2010 |
(4) Q3 2010 |
(4)(5) Q4 2010 |
||||||||||||||||||||||||
| Statement of Income |
||||||||||||||||||||||||||||||||
| Revenues: |
||||||||||||||||||||||||||||||||
| Direct premiums |
$ | 516,647 | $ | 529,004 | $ | 531,713 | $ | 535,417 | $ | 537,845 | $ | 547,455 | $ | 547,444 | $ | 548,330 | ||||||||||||||||
| Ceded premiums |
(137,609 | ) | (158,401 | ) | (154,725 | ) | (160,019 | ) | (148,119 | ) | (447,213 | ) | (437,054 | ) | (417,981 | ) | ||||||||||||||||
| Net premiums |
379,038 | 370,603 | 376,987 | 375,399 | 389,726 | 100,242 | 110,390 | 130,349 | ||||||||||||||||||||||||
| Net investment income |
82,385 | 89,755 | 88,736 | 90,450 | 82,576 | 27,991 | 27,855 | 26,688 | ||||||||||||||||||||||||
| Commissions and fees: |
||||||||||||||||||||||||||||||||
| Sales-based (1) |
28,203 | 29,451 | 28,672 | 32,472 | 36,363 | 36,301 | 32,941 | 37,001 | ||||||||||||||||||||||||
| Asset-based (2) |
27,555 | 29,718 | 33,344 | 36,964 | 38,014 | 39,445 | 37,602 | 52,412 | ||||||||||||||||||||||||
| Account-based (3) |
11,089 | 10,784 | 10,717 | 10,657 | 10,208 | 10,317 | 10,620 | 10,545 | ||||||||||||||||||||||||
| Other commissions and fees |
12,870 | 12,737 | 11,546 | 9,208 | 7,105 | 7,162 | 8,574 | 8,331 | ||||||||||||||||||||||||
| Realized investment (losses) gains |
(11,259 | ) | (9,003 | ) | (11,212 | ) | 9,503 | 31,057 | 374 | 1,015 | 1,700 | |||||||||||||||||||||
| Other, net |
12,955 | 13,542 | 12,586 | 13,948 | 11,893 | 12,466 | 12,239 | 12,362 | ||||||||||||||||||||||||
| Total revenues |
542,837 | 547,587 | 551,376 | 578,602 | 606,942 | 234,299 | 241,236 | 279,387 | ||||||||||||||||||||||||
| Benefits and expenses: |
||||||||||||||||||||||||||||||||
| Benefits and claims |
145,749 | 151,444 | 154,631 | 148,448 | 170,735 | 45,124 | 49,811 | 52,033 | ||||||||||||||||||||||||
| Amortization of DAC |
94,814 | 86,234 | 88,736 | 111,506 | 91,756 | 22,899 | 23,844 | 29,536 | ||||||||||||||||||||||||
| Insurance commissions |
14,620 | 6,396 | 6,384 | 6,988 | 6,371 | 4,233 | 5,100 | 4,204 | ||||||||||||||||||||||||
| Insurance expenses |
40,088 | 36,203 | 39,480 | 32,989 | 37,529 | 10,083 | 11,999 | 15,887 | ||||||||||||||||||||||||
| Sales commissions: |
||||||||||||||||||||||||||||||||
| Sales-based (1) |
21,106 | 21,555 | 20,780 | 23,470 | 26,203 | 25,998 | 23,474 | 25,319 | ||||||||||||||||||||||||
| Asset-based (2) |
9,430 | 9,533 | 10,883 | 12,157 | 12,715 | 12,911 | 12,232 | 20,271 | ||||||||||||||||||||||||
| Other sales commissions |
9,653 | 9,301 | 8,513 | 6,374 | 4,963 | 4,603 | 6,558 | 4,676 | ||||||||||||||||||||||||
| Interest expense |
— | — | — | — | — | 6,928 | 6,968 | 6,976 | ||||||||||||||||||||||||
| Other operating expenses |
32,601 | 28,587 | 34,092 | 37,698 | 36,268 | 65,183 | 39,371 | 39,962 | ||||||||||||||||||||||||
| Total benefits and expenses |
368,062 | 349,253 | 363,502 | 379,630 | 386,541 | 197,961 | 179,357 | 198,864 | ||||||||||||||||||||||||
| Income before income taxes |
174,775 | 198,334 | 187,875 | 198,972 | 220,402 | 36,338 | 61,879 | 80,523 | ||||||||||||||||||||||||
| Income taxes |
62,218 | 66,214 | 64,044 | 72,890 | 77,116 | 14,330 | 22,284 | 27,634 | ||||||||||||||||||||||||
| Net income |
$ | 112,557 | $ | 132,120 | $ | 123,831 | $ | 126,082 | $ | 143,286 | $ | 22,008 | $ | 39,595 | $ | 52,889 | ||||||||||||||||
| Income Before Income Taxes by Segment |
||||||||||||||||||||||||||||||||
| Term Life |
$ | 162,150 | $ | 171,865 | $ | 168,605 | $ | 156,391 | $ | 160,367 | $ | 44,095 | $ | 42,581 | $ | 52,000 | ||||||||||||||||
| Investment & Savings Products |
20,371 | 20,717 | 26,221 | 26,096 | 25,447 | 26,735 | 26,578 | 34,769 | ||||||||||||||||||||||||
| Corporate & Other Distributed Products |
(7,746 | ) | 5,751 | (6,951 | ) | 16,485 | 34,587 | (34,492 | ) | (7,280 | ) | (6,246 | ) | |||||||||||||||||||
| Income before income taxes |
$ | 174,775 | $ | 198,334 | $ | 187,875 | $ | 198,972 | $ | 220,402 | $ | 36,338 | $ | 61,879 | $ | 80,523 | ||||||||||||||||
| (1) | Sales-based - revenues or commission expenses relating to the sales of mutual funds and variable annuities |
| (2) | Asset-based - revenues or commission expenses relating to the value of assets in client accounts for which we earn ongoing service, distribution, and other fees |
| (3) | Account-based - revenues relating to the fee generating client accounts we administer |
| (4) | Reflects the full effect of the reinsurance and reorganization transactions we executed in connection with and subsequent to our IPO. As such, ceded premiums, net investment income, benefits and claims, amortization of DAC, insurance expenses, interest expense, and other operating expenses reflect the impact of the various Citi reinsurance agreements, dividends, the note payable to Citi, and the equity grants made in connection with our IPO. |
| (5) | Reflects the effects of the cash basis accounting corrections made in the fourth quarter of 2010. See the preface for additional information. |
6 of 16
| Reconciliation of Statement of Income Non-GAAP to GAAP Financial Measures | PRIMERICA, INC. | |
| Financial Supplement |
| YOY Q4 | YOY YTD | |||||||||||||||||||||||||||||||||||||||||||||||||||||||
| (Dollars in thousands) |
Q1 2009 |
Q2 2009 |
Q3 2009 |
Q4 2009 |
Q1 2010 |
Q2 2010 |
Q3 2010 |
Q4 2010 |
$ Change |
% Change |
YTD 2009 |
YTD 2010 |
$ Change |
% Change |
||||||||||||||||||||||||||||||||||||||||||
| Reconciliation from Operating Revenues to Total Revenues |
||||||||||||||||||||||||||||||||||||||||||||||||||||||||
| Operating revenues |
$ | 211,734 | $ | 226,783 | $ | 236,734 | $ | 250,103 | $ | 224,822 | $ | 233,925 | $ | 240,221 | $ | 264,546 | $ | 14,442 | 5.8 | % | $ | 925,355 | $ | 963,513 | $ | 38,158 | 4.1 | % | ||||||||||||||||||||||||||||
| Operating revenues reconciling items: |
||||||||||||||||||||||||||||||||||||||||||||||||||||||||
| Realized investment gains/losses |
(11,259 | ) | (9,003 | ) | (11,212 | ) | 9,503 | 31,057 | 374 | 1,015 | 1,700 | nm | nm | (21,970 | ) | 34,146 | nm | nm | ||||||||||||||||||||||||||||||||||||||
| Ceded premiums - reinsurance recoveries |
— | — | — | — | — | — | — | 13,141 | nm | nm | — | 13,141 | nm | nm | ||||||||||||||||||||||||||||||||||||||||||
| Ceded premiums - ceded to Citi reinsurers |
287,755 | 270,259 | 266,990 | 259,032 | 296,328 | — | — | nm | nm | 1,084,036 | 296,328 | nm | nm | |||||||||||||||||||||||||||||||||||||||||||
| Pro rata net investment income - assets transferred to Citi reinsurers |
54,607 | 59,547 | 58,864 | 59,963 | 54,735 | — | — | — | nm | nm | 232,980 | 54,735 | nm | nm | ||||||||||||||||||||||||||||||||||||||||||
| Other income adjustment to Term Life Insurance segment (1) |
— | (1,379 | ) | 1,379 | — | — | — | — | — | nm | nm | — | — | nm | nm | |||||||||||||||||||||||||||||||||||||||||
| Other income adjustment to Corporate & Other segment (1) |
— | 1,379 | (1,379 | ) | — | — | — | — | — | nm | nm | — | — | nm | nm | |||||||||||||||||||||||||||||||||||||||||
| Total operating revenues reconciling items |
331,103 | 320,803 | 314,642 | 328,498 | 382,121 | 374 | 1,015 | 14,841 | nm | nm | 1,295,046 | 398,351 | nm | nm | ||||||||||||||||||||||||||||||||||||||||||
| Total revenues |
$ | 542,837 | $ | 547,587 | $ | 551,376 | $ | 578,602 | $ | 606,942 | $ | 234,299 | $ | 241,236 | $ | 279,387 | $ | (299,215 | ) | -51.7 | % | $ | 2,220,402 | $ | 1,361,864 | $ | (858,537 | ) | -38.7 | % | ||||||||||||||||||||||||||
| Reconciliation from Operating Income Before Income Taxes to Income Before Income Taxes |
||||||||||||||||||||||||||||||||||||||||||||||||||||||||
| Operating income before income taxes |
$ | 45,179 | $ | 68,219 | $ | 62,579 | $ | 67,293 | $ | 58,689 | $ | 61,421 | $ | 63,940 | $ | 68,843 | $ | 1,549 | 2.3 | % | $ | 243,271 | $ | 252,892 | $ | 9,621 | 4.0 | % | ||||||||||||||||||||||||||||
| Operating income before income taxes reconciling items: |
||||||||||||||||||||||||||||||||||||||||||||||||||||||||
| Realized investment gains/losses |
(11,259 | ) | (9,003 | ) | (11,212 | ) | 9,503 | 31,057 | 374 | 1,015 | 1,700 | nm | nm | (21,970 | ) | 34,146 | nm | nm | ||||||||||||||||||||||||||||||||||||||
| Ceded premiums - reinsurance recoveries |
— | — | — | — | — | — | — | 13,141 | nm | nm | — | 13,141 | nm | nm | ||||||||||||||||||||||||||||||||||||||||||
| Initial & accelerated management / field grant expense |
— | — | — | — | — | (25,457 | ) | (3,076 | ) | (3,161 | ) | nm | nm | — | (31,694 | ) | nm | nm | ||||||||||||||||||||||||||||||||||||||
| Ceded premiums - ceded to Citi reinsurers |
287,755 | 270,259 | 266,990 | 259,032 | 296,328 | — | — | — | nm | nm | 1,084,036 | 296,328 | nm | nm | ||||||||||||||||||||||||||||||||||||||||||
| Pro rata net investment income - assets transferred to Citi reinsurers |
54,607 | 59,547 | 58,864 | 59,963 | 54,735 | — | — | — | nm | nm | 232,980 | 54,735 | nm | nm | ||||||||||||||||||||||||||||||||||||||||||
| Benefits and claims - ceded to Citi reinsurers |
(109,112 | ) | (108,383 | ) | (107,166 | ) | (99,325 | ) | (128,204 | ) | — | — | — | nm | nm | (423,986 | ) | (128,204 | ) | nm | nm | |||||||||||||||||||||||||||||||||||
| Amortization of DAC - ceded to Citi reinsurers |
(73,073 | ) | (63,860 | ) | (63,631 | ) | (79,167 | ) | (71,389 | ) | — | — | — | nm | nm | (279,731 | ) | (71,389 | ) | nm | nm | |||||||||||||||||||||||||||||||||||
| Insurance commissions - expense allowance received from Citi reinsurers |
(1,180 | ) | (1,409 | ) | (1,450 | ) | (1,484 | ) | (1,669 | ) | — | — | — | nm | nm | (5,523 | ) | (1,669 | ) | nm | nm | |||||||||||||||||||||||||||||||||||
| Insurance expenses - expense allowance received from Citi reinsurers |
(24,864 | ) | (23,862 | ) | (23,756 | ) | (24,133 | ) | (26,083 | ) | — | — | — | nm | nm | (96,615 | ) | (26,083 | ) | nm | nm | |||||||||||||||||||||||||||||||||||
| Interest expense - finance charge payable to Citi reinsurer |
2,597 | 2,700 | 2,532 | 3,164 | 2,812 | — | — | — | nm | nm | 10,993 | 2,812 | nm | nm | ||||||||||||||||||||||||||||||||||||||||||
| Interest expense - note payable |
4,125 | 4,125 | 4,125 | 4,125 | 4,125 | — | — | — | nm | nm | 16,500 | 4,125 | nm | nm | ||||||||||||||||||||||||||||||||||||||||||
| Other income adjustment to Term Life Insurance segment (1) |
— | (1,379 | ) | 1,379 | — | — | — | — | — | nm | nm | — | — | nm | nm | |||||||||||||||||||||||||||||||||||||||||
| Other income adjustment to Corporate & Other segment (1) |
— | 1,379 | (1,379 | ) | — | — | — | — | — | nm | nm | — | — | nm | nm | |||||||||||||||||||||||||||||||||||||||||
| Insurance expense adjustment to Term Life Insurance segment (1) |
(36 | ) | 722 | (1,816 | ) | 3,204 | — | — | — | — | nm | nm | 2,074 | — | nm | nm | ||||||||||||||||||||||||||||||||||||||||
| Other operating expense adjustment to Investment & Savings segment (1) |
— | — | 1,791 | — | — | — | — | — | nm | nm | 1,791 | — | nm | nm | ||||||||||||||||||||||||||||||||||||||||||
| Other operating expense adjustment to Corporate & Other segment (1) |
— | — | — | (2,635 | ) | — | — | — | — | nm | nm | (2,635 | ) | — | nm | nm | ||||||||||||||||||||||||||||||||||||||||
| Insurance commission adjustment to Term Life Insurance segment (1) |
(394 | ) | (317 | ) | 50 | (1,850 | ) | — | — | — | — | nm | nm | (2,511 | ) | — | nm | nm | ||||||||||||||||||||||||||||||||||||||
| Insurance commission adjustment to Corporate & Other segment (1) |
430 | (405 | ) | (25 | ) | 1,281 | — | — | — | — | nm | nm | 1,281 | — | nm | nm | ||||||||||||||||||||||||||||||||||||||||
| Total operating income before income taxes reconciling items |
129,596 | 130,115 | 125,296 | 131,678 | 161,713 | (25,083 | ) | (2,061 | ) | 11,680 | nm | nm | 516,685 | 146,250 | nm | nm | ||||||||||||||||||||||||||||||||||||||||
| Income before income taxes |
$ | 174,775 | $ | 198,334 | $ | 187,875 | $ | 198,972 | $ | 220,402 | $ | 36,338 | $ | 61,879 | $ | 80,523 | $ | (118,449 | ) | -59.5 | % | $ | 759,955 | $ | 399,142 | $ | (360,814 | ) | -47.5 | % | ||||||||||||||||||||||||||
| Reconciliation from Net Operating Income to Net Income |
||||||||||||||||||||||||||||||||||||||||||||||||||||||||
| Net operating income |
$ | 29,096 | $ | 45,444 | $ | 41,247 | $ | 42,641 | $ | 38,154 | $ | 37,199 | $ | 40,914 | $ | 45,217 | $ | 2,576 | 6.0 | % | $ | 158,428 | $ | 161,484 | $ | 3,056 | 1.9 | % | ||||||||||||||||||||||||||||
| Net operating income reconciling items: |
||||||||||||||||||||||||||||||||||||||||||||||||||||||||
| Operating income before income taxes reconciling items |
129,596 | 130,115 | 125,296 | 131,678 | 161,713 | (25,083 | ) | (2,061 | ) | 11,680 | nm | nm | 516,685 | 146,250 | nm | nm | ||||||||||||||||||||||||||||||||||||||||
| Tax impact of operating income reconciling items at effective tax rate |
(46,135 | ) | (43,439 | ) | (42,711 | ) | (48,238 | ) | (56,582 | ) | 9,891 | 742 | (4,008 | ) | nm | nm | (180,523 | ) | (49,956 | ) | nm | nm | ||||||||||||||||||||||||||||||||||
| Total net operating income reconciling items |
83,461 | 86,676 | 82,584 | 83,440 | 105,131 | (15,191 | ) | (1,319 | ) | 7,672 | nm | nm | 336,161 | 96,293 | nm | nm | ||||||||||||||||||||||||||||||||||||||||
| Net income |
$ | 112,557 | $ | 132,120 | $ | 123,831 | $ | 126,082 | $ | 143,286 | $ | 22,008 | $ | 39,595 | $ | 52,889 | $ | (73,193 | ) | -58.1 | % | $ | 494,590 | $ | 257,778 | $ | (236,812 | ) | -47.9 | % | ||||||||||||||||||||||||||
| (1) | Certain reclassifications have been made to 2009 amounts to conform to current-period reporting classifications. These reclassifications had no impact on net income or stockholders’ equity. |
7 of 16
| Segment Operating Results | PRIMERICA, INC. | |
| Financial Supplement |
| (2) | YOY Q4 | YOY YTD | ||||||||||||||||||||||||||||||||||||||||||||||||||||||
| (Dollars in thousands) |
Q1 2009 |
Q2 2009 |
Q3 2009 |
Q4 2009 |
Q1 2010 |
Q2 2010 |
Q3 2010 |
Q4 2010 |
$ Change |
% Change |
YTD 2009 |
YTD 2010 |
$ Change |
% Change |
||||||||||||||||||||||||||||||||||||||||||
| Term Life Insurance (1) |
||||||||||||||||||||||||||||||||||||||||||||||||||||||||
| Revenues: |
||||||||||||||||||||||||||||||||||||||||||||||||||||||||
| Direct premiums |
$ | 496,683 | $ | 507,376 | $ | 510,695 | $ | 516,234 | $ | 517,932 | $ | 527,792 | $ | 525,644 | $ | 529,341 | $ | 13,107 | 2.5 | % | $ | 2,030,988 | $ | 2,100,708 | $ | 69,720 | 3.4 | % | ||||||||||||||||||||||||||||
| Ceded premiums |
(422,006 | ) | (425,341 | ) | (418,216 | ) | (415,263 | ) | (440,699 | ) | (444,008 | ) | (433,234 | ) | (427,571 | ) | (12,308 | ) | -3.0 | % | (1,680,827 | ) | (1,745,512 | ) | (64,685 | ) | -3.8 | % | ||||||||||||||||||||||||||||
| Net premiums |
74,677 | 82,035 | 92,479 | 100,970 | 77,233 | 83,784 | 92,410 | 101,770 | 799 | nm | 350,161 | 355,196 | 5,036 | 1.4 | % | |||||||||||||||||||||||||||||||||||||||||
| Allocated net investment income |
17,678 | 18,282 | 16,673 | 15,669 | 16,497 | 15,961 | 15,595 | 14,242 | (1,427 | ) | -9.1 | % | 68,303 | 62,294 | (6,009 | ) | -8.8 | % | ||||||||||||||||||||||||||||||||||||||
| Other, net |
8,615 | 8,990 | 7,560 | 8,490 | 8,782 | 8,643 | 7,929 | 7,914 | (576 | ) | -6.8 | % | 33,656 | 33,268 | (387 | ) | -1.2 | % | ||||||||||||||||||||||||||||||||||||||
| Operating revenues |
100,970 | 109,307 | 116,712 | 125,130 | 102,511 | 108,388 | 115,933 | 123,926 | (1,204 | ) | nm | 452,119 | 450,759 | (1,361 | ) | nm | ||||||||||||||||||||||||||||||||||||||||
| Benefits and expenses: |
||||||||||||||||||||||||||||||||||||||||||||||||||||||||
| Benefits and claims |
26,614 | 31,437 | 37,032 | 39,968 | 32,905 | 35,134 | 39,084 | 42,325 | 2,357 | 5.9 | % | 135,052 | 149,448 | 14,396 | 10.7 | % | ||||||||||||||||||||||||||||||||||||||||
| Amortization of DAC |
19,439 | 20,506 | 23,003 | 28,984 | 17,418 | 19,128 | 21,900 | 26,477 | (2,507 | ) | -8.7 | % | 91,933 | 84,924 | (7,008 | ) | -7.6 | % | ||||||||||||||||||||||||||||||||||||||
| Insurance commissions |
8,482 | 343 | 386 | 370 | 456 | 404 | 330 | 320 | (50 | ) | -13.5 | % | 9,580 | 1,510 | (8,071 | ) | -84.2 | % | ||||||||||||||||||||||||||||||||||||||
| Insurance expenses |
11,603 | 9,570 | 10,316 | 8,708 | 8,687 | 6,824 | 9,194 | 13,095 | 4,387 | 50.4 | % | 40,197 | 37,800 | (2,397 | ) | -6.0 | % | |||||||||||||||||||||||||||||||||||||||
| Interest expense |
2,597 | 2,700 | 2,532 | 3,164 | 2,812 | 2,803 | 2,843 | 2,851 | (313 | ) | -9.9 | % | 10,993 | 11,309 | 316 | 2.9 | % | |||||||||||||||||||||||||||||||||||||||
| Operating benefits and expenses |
68,735 | 64,555 | 73,270 | 81,194 | 62,278 | 64,294 | 73,352 | 85,067 | 3,874 | 4.8 | % | 287,755 | 284,991 | (2,764 | ) | nm | ||||||||||||||||||||||||||||||||||||||||
| Operating income before income taxes |
$ | 32,235 | $ | 44,751 | $ | 43,442 | $ | 43,936 | $ | 40,234 | $ | 44,095 | $ | 42,581 | $ | 38,859 | $ | (5,077 | ) | -11.6 | % | $ | 164,365 | $ | 165,768 | $ | 1,404 | nm | ||||||||||||||||||||||||||||
| Investment & Savings Products (1) |
||||||||||||||||||||||||||||||||||||||||||||||||||||||||
| Revenues: |
||||||||||||||||||||||||||||||||||||||||||||||||||||||||
| Commissions and fees: |
||||||||||||||||||||||||||||||||||||||||||||||||||||||||
| Sales-based |
$ | 28,203 | $ | 29,451 | $ | 28,672 | $ | 32,472 | $ | 36,363 | $ | 36,301 | $ | 32,941 | $ | 37,001 | $ | 4,529 | 13.9 | % | $ | 118,798 | $ | 142,605 | $ | 23,807 | 20.0 | % | ||||||||||||||||||||||||||||
| Asset-based |
27,555 | 29,718 | 33,344 | 36,964 | 38,014 | 39,445 | 37,602 | 52,412 | 15,448 | 41.8 | % | 127,581 | 167,473 | 39,892 | 31.3 | % | ||||||||||||||||||||||||||||||||||||||||
| Account-based |
11,089 | 10,784 | 10,717 | 10,657 | 10,208 | 10,317 | 10,620 | 10,545 | (112 | ) | -1.1 | % | 43,247 | 41,690 | (1,557 | ) | -3.6 | % | ||||||||||||||||||||||||||||||||||||||
| Other, net |
2,437 | 2,536 | 2,682 | 2,858 | 2,108 | 2,155 | 2,711 | 3,064 | 206 | 7.2 | % | 10,514 | 10,038 | (475 | ) | -4.5 | % | |||||||||||||||||||||||||||||||||||||||
| Operating revenues |
69,285 | 72,488 | 75,415 | 82,952 | 86,693 | 88,218 | 83,874 | 103,021 | 20,070 | 24.2 | % | 300,140 | 361,806 | 61,666 | 20.5 | % | ||||||||||||||||||||||||||||||||||||||||
| Benefits and expenses: |
||||||||||||||||||||||||||||||||||||||||||||||||||||||||
| Amortization of DAC |
1,936 | 1,508 | 1,304 | 2,506 | 2,549 | 3,029 | 1,361 | 2,392 | (114 | ) | -4.5 | % | 7,253 | 9,330 | 2,077 | 28.6 | % | |||||||||||||||||||||||||||||||||||||||
| Insurance commissions |
1,737 | 1,482 | 1,766 | 1,845 | 1,809 | 1,989 | 1,964 | 2,091 | 246 | 13.3 | % | 6,830 | 7,852 | 1,022 | 15.0 | % | ||||||||||||||||||||||||||||||||||||||||
| Sales commissions: |
||||||||||||||||||||||||||||||||||||||||||||||||||||||||
| Sales-based |
21,106 | 21,555 | 20,780 | 23,470 | 26,203 | 25,998 | 23,474 | 25,319 | 1,849 | 7.9 | % | 86,912 | 100,994 | 14,082 | 16.2 | % | ||||||||||||||||||||||||||||||||||||||||
| Asset-based |
9,430 | 9,533 | 10,883 | 12,157 | 12,715 | 12,911 | 12,232 | 20,271 | 8,114 | 66.7 | % | 42,003 | 58,129 | 16,126 | 38.4 | % | ||||||||||||||||||||||||||||||||||||||||
| Other operating expenses |
14,705 | 17,693 | 16,252 | 16,878 | 17,970 | 17,556 | 18,266 | 18,179 | 1,301 | 7.7 | % | 65,527 | 71,972 | 6,445 | 9.8 | % | ||||||||||||||||||||||||||||||||||||||||
| Operating benefits and expenses |
48,914 | 51,771 | 50,985 | 56,856 | 61,246 | 61,483 | 57,296 | 68,253 | 11,397 | 20.0 | % | 208,526 | 248,278 | 39,751 | 19.1 | % | ||||||||||||||||||||||||||||||||||||||||
| Operating income before income taxes |
$ | 20,371 | $ | 20,717 | $ | 24,430 | $ | 26,096 | $ | 25,447 | $ | 26,735 | $ | 26,578 | $ | 34,769 | $ | 8,673 | 33.2 | % | $ | 91,614 | $ | 113,529 | $ | 21,915 | 23.9 | % | ||||||||||||||||||||||||||||
| Corporate & Other Distributed Products (1) |
||||||||||||||||||||||||||||||||||||||||||||||||||||||||
| Revenues: |
||||||||||||||||||||||||||||||||||||||||||||||||||||||||
| Direct premiums |
$ | 19,964 | $ | 21,628 | $ | 21,018 | $ | 19,184 | $ | 19,913 | $ | 19,663 | $ | 21,800 | $ | 18,989 | $ | (194 | ) | -1.0 | % | $ | 81,793 | $ | 80,366 | $ | (1,428 | ) | -1.7 | % | ||||||||||||||||||||||||||
| Ceded premiums |
(3,357 | ) | (3,319 | ) | (3,499 | ) | (3,787 | ) | (3,748 | ) | (3,206 | ) | (3,820 | ) | (3,551 | ) | 236 | 6.2 | % | (13,963 | ) | (14,325 | ) | (362 | ) | -2.6 | % | |||||||||||||||||||||||||||||
| Net premiums |
16,606 | 18,309 | 17,518 | 15,396 | 16,165 | 16,458 | 17,980 | 15,438 | 42 | nm | 67,830 | 66,041 | (1,790 | ) | -2.6 | % | ||||||||||||||||||||||||||||||||||||||||
| Allocated net investment income |
10,100 | 11,926 | 13,199 | 14,818 | 11,344 | 12,030 | 12,260 | 12,446 | (2,372 | ) | -16.0 | % | 50,043 | 48,080 | (1,963 | ) | -3.9 | % | ||||||||||||||||||||||||||||||||||||||
| Commissions and fees: |
||||||||||||||||||||||||||||||||||||||||||||||||||||||||
| Loans |
8,832 | 8,685 | 7,401 | 4,738 | 2,455 | 1,918 | 3,527 | 2,427 | (2,311 | ) | -48.8 | % | 29,656 | 10,327 | (19,329 | ) | -65.2 | % | ||||||||||||||||||||||||||||||||||||||
| DebtWatchers |
— | 1 | 120 | 386 | 620 | 779 | 845 | 1,035 | 649 | nm | 507 | 3,279 | 2,772 | nm | ||||||||||||||||||||||||||||||||||||||||||
| Prepaid Legal Services |
2,438 | 2,338 | 2,323 | 2,316 | 2,340 | 2,305 | 2,287 | 2,689 | 373 | 16.1 | % | 9,414 | 9,622 | 207 | 2.2 | % | ||||||||||||||||||||||||||||||||||||||||
| Auto and Homeowners Insurance |
844 | 994 | 994 | 1,104 | 1,012 | 1,372 | 1,200 | 1,395 | 291 | 26.4 | % | 3,936 | 4,979 | 1,043 | 26.5 | % | ||||||||||||||||||||||||||||||||||||||||
| Long-Term Care Insurance |
755 | 719 | 709 | 664 | 679 | 788 | 715 | 784 | 120 | 18.1 | % | 2,847 | 2,966 | 118 | 4.2 | % | ||||||||||||||||||||||||||||||||||||||||
| Other, net |
1,903 | 2,016 | 2,343 | 2,600 | 1,004 | 1,668 | 1,600 | 1,383 | (1,217 | ) | -46.8 | % | 8,862 | 5,654 | (3,208 | ) | -36.2 | % | ||||||||||||||||||||||||||||||||||||||
| Operating revenues |
41,479 | 44,988 | 44,607 | 42,022 | 35,618 | 37,318 | 40,414 | 37,598 | (4,424 | ) | -10.5 | % | 173,096 | 150,947 | (22,149 | ) | -12.8 | % | ||||||||||||||||||||||||||||||||||||||
| Benefits and expenses: |
||||||||||||||||||||||||||||||||||||||||||||||||||||||||
| Benefits and claims |
10,023 | 11,625 | 10,433 | 9,155 | 9,626 | 9,991 | 10,727 | 9,708 | 553 | 6.0 | % | 41,236 | 40,052 | (1,184 | ) | -2.9 | % | |||||||||||||||||||||||||||||||||||||||
| Amortization of DAC |
366 | 360 | 798 | 849 | 400 | 742 | 583 | 667 | (182 | ) | -21.4 | % | 2,374 | 2,393 | 18 | nm | ||||||||||||||||||||||||||||||||||||||||
| Insurance commissions |
3,257 | 2,440 | 2,807 | 2,720 | 2,438 | 1,838 | 2,804 | 1,793 | (927 | ) | -34.1 | % | 11,224 | 8,873 | (2,351 | ) | -20.9 | % | ||||||||||||||||||||||||||||||||||||||
| Insurance expenses |
3,585 | 3,493 | 3,592 | 3,352 | 2,759 | 3,259 | 2,804 | 2,792 | (560 | ) | -16.7 | % | 14,022 | 11,615 | (2,407 | ) | -17.2 | % | ||||||||||||||||||||||||||||||||||||||
| Sales commissions |
9,653 | 9,301 | 8,513 | 6,374 | 4,963 | 4,603 | 6,560 | 4,676 | (1,698 | ) | -26.6 | % | 33,841 | 20,801 | (13,040 | ) | -38.5 | % | ||||||||||||||||||||||||||||||||||||||
| Interest expense |
4,125 | 4,125 | 4,125 | 4,125 | 4,125 | 4,125 | 4,125 | 4,125 | — | nm | 16,500 | 16,500 | — | nm | ||||||||||||||||||||||||||||||||||||||||||
| Other operating expenses |
17,896 | 10,894 | 19,631 | 18,185 | 18,298 | 22,170 | 18,030 | 18,622 | 437 | 2.4 | % | 66,607 | 77,119 | 10,513 | 15.8 | % | ||||||||||||||||||||||||||||||||||||||||
| Operating benefits and expenses |
48,906 | 42,238 | 49,900 | 44,760 | 42,609 | 46,727 | 45,633 | 42,383 | (2,377 | ) | -5.3 | % | 185,804 | 177,353 | (8,450 | ) | -4.5 | % | ||||||||||||||||||||||||||||||||||||||
| Operating income before income taxes |
$ | (7,426 | ) | $ | 2,750 | $ | (5,293 | ) | $ | (2,739 | ) | $ | (6,992 | ) | $ | (9,410 | ) | $ | (5,219 | ) | $ | (4,786 | ) | $ | (2,047 | ) | -74.7 | % | $ | (12,708 | ) | $ | (26,406 | ) | $ | (13,699 | ) | -107.8 | % | |||||||||||||||||
| (1) | Certain reclassifications have been made to 2009 amounts to conform to current-period reporting classifications. These reclassifications had no impact on net income or stockholders’ equity. |
| (2) | Reflects the effects of the cash basis accounting corrections made in the fourth quarter of 2010. See the preface for additional information. |
8 of 16
| Term Life Insurance - Financial Results | PRIMERICA, INC. | |
| Financial Supplement |
| (4) Q4 2010 |
YOY Q4 | YOY YTD | ||||||||||||||||||||||||||||||||||||||||||||||||||||||
| (Dollars in thousands) |
Q1 2009 |
Q2 2009 |
Q3 2009 |
Q4 2009 |
Q1 2010 |
Q2 2010 |
Q3 2010 |
$ Change |
% Change |
YTD 2009 |
YTD 2010 |
$ Change |
% Change |
|||||||||||||||||||||||||||||||||||||||||||
| Term Life Insurance Operating Income Before Income Taxes (1) |
||||||||||||||||||||||||||||||||||||||||||||||||||||||||
| Revenues: |
||||||||||||||||||||||||||||||||||||||||||||||||||||||||
| Direct premiums |
$ | 496,683 | $ | 507,376 | $ | 510,695 | $ | 516,234 | $ | 517,932 | $ | 527,792 | $ | 525,644 | $ | 529,341 | $ | 13,107 | 2.5 | % | $ | 2,030,988 | $ | 2,100,708 | $ | 69,720 | 3.4 | % | ||||||||||||||||||||||||||||
| Ceded premiums |
(422,006 | ) | (425,341 | ) | (418,216 | ) | (415,263 | ) | (440,699 | ) | (444,008 | ) | (433,234 | ) | (427,571 | ) | (12,308 | ) | -3.0 | % | (1,680,827 | ) | (1,745,512 | ) | (64,685 | ) | -3.8 | % | ||||||||||||||||||||||||||||
| Net premiums |
74,677 | 82,035 | 92,479 | 100,970 | 77,233 | 83,784 | 92,410 | 101,770 | 799 | nm | 350,161 | 355,196 | 5,036 | 1.4 | % | |||||||||||||||||||||||||||||||||||||||||
| Allocated net investment income |
17,678 | 18,282 | 16,673 | 15,669 | 16,497 | 15,961 | 15,595 | 14,242 | (1,427 | ) | -9.1 | % | 68,303 | 62,294 | (6,009 | ) | -8.8 | % | ||||||||||||||||||||||||||||||||||||||
| Other, net |
8,615 | 8,990 | 7,560 | 8,490 | 8,782 | 8,643 | 7,929 | 7,914 | (576 | ) | -6.8 | % | 33,656 | 33,268 | (387 | ) | -1.2 | % | ||||||||||||||||||||||||||||||||||||||
| Operating revenues |
100,970 | 109,307 | 116,712 | 125,130 | 102,511 | 108,388 | 115,933 | 123,926 | (1,204 | ) | nm | 452,119 | 450,759 | (1,361 | ) | nm | ||||||||||||||||||||||||||||||||||||||||
| Benefits and expenses: |
||||||||||||||||||||||||||||||||||||||||||||||||||||||||
| Benefits and claims |
26,614 | 31,437 | 37,032 | 39,968 | 32,905 | 35,134 | 39,084 | 42,325 | 2,357 | 5.9 | % | 135,052 | 149,448 | 14,396 | 10.7 | % | ||||||||||||||||||||||||||||||||||||||||
| Amortization of DAC |
19,439 | 20,506 | 23,003 | 28,984 | 17,418 | 19,128 | 21,900 | 26,477 | (2,507 | ) | -8.7 | % | 91,933 | 84,924 | (7,008 | ) | -7.6 | % | ||||||||||||||||||||||||||||||||||||||
| Insurance commissions |
8,482 | 343 | 386 | 370 | 456 | 404 | 330 | 320 | (50 | ) | -13.5 | % | 9,580 | 1,510 | (8,071 | ) | -84.2 | % | ||||||||||||||||||||||||||||||||||||||
| Insurance expenses |
11,603 | 9,570 | 10,316 | 8,708 | 8,687 | 6,824 | 9,194 | 13,095 | 4,387 | 50.4 | % | 40,197 | 37,800 | (2,397 | ) | -6.0 | % | |||||||||||||||||||||||||||||||||||||||
| Interest expense |
2,597 | 2,700 | 2,532 | 3,164 | 2,812 | 2,803 | 2,843 | 2,851 | (313 | ) | -9.9 | % | 10,993 | 11,309 | 316 | 2.9 | % | |||||||||||||||||||||||||||||||||||||||
| Operating benefits and expenses |
68,735 | 64,555 | 73,270 | 81,194 | 62,278 | 64,294 | 73,352 | 85,067 | 3,874 | 4.8 | % | 287,755 | 284,991 | (2,764 | ) | nm | ||||||||||||||||||||||||||||||||||||||||
| Operating income before income taxes |
$ | 32,235 | $ | 44,751 | $ | 43,442 | $ | 43,936 | $ | 40,234 | $ | 44,095 | $ | 42,581 | $ | 38,859 | $ | (5,077 | ) | -11.6 | % | $ | 164,365 | $ | 165,768 | $ | 1,404 | nm | ||||||||||||||||||||||||||||
| New Term Life Insurance Operating Income Before Income Taxes (2) |
||||||||||||||||||||||||||||||||||||||||||||||||||||||||
| Revenues: |
||||||||||||||||||||||||||||||||||||||||||||||||||||||||
| Direct premiums |
na | na | na | na | $ | 10,138 | $ | 21,256 | $ | 30,149 | $ | 38,197 | na | na | na | $ | 99,740 | na | na | |||||||||||||||||||||||||||||||||||||
| Ceded premiums |
na | na | na | na | (3,737 | ) | (3,869 | ) | (3,351 | ) | (4,029 | ) | na | na | na | (14,985 | ) | na | na | |||||||||||||||||||||||||||||||||||||
| Net premiums |
na | na | na | na | 6,401 | 17,388 | 26,799 | 34,168 | na | na | na | 84,755 | na | na | ||||||||||||||||||||||||||||||||||||||||||
| Allocated net investment income |
na | na | na | na | 109 | 175 | 318 | 478 | na | na | na | 1,080 | na | na | ||||||||||||||||||||||||||||||||||||||||||
| Other, net |
na | na | na | na | 8,802 | 8,675 | 8,100 | 7,890 | na | na | na | 33,467 | na | na | ||||||||||||||||||||||||||||||||||||||||||
| Operating revenues |
na | na | na | na | 15,312 | 26,238 | 35,216 | 42,537 | na | na | na | 119,302 | na | na | ||||||||||||||||||||||||||||||||||||||||||
| Benefits and expenses: |
||||||||||||||||||||||||||||||||||||||||||||||||||||||||
| Benefits and claims |
na | na | na | na | 1,517 | 5,413 | 10,343 | 13,550 | na | na | na | 30,824 | na | na | ||||||||||||||||||||||||||||||||||||||||||
| Amortization of DAC |
na | na | na | na | 968 | 6,405 | 7,725 | 11,667 | na | na | na | 26,765 | na | na | ||||||||||||||||||||||||||||||||||||||||||
| Insurance commissions |
na | na | na | na | — | 0 | (1 | ) | (0 | ) | na | na | na | (1 | ) | na | na | |||||||||||||||||||||||||||||||||||||||
| Insurance expenses |
na | na | na | na | 18,180 | 16,050 | 18,224 | 19,128 | na | na | na | 71,581 | na | na | ||||||||||||||||||||||||||||||||||||||||||
| Interest expense |
na | na | na | na | — | (0 | ) | — | — | na | na | na | (0 | ) | na | na | ||||||||||||||||||||||||||||||||||||||||
| Operating benefits and expenses |
na | na | na | na | 20,665 | 27,869 | 36,291 | 44,344 | na | na | na | 129,169 | na | na | ||||||||||||||||||||||||||||||||||||||||||
| Operating income before income taxes |
na | na | na | na | $ | (5,354 | ) | $ | (1,631 | ) | $ | (1,075 | ) | $ | (1,807 | ) | na | na | na | $ | (9,867 | ) | na | na | ||||||||||||||||||||||||||||||||
| Legacy Term Life Insurance Operating Income Before Income Taxes (3) |
||||||||||||||||||||||||||||||||||||||||||||||||||||||||
| Revenues: |
||||||||||||||||||||||||||||||||||||||||||||||||||||||||
| Direct premiums |
na | na | na | na | $ | 507,794 | $ | 506,536 | $ | 495,494 | $ | 491,144 | na | na | na | $ | 2,000,968 | na | na | |||||||||||||||||||||||||||||||||||||
| Ceded premiums |
na | na | na | na | (436,962 | ) | (440,140 | ) | (429,883 | ) | (423,542 | ) | na | na | na | (1,730,527 | ) | na | na | |||||||||||||||||||||||||||||||||||||
| Net premiums |
na | na | na | na | 70,832 | 66,396 | 65,611 | 67,602 | na | na | na | 270,441 | na | na | ||||||||||||||||||||||||||||||||||||||||||
| Allocated net investment income |
na | na | na | na | 16,388 | 15,786 | 15,277 | 13,763 | na | na | na | 61,214 | na | na | ||||||||||||||||||||||||||||||||||||||||||
| Other, net |
na | na | na | na | (20 | ) | (32 | ) | (170 | ) | 24 | na | na | na | (199 | ) | na | na | ||||||||||||||||||||||||||||||||||||||
| Operating revenues |
na | na | na | na | 87,199 | 82,150 | 80,718 | 81,389 | na | na | na | 331,457 | na | na | ||||||||||||||||||||||||||||||||||||||||||
| Benefits and expenses: |
||||||||||||||||||||||||||||||||||||||||||||||||||||||||
| Benefits and claims |
na | na | na | na | 31,388 | 29,721 | 28,741 | 28,775 | na | na | na | 118,624 | na | na | ||||||||||||||||||||||||||||||||||||||||||
| Amortization of DAC |
na | na | na | na | 16,450 | 12,723 | 14,175 | 14,810 | na | na | na | 58,159 | na | na | ||||||||||||||||||||||||||||||||||||||||||
| Insurance commissions |
na | na | na | na | 456 | 404 | 331 | 320 | na | na | na | 1,511 | na | na | ||||||||||||||||||||||||||||||||||||||||||
| Insurance expenses |
na | na | na | na | 10,047 | 9,888 | 9,648 | 12,270 | na | na | na | 41,854 | na | na | ||||||||||||||||||||||||||||||||||||||||||
| Insurance expense allowance |
na | na | na | na | (19,541 | ) | (19,114 | ) | (18,678 | ) | (18,303 | ) | na | na | na | (75,636 | ) | na | na | |||||||||||||||||||||||||||||||||||||
| Interest expense |
na | na | na | na | 2,812 | 2,803 | 2,843 | 2,851 | na | na | na | 11,309 | na | na | ||||||||||||||||||||||||||||||||||||||||||
| Operating benefits and expenses |
na | na | na | na | 41,612 | 36,425 | 37,061 | 40,723 | na | na | na | 155,821 | na | na | ||||||||||||||||||||||||||||||||||||||||||
| Operating income before income taxes |
na | na | na | na | $ | 45,587 | $ | 45,726 | $ | 43,657 | $ | 40,666 | na | na | na | $ | 175,635 | na | na | |||||||||||||||||||||||||||||||||||||
| (1) | Certain reclassifications have been made to 2009 amounts to conform to current-period reporting classifications. These reclassifications had no impact on net income or stockholders’ equity. |
| (2) | Represents results associated with business written subsequent to the Citi reinsurance transactions executed on March 31, 2010. |
| (3) | Represents results associated with business subject to the Citi reinsurance transactions. |
| (4) | Reflects the effects of the cash basis accounting corrections made in the fourth quarter of 2010. See the preface for additional information. |
9 of 16
| Term Life Insurance - Key Statistics and Financial Analysis | PRIMERICA, INC. | |
| Financial Supplement |
| YOY Q4 | YOY YTD | |||||||||||||||||||||||||||||||||||||||||||||||||||||||
| (Dollars in thousands, except as noted) |
Q1 2009 |
Q2 2009 |
Q3 2009 |
Q4 2009 |
Q1 2010 |
Q2 2010 |
Q3 2010 |
Q4 2010 |
$ Change |
% Change |
YTD 2009 |
YTD 2010 |
$ Change |
% Change |
||||||||||||||||||||||||||||||||||||||||||
| Key Statistics |
||||||||||||||||||||||||||||||||||||||||||||||||||||||||
| Life-insurance licensed sales force, beginning of period |
100,651 | 100,409 | 100,672 | 101,095 | 99,785 | 97,354 | 96,066 | 96,872 | (4,223 | ) | -4.2 | % | 100,651 | 99,785 | (866 | ) | nm | |||||||||||||||||||||||||||||||||||||||
| New life-licensed representatives |
9,270 | 9,978 | 9,642 | 8,739 | 7,366 | 9,887 | 9,430 | 7,805 | (934 | ) | -10.7 | % | 37,629 | 34,488 | (3,141 | ) | -8.3 | % | ||||||||||||||||||||||||||||||||||||||
| Non-renewal and terminated representatives |
(9,512 | ) | (9,715 | ) | (9,219 | ) | (10,049 | ) | (9,797 | ) | (11,175 | ) | (8,624 | ) | (9,827 | ) | 222 | 2.2 | % | (38,495 | ) | (39,423 | ) | (928 | ) | -2.4 | % | |||||||||||||||||||||||||||||
| Life-insurance licensed sales force, end of period |
100,409 | 100,672 | 101,095 | 99,785 | 97,354 | 96,066 | 96,872 | 94,850 | (4,935 | ) | -4.9 | % | 99,785 | 94,850 | (4,935 | ) | -4.9 | % | ||||||||||||||||||||||||||||||||||||||
| Estimated annualized issued term life premium ($mills) (1): |
||||||||||||||||||||||||||||||||||||||||||||||||||||||||
| Premium from new policies |
$ | 44.3 | $ | 51.0 | $ | 48.3 | $ | 50.2 | $ | 43.4 | $ | 48.9 | $ | 44.1 | $ | 44.5 | $ | (5.7 | ) | -11.4 | % | $ | 193.7 | $ | 180.8 | $ | (12.9 | ) | -6.6 | % | ||||||||||||||||||||||||||
| Additions and increases in premium |
10.2 | 10.8 | 10.6 | 11.0 | 10.8 | 11.7 | 10.9 | 11.2 | 0.2 | 1.4 | % | 42.6 | 44.6 | 2.0 | 4.6 | % | ||||||||||||||||||||||||||||||||||||||||
| Total estimated annualized issued term life premium |
$ | 54.5 | $ | 61.8 | $ | 58.9 | $ | 61.2 | $ | 54.2 | $ | 60.6 | $ | 55.0 | $ | 55.6 | $ | (5.6 | ) | -9.1 | % | $ | 236.3 | $ | 225.4 | $ | (10.9 | ) | -4.6 | % | ||||||||||||||||||||||||||
| Issued term life policies |
53,023 | 62,202 | 58,070 | 60,542 | 52,445 | 60,406 | 54,373 | 56,290 | (4,252 | ) | -7.0 | % | 233,837 | 223,514 | (10,323 | ) | -4.4 | % | ||||||||||||||||||||||||||||||||||||||
| Term life face amount in-force, beginning of period ($mills) |
$ | 633,467 | $ | 631,566 | $ | 639,377 | $ | 646,341 | $ | 650,195 | $ | 651,790 | $ | 653,530 | $ | 654,633 | $ | 8,292 | 1.3 | % | $ | 633,467 | $ | 650,195 | $ | 16,729 | 2.6 | % | ||||||||||||||||||||||||||||
| Issued term life face amount (2) |
18,660 | 21,070 | 19,909 | 20,858 | 17,997 | 20,042 | 18,113 | 18,250 | (2,608 | ) | -12.5 | % | 80,497 | 74,401 | (6,096 | ) | -7.6 | % | ||||||||||||||||||||||||||||||||||||||
| Terminated term life face amount |
(19,614 | ) | (17,333 | ) | (18,009 | ) | (19,686 | ) | (18,867 | ) | (16,156 | ) | (17,836 | ) | (18,105 | ) | 1,581 | 8.0 | % | (74,642 | ) | (70,964 | ) | 3,678 | 4.9 | % | ||||||||||||||||||||||||||||||
| Foreign currency impact, net |
(947 | ) | 4,074 | 5,064 | 2,683 | 2,464 | (2,146 | ) | 826 | 2,013 | (669 | ) | nm | 10,873 | 3,158 | (7,715 | ) | nm | ||||||||||||||||||||||||||||||||||||||
| Term life face amount in-force, end of period |
$ | 631,566 | $ | 639,377 | $ | 646,341 | $ | 650,195 | $ | 651,790 | $ | 653,530 | $ | 654,633 | $ | 656,791 | $ | 6,596 | 1.0 | % | $ | 650,195 | $ | 656,791 | $ | 6,596 | 1.0 | % | ||||||||||||||||||||||||||||
| New Term Life Insurance - Financial Analysis |
||||||||||||||||||||||||||||||||||||||||||||||||||||||||
| Direct premium |
na | na | na | na | $ | 10,138 | $ | 21,256 | $ | 30,149 | $ | 38,197 | nm | nm | na | $ | 99,740 | nm | nm | |||||||||||||||||||||||||||||||||||||
| New term life operating income before income taxes |
na | na | na | na | $ | (5,354 | ) | $ | (1,631 | ) | $ | (1,075 | ) | $ | (1,807 | ) | nm | nm | na | $ | (9,867 | ) | nm | nm | ||||||||||||||||||||||||||||||||
| % of direct premium |
na | na | na | na | -52.8 | % | -7.7 | % | -3.6 | % | -4.7 | % | nm | nm | na | -9.9 | % | nm | nm | |||||||||||||||||||||||||||||||||||||
| Benefits & expenses, net (3) |
na | na | na | na | $ | 6,222 | $ | 15,687 | $ | 21,418 | $ | 29,245 | nm | nm | na | $ | 72,573 | nm | nm | |||||||||||||||||||||||||||||||||||||
| % of direct premium |
na | na | na | na | 61.4 | % | 73.8 | % | 71.0 | % | 76.6 | % | nm | nm | na | 72.8 | % | nm | nm | |||||||||||||||||||||||||||||||||||||
| Insurance expenses, net (4) |
na | na | na | na | $ | 9,378 | $ | 7,375 | $ | 10,124 | $ | 11,237 | nm | nm | na | $ | 38,114 | nm | nm | |||||||||||||||||||||||||||||||||||||
| % of direct premium |
na | na | na | na | 92.5 | % | 34.7 | % | 33.6 | % | 29.4 | % | nm | nm | na | 38.2 | % | nm | nm | |||||||||||||||||||||||||||||||||||||
| Legacy Term Life Insurance - Financial Analysis |
||||||||||||||||||||||||||||||||||||||||||||||||||||||||
| Direct premium |
na | na | na | na | $ | 507,794 | $ | 506,536 | $ | 495,494 | $ | 491,144 | nm | nm | na | $ | 2,000,968 | nm | nm | |||||||||||||||||||||||||||||||||||||
| Legacy term life operating income before income taxes |
na | na | na | na | $ | 45,587 | $ | 45,726 | $ | 43,657 | $ | 40,666 | nm | nm | na | $ | 175,635 | nm | nm | |||||||||||||||||||||||||||||||||||||
| % of direct premium |
na | na | na | na | 9.0 | % | 9.0 | % | 8.8 | % | 8.3 | % | nm | nm | na | 8.8 | % | nm | nm | |||||||||||||||||||||||||||||||||||||
| (1) | Estimated annualized issued term life premium - estimated as average premium per $1,000 of face amounts issued on new policies and additions (before free look returns) multiplied by actual face amount issued on new policies, rider additions and face amount increases. |
| (2) | Issued term life face amount - includes face amount on issued term life policies, additional riders added to existing policies, and face increases under increasing benefit riders |
| (3) | Benefits & expenses, net - includes total benefits & claims, ceded premiums, insurance commissions, and amortization of deferred policy acquisition costs |
| (4) | Insurance expenses, net - insurance expenses net of other net revenues |
10 of 16
| Investment and Savings Products - Financial Results, Key Statistics, and Financial Analysis | PRIMERICA, INC. | |
| Financial Supplement |
| (8) Q4 2010 |
YOY Q4 | YOY YTD | ||||||||||||||||||||||||||||||||||||||||||||||||||||||
| (Dollars in thousands, except as noted) |
Q1 2009 |
Q2 2009 |
Q3 2009 |
Q4 2009 |
Q1 2010 |
Q2 2010 |
Q3 2010 |
$ Change |
% Change |
YTD 2009 |
YTD 2010 |
$ Change |
% Change |
|||||||||||||||||||||||||||||||||||||||||||
| Investment & Savings Products Operating Income Before Income Taxes (1) |
||||||||||||||||||||||||||||||||||||||||||||||||||||||||
| Revenues: |
||||||||||||||||||||||||||||||||||||||||||||||||||||||||
| Commissions and fees: |
||||||||||||||||||||||||||||||||||||||||||||||||||||||||
| Sales-based |
$ | 28,203 | $ | 29,451 | $ | 28,672 | $ | 32,472 | $ | 36,363 | $ | 36,301 | $ | 32,941 | $ | 37,001 | $ | 4,529 | 13.9 | % | $ | 118,798 | $ | 142,605 | $ | 23,807 | 20.0 | % | ||||||||||||||||||||||||||||
| Asset-based |
27,555 | 29,718 | 33,344 | 36,964 | 38,014 | 39,445 | 37,602 | 52,412 | 15,448 | 41.8 | % | 127,581 | 167,473 | 39,892 | 31.3 | % | ||||||||||||||||||||||||||||||||||||||||
| Account-based |
11,089 | 10,784 | 10,717 | 10,657 | 10,208 | 10,317 | 10,620 | 10,545 | (112 | ) | -1.1 | % | 43,247 | 41,690 | (1,557 | ) | -3.6 | % | ||||||||||||||||||||||||||||||||||||||
| Other, net |
2,437 | 2,536 | 2,682 | 2,858 | 2,108 | 2,155 | 2,711 | 3,064 | 206 | 7.2 | % | 10,514 | 10,038 | (475 | ) | -4.5 | % | |||||||||||||||||||||||||||||||||||||||
| Operating revenues |
69,285 | 72,488 | 75,415 | 82,952 | 86,693 | 88,218 | 83,874 | 103,021 | 20,070 | 24.2 | % | 300,140 | 361,806 | 61,666 | 20.5 | % | ||||||||||||||||||||||||||||||||||||||||
| Benefits and expenses: |
||||||||||||||||||||||||||||||||||||||||||||||||||||||||
| Amortization of DAC |
1,936 | 1,508 | 1,304 | 2,506 | 2,549 | 3,029 | 1,361 | 2,392 | (114 | ) | -4.5 | % | 7,253 | 9,330 | 2,077 | 28.6 | % | |||||||||||||||||||||||||||||||||||||||
| Insurance commissions |
1,737 | 1,482 | 1,766 | 1,845 | 1,809 | 1,989 | 1,964 | 2,091 | 246 | 13.3 | % | 6,830 | 7,852 | 1,022 | 15.0 | % | ||||||||||||||||||||||||||||||||||||||||
| Sales commissions: |
||||||||||||||||||||||||||||||||||||||||||||||||||||||||
| Sales-based |
21,106 | 21,555 | 20,780 | 23,470 | 26,203 | 25,998 | 23,474 | 25,319 | 1,849 | 7.9 | % | 86,912 | 100,994 | 14,082 | 16.2 | % | ||||||||||||||||||||||||||||||||||||||||
| Asset-based |
9,430 | 9,533 | 10,883 | 12,157 | 12,715 | 12,911 | 12,232 | 20,271 | 8,114 | 66.7 | % | 42,003 | 58,129 | 16,126 | 38.4 | % | ||||||||||||||||||||||||||||||||||||||||
| Other operating expenses |
14,705 | 17,693 | 16,252 | 16,878 | 17,970 | 17,556 | 18,266 | 18,179 | 1,301 | 7.7 | % | 65,527 | 71,972 | 6,445 | 9.8 | % | ||||||||||||||||||||||||||||||||||||||||
| Operating benefits and expenses |
48,914 | 51,771 | 50,985 | 56,856 | 61,246 | 61,483 | 57,296 | 68,253 | 11,397 | 20.0 | % | 208,526 | 248,278 | 39,751 | 19.1 | % | ||||||||||||||||||||||||||||||||||||||||
| Operating income before income taxes |
$ | 20,371 | $ | 20,717 | $ | 24,430 | $ | 26,096 | $ | 25,447 | $ | 26,735 | $ | 26,578 | $ | 34,769 | $ | 8,673 | 33.2 | % | $ | 91,614 | $ | 113,529 | $ | 21,915 | 23.9 | % | ||||||||||||||||||||||||||||
| Key Statistics |
||||||||||||||||||||||||||||||||||||||||||||||||||||||||
| Product sales ($mills) |
||||||||||||||||||||||||||||||||||||||||||||||||||||||||
| Mutual Funds |
$ | 445.0 | $ | 427.5 | $ | 444.4 | $ | 504.1 | $ | 594.7 | $ | 551.0 | $ | 474.8 | $ | 520.3 | $ | 16.3 | 3.2 | % | $ | 1,821.0 | $ | 2,140.9 | $ | 319.9 | 17.6 | % | ||||||||||||||||||||||||||||
| Variable Annuities and other |
208.4 | 247.7 | 217.7 | 248.8 | 267.3 | 308.3 | 287.5 | 306.1 | 57.2 | 23.0 | % | 922.6 | 1,169.2 | 246.7 | 26.7 | % | ||||||||||||||||||||||||||||||||||||||||
| Total sales-based revenue generating product sales |
653.4 | 675.2 | 662.1 | 752.9 | 862.1 | 859.3 | 762.3 | 826.4 | 73.5 | 9.8 | % | 2,743.6 | 3,310.1 | 566.5 | 20.6 | % | ||||||||||||||||||||||||||||||||||||||||
| Segregated Funds |
75.4 | 55.7 | 59.5 | 72.5 | 111.4 | 64.0 | 61.6 | 76.6 | 4.1 | 5.6 | % | 263.1 | 313.5 | 50.5 | 19.2 | % | ||||||||||||||||||||||||||||||||||||||||
| Total product sales |
$ | 728.8 | $ | 730.9 | $ | 721.6 | $ | 825.4 | $ | 973.5 | $ | 923.3 | $ | 823.9 | $ | 903.0 | $ | 77.6 | 9.4 | % | $ | 3,006.6 | $ | 3,623.6 | $ | 617.0 | 20.5 | % | ||||||||||||||||||||||||||||
| Client asset values, beginning of period ($mills) |
$ | 24,677 | $ | 23,146 | $ | 26,496 | $ | 30,114 | $ | 31,303 | $ | 32,670 | $ | 29,723 | $ | 32,600 | $ | 2,487 | 8.3 | % | $ | 24,677 | $ | 31,303 | $ | 6,626 | 26.9 | % | ||||||||||||||||||||||||||||
| Inflows |
729 | 731 | 722 | 825 | 974 | 923 | 824 | 903 | 78 | 9.4 | % | 3,007 | 3,624 | 617 | 20.5 | % | ||||||||||||||||||||||||||||||||||||||||
| Outflows (2) |
(816 | ) | (705 | ) | (717 | ) | (758 | ) | (956 | ) | (903 | ) | (887 | ) | (945 | ) | (186 | ) | -24.6 | % | (2,997 | ) | (3,691 | ) | (694 | ) | -23.2 | % | ||||||||||||||||||||||||||||
| Net flows |
(88 | ) | 26 | 4 | 67 | 17 | 20 | (63 | ) | (42 | ) | (109 | ) | nm | 10 | (67 | ) | (77 | ) | nm | ||||||||||||||||||||||||||||||||||||
| Change in market value, net and other (3) |
(1,443 | ) | 3,323 | 3,614 | 1,123 | 1,350 | (2,967 | ) | 2,940 | 2,311 | 1,188 | nm | 6,617 | 3,633 | (2,983 | ) | nm | |||||||||||||||||||||||||||||||||||||||
| Client asset values, end of period |
$ | 23,146 | $ | 26,496 | $ | 30,114 | $ | 31,303 | $ | 32,670 | $ | 29,723 | $ | 32,600 | $ | 34,869 | $ | 3,566 | 11.4 | % | $ | 31,303 | $ | 34,869 | $ | 3,566 | 11.4 | % | ||||||||||||||||||||||||||||
| Average client asset values ($mills) |
||||||||||||||||||||||||||||||||||||||||||||||||||||||||
| Mutual Funds |
$ | 16,818 | $ | 18,261 | $ | 20,441 | $ | 21,795 | $ | 22,453 | $ | 22,424 | $ | 21,919 | $ | 23,661 | $ | 1,866 | 8.6 | % | $ | 19,329 | $ | 22,614 | $ | 3,285 | 17.0 | % | ||||||||||||||||||||||||||||
| Variable Annuities and other |
4,926 | 5,379 | 6,064 | 6,539 | 6,847 | 6,955 | 6,954 | 7,623 | 1,084 | 16.6 | % | 5,727 | 7,095 | 1,368 | 23.9 | % | ||||||||||||||||||||||||||||||||||||||||
| Segregated Funds |
1,510 | 1,699 | 1,908 | 2,041 | 2,105 | 2,182 | 2,184 | 2,327 | 285 | 14.0 | % | 1,790 | 2,199 | 410 | 22.9 | % | ||||||||||||||||||||||||||||||||||||||||
| Total |
$ | 23,253 | $ | 25,340 | $ | 28,413 | $ | 30,375 | $ | 31,404 | $ | 31,561 | $ | 31,056 | $ | 33,611 | $ | 3,236 | 10.7 | % | $ | 26,845 | $ | 31,908 | $ | 5,063 | 18.9 | % | ||||||||||||||||||||||||||||
| Average number of fee-generating accounts (thous) (4) |
2,904 | 2,844 | 2,813 | 2,790 | 2,762 | 2,741 | 2,715 | 2,694 | (96 | ) | -3.4 | % | 2,838 | 2,728 | (110 | ) | -3.9 | % | ||||||||||||||||||||||||||||||||||||||
| Financial Analysis |
||||||||||||||||||||||||||||||||||||||||||||||||||||||||
| Sales-based net revenue as % of sales (5) |
1.09 | % | 1.17 | % | 1.19 | % | 1.20 | % | 1.18 | % | 1.20 | % | 1.24 | % | 1.41 | % | nm | nm | 1.16 | % | 1.26 | % | nm | nm | ||||||||||||||||||||||||||||||||
| Asset-based net revenue as % of average asset values (6) |
0.06 | % | 0.07 | % | 0.07 | % | 0.07 | % | 0.07 | % | 0.07 | % | 0.07 | % | 0.08 | % | nm | nm | 0.27 | % | 0.29 | % | nm | nm | ||||||||||||||||||||||||||||||||
| Account-based revenue per average fee generating account (7) |
$ | 3.82 | $ | 3.79 | $ | 3.81 | $ | 3.82 | $ | 3.70 | $ | 3.76 | $ | 3.91 | $ | 3.91 | nm | nm | 15.24 | 15.28 | nm | nm | ||||||||||||||||||||||||||||||||||
| (1) | Certain reclassifications have been made to 2009 amounts to conform to current-period reporting classifications. These reclassifications had no impact on net income or stockholders’ equity. |
| (2) | Asset value outflows - include (a) redemptions of assets, (b) sales charges on the inflow sales figures, and (c) the net flow of money market funds sold and redeemed on the company’s recordkeeping platform. The redemptions of assets must be estimated for approximately 9% of account values as these figures are not readily available. Actual redemptions as a percentage of account values for similar known account values are used to estimate the unknown redemption values. |
| (3) | Change in market value, net - market value fluctuations net of fees, expenses, and foreign currency impact |
| (4) | Fee generating accounts - mutual fund accounts for which we receive recording keeping and/or custodial fees |
| (5) | Sales-based net revenue - commission and fee revenue less commissions paid to the sales force based on product sales activity |
| (6) | Asset-based net revenue - commission and fee revenue less commissions paid to the sales force earned based on product account values including amortization of deferred acquisition costs for segregated funds |
| (7) | In whole dollars |
| (8) | Reflects the effects of the cash basis accounting corrections made in the fourth quarter of 2010. See the preface for additional information. |
11 of 16
| Investment Portfolio - Summary of Holdings | PRIMERICA, INC. | |
| Financial Supplement |
| As of or for the period ended December 31, 2010 | ||||||||||||||||||||||||||||
| % of Total | Avg Book Yield |
|||||||||||||||||||||||||||
| (Dollars in thousands) |
Market Value |
Amortized Cost |
Unrealized G/(L) |
Market Value |
Amortized Cost |
Avg Rating |
||||||||||||||||||||||
| Investment Portfolio by Asset Class |
||||||||||||||||||||||||||||
| Cash and cash equivalents |
$ | 126,038 | $ | 126,038 | $ | — | 5.6 | % | 6.0 | % | ||||||||||||||||||
| Fixed Income: |
||||||||||||||||||||||||||||
| Treasury |
33,254 | 30,031 | 3,224 | 1.5 | % | 1.4 | % | 3.32 | % | AAA | ||||||||||||||||||
| Government |
103,632 | 92,980 | 10,652 | 4.6 | % | 4.4 | % | 4.68 | % | AA | ||||||||||||||||||
| Tax-Exempt Municipal |
7,076 | 6,709 | 366 | 0.3 | % | 0.3 | % | 3.79 | % | AA | ||||||||||||||||||
| Corporate |
1,263,915 | 1,162,940 | 100,975 | 56.1 | % | 55.5 | % | 5.77 | % | BBB+ | ||||||||||||||||||
| Mortgage-Backed |
343,647 | 321,203 | 22,444 | 15.3 | % | 15.3 | % | 5.60 | % | AA+ | ||||||||||||||||||
| Asset-Backed |
59,721 | 60,907 | (1,186 | ) | 2.7 | % | 2.9 | % | 1.83 | % | AA- | |||||||||||||||||
| CMBS |
154,440 | 147,351 | 7,089 | 6.9 | % | 7.0 | % | 5.20 | % | AAA | ||||||||||||||||||
| Private |
109,351 | 102,117 | 7,234 | 4.9 | % | 4.9 | % | 6.11 | % | BBB | ||||||||||||||||||
| Redeemable Preferred |
534 | 652 | (118 | ) | 0.0 | % | 0.0 | % | 36.77 | % | A- | |||||||||||||||||
| Convertible |
28,558 | 27,633 | 924 | 1.3 | % | 1.3 | % | 4.16 | % | A- | ||||||||||||||||||
| Total Fixed Income |
2,104,128 | 1,952,524 | 151,605 | 93.4 | % | 93.2 | % | 5.48 | % | A | ||||||||||||||||||
| Equities: |
||||||||||||||||||||||||||||
| Perpetual Preferred |
2,229 | 2,085 | 144 | 0.1 | % | 0.1 | % | |||||||||||||||||||||
| Common Stock |
10,516 | 7,897 | 2,620 | 0.5 | % | 0.4 | % | |||||||||||||||||||||
| Mutual Fund |
7,195 | 4,144 | 3,051 | 0.3 | % | 0.2 | % | |||||||||||||||||||||
| Other |
3,273 | 3,269 | 4 | 0.1 | % | 0.2 | % | |||||||||||||||||||||
| Total Equities |
23,213 | 17,394 | 5,818 | 1.0 | % | 0.8 | % | |||||||||||||||||||||
| Total Invested Assets |
$ | 2,253,379 | $ | 2,095,956 | $ | 157,423 | 100.0 | % | 100.0 | % | ||||||||||||||||||
| Corporate Portfolio by Sector |
||||||||||||||||||||||||||||
| Banking |
$ | 110,018 | $ | 104,553 | $ | 5,465 | 8.7 | % | 9.0 | % | ||||||||||||||||||
| Basic Industry |
99,282 | 90,710 | 8,572 | 7.9 | % | 7.8 | % | |||||||||||||||||||||
| Brokerage |
17,651 | 16,247 | 1,404 | 1.4 | % | 1.4 | % | |||||||||||||||||||||
| Capital Goods |
87,804 | 81,372 | 6,432 | 6.9 | % | 7.0 | % | |||||||||||||||||||||
| Communications |
101,027 | 91,812 | 9,215 | 8.0 | % | 7.9 | % | |||||||||||||||||||||
| Consumer Cyclical |
57,940 | 52,837 | 5,104 | 4.6 | % | 4.5 | % | |||||||||||||||||||||
| Consumer Non-Cyclical |
125,973 | 112,150 | 13,823 | 10.0 | % | 9.6 | % | |||||||||||||||||||||
| Electric |
131,954 | 120,780 | 11,173 | 10.4 | % | 10.4 | % | |||||||||||||||||||||
| Energy |
75,831 | 67,421 | 8,411 | 6.0 | % | 5.8 | % | |||||||||||||||||||||
| Finance Companies |
29,714 | 25,581 | 4,133 | 2.4 | % | 2.2 | % | |||||||||||||||||||||
| Financial Other |
8,934 | 8,444 | 490 | 0.7 | % | 0.7 | % | |||||||||||||||||||||
| Industrial Other |
21,656 | 20,245 | 1,411 | 1.7 | % | 1.7 | % | |||||||||||||||||||||
| Insurance |
121,075 | 113,466 | 7,609 | 9.6 | % | 9.8 | % | |||||||||||||||||||||
| Natural Gas |
77,894 | 71,199 | 6,696 | 6.2 | % | 6.1 | % | |||||||||||||||||||||
| REITs |
108,365 | 103,647 | 4,717 | 8.6 | % | 8.9 | % | |||||||||||||||||||||
| Technology |
56,361 | 52,455 | 3,907 | 4.5 | % | 4.5 | % | |||||||||||||||||||||
| Transportation |
27,035 | 25,029 | 2,005 | 2.1 | % | 2.2 | % | |||||||||||||||||||||
| Utility Other |
5,401 | 4,992 | 409 | 0.4 | % | 0.4 | % | |||||||||||||||||||||
| Total Corporate portfolio |
$ | 1,263,915 | $ | 1,162,940 | $ | 100,975 | 100.0 | % | 100.0 | % | ||||||||||||||||||
| Fixed-Maturity Securities - Effective Maturity |
||||||||||||||||||||||||||||
| Effective maturity |
||||||||||||||||||||||||||||
| < 1 Yr. |
$ | 281,557 | $ | 276,802 | $ | 4,754 | 13.4 | % | 14.2 | % | ||||||||||||||||||
| 1-2 Yrs. |
191,287 | 180,727 | 10,560 | 9.1 | % | 9.3 | % | |||||||||||||||||||||
| 2-5 Yrs. |
956,982 | 888,332 | 68,649 | 45.5 | % | 45.5 | % | |||||||||||||||||||||
| 5-10 Yrs. |
601,865 | 539,545 | 62,320 | 28.6 | % | 27.6 | % | |||||||||||||||||||||
| > 10 Yrs. |
72,437 | 67,116 | 5,321 | 3.4 | % | 3.4 | % | |||||||||||||||||||||
| Total Fixed Income |
$ | 2,104,128 | $ | 1,952,524 | $ | 151,605 | 100.0 | % | 100.0 | % | ||||||||||||||||||
| Duration |
||||||||||||||||||||||||||||
| Fixed Income portfolio duration |
3.6 years | |||||||||||||||||||||||||||
12 of 16
| Investment Portfolio - Quality Ratings As of December 31, 2010 | PRIMERICA, INC. | |||
| Financial Supplement | ||||
| (Dollars in thousands) |
Amortized Cost |
% of Total |
||||||
| Investment Portfolio Quality Ratings (1) |
||||||||
| Total Fixed Income portfolio: |
||||||||
| Rating |
||||||||
| AAA |
$ | 521,615 | 26.7 | % | ||||
| AA |
176,947 | 9.1 | % | |||||
| A |
426,658 | 21.9 | % | |||||
| BBB |
694,884 | 35.6 | % | |||||
| Below Investment Grade |
130,080 | 6.7 | % | |||||
| NA |
2,340 | 0.1 | % | |||||
| Total Fixed Income |
$ | 1,952,524 | 100.0 | % | ||||
| Corporate asset class: |
||||||||
| Rating |
||||||||
| AAA |
$ | 350 | 0.0 | % | ||||
| AA |
104,933 | 9.0 | % | |||||
| A |
367,045 | 31.6 | % | |||||
| BBB |
610,564 | 52.5 | % | |||||
| Below Investment Grade |
78,914 | 6.8 | % | |||||
| NA |
1,133 | 0.1 | % | |||||
| Total Corporate |
$ | 1,162,940 | 100.0 | % | ||||
| CMBS asset class: |
||||||||
| Rating |
||||||||
| AAA |
$ | 119,276 | 80.9 | % | ||||
| AA |
23,748 | 16.1 | % | |||||
| A |
1,946 | 1.3 | % | |||||
| BBB |
1,284 | 0.9 | % | |||||
| Below Investment Grade |
987 | 0.7 | % | |||||
| NA |
110 | 0.1 | % | |||||
| Total CMBS |
$ | 147,351 | 100.0 | % | ||||
| Asset-Backed asset class: |
||||||||
| Rating |
||||||||
| AAA |
$ | 47,401 | 77.8 | % | ||||
| AA |
1,404 | 2.3 | % | |||||
| A |
216 | 0.4 | % | |||||
| BBB |
3,064 | 5.0 | % | |||||
| Below Investment Grade |
8,822 | 14.5 | % | |||||
| NA |
— | — | ||||||
| Total Asset-Backed |
$ | 60,907 | 100.0 | % | ||||
| Private asset class: |
||||||||
| Rating |
||||||||
| AAA |
$ | 268 | 0.3 | % | ||||
| AA |
6,585 | 6.4 | % | |||||
| A |
14,993 | 14.7 | % | |||||
| BBB |
58,186 | 57.0 | % | |||||
| Below Investment Grade |
22,086 | 21.6 | % | |||||
| NA |
— | — | ||||||
| Total Private |
$ | 102,117 | 100.0 | % | ||||
| Mortgage-Backed asset class: |
||||||||
| Rating |
||||||||
| AAA |
$ | 291,402 | 90.7 | % | ||||
| AA |
750 | 0.2 | % | |||||
| A |
3,192 | 1.0 | % | |||||
| BBB |
8,912 | 2.8 | % | |||||
| Below Investment Grade |
16,946 | 5.3 | % | |||||
| NA |
— | — | ||||||
| Total Mortgage-Backed |
$ | 321,203 | 100.0 | % | ||||
| Treasury & Government asset classes: |
||||||||
| Rating |
||||||||
| AAA |
$ | 62,608 | 50.9 | % | ||||
| AA |
33,685 | 27.4 | % | |||||
| A |
19,851 | 16.1 | % | |||||
| BBB |
6,867 | 5.6 | % | |||||
| Below Investment Grade |
— | — | ||||||
| NA |
— | — | ||||||
| Total Treasury & Government |
$ | 123,011 | 100.0 | % | ||||
| NAIC Designations |
||||||||
| 1 |
$ | 1,040,203 | 57.5 | % | ||||
| 2 |
662,269 | 36.6 | % | |||||
| 3 |
71,671 | 4.0 | % | |||||
| 4 |
24,608 | 1.4 | % | |||||
| 5 |
9,047 | 0.5 | % | |||||
| 6 |
1,734 | 0.1 | % | |||||
| U.S. Insurer Fixed Income (2) |
1,809,532 | 100.0 | % | |||||
| Other (3) |
160,386 | |||||||
| Cash and cash equivalents |
126,038 | |||||||
| Total Invested Assets |
$ | 2,095,956 | ||||||
| (1) | Ratings method for split ratings: If by 2 NRSROs, use lower of the two; if by 3 or more NRSROs, use second lowest |
| (2) | NAIC ratings for our U.S. insurance companies’ fixed income portfolios |
| (3) | Other consists of assets held by our non-life companies, Canadian insurance company, and unrated equities |
13 of 16
| Investment Portfolio - Mortgage Backed Vintage Analysis As of December 31, 2010 | PRIMERICA, INC. | |||
| Financial Supplement | ||||
| 2004 and Prior |
2005 | 2006 | 2007 | 2008 | 2009 | 2010 | Total | |||||||||||||||||||||||||
| (Dollars in thousands) |
Amortized Cost by Vintage | |||||||||||||||||||||||||||||||
| Commercial Mortgage-Backed Securities |
||||||||||||||||||||||||||||||||
| Current Rating: |
||||||||||||||||||||||||||||||||
| AAA |
$ | 66,173 | $ | 23,343 | $ | 9,058 | $ | 7,984 | $ | 2,090 | $ | 5,922 | $ | 4,704 | $ | 119,276 | ||||||||||||||||
| AA |
13,488 | 10,260 | — | — | — | — | — | 23,748 | ||||||||||||||||||||||||
| A |
1,746 | — | 200 | — | — | — | — | 1,946 | ||||||||||||||||||||||||
| BBB |
1,284 | — | — | — | — | — | — | 1,284 | ||||||||||||||||||||||||
| BB |
255 | — | — | — | — | — | — | 255 | ||||||||||||||||||||||||
| B |
314 | — | — | — | — | — | — | 314 | ||||||||||||||||||||||||
| CCC and lower |
302 | 226 | — | — | — | — | — | 528 | ||||||||||||||||||||||||
| Total |
$ | 83,563 | $ | 33,829 | $ | 9,258 | $ | 7,984 | $ | 2,090 | $ | 5,922 | $ | 4,704 | $ | 147,351 | ||||||||||||||||
| Net Unrealized Gain/(Loss) by Vintage | ||||||||||||||||||||||||||||||||
| Current Rating: |
||||||||||||||||||||||||||||||||
| AAA |
$ | 2,926 | $ | 959 | $ | 731 | $ | 478 | $ | 82 | $ | 161 | $ | (61 | ) | $ | 5,277 | |||||||||||||||
| AA |
150 | 123 | — | — | — | — | — | 273 | ||||||||||||||||||||||||
| A |
185 | — | 4 | — | — | — | — | 190 | ||||||||||||||||||||||||
| BBB |
(119 | ) | — | — | — | — | — | — | (119 | ) | ||||||||||||||||||||||
| BB |
780 | — | — | — | — | — | — | 780 | ||||||||||||||||||||||||
| B |
472 | — | — | — | — | — | — | 472 | ||||||||||||||||||||||||
| CCC and lower |
217 | (0 | ) | — | — | — | — | — | 217 | |||||||||||||||||||||||
| Total |
$ | 4,611 | $ | 1,083 | $ | 735 | $ | 478 | $ | 82 | $ | 161 | $ | (61 | ) | $ | 7,089 | |||||||||||||||
|
|
| |||||||||||||||||||||||||||||||
| Amortized Cost by Vintage | ||||||||||||||||||||||||||||||||
| Prime Residential Mortgage-Backed Securities |
||||||||||||||||||||||||||||||||
| Current Rating: |
||||||||||||||||||||||||||||||||
| AAA |
$ | 149,576 | $ | 28,735 | $ | 29,482 | $ | 46,896 | $ | 31,892 | $ | — | $ | 3,200 | $ | 289,781 | ||||||||||||||||
| AA |
— | — | — | — | — | — | — | — | ||||||||||||||||||||||||
| A |
804 | 2,388 | — | — | — | — | — | 3,192 | ||||||||||||||||||||||||
| BBB |
— | 8,912 | — | — | — | — | — | 8,912 | ||||||||||||||||||||||||
| BB |
— | 4,668 | — | — | — | — | — | 4,668 | ||||||||||||||||||||||||
| B |
— | 2,410 | — | — | — | — | — | 2,410 | ||||||||||||||||||||||||
| CCC and lower |
— | 1,490 | — | 1,655 | — | — | — | 3,145 | ||||||||||||||||||||||||
| Total |
$ | 150,380 | $ | 48,603 | $ | 29,482 | $ | 48,551 | $ | 31,892 | $ | — | $ | 3,200 | $ | 312,108 | ||||||||||||||||
| Net Unrealized Gain/(Loss) by Vintage | ||||||||||||||||||||||||||||||||
| Current Rating: |
||||||||||||||||||||||||||||||||
| AAA |
$ | 12,531 | $ | 1,214 | $ | 2,504 | $ | 3,974 | $ | 2,938 | $ | — | $ | 28 | $ | 23,189 | ||||||||||||||||
| AA |
— | — | — | — | — | — | — | — | ||||||||||||||||||||||||
| A |
15 | 62 | — | — | — | — | — | 78 | ||||||||||||||||||||||||
| BBB |
— | (460 | ) | — | — | — | — | — | (460 | ) | ||||||||||||||||||||||
| BB |
— | (127 | ) | — | — | — | — | — | (127 | ) | ||||||||||||||||||||||
| B |
— | (53 | ) | — | — | — | — | — | (53 | ) | ||||||||||||||||||||||
| CCC and lower |
— | (30 | ) | — | 23 | — | — | — | (7 | ) | ||||||||||||||||||||||
| Total |
$ | 12,547 | $ | 605 | $ | 2,504 | $ | 3,997 | $ | 2,938 | $ | — | $ | 28 | $ | 22,619 | ||||||||||||||||
|
|
| |||||||||||||||||||||||||||||||
| Amortized Cost by Vintage | ||||||||||||||||||||||||||||||||
| Alt-A Residential Mortgage-Backed Securities |
||||||||||||||||||||||||||||||||
| Current Rating: |
||||||||||||||||||||||||||||||||
| AAA |
$ | — | $ | 1,621 | $ | — | $ | — | $ | — | $ | — | $ | — | $ | 1,621 | ||||||||||||||||
| AA |
750 | — | — | — | — | — | — | 750 | ||||||||||||||||||||||||
| A |
— | — | — | — | — | — | — | — | ||||||||||||||||||||||||
| BBB |
— | — | — | — | — | — | — | — | ||||||||||||||||||||||||
| BB |
— | — | — | — | — | — | — | — | ||||||||||||||||||||||||
| B |
— | 3,462 | — | — | — | — | — | 3,462 | ||||||||||||||||||||||||
| CCC and lower |
2,971 | 291 | — | — | — | — | — | 3,262 | ||||||||||||||||||||||||
| Total |
$ | 3,721 | $ | 5,374 | $ | — | $ | — | $ | — | $ | — | $ | — | $ | 9,095 | ||||||||||||||||
| Net Unrealized Gain/(Loss) by Vintage | ||||||||||||||||||||||||||||||||
| Current Rating: |
||||||||||||||||||||||||||||||||
| AAA |
$ | — | $ | 35 | $ | — | $ | — | $ | — | $ | — | $ | — | $ | 35 | ||||||||||||||||
| AA |
18 | — | — | — | — | — | — | 18 | ||||||||||||||||||||||||
| A |
— | — | — | — | — | — | — | — | ||||||||||||||||||||||||
| BBB |
— | — | — | — | — | — | — | — | ||||||||||||||||||||||||
| BB |
— | — | — | — | — | — | — | — | ||||||||||||||||||||||||
| B |
— | (179 | ) | — | — | — | — | — | (179 | ) | ||||||||||||||||||||||
| CCC and lower |
(29 | ) | (20 | ) | — | — | — | — | — | (49 | ) | |||||||||||||||||||||
| Total |
$ | (10 | ) | $ | (164 | ) | $ | — | $ | — | $ | — | $ | — | $ | — | $ | (174 | ) | |||||||||||||
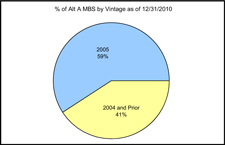
|
||||||||||||||||||||||||||||||||
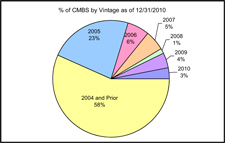
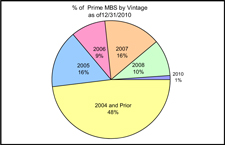
14 of 16
| Investment Portfolio - Supplemental Data and Trends | PRIMERICA, INC. | |
| Financial Supplement |
| (Dollars in thousands) |
Q1 2009 |
Q2 2009 |
Q3 2009 |
Q4 2009 |
Q1 2010 |
Q2 2010 |
Q3 2010 |
Q4 2010 |
||||||||||||||||||||||||
| Net Investment Income by Source |
||||||||||||||||||||||||||||||||
| Bonds & notes |
na | na | na | na | $ | 83,814 | $ | 27,796 | $ | 28,350 | $ | 28,091 | ||||||||||||||||||||
| Preferred and common stocks |
na | na | na | na | 1,239 | 164 | 189 | 231 | ||||||||||||||||||||||||
| Deposit asset underlying 10% reinsurance treaty |
na | na | na | na | — | 1,551 | 624 | (704 | ) | |||||||||||||||||||||||
| Policy loans |
na | na | na | na | 336 | 341 | 326 | 362 | ||||||||||||||||||||||||
| Cash & cash equivalents |
na | na | na | na | 283 | 85 | 103 | 73 | ||||||||||||||||||||||||
| Other |
na | na | na | na | — | 55 | — | — | ||||||||||||||||||||||||
| Total investment income |
na | na | na | na | 85,671 | 29,992 | 29,591 | 28,053 | ||||||||||||||||||||||||
| Investment expenses |
na | na | na | na | 3,095 | 2,001 | 1,737 | 1,365 | ||||||||||||||||||||||||
| Net investment income |
na | na | na | na | $ | 82,576 | $ | 27,991 | $ | 27,855 | $ | 26,688 | ||||||||||||||||||||
| Fixed income book yield, end of period |
na | na | na | na | 5.79 | % | 5.72 | % | 5.47 | % | 5.48 | % | ||||||||||||||||||||
| New money yield |
3.48 | % | 2.43 | % | 2.50 | % | 3.58 | % | ||||||||||||||||||||||||
| Fixed Income Portfolio Quality Ratings |
||||||||||||||||||||||||||||||||
| Rating |
||||||||||||||||||||||||||||||||
| AAA |
na | na | na | na | 32.5 | % | 31.4 | % | 28.0 | % | 26.7 | % | ||||||||||||||||||||
| AA |
na | na | na | na | 7.9 | % | 6.9 | % | 8.0 | % | 9.1 | % | ||||||||||||||||||||
| A |
na | na | na | na | 21.2 | % | 21.4 | % | 22.2 | % | 21.9 | % | ||||||||||||||||||||
| BBB |
na | na | na | na | 30.8 | % | 32.4 | % | 34.8 | % | 35.6 | % | ||||||||||||||||||||
| Below Investment Grade |
na | na | na | na | 7.1 | % | 7.8 | % | 6.9 | % | 6.7 | % | ||||||||||||||||||||
| NA |
na | na | na | na | 0.4 | % | 0.1 | % | 0.1 | % | 0.1 | % | ||||||||||||||||||||
| Total Fixed Income |
na | na | na | na | 100.0 | % | 100.0 | % | 100.0 | % | 100.0 | % | ||||||||||||||||||||
| Average rating by amortized cost |
na | na | na | na | A | A | A | A | ||||||||||||||||||||||||
| As of December 31, 2010 | ||||||||||||||
| Market Value |
Amortized Cost |
Credit Rating |
||||||||||||
| Top 25 Exposures |
||||||||||||||
| 1 |
Government of Canada |
$ | 37,177 | $ | 33,091 | AAA | ||||||||
| 2 |
General Electric Co |
16,193 | 14,309 | AA+ | ||||||||||
| 3 |
National Rural Utilities Cooperative |
15,906 | 12,851 | A+ | ||||||||||
| 4 |
Verizon Communications Inc |
15,439 | 13,503 | A- | ||||||||||
| 5 |
Bank of America Corp |
13,708 | 12,706 | A | ||||||||||
| 6 |
Edison International |
11,173 | 11,052 | B+ | ||||||||||
| 7 |
ConocoPhillips |
10,796 | 9,279 | A | ||||||||||
| 8 |
Medtronic Inc |
10,743 | 10,484 | AA- | ||||||||||
| 9 |
Enel SpA |
10,573 | 10,540 | A- | ||||||||||
| 10 |
Toyota Motor Corp |
10,094 | 10,021 | AA | ||||||||||
| 11 |
AT&T Inc |
9,997 | 8,774 | A- | ||||||||||
| 12 |
Banco Santander SA |
9,911 | 9,854 | AA | ||||||||||
| 13 |
Loews Corp |
9,754 | 9,016 | BBB | ||||||||||
| 14 |
Reynolds American Inc |
9,507 | 7,878 | BBB | ||||||||||
| 15 |
Amgen Inc |
9,457 | 9,382 | A+ | ||||||||||
| 16 |
Iberdrola SA |
9,118 | 8,467 | BBB+ | ||||||||||
| 17 |
Health Care REIT Inc |
8,989 | 9,128 | BBB- | ||||||||||
| 18 |
Altria Group Inc |
8,484 | 6,886 | BBB | ||||||||||
| 19 |
Province of Ontario Canada |
8,085 | 6,485 | AA- | ||||||||||
| 20 |
Roche Holding AG |
8,072 | 6,914 | AA- | ||||||||||
| 21 |
Province of Quebec Canada |
7,850 | 6,365 | A+ | ||||||||||
| 22 |
Vale SA |
7,809 | 7,101 | BBB+ | ||||||||||
| 23 |
ArcelorMittal |
7,761 | 6,578 | BBB- | ||||||||||
| 24 |
Montpelier Re Holdings Ltd |
7,685 | 7,207 | BBB | ||||||||||
| 25 |
Time Warner Cable Inc |
7,527 | 6,917 | BBB | ||||||||||
| Total |
$ | 281,804 | $ | 254,790 | ||||||||||
| % of total fixed income portfolio |
13.4 | % | 13.0 | % | ||||||||||
| As of December 31, 2010 | ||||||||||||||
| Market Value |
Amortized Cost |
|||||||||||||
| Foreign Exposure (1) |
||||||||||||||
| Canada | $ | 60,947 | $ | 56,620 | ||||||||||
| United Kingdom | 54,236 | 50,487 | ||||||||||||
| Australia | 37,335 | 33,827 | ||||||||||||
| France | 22,370 | 21,162 | ||||||||||||
| Spain | 19,410 | 19,091 | ||||||||||||
| Japan | 15,079 | 14,977 | ||||||||||||
| Italy | 13,646 | 13,538 | ||||||||||||
| Emerging Markets (2) | 36,767 | 33,406 | ||||||||||||
| All Other | 83,089 | 74,820 | ||||||||||||
| Total |
$ | 342,880 | $ | 317,928 | ||||||||||
| Government Investments |
||||||||||||||
| AAA | $ | 260 | $ | 255 | ||||||||||
| AA | 2,814 | 2,572 | ||||||||||||
| A | 10,308 | 9,625 | ||||||||||||
| BBB | 7,765 | 6,867 | ||||||||||||
| Below Investment Grade | — | — | ||||||||||||
| NA | — | — | ||||||||||||
| Total |
$ | 21,148 | $ | 19,319 | ||||||||||
| Non-Government Investments |
||||||||||||||
| AAA | $ | — | $ | — | ||||||||||
| AA | 51,747 | 49,407 | ||||||||||||
| A | 101,103 | 94,646 | ||||||||||||
| BBB | 144,009 | 131,772 | ||||||||||||
| Below Investment Grade | 22,506 | 21,784 | ||||||||||||
| NA | 2,367 | 1,000 | ||||||||||||
| Total |
$ | 321,731 | $ | 298,608 | ||||||||||
| (1) | US$ denominated investments in issuers outside of the United States based on country of risk |
| (2) | Emerging markets is as defined by MSCI, Inc. which include Brazil, Chile, Colombia, India, Korea, Mexico, Peru, Poland and South Africa |
15 of 16
| Five-Year Historical Key Statistics | PRIMERICA, INC. | |
| Financial Supplement |
| (Dollars in millions) | 2006 | 2007 | 2008 | 2009 | 2010 | Q1 2009 |
Q2 2009 |
Q3 2009 |
Q4 2009 |
Q1 2010 |
Q2 2010 |
Q3 2010 |
Q4 2010 |
|||||||||||||||||||||||||||||||||||||||
| Recruits |
204,316 | 220,950 | 235,125 | 221,920 | 231,390 | 57,623 | 57,453 | 58,654 | 48,190 | 58,085 | 65,245 | 58,178 | 49,882 | |||||||||||||||||||||||||||||||||||||||
| Life-insurance licensed sales force, beginning of period |
97,105 | 96,532 | 97,125 | 100,651 | 99,785 | 100,651 | 100,409 | 100,672 | 101,095 | 99,785 | 97,354 | 96,066 | 96,872 | |||||||||||||||||||||||||||||||||||||||
| New life-licensed representatives |
35,233 | 36,308 | 39,383 | 37,629 | 34,488 | 9,270 | 9,978 | 9,642 | 8,739 | 7,366 | 9,887 | 9,430 | 7,805 | |||||||||||||||||||||||||||||||||||||||
| Non-renewal and terminated representatives |
(35,806 | ) | (35,715 | ) | (35,857 | ) | (38,495 | ) | (39,423 | ) | (9,512 | ) | (9,715 | ) | (9,219 | ) | (10,049 | ) | (9,797 | ) | (11,175 | ) | (8,624 | ) | (9,827 | ) | ||||||||||||||||||||||||||
| Life-insurance licensed sales force, end of period |
96,532 | 97,125 | 100,651 | 99,785 | 94,850 | 100,409 | 100,672 | 101,095 | 99,785 | 97,354 | 96,066 | 96,872 | 94,850 | |||||||||||||||||||||||||||||||||||||||
| Issued term life policies |
245,520 | 244,733 | 241,173 | 233,837 | 223,514 | 53,023 | 62,202 | 58,070 | 60,542 | 52,445 | 60,406 | 54,373 | 56,290 | |||||||||||||||||||||||||||||||||||||||
| Issued term life face amount |
$ | 84,503 | $ | 87,619 | $ | 87,279 | $ | 80,497 | $ | 74,401 | $ | 18,660 | $ | 21,070 | $ | 19,909 | $ | 20,858 | $ | 17,997 | $ | 20,042 | $ | 18,113 | $ | 18,250 | ||||||||||||||||||||||||||
| Term life face amount in force, beginning of period |
$ | 572,155 | $ | 599,470 | $ | 632,086 | $ | 633,467 | $ | 650,195 | $ | 633,467 | $ | 631,566 | $ | 639,377 | $ | 646,341 | $ | 650,195 | $ | 651,790 | $ | 653,530 | $ | 654,633 | ||||||||||||||||||||||||||
| Issued term life face amount |
84,503 | 87,619 | 87,279 | 80,497 | 74,401 | 18,660 | 21,070 | 19,909 | 20,858 | 17,997 | 20,042 | 18,113 | 18,250 | |||||||||||||||||||||||||||||||||||||||
| Terminated term life face amount |
(57,277 | ) | (64,966 | ) | (72,008 | ) | (74,642 | ) | (70,964 | ) | (19,614 | ) | (17,333 | ) | (18,009 | ) | (19,686 | ) | (18,867 | ) | (16,156 | ) | (17,836 | ) | (18,105 | ) | ||||||||||||||||||||||||||
| Foreign currency impact, net |
90 | 9,963 | (13,891 | ) | 10,873 | 3,158 | (947 | ) | 4,074 | 5,064 | 2,683 | 2,464 | (2,146 | ) | 826 | 2,013 | ||||||||||||||||||||||||||||||||||||
| Term life face amount in force, end of period |
$ | 599,470 | $ | 632,086 | $ | 633,467 | $ | 650,195 | $ | 656,791 | $ | 631,566 | $ | 639,377 | $ | 646,341 | $ | 650,195 | $ | 651,790 | $ | 653,530 | $ | 654,633 | $ | 656,791 | ||||||||||||||||||||||||||
| Estimated annualized issued term life premium |
||||||||||||||||||||||||||||||||||||||||||||||||||||
| Premium from new policies |
$ | 204.7 | $ | 208.9 | $ | 205.0 | $ | 193.7 | $ | 180.8 | $ | 44.3 | $ | 51.0 | $ | 48.3 | $ | 50.2 | $ | 43.4 | $ | 48.9 | $ | 44.1 | $ | 44.5 | ||||||||||||||||||||||||||
| Additions and increases in premium |
41.1 | 43.4 | 43.0 | 42.6 | 44.6 | 10.2 | 10.8 | 10.6 | 11.0 | 10.8 | 11.7 | 10.9 | 11.2 | |||||||||||||||||||||||||||||||||||||||
| Total estimated annualized issued term life premium |
$ | 245.8 | $ | 252.4 | $ | 248.0 | $ | 236.3 | $ | 225.4 | $ | 54.5 | $ | 61.8 | $ | 58.9 | $ | 61.2 | $ | 54.2 | $ | 60.6 | $ | 55.0 | $ | 55.6 | ||||||||||||||||||||||||||
| Investment & Savings product sales |
$ | 4,664.7 | $ | 5,189.5 | $ | 4,458.4 | $ | 3,006.6 | $ | 3,623.6 | $ | 728.8 | $ | 730.9 | $ | 721.6 | $ | 825.4 | $ | 973.5 | $ | 923.3 | $ | 823.9 | $ | 903.0 | ||||||||||||||||||||||||||
| Investment & Savings average client asset values |
$ | 32,082 | $ | 36,735 | $ | 32,763 | $ | 26,845 | $ | 31,908 | $ | 23,253 | $ | 25,340 | $ | 28,413 | $ | 30,375 | $ | 31,404 | $ | 31,561 | $ | 31,056 | $ | 33,611 | ||||||||||||||||||||||||||
16 of 16