Attached files
| file | filename |
|---|---|
| 8-K - FORM 8-K - COVANTA HOLDING CORP | c62865e8vk.htm |
| EX-99.1 - EX-99.1 - COVANTA HOLDING CORP | c62865exv99w1.htm |
Exhibit 99.2

| COVANTA HOLDING CORPORATION 2010 YEAR END EARNINGS CONFERENCE CALL February 10, 2011 |

| Cautionary Statements Forward-Looking Statements Certain statements in this presentation may constitute "forward-looking" statements as defined in Section 27A of the Securities Act of 1933 (the "Securities Act"), Section 21E of the Securities Exchange Act of 1934 (the "Exchange Act"), the Private Securities Litigation Reform Act of 1995 (the "PSLRA") or in releases made by the Securities and Exchange Commission ("SEC"), all as may be amended from time to time. Such forward-looking statements involve known and unknown risks, uncertainties and other important factors that could cause the actual results, performance or achievements of Covanta and its subsidiaries, or general industry or broader economic performance in global markets in which Covanta operates or competes, to differ materially from any future results, performance or achievements expressed or implied by such forward-looking statements. Statements that are not historical fact are forward-looking statements. Forward-looking statements can be identified by, among other things, the use of forward-looking language, such as the words "plan," "believe," "expect," "anticipate," "intend," "estimate," "project," "may," "will," "would," "could," "should," "seeks," or "scheduled to," or other similar words, or the negative of these terms or other variations of these terms or comparable language, or by discussion of strategy or intentions. These cautionary statements are being made pursuant to the Securities Act, the Exchange Act and the PSLRA with the intention of obtaining the benefits of the "safe harbor" provisions of such laws. Covanta cautions investors that any forward-looking statements made by Covanta are not guarantees or indicative of future performance. Important assumptions and other important factors that could cause actual results to differ materially from those forward-looking statements with respect to Covanta, include, but are not limited to, the risk that Covanta may not successfully close its announced or planned acquisitions or projects in development and those factors, risks and uncertainties that are described in periodic securities filings by Covanta with the SEC. Although Covanta believes that its plans, intentions and expectations reflected in or suggested by such forward-looking statements are reasonable, actual results could differ materially from a projection or assumption in any forward-looking statements. Covanta's future financial condition and results of operations, as well as any forward-looking statements, are subject to change and inherent risks and uncertainties. The forward-looking statements contained in this press release are made only as of the date hereof and Covanta does not have or undertake any obligation to update or revise any forward-looking statements whether as a result of new information, subsequent events or otherwise, unless otherwise required by law. Non-GAAP Financial Measures The non-GAAP financial measures of Adjusted EBITDA, Free Cash Flow, Diluted Earnings Per Share, Excluding Special Items, and Adjusted EPS as described and used in this earnings presentation are not intended as a substitute or as an alternative to net income, cash flow provided by operating activities or diluted earnings per share as indicators of our performance or liquidity or any other measures of performance or liquidity derived in accordance with GAAP. In addition, our non-GAAP financial measures may be different from non-GAAP measures used by other companies, limiting their usefulness for comparison purposes. The presentations of Adjusted EBITDA, Free Cash Flow, Diluted Earnings Per Share, Excluding Special Items and Adjusted EPS are intended to enhance the usefulness of our financial information by providing measures which management internally use to assess and evaluate the overall performance of its business and those of possible acquisition candidates, and highlight trends in the overall business. |

| 2010 Performance Highlights Operating performance 91% boiler availability - 19 million tons of waste converted to clean energy Completed and integrated the Veolia North American EfW acquisition 2010 asset management initiatives will drive 2011 growth Financial performance Achieved growth across all key metrics notwithstanding contract transition headwinds - exceeded guidance for Free Cash Flow Proactively refinanced a portion of the balance sheet to reduce risk and lock in attractive long-term cost of capital Returned $328 million to shareholders in 2010 |

| Summary of Consolidated Financial Results 2010 Calendar Year (Unaudited, $ in millions, except EPS) Full Year 2009 Actual Full Year 2010 Actual 2010 Guidance (1) Revenue $1,384 $1,583 N/A Net Income Attributable to Covanta $102 $62 N/A Adjusted EBITDA $515 $531 $525 - $550 Free Cash Flow $345 $357 $325 - $350 EPS, excluding special items $0.67 $0.68 $0.55 - $0.65 Guidance issued on October 20, 2010. Initial 2010 guidance metrics, as presented on February 22, 2010, were Adjusted EBITDA of $520 - $560 million, Free Cash Flow of $300 - $340 million and EPS of $0.55 - $0.75 per share. |
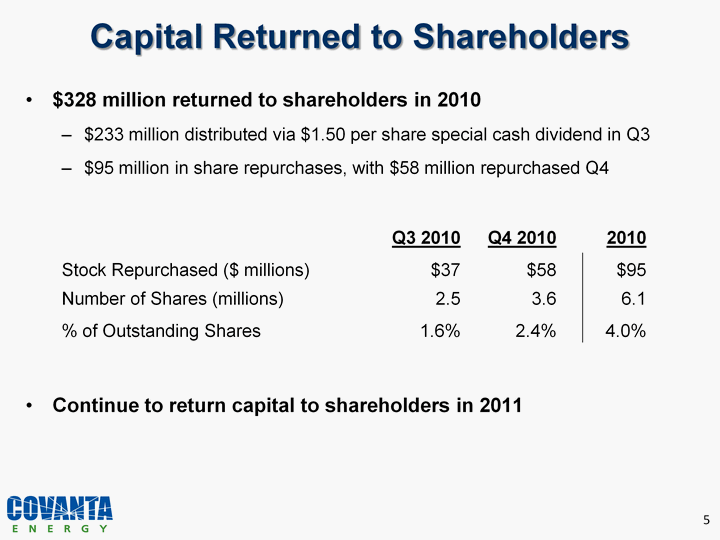
| Capital Returned to Shareholders $328 million returned to shareholders in 2010 $233 million distributed via $1.50 per share special cash dividend in Q3 $95 million in share repurchases, with $58 million repurchased Q4 Q3 2010 Q4 2010 2010 Stock Repurchased ($ millions) $37 $58 $95 Number of Shares (millions) 2.5 3.6 6.1 % of Outstanding Shares 1.6% 2.4% 4.0% Continue to return capital to shareholders in 2011 |

| 2011 Guidance Metrics From Continuing Operations (Unaudited, $ in millions, except EPS) 2009 Actual 2010 Actual 2011 Guidance (1) Adjusted EBITDA $454 $470 $480 - $520 Free Cash Flow $300 $318 $250 - $300 Adjusted EPS (2) $0.39 $0.42 $0.40 - $0.55 As of February 9, 2011. (2) We will utilize Adjusted EPS as one of our 2011 guidance metrics. The differences between this metric and EPS, Excluding Special Items are adjustments to exclude the net impact of the changes in fair value of the conversion feature in our cash convertible notes and the related hedges and transaction-related costs. The impact on EPS for these items for the year ended December 31, 2009 was ($0.01) per share. There was no net EPS impact for these items for the year ended December 31, 2010. |

| 2011 Outlook Macro-economic environment improving, but Covanta markets challenging Energy markets flat with continued weakness in natural gas prices Spot waste disposal pricing remains soft in most Covanta markets Headline inflation remains low, suggesting little upside to waste contract inflators Managing adverse environment with aggressive "blocking and tackling" Maintain world-class operating performance Focus on improvements at recently acquired facilities, prudent asset management and continuous cost control Resulting 2011 targets: Target ~5% Adjusted EBITDA growth despite headwinds Generate substantial Free Cash Flow Target ~15-20% increase in cash flow available after scheduled debt repayments Continue to return capital to shareholders - funded from operations and asset sales |

| Adjusted EBITDA From Continuing Operations 2011 Guidance: $480 - $520 million (1) 2010 Actual vs. 2011 Guidance As of February 9, 2011. |

| Free Cash Flow From Continuing Operations 2011 Guidance: $250 - $300 million (1) 2010 Actual vs. 2011 Guidance As of February 9, 2011. |

| Adjusted EPS From Continuing Operations 2011 Guidance: $0.40 - $0.55 (1) 2010 Actual vs. 2011 Guidance As of February 9, 2011. Based on year-end 2010 balance of 150 million shares outstanding; does not reflect any potential impact of 2011 shares repurchases. (2) |
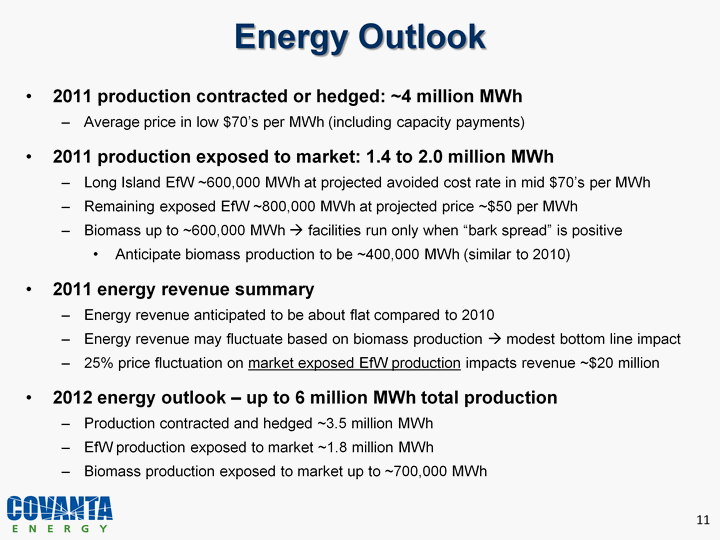
| Energy Outlook 2011 production contracted or hedged: ~4 million MWh Average price in low $70's per MWh (including capacity payments) 2011 production exposed to market: 1.4 to 2.0 million MWh Long Island EfW ~600,000 MWh at projected avoided cost rate in mid $70's per MWh Remaining exposed EfW ~800,000 MWh at projected price ~$50 per MWh Biomass up to ~600,000 MWh ? facilities run only when "bark spread" is positive Anticipate biomass production to be ~400,000 MWh (similar to 2010) 2011 energy revenue summary Energy revenue anticipated to be about flat compared to 2010 Energy revenue may fluctuate based on biomass production ? modest bottom line impact 25% price fluctuation on market exposed EfW production impacts revenue ~$20 million 2012 energy outlook - up to 6 million MWh total production Production contracted and hedged ~3.5 million MWh EfW production exposed to market ~1.8 million MWh Biomass production exposed to market up to ~700,000 MWh |

| Waste and Metals Outlook Waste 2011 guidance anticipates modest waste revenue growth Service fee facilities: Continued low inflation escalation on contracts - annual adjustments tend to lag Debt service pass-through revenue declining Tip fee facilities (~ 7.5 million tons): average pricing in mid-$50's per ton About 5 million tons under contract - typically include inflation adjustment Spot market anticipated to remain soft Targeting special waste growth Metals Higher metal prices drove 2010 revenue up to $55 million Metal prices are volatile: 2010 was $25 million higher than 2009 Guidance assumes flat year-over-year prices |
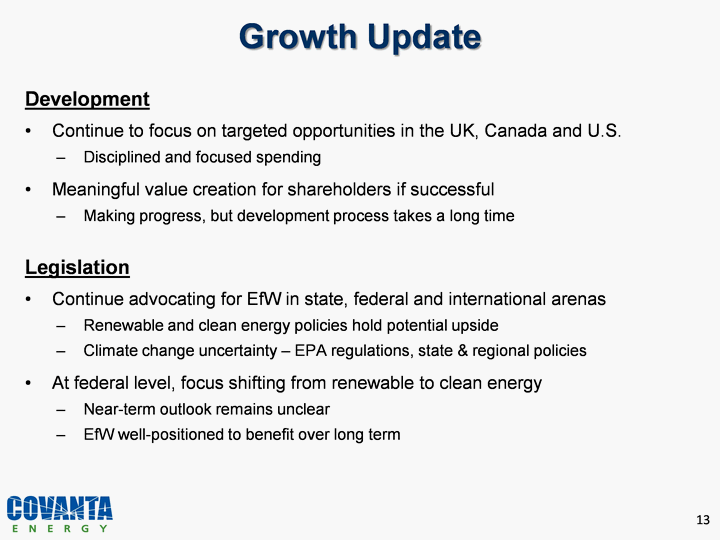
| Growth Update Development Continue to focus on targeted opportunities in the UK, Canada and U.S. Disciplined and focused spending Meaningful value creation for shareholders if successful Making progress, but development process takes a long term Legislation Continue advocating for EfW in state, federal and international arenas Renewable and clean energy policies hold potential upside Climate change uncertainty - EPA regulations, state & regional policies At federal level, focus shifting from renewable to clean energy Near-term outlook remains unclear EfW well-positioned to benefit over long term |
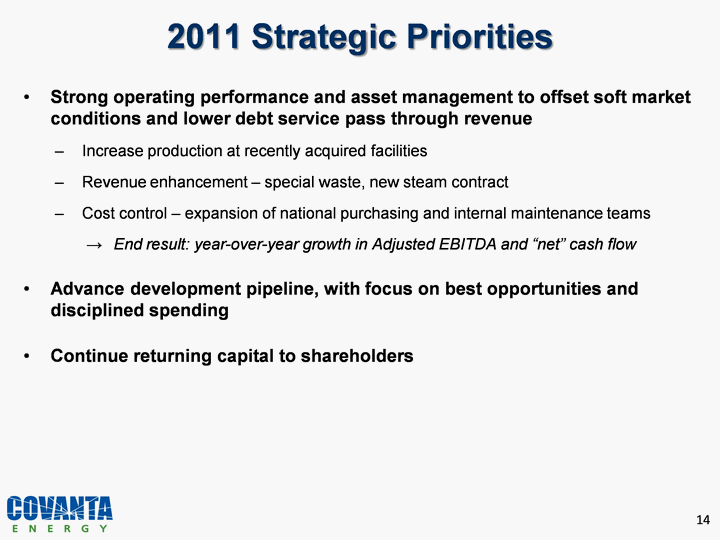
| 2011 Strategic Priorities Strong operating performance and asset management to offset soft market conditions and contract headwinds Increase production at several recently acquired facilities Grow special waste business to offset tepid underlying growth Cost control via expansion of national purchasing and internal maintenance teams End result: year-over-year growth in Adjusted EBITDA and "net" cash flow Advance development pipeline, with focus on best opportunities and disciplined spending Continue returning capital to shareholders |
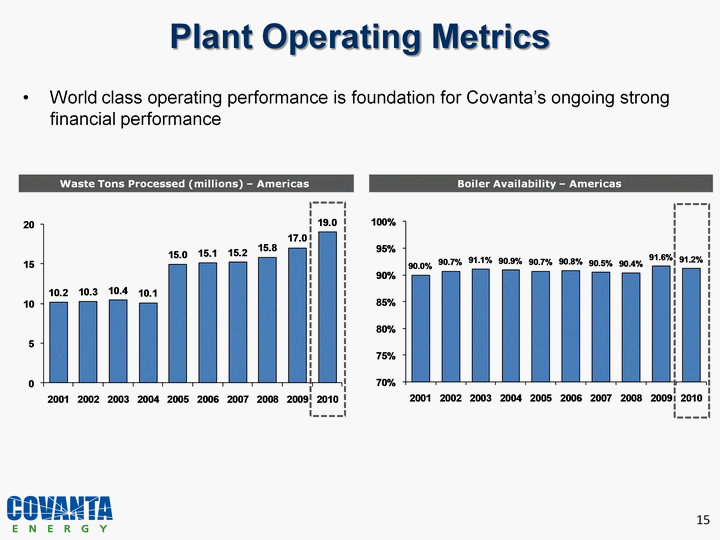
| Plant Operating Metrics World class operating performance is foundation for Covanta's ongoing strong financial performance Waste Tons Processed (millions) - Americas Boiler Availability - Americas |

| Summary of Consolidated Financial Results Fourth Quarter (Unaudited, $ in millions, except EPS) Q4 2009 Actual Q4 2010 Actual Variance 2010 vs. 2009 Revenue $368 $419 $51 Net Income Attributable to Covanta $28 $23 ($5) Adjusted EBITDA $140 $147 $7 Free Cash Flow (1) $141 $86 ($55) EPS, excluding special items $0.17 $0.27 $0.10 Decline in year-over-year comparison is due to the anticipated quarterly reversal of positive working capital movements from prior year periods in 2010; full year Free Cash Flow exceeded guidance. |

| Summary Results - Continuing Operations |

| Asia IPP Asset Sales Update Non-core Asia legacy IPP asset sales on track Quezon (Philippines): signed definitive agreement December 2010 - close H1 2011 Samalpatti (India): signed definitive agreement February 2011 - close H1 2011 Madurai (India): process ongoing Haripur (Bangladesh): process ongoing Targeting $270 to $290 million in gross proceeds 2010 year-end book value of $130 million; if all four sales are completed successfully, estimated net gain of $120 - $140 million after-tax Targeted valuation represents fair market value in light of unique challenges at some of the assets Use of proceeds driven by timing of close and optimizing tax planning Expect to repatriate at least $100 million to be returned to shareholders |

| Bridge to 2011 Guidance Metrics Primary guidance metrics relatively unchanged from 2010 No change to Adjusted EBITDA and Free Cash Flow definitions Introduce "Adjusted EPS", which better reflects ongoing operating performance of our core business ($ in millions, except EPS) 2010 Consolidated Less: Discontinued Operations 2010 Continuing Operations 2011 Guidance Metrics: Continuing Operations (1) Adjusted EBITDA $531 ($61) $470 $480 - $520 Free Cash Flow $357 ($39) $318 $250 - $300 Adjusted EPS $0.69 ($0.27) $0.42 $0.40 - $0.55 2011 Guidance Metrics Bridge from 2010 Results As of February 9, 2011. |

| Capitalization Summary (1) Debt balances are presented at principal value, not book value. Net debt is calculated as total principal amount of debt outstanding less cash & cash equivalents and debt service principal-related restricted funds. (2) From Continuing Operations. (3) Capitalization is calculated as total debt outstanding plus stockholders' equity. Strong balance sheet with ample liquidity 12/31/10 cash balance reflects payment of special dividend and share repurchases Corporate debt increased in 2010 due to Q4 issuance of new senior notes (net of tender for convertible debentures) Significant deleveraging of project debt continued in 2010; repaid ~$800 million over past 5 years |

| Free Cash Flow Uses and Availability (Unaudited, $ in millions) 2009 2010 Estimated 2011 (1) Free Cash Flow From Continuing Operations $300 $318 $250 - $300 Net cash used for scheduled project debt prepayment (121) (170) ~ (102) Net cash used for scheduled corporate debt repayment (7) (7) ~ (7) Distributions to partners of non-controlling interests (6) (6) ~ (6) Free Cash Flow Available After Scheduled Payments $166 $135 $135 - $185 2011 Capital Plan: Significant portion of available Free Cash Flow to be distributed to shareholders absent growth investments Plan to return additional capital with portion of Asia asset sale proceeds As of February 9, 2011. |

| Tax Outlook Efficient use of NOLs continues to represent significant value for shareholders 2011 tax outlook: Expect estimated tax rate from continuing operations in range of 40-45% (versus 41% in 2010) Expect cash taxes for continuing operations to be in the range of $10-15 million NOL outlook: Year-end 2010 U.S. Federal NOL balance of ~$400 million Currently forecast full Federal tax shield well into mid-decade (Unaudited, $ in millions) 2008 2009 2010 Book Taxes $79 $42 $24 Cash Taxes (net of refunds) 17 2 5 Net $62 $40 $19 |
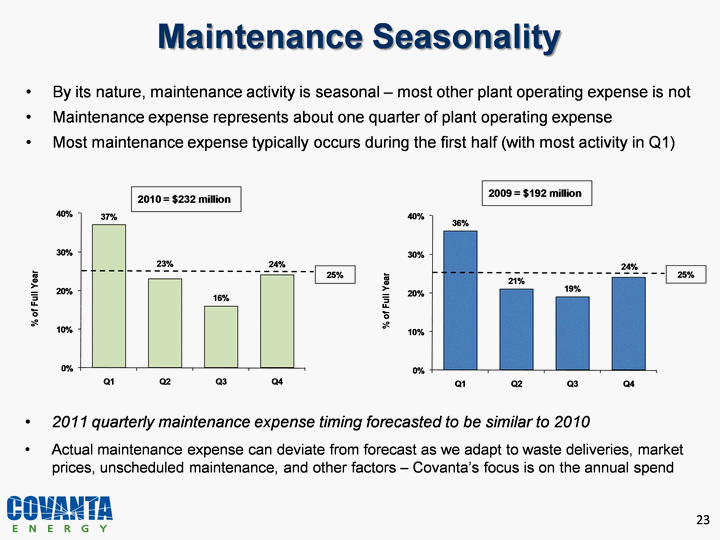
| Maintenance Seasonality By its nature, maintenance activity is seasonal - most other plant operating expense is not Maintenance expense represents ~25% of plant operating expense Most maintenance expense typically occurs during the first half (with most activity in Q1) 2011 quarterly maintenance expense forecasted to be similar to 2010 Actual maintenance expense can deviate from forecast as we adapt to waste deliveries, market prices, unscheduled maintenance, and other factors - Covanta's focus is on the annual spend |

| Historically, Covanta's quarterly financial performance is seasonal Seasonal maintenance activity Annual service contract incentive revenues typically earned in Q2 and Q4 Historical Operating Income trend: Specific factors likely to drive Q1 2011 vs. Q1 2010 Revenue and related expenses up marginally: escalation, construction activity and full quarter of acquired Dade facility Maintenance activity expected to be similar to 2010 Higher interest expense due to recent refinancing Significant positive working capital benefit in 2010 not expected to repeat Q1 2011 Outlook |

| SUPPLEMENTAL SCHEDULES COVANTA HOLDING CORPORATION 2010 YEAR END EARNINGS CONFERENCE CALL February 10, 2011 |
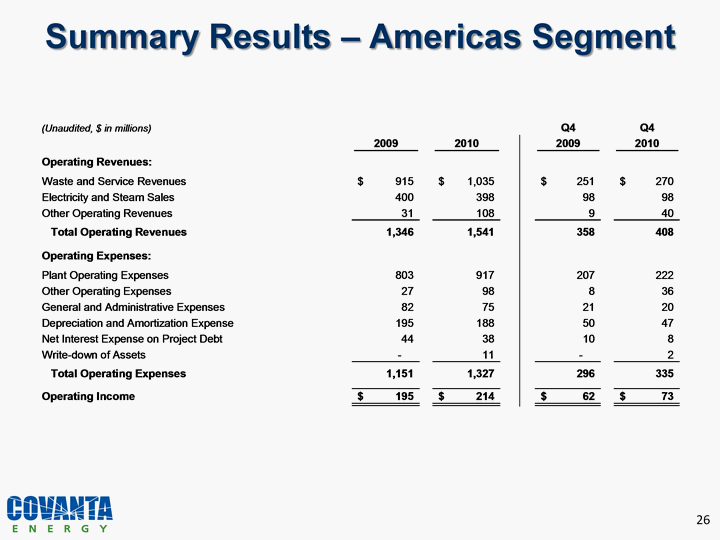
| Summary Results - Americas Segment |

| Non-GAAP Financial Measures We use a number of different financial measures, both United States generally accepted accounting principles ("GAAP") and non-GAAP, in assessing the overall performance of our business. To supplement our assessment of 2010 results prepared in accordance with GAAP, we used the measures of Adjusted EBITDA, Free Cash Flow, and Diluted Earnings Per Share, Excluding Special Items, which are non-GAAP measures as defined by the Securities and Exchange Commission. To supplement our assessment of 2011 results, we have determined that we will use Adjusted EBITDA, Free Cash Flow, and Adjusted EPS, and no longer use Diluted Earnings Per Share, Excluding Special Items. The non-GAAP financial measures of Adjusted EBITDA, Free Cash Flow, Diluted Earnings Per Share, Excluding Special Items, and Adjusted EPS as described and used in the following supplemental schedules are not intended as a substitute or as an alternative to net income, cash flow provided by operating activities or diluted earnings per share as indicators of our performance or liquidity or any other measures of performance or liquidity derived in accordance with GAAP. In addition, our non- GAAP financial measures may be different from non-GAAP measures used by other companies, limiting their usefulness for comparison purposes. The presentations of Adjusted EBITDA, Free Cash Flow, Diluted Earnings Per Share, Excluding Special Items and Adjusted EPS are intended to enhance the usefulness of our financial information by providing measures which management internally use to assess and evaluate the overall performance of its business and those of possible acquisition candidates, and highlight trends in the overall business. |

| Non-GAAP Financial Measure Free Cash Flow Free Cash Flow is defined as cash flow provided by operating activities less maintenance capital expenditures, which are capital expenditures primarily to maintain our existing facilities. We use the non-GAAP measure of Free Cash Flow as a criterion of liquidity and performance-based components of employee compensation. We use Free Cash Flow as a measure of liquidity to determine amounts we can reinvest in our core businesses, such as amounts available to make acquisitions, invest in construction of new projects or make principal payments on debt. In order to provide a meaningful basis for comparison, we are providing information with respect to our Free Cash Flow for the three and twelve months ended December 31, 2010 and 2009, reconciled for each such periods to cash flow provided by operating activities, which we believe to be the most directly comparable measure under GAAP. |

| Non-GAAP Reconciliation: Calculation of Free Cash Flow As of February 9, 2011. |
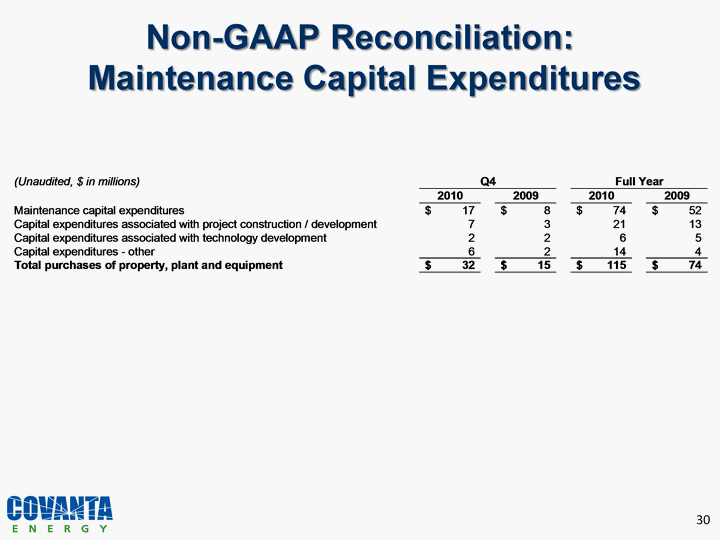
| Non-GAAP Reconciliation: Maintenance Capital Expenditures |

| Non-GAAP Financial Measure Adjusted EBITDA We use Adjusted EBITDA to provide further information that is useful to an understanding of the financial covenants contained in the credit facilities of our most significant subsidiary, Covanta Energy, through which we conduct our core waste and energy services business, and as additional ways of viewing aspects of its operations that, when viewed with the GAAP results and the accompanying reconciliations to corresponding GAAP financial measures, provide a more complete understanding of our core business. The calculation of Adjusted EBITDA is based on the definition in Covanta Energy's credit facilities, which we have guaranteed. Adjusted EBITDA is defined as earnings before interest, taxes, depreciation and amortization, as adjusted for additional items subtracted from or added to net income. Because our business is substantially comprised of that of Covanta Energy, our financial performance is substantially similar to that of Covanta Energy. For this reason, and in order to avoid use of multiple financial measures which are not all from the same entity, the calculation of Adjusted EBITDA and other financial measures presented herein are ours, measured on a consolidated basis. In order to provide a meaningful basis for comparison, we are providing information with respect to our Adjusted EBITDA for the three and twelve months ended December 31, 2010 and 2009, reconciled for each such periods to net income and cash flow provided by operating activities, which are believed to be the most directly comparable measures under GAAP. |

| Non-GAAP Reconciliation: Net Income to Adjusted EBITDA As of February 9, 2011. |
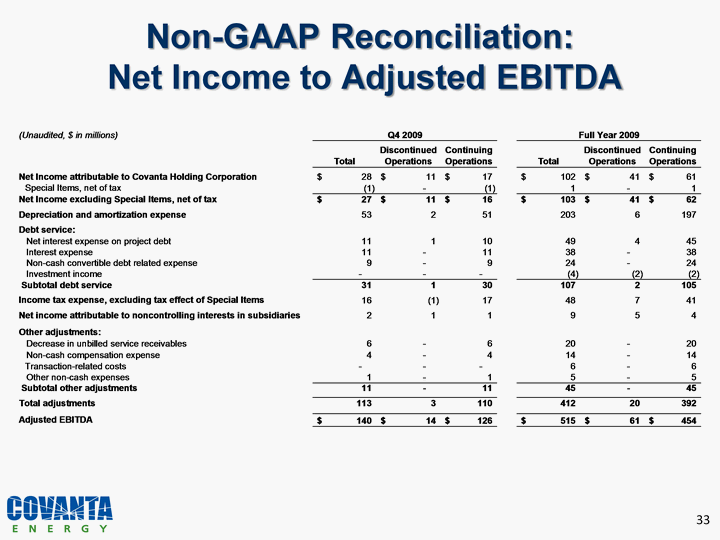
| Non-GAAP Reconciliation: Net Income to Adjusted EBITDA |

| Non-GAAP Reconciliation: Operating Cash Flow to Adjusted EBITDA As of February 9, 2011. |

| Non-GAAP Financial Measure EPS, Excluding Special Items Diluted Earnings Per Share, Excluding Special Items excludes certain income and expense items that are not representative of our ongoing business and operations, which are included in the calculation of Diluted Earnings Per Share in accordance with GAAP. The following items are not all-inclusive, but are examples of items that would be included as Special Items in prior comparative and future periods. They would include write-down of assets, significant gains or losses from the disposition of businesses, gains or losses on the extinguishment of debt and other significant items that would not be representative of our ongoing business. We used the non-GAAP measure of Diluted Earnings Per Share, Excluding Special Items to enhance the usefulness of our financial information by providing a measure which management internally uses to assess and evaluate the overall performance and highlight trends in the ongoing business. In order to provide a meaningful basis for comparison, we are providing information with respect to our Diluted Earnings Per Share, Excluding Special Items for the three and twelve months ended December 31, 2010 and 2009, reconciled for each such period to diluted earnings per share, which is believed to be the most directly comparable measures under GAAP. |

| Non-GAAP Reconciliation: EPS, Excluding Special Items |
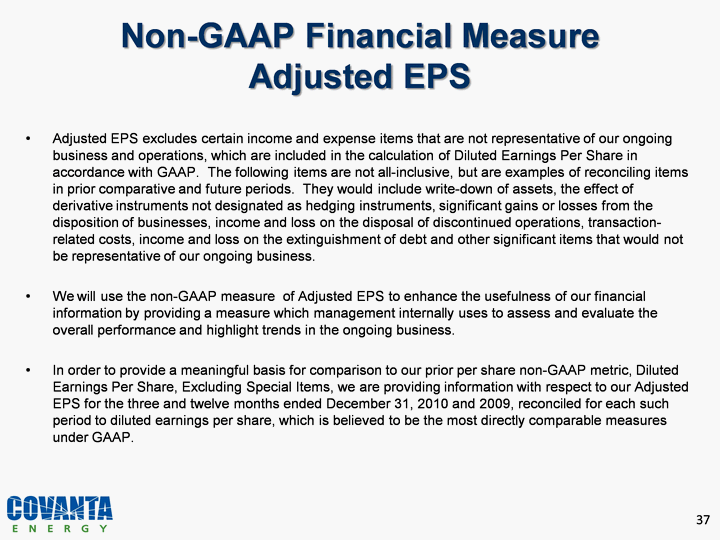
| Non-GAAP Financial Measure Adjusted EPS Adjusted EPS excludes certain income and expense items that are not representative of our ongoing core waste and energy services business and operations, which are included in the calculation of Diluted Earnings Per Share in accordance with GAAP. The following items are not all-inclusive, but are examples of reconciling items in prior comparative and future periods. They would include write-down of assets, income and loss attributable to our insurance operations, the effect of derivative instruments not designated as hedging instruments, significant gains or losses from the disposition of businesses, income and loss on the disposal of discontinued operations, transaction-related costs, income and loss on the extinguishment of debt and other significant items that would not be representative of our ongoing waste and energy services business. We will use the non-GAAP measure of Adjusted EPS to enhance the usefulness of our financial information by providing a measure which management internally uses to assess and evaluate the overall performance and highlight trends in the ongoing waste and energy services business. In order to provide a meaningful basis for comparison to our prior per share non-GAAP metric, Diluted Earnings Per Share, Excluding Special Items, we are providing information with respect to our Adjusted EPS for the three and twelve months ended December 31, 2010 and 2009, reconciled for each such period to diluted earnings per share, which is believed to be the most directly comparable measures under GAAP. |

| Non-GAAP Reconciliation: Adjusted EPS As of February 9, 2011. |

| Non-GAAP Financial Measure 2010 Guidance Reconciliations Net Income to Adjusted EBITDA Initial 2010 guidance, as presented on February 22, 2010. Revised 2010 guidance, as presented on October 20, 2010. |

| Non-GAAP Financial Measure 2010 Guidance Reconciliations Operating Cash Flow to Adjusted EBITDA Initial 2010 guidance, as presented on February 22, 2010. Revised 2010 guidance, as presented on October 20, 2010. |

| Non-GAAP Financial Measure 2010 Guidance Reconciliations Operating Cash Flow to Free Cash Flow Initial 2010 guidance, as presented on February 22, 2010. Revised 2010 guidance, as presented on October 20, 2010. |
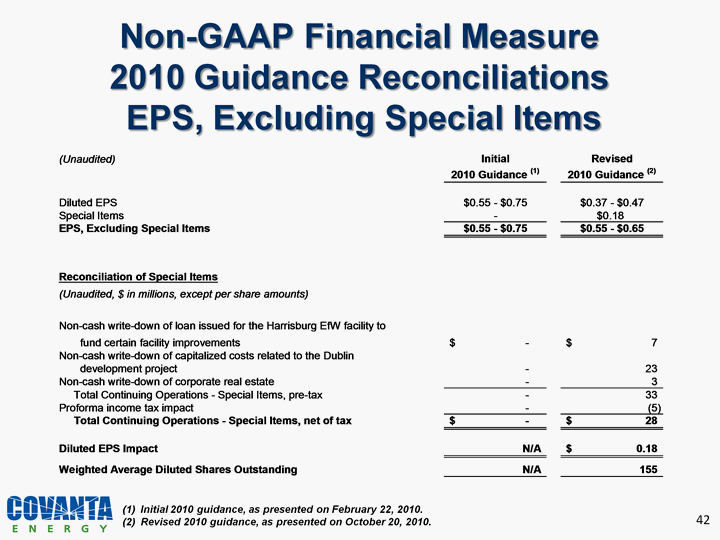
| Non-GAAP Financial Measure 2010 Guidance Reconciliations EPS, Excluding Special Items Initial 2010 guidance, as presented on February 22, 2010. Revised 2010 guidance, as presented on October 20, 2010. |
