Attached files
| file | filename |
|---|---|
| EX-99.1 - EARNINGS RELEASE FOR 4Q AND YE 2010 - TEMPLE INLAND INC | tin8kex99120110208.htm |
| 8-K - 8-K FURNISHING EARNINGS RELEASE FOR 4Q AND YE 2010 - TEMPLE INLAND INC | tin8k20110208.htm |

1
Our job is to be the best
Fourth Quarter and Full
Year 2010 Earnings
Year 2010 Earnings

2
This presentation contains “forward-looking statements” within the meaning of the federal
securities laws. These statements reflect management’s current views with respect to future events
and are subject to risk and uncertainties. We note that a variety of factors and uncertainties could
cause our actual results to differ significantly from the results discussed in the forward-looking
statements. Factors and uncertainties that might cause such differences include, but are not
limited to: general economic, market, or business conditions; the opportunities (or lack thereof)
that may be presented to us and that we may pursue; fluctuations in costs and expenses including
the costs of raw materials, purchased energy, and freight; changes in interest rates; demand for
new housing; accuracy of accounting assumptions related to impaired assets, pension and
postretirement costs, contingency reserves and income taxes; competitive actions by other
companies; changes in laws or regulations; our ability to execute certain strategic and business
improvement initiatives; the accuracy of certain judgments and estimates concerning the
integration of acquired operations and other factors, many of which are beyond our control. Except
as required by law, we expressly disclaim any obligation to publicly revise any forward-looking
statements contained in this presentation to reflect the occurrence of events after the date of this
presentation.
This presentation includes non-GAAP financial measures. The required reconciliations to GAAP
financial measures are included on our website, www.templeinland.com.
financial measures are included on our website, www.templeinland.com.

3
2010 Consolidated Results
Net income per diluted share
Special items
Net income per diluted share excluding
special items
• 8.2% ROI in 2010 up from 7.0% in 2009
|
2010 |
2009 |
|
$ 1.52
|
$ 1.89
|
|
(0.62)
|
(1.19)
|
|
$ 0.90
|
$ 0.70
|

4
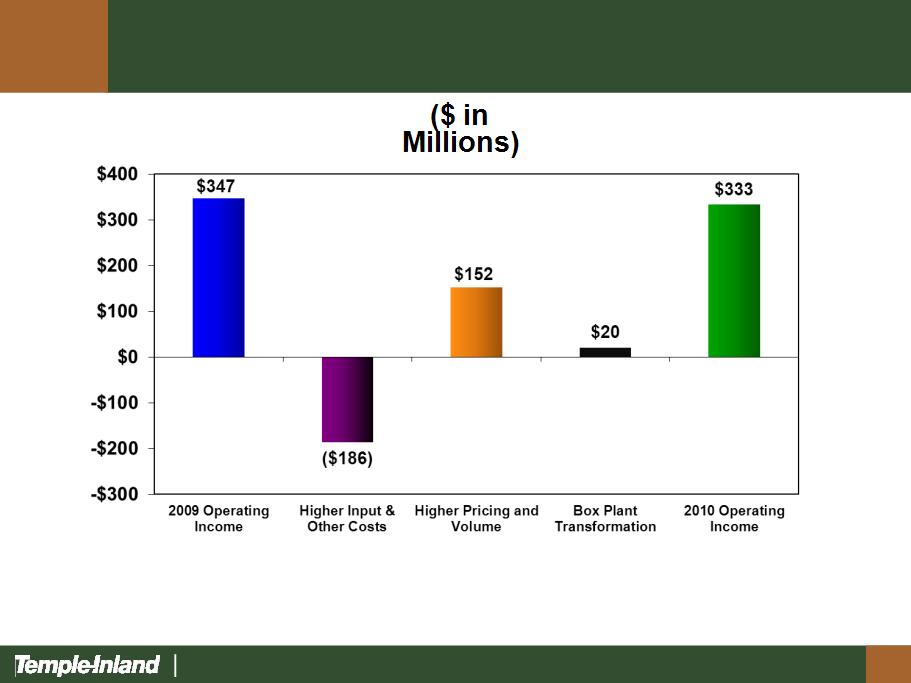
Corrugated Packaging Segment
|
|
2010
|
2009
|
2008
|
|
Revenues
|
$3,153
|
$ 3,001
|
$ 3,190
|
|
Costs and expenses
|
(2,820)
|
(2,654)
|
(2,965)
|
|
Segment operating income
|
$ 333
|
$ 347
|
$ 225
|
($ in Millions)
• Record 16.5% ROI in 2009 and 2010
• Fifth consecutive year of above cost of capital returns
5
Corrugated Packaging Segment
Earnings
Earnings
6
Box Plant Transformation
• Drive Low Cost and Increase
Asset Utilization
Asset Utilization
– Fewer Plants
– Fewer Machines
– Fewer People
• Improve Mix & Margins
C
U
L
T
U
R
E
Lower cost and higher margins

7
Box Plant Transformation I
• EBIT (Lower Costs) $80MM/Year
– Fewer Plants 4
– Fewer Machines 88
– Fewer Positions 1,157
• Investment $174MM
• ROI 46%
Complete
Box Plant Transformation I lowered costs by $10 million in 2010

8
Box Plant Transformation II
• EBIT (Lower Costs) $100MM/Year
– Fewer Plants 12
– Fewer Machines 65
– Fewer Positions 900
• Investment $250MM
• ROI 40%
Box Plant Transformation II lowered costs by $10 million in 2010

9
Box Plant Transformation
Box Plant Transformation will reduce cost by $180 million
67
51
348
194
7,911
5,837
2006 Pro-Forma Year-end 2013
(24%)
(44%)
(26%)
10
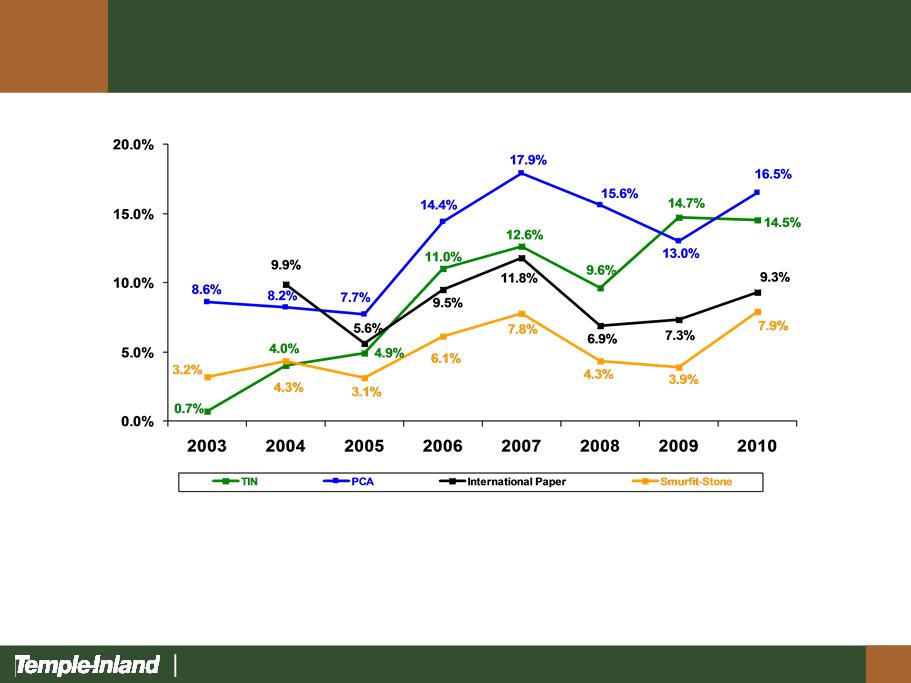
Corrugated Packaging Comparative
Peer Group Returns(ROA)
10
Notes: (1) EBIT excludes special items - For TIN and IP as reported by segment; for PCA, Gross Profit-selling and administrative
expenses; for SSCC, for containerboard, corrugated containers and reclamation operations
expenses; for SSCC, for containerboard, corrugated containers and reclamation operations
(2) Adjustments to EBIT - For SSCC, beginning in 2007, working capital interest was no longer charged to operations.
Based on restatement of 2006 and 2005 data, EBIT is adjusted upward by $70 million for the years 2004 and 2003.
Based on restatement of 2006 and 2005 data, EBIT is adjusted upward by $70 million for the years 2004 and 2003.
(3) Assets (beginning of year) - For TIN and IP as reported by segment adjusted for acquisitions made in Q3 2008; for PCA,
consolidated Total Assets; for SSCC, consolidated Total Assets excluding Consumer Packaging prior to 2007. On January 26, 2009 SSCC
filed for Chapter 11 Bankruptcy and emerged on June 30, 2010. For 2010, the Successor Total Assets (after adjustments for the Plan of Reorganization
and Fresh Start) is used. For 2009, the Successor Total Assets, adjusted for actual cash and cash equivalents is used.
(4) Restatements - Most recent reported data used to replace prior data, as reported, when available.

11
Building Products Segment
|
|
2010
|
2009
|
2008
|
|
Revenues
|
$ 646
|
$ 576
|
$ 694
|
|
Costs and expenses
|
(665)
|
(603)
|
(734)
|
|
Segment operating income (loss)
|
$ (19)
|
$(27)
|
$ (40)
|
($ in Millions)
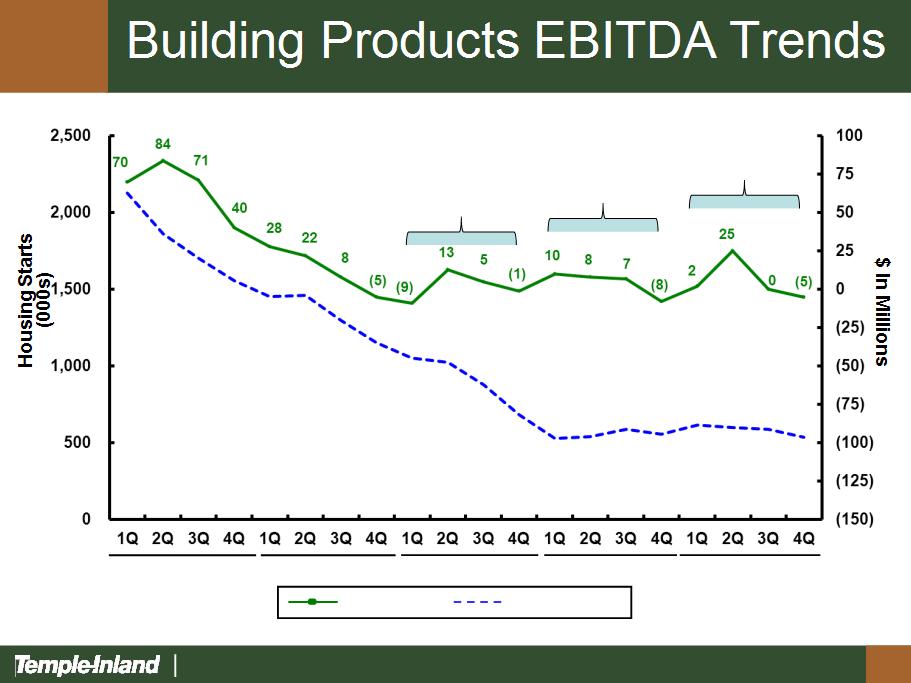
12
12
Housing Starts
TIN EBITDA
2006
2007
2008
2009
2010
$8
$17
$22

13
Fourth Quarter 2010 Consolidated
Results
Results
Net income per share
Special items
Net income (loss) per share
excluding special items
|
Q4
2010
|
Q4
2009
|
Q3
2010
|
|
$ 0.24
|
$ 0.34
|
$ 1.13
|
|
0.07
|
(0.41)
|
(0.72)
|
|
$ 0.31
|
$(0.07)
|
$ 0.41
|
• Special items - $0.07 charge primarily related to Box
Plant Transformation II
Plant Transformation II
• Income tax benefit of $0.05 per share primarily related to
the expected utilization of state net operating loss carry-
forwards previously reserved
the expected utilization of state net operating loss carry-
forwards previously reserved
• Q4 2010 ROI - 9.2%

14
Corrugated Packaging Segment
($ in Millions)
|
|
Q4
2010
|
Q4
2009
|
Q3
2010
|
|
Revenues
|
$ 806
|
$ 715
|
$ 809
|
|
Costs and expenses
|
(703)
|
(658)
|
(688)
|
|
Segment operating income
|
$ 103
|
$ 57
|
$ 121
|
• Record fourth quarter and 20.4% ROI
15
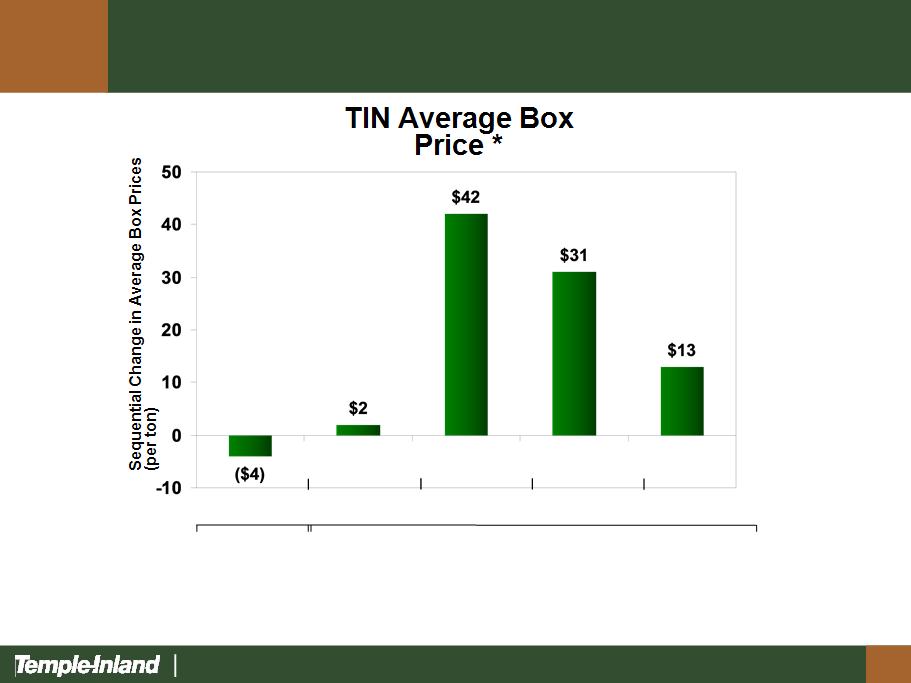
Corrugated Packaging Segment
* Average box price realization includes the impact of mix of business
2009
Q4 Q1 Q2 Q3 Q4
2010
16
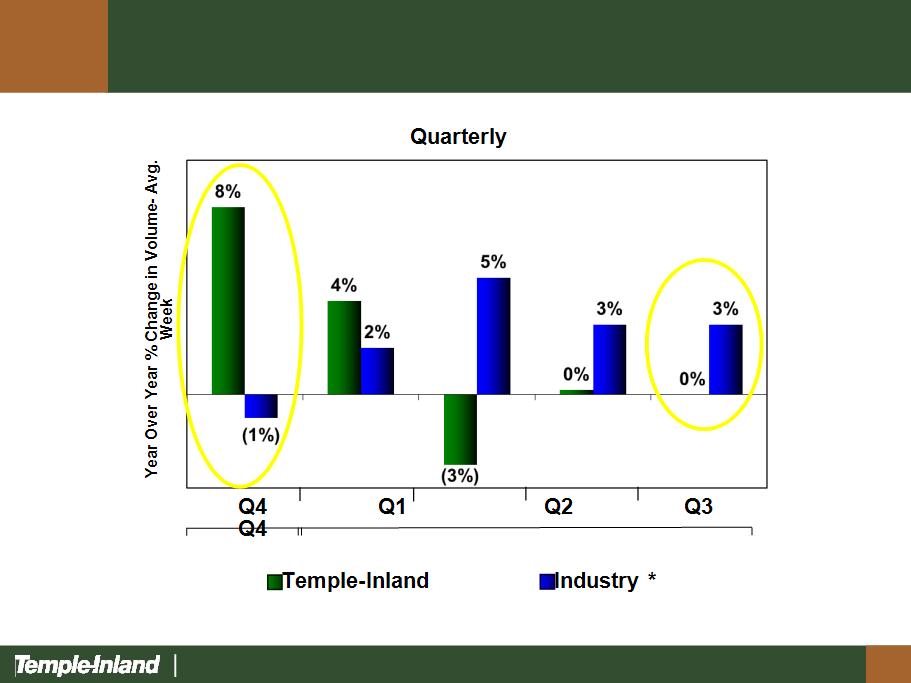
Corrugated Packaging Segment
Box Shipments
* Source: Fibre Box Association
2009
2010

17
Corrugated Packaging Segment
Fourth Quarter
• 24,000 tons of maintenance related downtime
• 32,000 tons lower outside sales compared
with third quarter
with third quarter
• Inventories increased by 40,000 tons from
third quarter’s unsustainably low levels
third quarter’s unsustainably low levels
• Inventories consistent with year-end 2009 levels
18
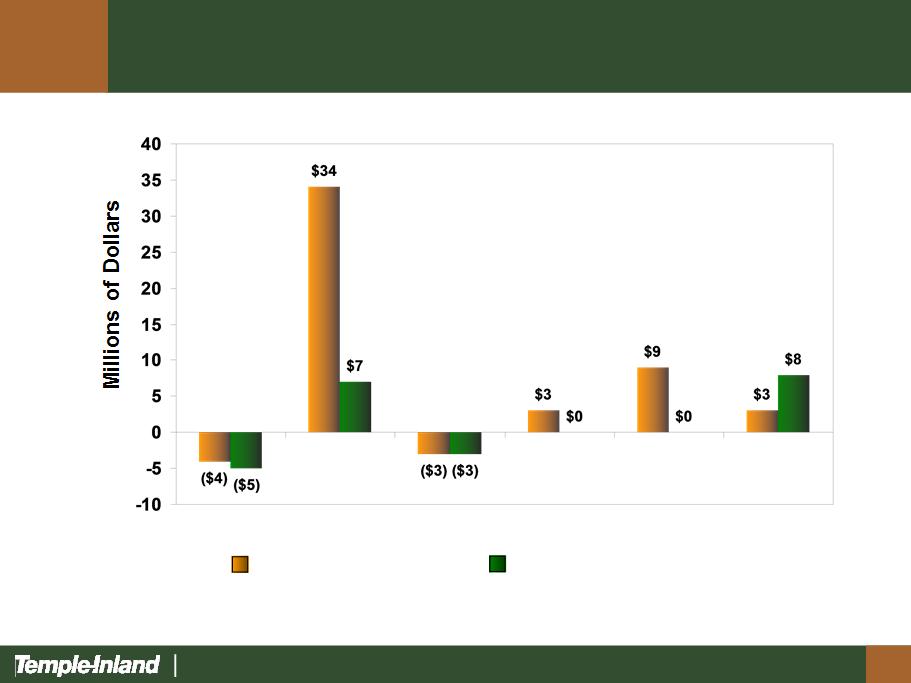
Corrugated Packaging Segment
Q4 2010 vs. Q4 2009 Q4 2010 vs. Q3 2010
Virgin Fiber OCC Energy Chemicals Freight Wax
*Key input cost include the impact of inventory changes
Key Input Cost Changes*

19
Looking Forward
First Quarter
• Higher input costs
• Seasonally lower box prices
• Weather
• 24,000 tons maintenance downtime

20
Building Products Segment
($ in Millions)
|
|
Q4
2010
|
Q4
2009
|
Q3
2010
|
|
Revenues
|
$ 146
|
$ 130
|
$ 157
|
|
Costs and expenses
|
(161)
|
(148)
|
(167)
|
|
Segment operating income
(loss) |
$ ( 15)
|
$ ( 18)
|
$ (10)
|
• Q4 2010 actual housing starts fell 2% vs. Q4 2009
• Q4 2010 actual housing starts fell 25% vs. Q3 2010
21
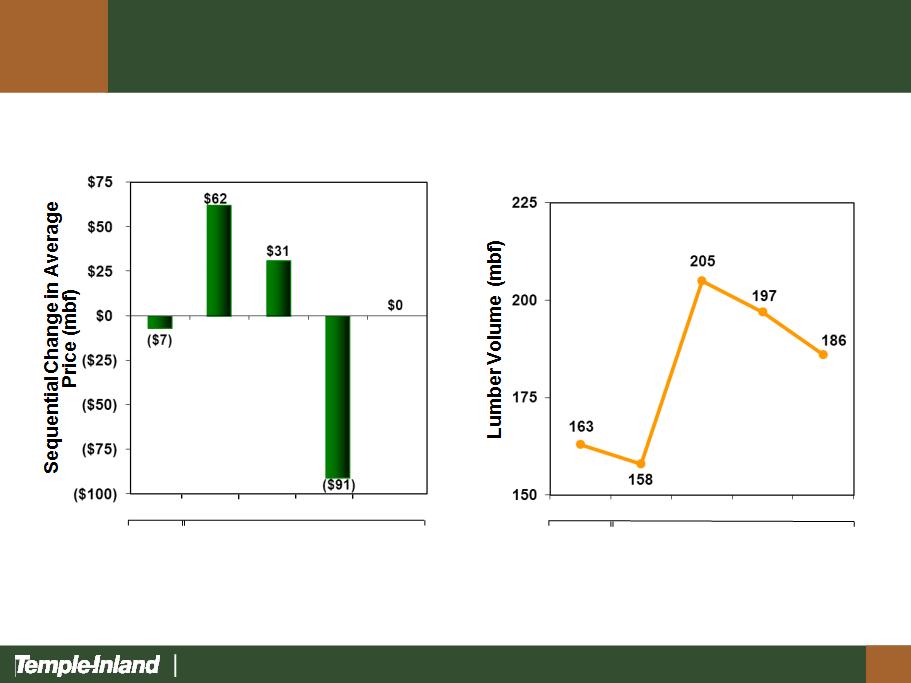
Building Products Segment
Lumber
Price
2009
2010
Q4 Q1 Q2 Q3 Q4
Volume
2009
2010
Q4 Q1 Q2 Q3 Q4
22
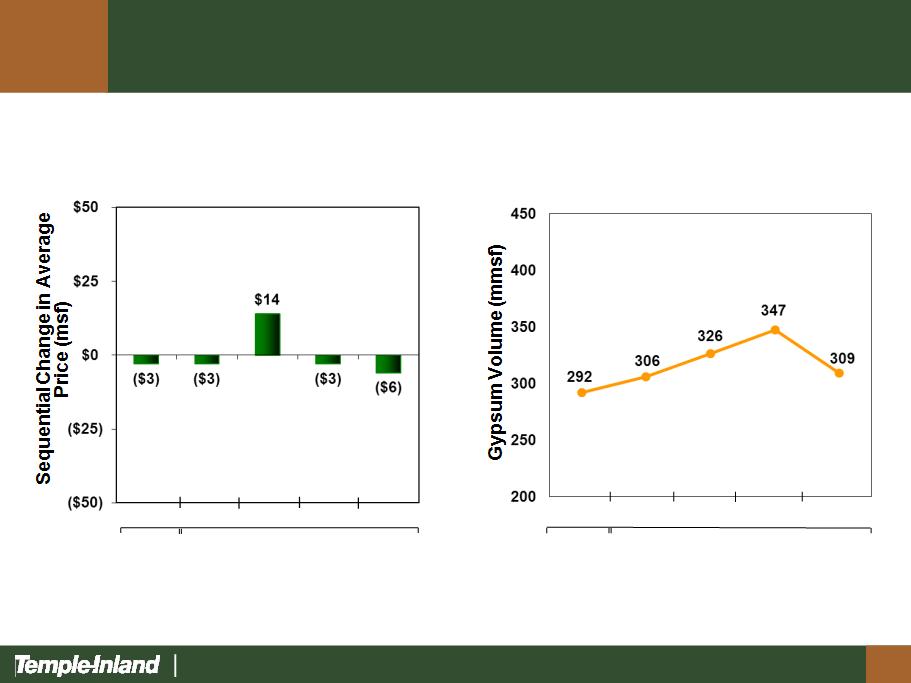
Building Products Segment
Gypsum
Volume
2009
2010
Q4 Q1 Q2 Q3 Q4
Price
Q4 Q1 Q2 Q3 Q4
2009
2010
23
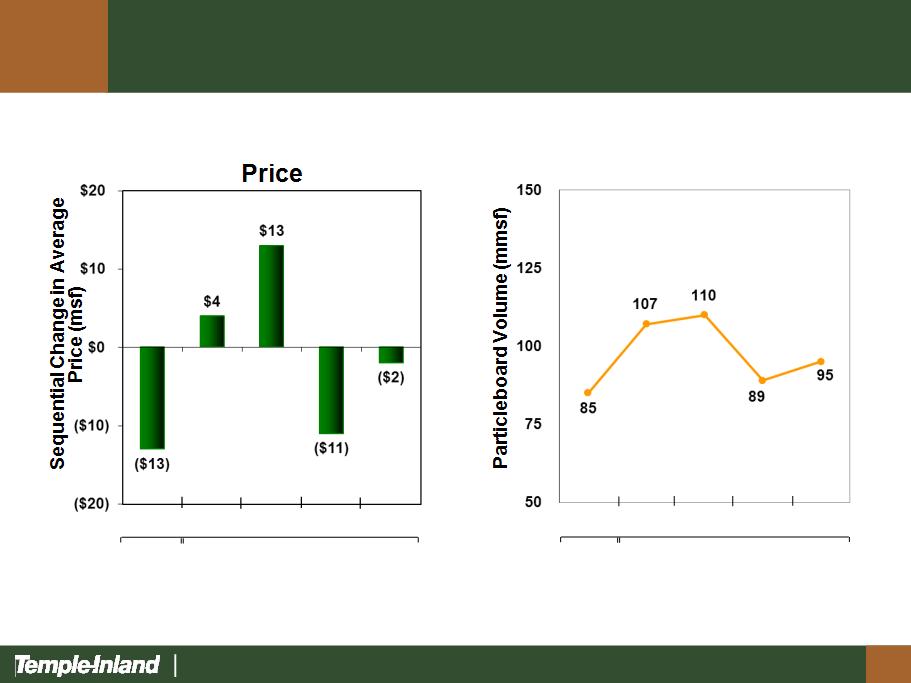
Particleboard
Volume
Building Products Segment
2009
2010
Q4 Q1 Q2 Q3 Q4
Q4 Q1 Q2 Q3 Q4
2009
2010

24
2010 Fourth Quarter and Full Year
Financial Highlights
Financial Highlights
• Cash provided by operations $260 million for the year
– Operations provided $334 million
– Working capital was a use of $74 million
• Balance Sheet
– Long-term debt $718 million at year-end vs.
$710 million a year ago
$710 million a year ago
– Debt/total capital 44% at year-end vs. 47% a year ago
• Liquidity
– Committed credit of $960 million at year-end 2010
– Unused borrowing capacity of $766 million at year-end
2010

25
2011
• Capital Expenditures
– 2010 : $233MM
– 2011 : $225 - 235MM
• Depreciation
– 2010 : $193MM
– 2011 : $200MM
• Pension
– Net periodic pension expense in 2011
essentially flat: $60MM
essentially flat: $60MM
– No anticipated required cash contribution in
2011
2011
– Voluntary, discretionary contribution in 2011:
$30MM
$30MM

26
2011
• General and administrative expenses
– 2010 : $70MM
– 2011 : $70 - $72MM
• Share-based and long-term incentive
compensation
compensation
– 2010 : $33MM
– 2011 : $36MM, $1 change in share price = $2.5
million
million
• Interest expense
– 2010 : $51MM
– 2011 : $50 - $52 MM
• Income tax
– 2011 effective tax rate = 40%
– 2011 cash tax rate = 10%

27
2011 Financial Priorities
• Return cash to shareholders
– Raised annual dividend by 18% to
$0.52 per share
$0.52 per share
• Reduce debt
• Invest in our business
• Profitably grow

28
Our job is to be the best