Attached files
| file | filename |
|---|---|
| 8-K - FORM 8-K - REGAL BELOIT CORP | c11767e8vk.htm |
| EX-99.1 - EXHIBIT 99.1 - REGAL BELOIT CORP | c11767exv99w1.htm |
Exhibit 99.2

| 4th Quarter 2010 Earnings Call February 3, 2011 Welcome! |

| 1 Safe Harbor Statement This presentation contains "forward-looking statements" as defined in the Private Securities Litigation Reform Act of 1995. Forward-looking statements represent our management's judgment regarding future events. In many cases, you can identify forward-looking statements by terminology such as "may," "will," "plan," "expect," "anticipate," "estimate," "believe," or "continue" or the negative of these terms or other similar words. Actual results and events could differ materially and adversely from those contained in the forward-looking statements due to a number of factors, including: our ability to timely and successfully consummate the acquisition of EPC, including the ability to satisfy all of the conditions precedent to consummation of the transaction; our ability to timely and successfully realize the potential synergies of the EPC transaction; economic changes in global markets where we do business, such as reduced demand for products we sell, weakness in the housing and commercial real estate markets, currency exchange rates, inflation rates, interest rates, recession, foreign government policies and other external factors that we cannot control; fluctuations in commodity prices and raw material costs; cyclical downturns affecting the global market for capital goods; unexpected issues, costs or liabilities arising from the acquisition and integration of EPC and other acquired companies and businesses, or the effects of purchase accounting that may be different than expected; marketplace acceptance of new and existing products including the loss of, or a decline in business from, any significant customers; the impact of capital market transactions that we may effect; the availability and effectiveness of our information technology systems; unanticipated costs associated with litigation, product warranty or product liability matters; the effects of increased international and domestic competition on sales of our energy efficient products; actions taken by our competitors, including new product introductions or technological advances, and other events affecting our industry and competitors; difficulties in staffing and managing foreign operations; other domestic and international economic and political factors unrelated to our performance, such as the current substantial weakness in economic and business conditions; and other risks and uncertainties including but not limited to those described in Item 1A-Risk Factors of the Company's Annual Report on Form 10-K filed on March 2, 2010 and from time to time in our reports filed with U.S. Securities and Exchange Commission. All subsequent written and oral forward-looking statements attributable to us or to persons acting on our behalf are expressly qualified in their entirety by the applicable cautionary statements. The forward-looking statements included in this presentation are made only as of their respective dates, and we undertake no obligation to update these statements to reflect subsequent events or circumstances. |

| 2 2010 Annual Sales of $2,238M 22.5% Growth Added sales of $119.5M from acquisitions 17.9% of sales of energy efficient products 2010 Earnings of $149.4M Increase of 57% over 2009 Record EPS of $3.84 per share 2010 Overview |

| 3 Sales Growth Sales up 20.0% in 4Q10 and up 22.5% in 2010. 4Q10 Price Increase realization beginning in December 2010. Financial Highlights Impact of Acquired Businesses $56.8 million Sales in 4Q10 and $119.5 million Sales in 2010 from businesses acquired in 2010 Profitability weighed down by purchase accounting adjustments Cost Inflation Copper prices up 19% in 4Q10 from 3Q10. Steel prices trending up in 2011 LIFO $13.4 million LIFO expense in 4Q10 $15 million LIFO income in 4Q09 $28.4 million difference |

| 4 4 1st Qtr 2nd Qtr 3rd Qtr 4th Qtr 2010 0.24 0.27 0.26 0.23 * Excludes Acquisitions 24% 27% 26% 23% Percentage of Sales by Quarter Five Year Average Number of Quarterly Workdays 63 63 63 64 64 64 63 60 64 63 63 60 |

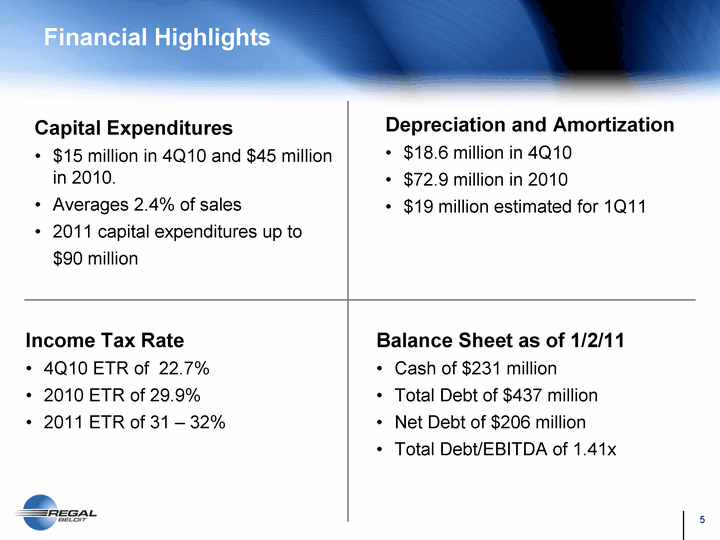
| 5 Financial Highlights Capital Expenditures $15 million in 4Q10 and $45 million in 2010. Averages 2.4% of sales 2011 capital expenditures up to $90 million Income Tax Rate 4Q10 ETR of 22.7% 2010 ETR of 29.9% 2011 ETR of 31 - 32% Depreciation and Amortization $18.6 million in 4Q10 $72.9 million in 2010 $19 million estimated for 1Q11 Balance Sheet as of 1/2/11 Cash of $231 million Total Debt of $437 million Net Debt of $206 million Total Debt/EBITDA of 1.41x |

| 6 Business Highlights For The Quarter Mechanical Sales up 18.5% Asian Sales up 16% Commercial and Industrial Sales up 12.5% HVAC Sales up 1% |

| 7 COPPER MARKET 6/10/2010 7/10/2010 8/1/2010 9/10/2010 10/10/2010 11/10/2010 12/10/2010 1/10/2011 Copper Comex 2.9371 3.0643 3.3198 3.518 3.7731 3.8421 4.1697 4.3443 |

| 8 North American based manufacturer of custom drives and mechanical systems targeting the oil and gas and commercial HVAC applications 2011 Sales estimated to be $70 million 2011 EPS accretion estimated to be $.07 Acquisition Update Unico European based blower systems manufacturer targeting commercial refrigeration 2011 Sales estimated to be $80 million 2011 EPS accretion estimated to be $.08 Elco |

| 9 Business Highlights For The Quarter New Products |

| 10 Introducing Unico CRP(r) (Crank Rod Pump) Innovative Alternative to Beam Pumps for Oil Wells Up to 3,000 Ft Mounts Directly To Well Head Replaces Nodding Donkey Small Footprint For Simple Installation Less Intrusive Logistics Inherent Safety Benefits Hub City Gear Box and Marathon Motor Inside Unico Controller |

| 11 TAKE A WAYS GREAT 2010 1st Qtr 2011 Challenging but bottom line winner Positioned For Strong for Growth New Products Geographic Reach Acquisition Position Balance Sheet Remains Strong |

| 12 Thank You! |

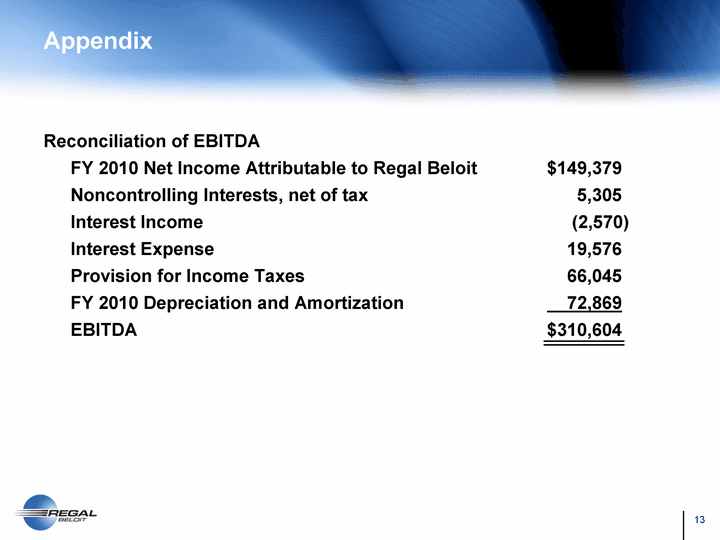
| 13 Appendix Reconciliation of EBITDA FY 2010 Net Income Attributable to Regal Beloit $149,379 Noncontrolling Interests, net of tax 5,305 Interest Income (2,570) Interest Expense 19,576 Provision for Income Taxes 66,045 FY 2010 Depreciation and Amortization 72,869 EBITDA $310,604 |
