Attached files
| file | filename |
|---|---|
| 8-K - FORM 8-K - BANCORPSOUTH INC | g25906e8vk.htm |
| EX-99.1 - EX-99.1 - BANCORPSOUTH INC | g25906exv99w1.htm |
| EX-99.2 - EX-99.2 - BANCORPSOUTH INC | g25906exv99w2.htm |
Exhibit
99.3

| BancorpSouth Financial Information as of December 31, 2010 |

| Forward Looking Information 2 Certain statements contained in this presentation and the accompanying slides may not be based on historical facts and are "forward-looking statements" within the meaning of Section 27A of the Securities Act of 1933, as amended, and Section 21E of the Securities Exchange Act of 1934, as amended. These forward- looking statements may be identified by reference to a future period or by the use of forward-looking terminology, such as "anticipate," "believe," "estimate," "expect," "foresee," "may," "might," "will," "intend," "could," "would" or "plan," or future or conditional verb tenses, and variations or negatives of such terms. These forward-looking statements include, without limitation, statements about long-term prospects for shareholder value, the impact of the prevailing economy, results of operations, financial condition, and use of non-GAAP financial measures. We caution you not to place undue reliance on the forward-looking statements contained in this presentation, in that actual results could differ materially from those indicated in such forward-looking statements as a result of a variety of factors. These factors include, but are not limited to, conditions in the financial markets and economic conditions generally, the soundness of other financial institutions, levels of market volatility, the availability of capital if the Company elects or is compelled to seek additional capital, liquidity risk, the credit risk associated with real estate construction, acquisition and development loans, estimates of costs and values associated with real estate construction, acquisition and development loans in the Company's loan portfolio, the adequacy of the Company's allowance for credit losses to cover actual credit losses, governmental regulation and supervision of the Company's operations, changes in interest rates, the impact of monetary policies and economic factors on the Company's ability to attract deposits or make loans, the impact of hurricanes or other adverse weather events, risks in connection with completed or potential acquisitions, dilution caused by the Company's issuance of any additional shares of its common stock to raise capital or acquire other banks, bank holding companies, financial holding companies and insurance agencies, restrictions on the Company's ability to declare and pay dividends, the Company's growth strategy, diversification in the types of financial services the Company offers, competition with other financial services companies, interruptions or breaches in security of the Company's information systems, the Company's ability to improve its internal controls adequately, any requirement that the Company write down goodwill or other intangible assets, the impact of recently enacted financial regulatory reforms, the impact of recent legislation on service charges on core deposit accounts, other factors generally understood to affect the financial results of financial services companies, and other factors detailed from time to time in BancorpSouth's press releases and filings with the Securities and Exchange Commission. BancorpSouth does not undertake any obligation to update or revise forward-looking statements to reflect events or circumstances after the date of this presentation. Certain tabular presentations may not reconcile because of rounding. Unless otherwise noted, any quotes in this presentation can be attributed to company management. |
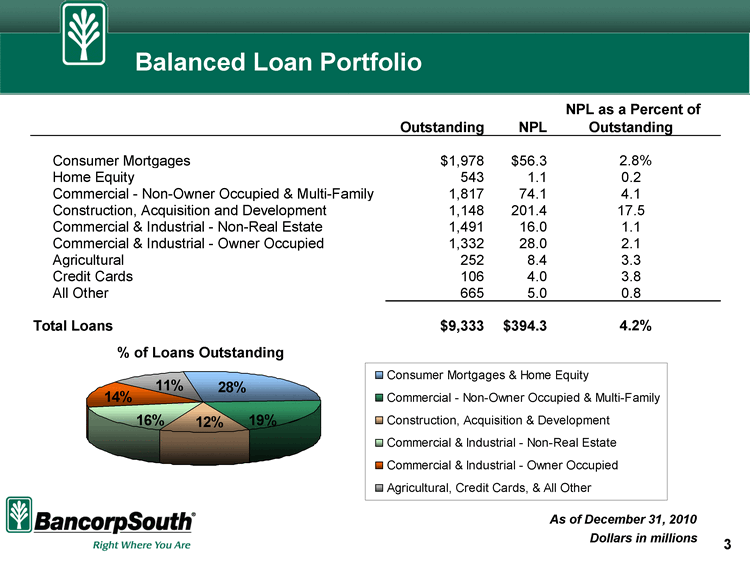
| Dollars in millions As of December 31, 2010 % of Loans Outstanding Balanced Loan Portfolio Outstanding NPL NPL as a Percent of Outstanding Consumer Mortgages $1,978 $56.3 2.8% Home Equity 543 1.1 0.2 Commercial — Non-Owner Occupied & Multi-Family 1,817 74.1 4.1 Construction, Acquisition and Development 1,148 201.4 17.5 Commercial & Industrial — Non-Real Estate 1,491 16.0 1.1 Commercial & Industrial — Owner Occupied 1,332 28.0 2.1 Agricultural 252 8.4 3.3 Credit Cards 106 4.0 3.8 All Other 665 5.0 0.8 Total Loans $9,333 $394.3 4.2% Consumer Mortgages & Home Equity Commercial — Non-Owner Occupied & Multi-Family Construction, Acquisition & Development Commercial & Industrial — Non-Real Estate Commercial & Industrial — Owner Occupied Agricultural, Credit Cards, & All Other 3 |
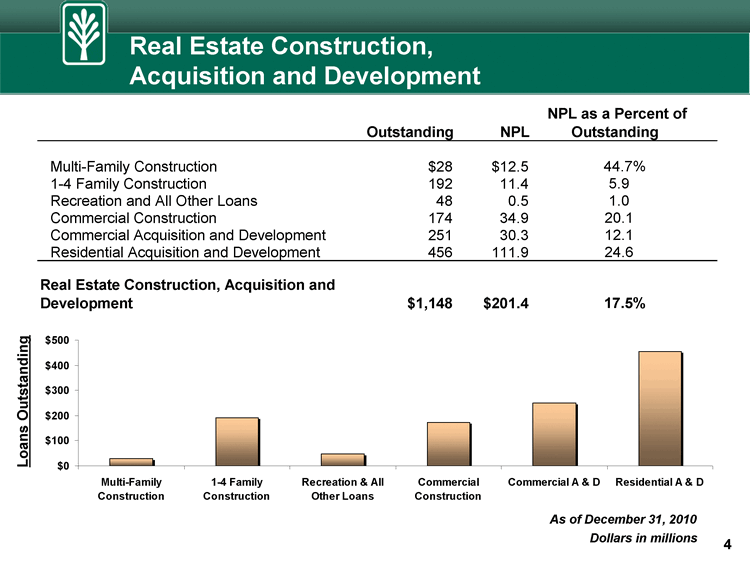
| Real Estate Construction, Acquisition and Development Dollars in millions As of December 31, 2010 Loans Outstanding NPL as a Percent of Outstanding NPL Outstanding Multi-Family Construction $28 $12.5 44.7% 1-4 Family Construction 192 11.4 5.9 Recreation and All Other Loans 48 0.5 1.0 Commercial Construction 174 34.9 20.1 Commercial Acquisition and Development 251 30.3 12.1 Residential Acquisition and Development 456 111.9 24.6 Real Estate Construction, Acquisition and Development $1,148 $201.4 17.5% Multi-Family 1-4 Family Recreation & All Commercial Commercial A & D Residential A & D Construction Construction Other Loans Construction 4 |
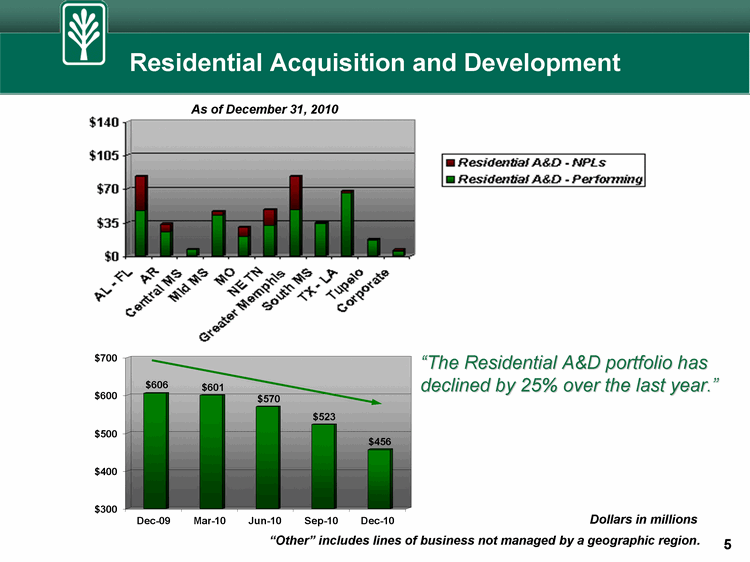
| Residential Acquisition and Development Dollars in millions As of December 31, 2010 "The Residential A&D portfolio has declined by 25% over the last year." "Other" includes lines of business not managed by a geographic region. 5 |

| "Other" includes all other geographic regions and lines of business not managed by a geographic region. YTD Net Charge-Offs Dollars in millions As of December 31, 2010 Greater Memphis AL / FL MO NE TN Other Total Consumer Mortgages $3.3 $4.5 $3.8 $3.7 $8.9 $24.2 Home Equity 0.8 2.2 0.1 0.2 1.8 5.0 Commercial - Non-Owner Occupied & Multi-Family 3.7 2.6 0.4 1.1 5.4 13.2 Construction, Acquisition and Development 52.4 26.5 12.4 5.4 14.9 111.5 Commercial & Industrial — Non-Real Estate 3.0 1.4 2.5 0.6 3.0 10.5 Commercial & Industrial — Owner Occupied 2.1 1.6 0.1 0.3 4.8 8.8 Agricultural 0.8 0.0 0.0 0.0 0.4 1.2 Credit Cards 0.0 0.0 0.0 0.0 3.7 3.7 All Other 1.3 0.2 0.0 0.1 3.2 4.9 Total Net Charge-Offs $67.3 $39.0 $19.5 $11.4 $46.0 $183.1 Greater Memphis AL / FL MO NE TN Other Total Multi-Family Construction $0.1 $3.0 $1.4 $0.0 $0.0 $4.5 1-4 Family Construction 1.2 2.1 2.2 1.9 0.7 8.1 Recreation and All Other Loans 0.2 0.1 0.0 0.2 0.2 0.6 Commercial Construction 1.2 0.3 5.7 0.2 0.7 8.0 Commercial Acquisition and Development 7.3 0.0 0.0 0.8 3.6 11.6 Residential Acquisition and Development 42.5 20.8 3.1 2.4 9.8 78.7 Construction A & D Net Charge-Offs $52.4 $26.4 $12.4 $5.4 $14.9 $111.5 6 |
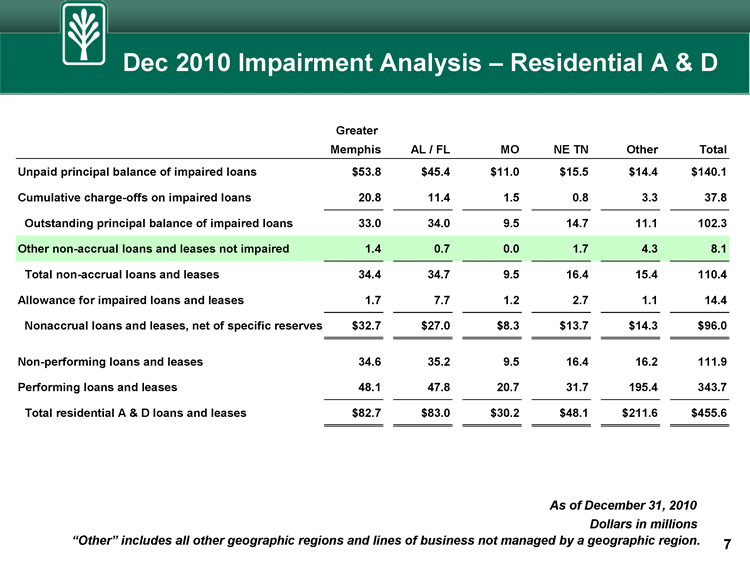
| Other includes all other geographic regions and lines of business not managed by a geographic region. Dec 2010 Impairment Analysis - Residential A & D Dollars in millions As of December 31, 2010 Greater Memphis AL / FL MO NE TN Other Total Unpaid principal balance of impaired loans $53.8 $45.4 $11.0 $15.5 $14.4 $140.1 Cumulative charge-offs on impaired loans 20.8 11.4 1.5 0.8 3.3 37.8 Outstanding principal balance of impaired loans 33.0 34.0 9.5 14.7 11.1 102.3 Other non-accrual loans and leases not impaired 1.4 0.7 0.0 1.7 4.3 8.1 Total non-accrual loans and leases 34.4 34.7 9.5 16.4 15.4 110.4 Allowance for impaired loans and leases 1.7 7.7 1.2 2.7 1.1 14.4 Nonaccrual loans and leases, net of specific reserves $32.7 $27.0 $8.3 $13.7 $14.3 $96.0 Non-performing loans and leases 34.6 35.2 9.5 16.4 16.2 111.9 Performing loans and leases 48.1 47.8 20.7 31.7 195.4 343.7 Total residential A & D loans and leases $82.7 $83.0 $30.2 $48.1 $211.6 $455.6 7 |
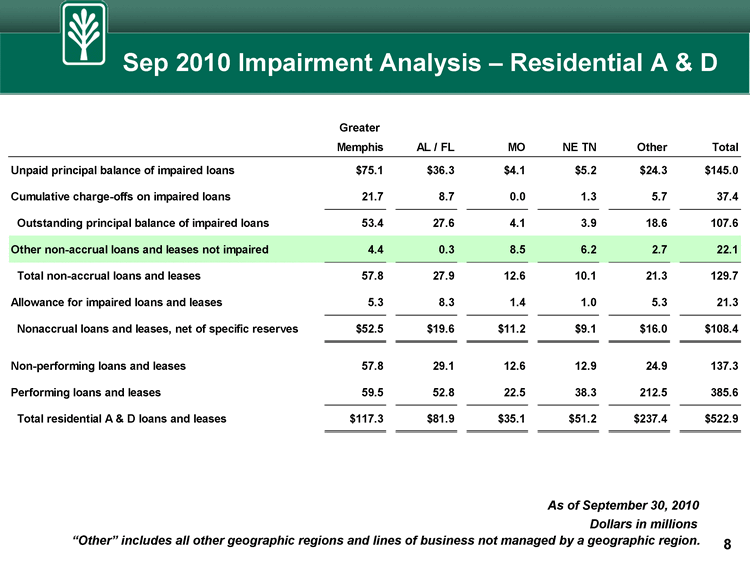
| Other includes all other geographic regions and lines of business not managed by a geographic region. Greater Memphis AL / FL MO NE TN Other Total Unpaid principal balance of impaired loans $75.1 $36.3 $4.1 $5.2 $24.3 $145.0 Cumulative charge-offs on impaired loans 21.7 8.7 0.0 1.3 5.7 37.4 Outstanding principal balance of impaired loans 53.4 27.6 4.1 3.9 18.6 107.6 Other non-accrual loans and leases not impaired 4.4 0.3 8.5 6.2 2.7 22.1 Total non-accrual loans and leases 57.8 27.9 12.6 10.1 21.3 129.7 Allowance for impaired loans and leases 5.3 8.3 1.4 1.0 5.3 21.3 Nonaccrual loans and leases, net of specific reserves $52.5 $19.6 $11.2 $9.1 $16.0 $108.4 Non-performing loans and leases 57.8 29.1 12.6 12.9 24.9 137.3 Performing loans and leases 59.5 52.8 22.5 38.3 212.5 385.6 Total residential A & D loans and leases $117.3 $81.9 $35.1 $51.2 $237.4 $522.9 8 Dollars in millions As of September 30, 2010 Sep 2010 Impairment Analysis - Residential A & D |

| Other includes all other geographic regions and lines of business not managed by a geographic region. Dollars in millions As of December 31, 2010 9 Greater Memphis AL / FL MO NE TN Other Total Unpaid principal balance of impaired loans $90.0 $77.7 $47.9 $32.2 $97.6 $345.4 Cumulative charge-offs on impaired loans 26.5 21.0 4.9 2.6 17.0 72.0 Outstanding principal balance of impaired loans 63.5 56.7 43.0 29.6 80.6 273.4 Other non-accrual loans and leases not impaired 4.3 0.7 25.3 11.9 31.9 74.1 Total non-accrual loans and leases 67.8 57.4 68.3 41.5 112.5 347.5 Allowance for impaired loans and leases 6.5 11.1 8.3 4.3 10.5 40.7 Nonaccrual loans and leases, net of specific reserves $61.3 $46.3 $60.0 $37.2 $102.0 $306.8 Non-performing loans and leases 68.5 65.8 80.8 43.5 135.8 394.4 Performing loans and leases 599.9 689.7 550.7 682.7 6,415.7 8,938.7 Total loans and leases $668.4 $755.5 $631.5 $726.2 $6,551.5 $9,333.1 Dec 2010 Impairment Analysis - Total Loans |
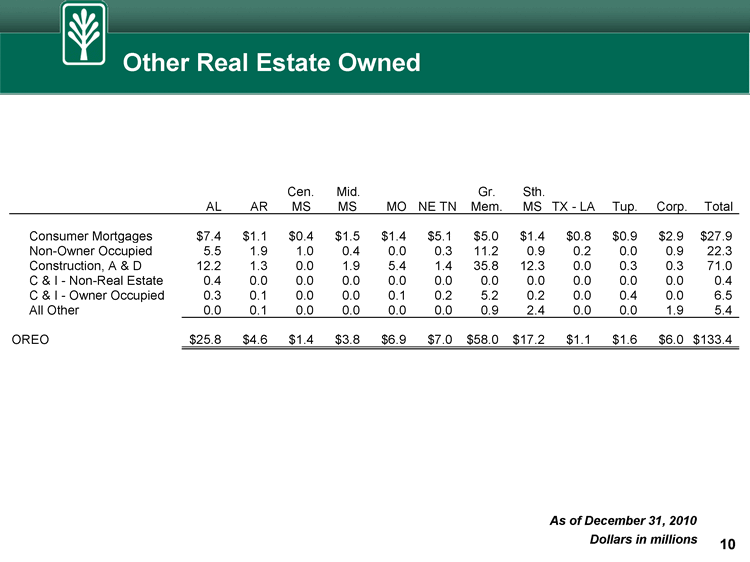
| Dollars in millions As of December 31, 2010 Cen. Mid. Gr. Sth. AL AR MS MS MO NE TN Mem. MS TX — LA Tup. Corp. Total Consumer Mortgages $7.4 $1.1 $0.4 $1.5 $1.4 $5.1 $5.0 $1.4 $0.8 $0.9 $2.9 $27.9 Non-Owner Occupied 5.5 1.9 1.0 0.4 0.0 0.3 11.2 0.9 0.2 0.0 0.9 22.3 Construction, A & D 12.2 1.3 0.0 1.9 5.4 1.4 35.8 12.3 0.0 0.3 0.3 71.0 C & I — Non-Real Estate 0.4 0.0 0.0 0.0 0.0 0.0 0.0 0.0 0.0 0.0 0.0 0.4 C & I — Owner Occupied 0.3 0.1 0.0 0.0 0.1 0.2 5.2 0.2 0.0 0.4 0.0 6.5 All Other 0.0 0.1 0.0 0.0 0.0 0.0 0.9 2.4 0.0 0.0 1.9 5.4 OREO $25.8 $4.6 $1.4 $3.8 $6.9 $7.0 $58.0 $17.2 $1.1 $1.6 $6.0 $133.4 10 Other Real Estate Owned |
