Attached files
| file | filename |
|---|---|
| 8-K - FORM 8-K - PTC INC. | form8k.htm |
| EX-99.1 - PRESS RELEASE - PTC INC. | pressrel.htm |
Q1 FISCAL 2011 PREPARED REMARKS
THE LONG-TERM VIEW: Technology leadership + winning in the market = 20% EPS CAGR
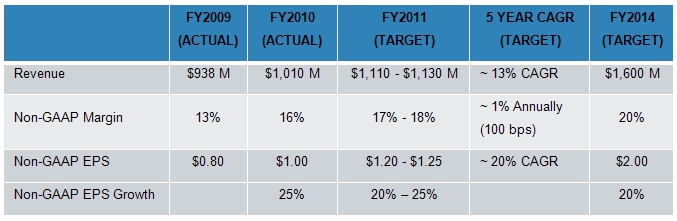
Our long-term financial goal is simple: We intend to deliver 20% non-GAAP EPS growth annually through FY’14. Our goal is to deliver this result through what we call our “Winning in the Market” strategy, which means primarily through accelerating organic revenue growth coupled with modest margin improvement. The table below illustrates these goals. Based on the strength of our FY’10 and our FY’11 outlook, we remain confident about our ability to achieve our FY’14 revenue growth and non-GAAP EPS growth targets. Our current guidance for FY’11 assumes $1.37 USD/EURO. Our actual FY’10 Fx rate was essentially $1.37 USD/EURO.
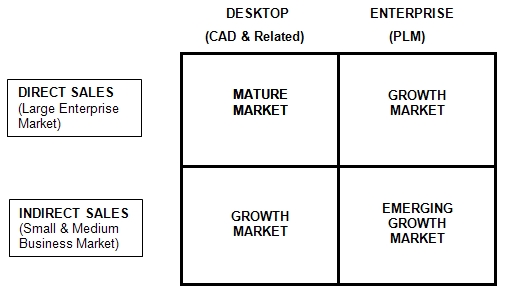
We believe we are the technology leader in attractive growth markets. We characterize the markets we participate in with the 4-box graphic below. Industry analysts estimate that the CAD market (left half of the 4-box below) grew at a 2% CAGR from 2005 through 2010 and that the PLM market (right half of the 4-box below) grew at a 7% CAGR. Over that same time period, PTC’s CAD business grew at a 3% CAGR and our PLM business grew at a 15% CAGR. Looking forward, industry analysts expect the CAD market to grow at a 6% CAGR and the PLM market to grow at a 9% CAGR from 2010 through 2014. We expect our technology leadership position in the growth markets to translate into growth rates in excess of the overall market growth rates – especially in the PLM half of our business. Furthermore, we expect our overall revenue growth rates to accelerate over the next few years as our revenue mix continues to shift from ‘Desktop’ to ‘Enterprise.’
We provide data points such as “Domino Account Wins” in the pages that follow to enable investors to further evaluate our claims that we are the technology leader, that we are gaining market share, and that ultimately we are “Winning in the Market.”
Non-GAAP Supplemental Information
We provide non-GAAP supplemental information to our GAAP information. PTC's reasons for providing this information are described at the end of this document. GAAP information corresponding to the non-GAAP information provided is contained in “Q1 FY’11 Expenses Commentary and FY’11 & Q2 Outlook” below and in the attached tables, along with a reconciliation between the GAAP and non-GAAP information.
Q1 RESULTS VS. GUIDANCE: Revenue above the high-end, EPS at the low end due to contract expense
Total revenue for Q1 of $267 million was above our Q1 revenue guidance range of $255 million to $265 million. Our Q1 non-GAAP EPS of $0.22 was at the low end of our guidance range of $0.22 to $0.26. Q1 EPS was negatively impacted by $0.03 to $0.04 related to the contract accounting treatment of the first phase of our expected multi-year engagement with Hyundai Motor Company and Kia Motors Corporation. This is a very significant and strategic win for PTC, for which we did not record any revenue in Q1. (Please refer to the Domino section below and the standalone press release issued earlier today for more details on this engagement.) As reflected in our EPS guidance for FY ’11 we will save a commensurate amount throughout the balance of the year and continue to expect to deliver full year non-GAAP EPS of $1.20-1.25. Q1 non-GAAP EPS was not impacted by foreign currency relative to the rates we used when we established our Q1 guidance.
Q1 GAAP EPS was $0.11, which was at the low end of our guidance range of $0.11 to $0.15, which was also adversely affected by the contract accounting expense described above. Additionally, our cash balance was reduced by approximately $48 million in Q1’11 related to a previously announced litigation settlement in Japan.
Q1 FY’11: Strong quarter on all fronts
We delivered 3% year over year revenue growth, with license sales up 1% (4% and 2% on a constant currency basis, respectively). We delivered non-GAAP EPS of $0.22, down from $0.27 in Q1 ’10. (GAAP EPS was $0.11 compared to $0.15 in Q1’10).
As is highlighted in the 4-box and domino account tables below:
|
1)
|
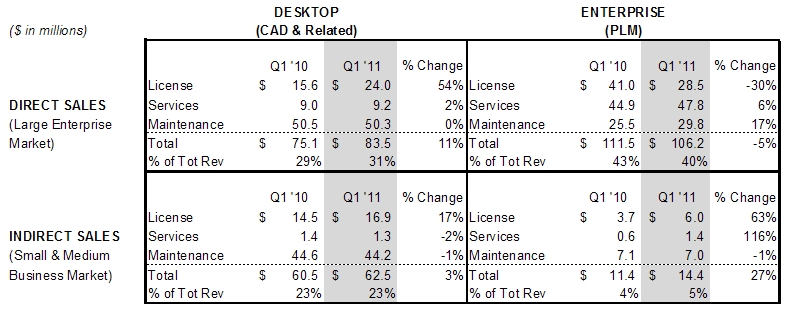
We are seeing continued signs of recovery in our CAD business (left half of the 4-box), with license revenue up 36% year over year.
|
|
2)
|
The large enterprise CAD market (upper left box) delivered significant year-over-year growth; total revenue up 11% and license revenue up 54%.
|
|
3)
|
We are also seeing continued strength in our SMB business (bottom half of the 4-box), with year-over-year license revenue up 26%. This is our 4th consecutive quarter of year-over-year license and total revenue growth in the Channel.
|
|
4)
|
Total PLM revenue of $120.6 million (right half of the 4-box) was down 2% year-over-year, including a 23% decrease in Enterprise PLM, reflecting the handful of significant transactions we had in Q1’10 which drove license and total revenue over performance by more than $20 million in Q1’10. Excluding $20 million from our Q1’10 results, total PLM revenue was up 17% in Q1’11.
|
|
5)
|
The large enterprise PLM market (upper right box) continues to exhibit strength with maintenance and services revenue growth, up 17% and 6%, respectively.
|
|
6)
|
We won 3 new domino accounts in Q1 (current total of 22). Included in these new Dominoes is Hyundai Motor Company and Kia Motors Corporation, one of the largest and fastest growing automotive OEMs.
|
|
7)
|
We maintained our target of 30 domino account wins by the end of FY ’11 (an additional 8).
|
|
8)
|
We had 22 large deals (>$1M in license and services revenue), up from 10 in Q1 ’10, reflecting broader strength than a year ago.
|
Revenue by 4-Box
The horizontal axis highlights Desktop vs. Enterprise solutions
|
·
|
Desktop solutions include Creo Elements/Pro TM, Mathcad® and a portion of Creo Elements/Direct TM and Arbortext® revenue
|
|
·
|
Enterprise solutions include Windchill,Creo Elements/View, Windchill ProductPoint®, Relex, InSightTM and a portion of Arbortext revenue
|
The vertical axis highlights Direct vs. Indirect go-to market strategies
|
·
|
Direct sales focuses primarily on the large enterprise market
|
|
·
|
Indirect sales (primarily our VAR reseller channel) focuses primarily on the SMB market
|
DOMINO ACCOUNT UPDATE: Major win in Automotive… 22 down, 8 to go in FY’11 for a total of 30
At our June ‘09 investor event, we outlined what we are calling our “domino account strategy.” Domino wins are defined as competitive wins at some of the world’s largest discrete manufacturing companies whose primary PLM solutions are not PTC products, and who have conducted comprehensive benchmarks of the major PLM technologies available today and selected PTC as the winner. These wins are important because we believe they serve as a “signpost” signaling the technological superiority of our products. We believe the logical conclusion of winning in a significant number of ‘domino’ accounts is that PTC has become the unambiguous market leader. As we demonstrate the real value of our technology in the initial installation phase, we expect these accounts will be significant customers for years to come.
We won an additional 3 domino accounts in Q1. Of these, one is in the Industrial vertical, one is in the Retail vertical, and one is Hyundai Motor Company and Kia Motors Corporation, one of the largest and fastest growing automotive OEMs. Following an extensive two-year benchmark testing and selection process, Hyundai Motor Company and Kia Motors Corporation selected PTC’s Windchill as its enterprise PLM solution to consolidate multiple existing systems into a single platform for managing critical product data and related processes for vehicle development. Hyundai Motor Company and Kia Motors Corporation is adopting the Windchill PLM system in its core R&D groups and intends to extend use of the solution through its internal and external value chain.
We are very excited that Hyundai Motor Company and Kia Motors Corporation has chosen us to help it move forward in the very dynamic and demanding automotive industry. We believe this selection clearly demonstrates PTC’s PLM momentum in the strategically important automotive sector. PTC’s automotive industry wins over the past 12 months include Hyundai Motor Company and Kia Motors Corporation, Volvo Group, VE Commercial Vehicles, Continental AG, Schaeffler, Harman Intl, Arvin Meritor, Harley-Davidson and Cummins.
The table below outlines domino account wins by major vertical since FY’08.
Domino Account Wins
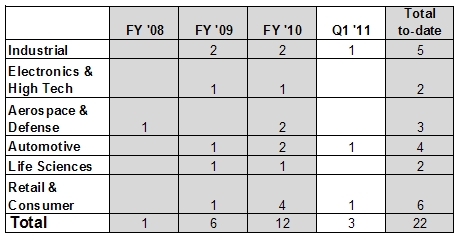
Note: We have corrected our Q4’10 table to include a Domino win in the Retail & Consumer vertical, which was mistakenly not included in our Q4 earnings package.
We believe our PLM license revenue results and Domino account momentum continue to demonstrate what we believe is a fundamental shift in the competitive dynamic of our industry: Our Windchill PLM platform is separating itself from the pack and we are in an increasingly clear technology leadership position. In addition to domino account wins, we are also actively engaged in a significant number of important Windchill-led competitive displacement opportunities with other large companies around the world.
Q2 AND FY’11 OUTLOOK: Solid Q2 outlook, maintaining FY’11 targets of 10% to 12% revenue growth and non-GAAP EPS of $1.20 to $1.25
In providing guidance for Q2 and setting targets for FY’11, we are weighing company specific factors such as our pipeline of opportunities and our maintenance and services base as well as external considerations, including the macroeconomic environment, currency, and visibility into customer spending patterns. We are using the following currency assumptions in our guidance: USD / EURO rate of $1.37 and YEN / USD of 83.
For Q2, we are initiating revenue guidance of $260 to $270 million with non-GAAP EPS of $0.22 to $0.26. (On a GAAP basis, we expect EPS of $0.11 to $0.15). Our Q2 guidance includes target license revenue of approximately $78 to $82 million, which is approximately 20% to 25% growth on a year-over-year basis, with our combined maintenance and services revenue expected to be up mid-single digits on a year-over-year basis, resulting in approximately 8% to 12% year-over-year growth in total revenue.
Looking to the full year FY’11, we are continuing to target revenue growth of 10% to 12%. We are expecting license revenue growth of approximately 20% to 25%, services revenue growth of approximately 10% and maintenance revenue growth of approximately 5%. We are committed to achieving our non-GAAP EPS target of $1.20 to $1.25, while balancing investments in future growth with our commitment to 20% non-GAAP EPS growth. For FY’11 the GAAP EPS target is $0.73 to $0.78.
Our product portfolio is being received very well in the market. We are sensing a lot of excitement in the market around Creo, our new CAD platform, which we intend to launch in the summer of 2011. We believe Creo will be a significant enhancement over the functionality and usability of existing CAD products on the market today. Creo will leverage a core set of technology assets unique to PTC and is intended to address 4 critical issues still impacting the CAD industry: usability, interoperability, assembly management and technology lock-in.
Customers continue to expand their view of PLM from an engineering centric CAD data management solution into a robust enterprise solution with thousands of users across the extended enterprise. We have significant new releases of Windchill® and Arbortext® scheduled for FY’11, and continue to invest in our product analytics platform, including Relex® and InSight, which enables customers to perform business intelligence-like analytics on their in-process product designs. We also launched Mathcad® Prime 1.0 early in Q2.
We are very optimistic about the long-term opportunity for PTC and will continue to make strategic investments that we believe are critical to delivering value to our customers and to enabling us to gain market share and help us continue to drive toward our goal of low- to mid-teens revenue growth and 20% non-GAAP EPS CAGR over the 5 year period through 2014.
REVENUE TRENDS
Certain reclassifications between Direct and Indirect and Desktop and Enterprise revenue from previously reported results (Q1’09 through Q1’11) are reflected below. Indirect revenue is comprised of revenue from our reseller channel and from customers classified as Indirect. To the extent a customer changes between the Direct and Indirect classification, we reclassify their historical revenue to align to the current period classification. The reclassifications of prior quarter and annual Direct and Indirect and Desktop and Enterprise revenue were not more than 2% for any single quarterly or annual reporting period.
DIRECT SALES: Strong large deal activity, solid Desktop and Enterprise
Our direct sales force is primarily focused on large enterprise customers. We have approximately 305 direct sales teams. These teams are primarily focused on selling our Product Development System, which incorporates all of our primary product families, to large enterprise customers. The table below shows direct revenue performance. Key metrics we provide in addition to revenue regarding our Direct Sales / Large Enterprise Market performance also include Large Customer Activity and Domino Account wins.
##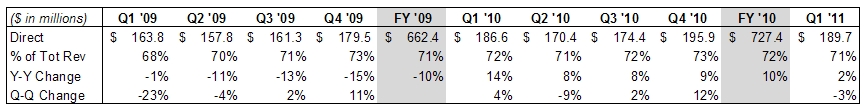
Q1 direct account revenue, which includes Strategic Account Management (SAM) accounts, was up 2% year over year. As you can see from the 4-box detail on page 3, our growth in this space was primarily driven by 11% growth in CAD revenue. It is worth noting that the Q1’10 period included a handful of very large Enterprise PLM transactions in North America which drove significant (more than $20 million) upside to our license revenue performance. Excluding $20 million from Q1’10, our direct account revenue was up 14% year over year.
LARGE DEAL ACTIVITY: CAD comes back! Customers continue to make significant PLM investments
Large deal activity is a significant growth driver and has historically tended to generate 15% to 20% of our total revenue in any given quarter, with the exception of Q4, which historically has been higher. Large deal activity is driven primarily by direct sales teams. We define “large deals” as recognizing more than $1 million of license and service revenue from a customer during a quarter.
##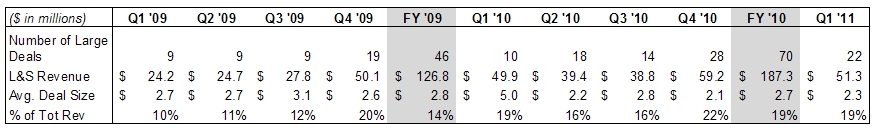
In Q1 we had 22 large deals totaling $51.3 million. 9 of these customers were in North America, 11 were in Europe (an all time high) and 2 were in Asia. Of the $51.3 million in license and service revenue, more than $10 million was Desktop (CAD) related compared to approximately $3 million in the year ago period. We have a strong pipeline of large deals that we are working on worldwide. We are winning competitive deals with large global companies (see ‘Dominoes’ above) and are actively engaged in a substantial number of competitive opportunities with other large global companies.
UPPER LEFT BOX (DIRECT SPACE / DESKTOP PRODUCTS)
This market is extremely important from a strategic perspective, however we believe it has been a highly saturated market with limited long-term growth opportunity. We are launching an exciting new CAD platform, Creo, based on a core set of technology assets unique to PTC, which we believe will be a significant enhancement over the functionality and usability of existing CAD products on the market today. We expect to launch the first version of the product in the summer of 2011. We believe this new platform could drive above industry average growth in our CAD business over the coming years. We delivered 11% total revenue growth and 54% license revenue growth in this market in Q1.
Our primary products in this market are Creo Elements/Pro, Creo Elements/Direct and Arbortext authoring solutions.
UPPER RIGHT BOX (DIRECT SPACE / ENTERPRISE PRODUCTS)
From a near- to medium-term growth perspective, we believe this market offers the most significant opportunity for PTC. Large enterprises are increasingly investing in PLM solutions and we believe Windchill is the premier PLM solution on the market today. License revenue is down year over year, primarily due to a particularly strong Q1’10, which included more than $20 million of upside to our expected license performance in that period from a handful of accounts in North America. Excluding $20 million from Q1’10 license revenue, we had 16% year over year total revenue growth and 36% year over year license revenue growth in Q1’11. Importantly this is our 3rd quarter of consecutive services and maintenance revenue growth on a year over year basis.
Our primary products in this market are Windchill, Creo Elements/View, InSight, Relex and Arbortext enterprise solutions.
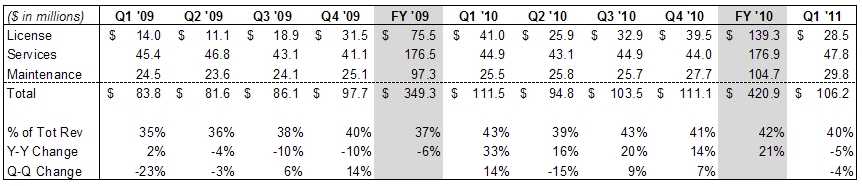
INDIRECT SALES: Strong maintenance base and continued signs of improving end markets
Our indirect sales are primarily from the Small and Medium Businesses (SMB) market. Indirect revenue is comprised of revenue from our reseller channel and from customers we have designated as indirect. We continue to have approximately 115 channel business development managers supporting more than 420 channel partners who are focused primarily on selling our MCAD products such as Creo Elements/Pro, Creo Elements/View and Mathcad, as well as Windchill PDMLink® and Windchill ProductPoint (our Microsoft SharePoint-based version of Windchill), into the SMB marketplace. We began in fiscal 2009 to develop a network of enterprise resellers to further expand our core Windchill ecosystem. This program is progressing well.
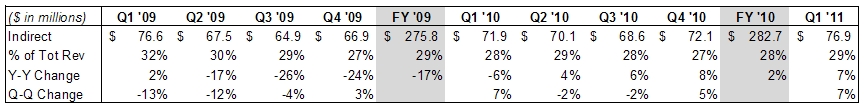
###
In Q1 indirect account revenue was up 7% year over year. Given that this market is made up of SMB companies, we believe this market continues to be more heavily impacted by macroeconomic factors. Importantly, as reflected in the 4-box detail, we are continuing to see an important sign of improvement in the SMB space: license and total revenue are up year-over-year in both the lower left and lower right boxes for the 4th quarter in a row.
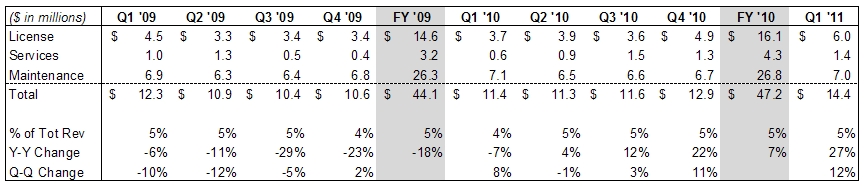
LOWER LEFT BOX (INDIRECT SPACE / DESKTOP PRODUCTS)
We believe this market continues to offer long-term growth potential. The customer base is primarily comprised of SMB customers which we believe are more heavily impacted by macroeconomic factors. Importantly, we are seeing signs of improvement in new license sales and our maintenance paying base in this market remains stable. This is our fourth quarter of total revenue improvement and 15%+ year-over-year license revenue improvement.
Our primary products in this market are Creo Elements/Pro, Creo Elements/Direct, Mathcad and Arbortext authoring solutions.
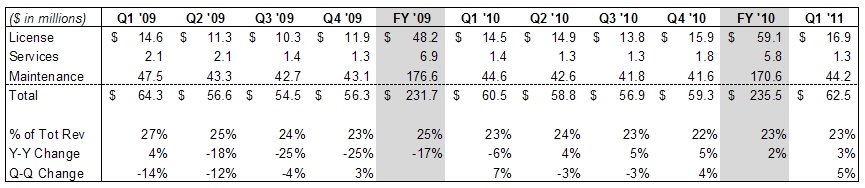
LOWER RIGHT BOX (INDIRECT SPACE / ENTERPRISE PRODUCTS)
#
From a medium- to long-term growth perspective, we believe this market offers a significant growth opportunity. Again, the customer base in this market is primarily comprised of SMB companies, which we believe are more heavily impacted by macro economic factors. Despite the soft macro-environment, this is our fourth consecutive quarter of year-over-year license revenue growth. SMB customers are increasingly interested in PLM solutions and we believe Windchill is an excellent product for larger companies in the SMB space. We are also seeing encouraging interest for our Windchill ProductPoint offering in the SMB market.
Our primary products in this market are Windchill, Windchill ProductPoint, and Arbortext enterprise solutions.
REVENUE BY LINE OF BUSINESS
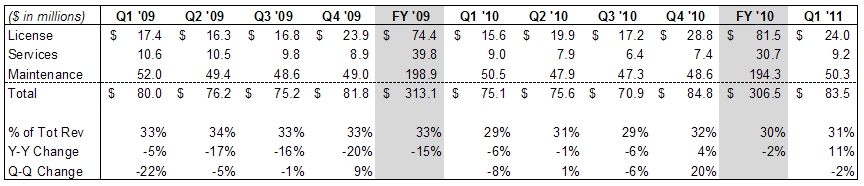
LICENSE: Strong license quarter… Desktop comes back, continued strength in Enterprise
License sales generate the highest gross margins, which are in the mid- to high 90% range on a non-GAAP basis. License revenue historically has tended to represent 28% to 35% of our total revenues in any given quarter, with Q4 generally being our strongest quarter. Given the macroeconomic environment in FY’09, license revenue was closer to 20% of total revenue, however, as expected it has trended back towards 30% of total revenue in FY’10.
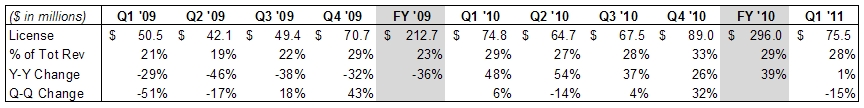
#
Q1 License revenue of $75.5 million was up 1% year over year (2% on a constant currency basis). We had 36% year-over-year growth in Desktop license revenue, led by significant strength with several large customers coupled with broad-based strength in the SMB market. We had a 23% year over year decline in Enterprise license revenue, which reflects the exceptionally strong performance we had in Q1’10. Excluding $20 million from Q1’10 license revenue, we had 40% year over year growth in Enterprise license revenue Q1’11, with strong growth in both the large customer and SMB space. Excluding $20 million from Q1’10 total license revenue, we had 38% year over year growth in total license revenue Q1’11.
Our products continue to perform very well in competitive benchmarks, as demonstrated by our domino account and large deal (>$1 M in license and service revenue) momentum.
Looking forward to Q2, we are expecting license revenue of $78 to $82 million, up approximately 20% to 25% on a year-over-year basis. For FY’11, we are expecting license revenue growth of 20% to 25% on a year-over-year basis.
SERVICES: Year over Year growth momentum continues to build
Our services business provides significant value to our customers, helping them re-engineer their global product development business processes and implement our solutions, and providing them with training on our software. Services revenue has historically tended to represent 20% to 25% of our total revenues in any given quarter.
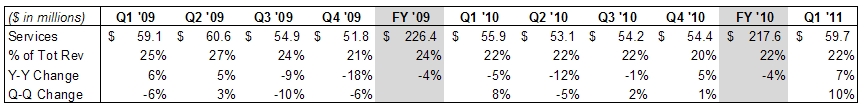
Q1 Services revenue of $59.7 million was up 7% year over year (up 9% on a constant currency basis), primarily due to strong license revenue and ongoing engagements with PLM customers. Our training business, which typically represents about 15% of our total services revenue, was up 6% year over year. Our consulting business, which primarily supports Windchill implementations, was up 7% year over year, suggesting that the impact of soft license revenue in FY’09 has bottomed. Our services non-GAAP net margins of (5.2)% in Q1’11 (compared to 5.2% in Q1’10) were negatively impacted by the contract accounting treatment of the first phase of our expected multi-year engagement with Hyundai Motor Company and Kia Motors Corporation.
Looking forward to Q2, we are expecting services revenue to be up approximately 10% on a year over year basis. For FY’11 we are also expecting services revenue to grow approximately 10% on a year over year basis. We have a solid backlog of services engagements that provides near-term visibility into our services business. We expect that our services margins will be under pressure in FY’11 due to the impact of the contract accounting treatment described above as well as some investments we are making during FY’11 to enhance the longer-term profitability of this business.
Our primary initiatives for the services business are to continue to enable our customers to realize value from their PLM implementations, improve our services net margins and expand our Windchill services ecosystem by adding Service Partners. We launched the “Service Advantage Program” at the beginning of fiscal 2009 and we are making solid progress. We already have a network of partners in North America and Europe, and are launching the program in Asia.
MAINTENANCE: Strong Q1 sets the tone
Our maintenance business is an important barometer of customer satisfaction with our solutions. It is also a strong source of recurring revenue for PTC. Maintenance gross margins are in the mid- to high 80% range. Maintenance revenue has historically tended to represent 45% to 50% of our total revenues in any given quarter, with Q4 usually being lower as a percent of total revenue due to historically strong performance of license sales in that quarter.
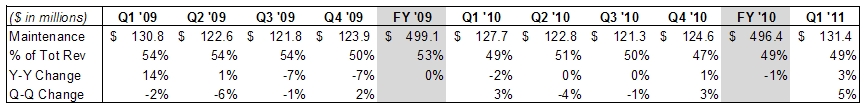
Q1 maintenance revenue of $131.4 million was up 3% year over year (up 4% on a constant currency basis). On a sequential basis, Q1 was up 5%, reflecting the strength of our Enterprise maintenance base and strong license revenue performance. We believe our maintenance business reflects a solid customer base and the importance customers attribute to our products.
Looking forward to Q2, we are expecting low to mid single digit growth of maintenance revenue on a year over year basis. Keep in mind that Q2 is traditionally one of our softer quarters from a maintenance perspective due to the timing of maintenance renewals. For FY’11 we continue to expect maintenance revenue to be up approximately 5% on a year-over-year basis, primarily due to improving license revenue.
Active Maintenance Seats
We have more than 1.2 million active maintenance seats of PTC software in use today. We believe the solid base of maintenance-paying customers is a testament to the quality of our products and we also view it as one of our largest assets.
Active Maintenance Seats
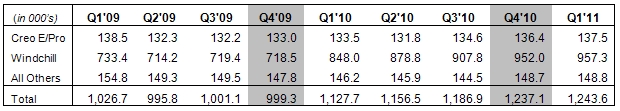
We experienced an increase in active maintenance seats across all major product families in Q1. Our overall attach and renewal rates continue to remain strong.
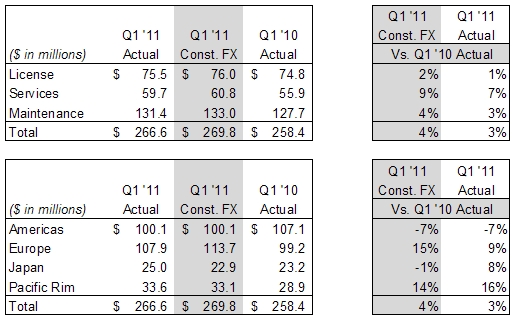
REVENUE BY REGION: Signs of global stability
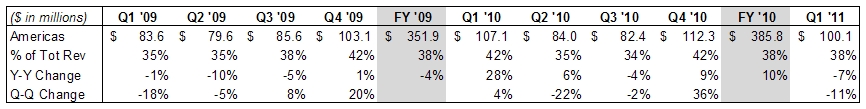
Americas revenue in Q1 of $100.1 million was down 11% sequentially due to the normal seasonality of our business. On a year over year basis, Q1 was down 7% compared with last year, reflecting the handful of significant transactions we had in Q1’10 which drove license and total revenue over performance of more than $20 million in Q1’10. Excluding $20 million from Q1’10, we had 15% year over year growth in Q1’11. Compared to Q1’10, indirect revenue in the Americas in Q1 was up 13%, and we achieved 15% sequential indirect license revenue growth in this geography. Direct revenue was down 10% year over year, again impacted by the exceptionally strong performance we had in Q1’10. Q1 license revenue in the Americas was down 29% sequentially, primarily due to the normal seasonality of our business.
#
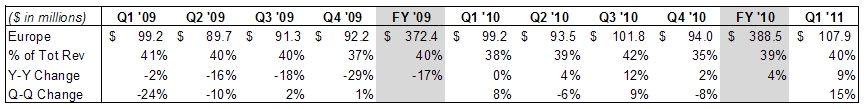
Europe revenue was $107.9 million in Q1, up 9% (15% on a constant currency basis) compared with last year, and up 15% sequentially, due to more large deals in Europe in Q1’11. Compared to Q1’10, indirect revenue in Europe was flat and direct revenue was up 14%. Q1 license revenue in Europe was up 53% year over year and 16% sequentially, with the indirect space up 28% and the direct space up 11%.
#
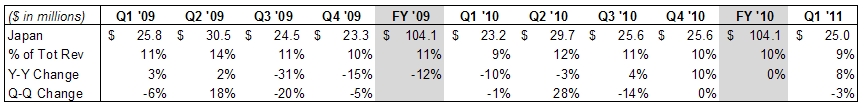
Japan revenue was $25.0 million in Q1, up 8% (down 1% on a constant currency basis) compared with last year and down 3% sequentially. Compared to Q1’10, indirect revenue in Japan was up 9% and direct revenue was up 7%. Q1 license revenue in Japan was up 14% compared with last year, but down 37% sequentially.
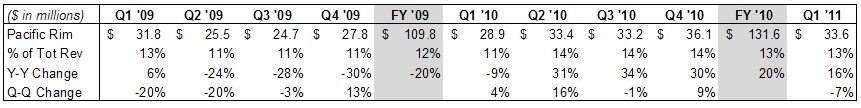
Pacific Rim revenue was $33.6 million in Q1, up 16% (14% on a constant currency basis) compared with last year, but down 7% sequentially. (China, which represents a significant portion of our Pac Rim revenue, increased 21% compared to Q1’10). Compared to Q1’10, indirect revenue in the Pac Rim was up 22% and direct revenue was up 14%. Q1 license revenue in the Pac Rim was up 9% compared with last year, but down 21% sequentially.
CURRENCY IMPACT ON RESULTS COMPARED TO THE YEAR AGO PERIOD
Because we have a global business, with Europe and Asia historically representing approximately 65% of our revenue, our results are impacted by currency fluctuations. On a constant currency basis, our revenue increased 4% year over year. Currency fluctuations unfavorably impacted Q1 revenue by $3.2 million and favorably impacted Q1 non-GAAP expenses by $1.7 million compared to Q1’10.
Constant Currency (assumes Q1’10 currency rates)
Looking forward, the guidance we are providing assumes exchange rates of approximately 1.37 USD / EURO and 83 YEN / USD. Our actual simple average FY’10 Fx rate was essentially $1.37 USD / EURO. We do not forecast currency movements, rather we provide detailed constant currency commentary. Currency can significantly impact our results. For example, in FY’10 currency was a modest tailwind for PTC when compared to FY’09: revenue was positively impacted by $15 million and non-GAAP expenses were negatively impacted by $10 million. On the other hand, in FY’09 currency was a considerable headwind for PTC when compared to FY’08: revenue was negatively impacted by $39 million and non-GAAP expenses were positively impacted by $36 million.
Q1 FY’11 EXPENSES COMMENTARY AND Q2 & FY’11 OUTLOOK
Q1 non-GAAP results exclude $11.0 million of stock-based compensation expense, $7.2 million of acquisition- related intangible asset amortization, $0.7 million of other expense related to foreign currency transaction losses related to a previously announced litigation settlement in Japan, and $5.8 million of income tax adjustments. The Q1 non-GAAP results include a tax rate of 23% and 121 million diluted shares outstanding. The Q1 GAAP results include a tax rate of 13% and 121 million diluted shares outstanding.
Q2’11 non-GAAP guidance excludes the following estimated expenses and their tax effects:
|
·
|
Approximately $10.2 million of expense related to stock-based compensation
|
|
·
|
Approximately $7.5 million of acquisition-related intangible asset amortization expense
|
FY’11 non-GAAP guidance excludes the following full-year estimated expenses and their tax effects, as well as any one-time tax items:
|
·
|
Approximately $44.2 million of expense related to stock-based compensation
|
|
·
|
Approximately $29.1 million of acquisition-related intangible asset amortization expense
|
|
·
|
Approximately $0.7 million of foreign currency transaction losses
|
INCOME STATEMENT
Our Q1 non-GAAP EPS were impacted by impacted by $0.03 to $0.04 related to contract accounting treatment of the first phase of our expected multi-year engagement with Hyundai Motor Company and Kia Motors Corporation, for which we did not recognize any revenue during the quarter.
Our Q1’11 non-GAAP operating expenses were $231.2 million, up 8% (9% on a constant currency basis) from Q1 of last year, reflecting investments we have made in the business to add sales capacity and to improve our product portfolio. Q1’11 GAAP operating expenses were $249.4 million. From an operating performance perspective, we achieved 13.3% non-GAAP operating margin in Q1’11, compared to 17.5% last year. GAAP operating margin was 6.4% for Q1’11 compared to 8.6% in Q1’10.
Excluding the contract accounting treatment related to the Hyundai Motor Company and Kia Motors Corporation win, EPS would have been at the high-end of the range and non-GAAP operating margins would have been higher than 15%.
Looking forward, our Q2 non-GAAP expenses are expected to be approximately $224 to $229 million, depending on amount and mix of revenue. Q2 GAAP operating expenses are expected to be approximately $241 to $246 million.
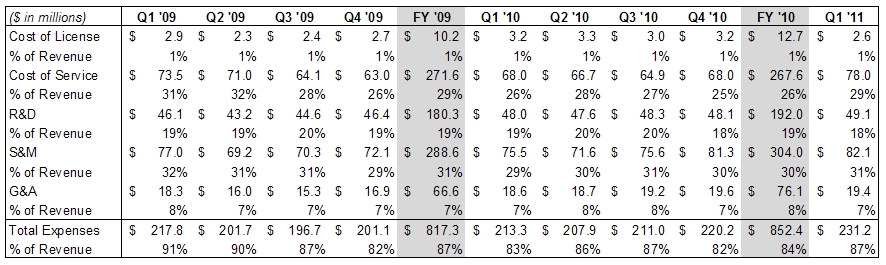
As you will note from the table below, our R&D and S&M expense as a percentage of revenue in FY’09 and FY’10 were higher than in previous years, reflecting our strategy to continue to invest in our business in order to better position PTC for the future. Primary areas of investment in the business continue to include:
|
1)
|
Increased investment in our direct sales force and our reseller channel
|
|
2)
|
Investing in R&D to extend our technology leadership position
|
|
3)
|
Leveraging unique technology assets of PTC to develop and launch Creo
|
|
4)
|
Enhancing and leveraging the value of our services business, and expanding our services ecosystem
|
We believe these investments will drive revenue growth and create considerable operating leverage opportunities over time.
As reflected in our EPS guidance for FY ’11 we are committed to achieving our non-GAAP operating margin and EPS targets for FY’11. We expect the $0.03 to $0.04 EPS impact of the Hyundai Motor Company and Kia Motors Corporation contract accounting treatment to be offset by a reduction in operating expenses throughout the balance of the year. More specifically, we expect R&D as a percentage of revenue to continue to trend toward more normalized historical levels.
NON-GAAP OPERATING EXPENSES
TAX RATE
Q1 non-GAAP tax rate was 23%, slightly below our expected non-GAAP tax rate of 25%. Our GAAP tax rate was 13%. Our GAAP and non-GAAP tax rate was lower than expected primarily due to the extension of the R&D tax credit.
Looking forward, the Q2 guidance assumes a non-GAAP tax rate of 24% and a GAAP tax rate of 25%. The FY’11 target assumes a non-GAAP tax rate of 24% and a GAAP tax rate of 25%.
SHARE COUNT / SHARE REPURCHASE
We had 121.2 million fully diluted weighted average shares outstanding for Q1. We did not repurchase any shares during the quarter. Our repurchase authorization was increased in Q4 by $100 million through the end FY’11. We have $118 million remaining under our current authorization to repurchase shares.
Looking forward, we expect to have approximately 122 million fully diluted shares outstanding for Q2 and for the full fiscal year. We are planning approximately $55 million worth of share repurchases in FY’11. Our long-term goal is to repurchase stock to offset dilution.
BALANCE SHEET: Solid cash position, expecting strong cash flow in Q2
CASH / CASH FLOW FROM OPERATIONS
For Q1’11, our cash balance was $183 million, down $57 million from the end of Q4’10, primarily due to a cash payment related to the previously announced litigation settlement in Japan, year-end incentive compensation payments,
and employee withholding tax related to stock based compensation plan vesting that occurs in Q1. Q1 cash flow included $48 million used by operations; $5 million of capital expenditures; and favorable foreign currency impact of $1 million.
Looking forward, we expect to have approximately $260 million in cash at the end of Q2 (prior to any stock repurchases). We currently expect to end the year with approximately $275 million in cash (after stock repurchases, but excluding any potential corporate development activities we may or may not engage in during the year).
DSO
DSO for Q1’11 was 60 days, compared with 57 days in Q4’10 and 57 days in Q1’10. We continue to have strong DSOs in a challenging economic environment.
OUTSTANDING DEBT
At the end of Q1’11 we had no outstanding balance on our $300 million revolving credit facility.
MISCELLANEOUS COMMENTS
HEADCOUNT
Total headcount was 5,416 at the end of Q1, up from 5,317 at the end of Q4’10.
M&A
We view M&A primarily as a strategic vehicle to further enhance our product portfolio and growth opportunity. We intend to remain opportunistic as it relates to M&A throughout the course of FY’11. We have $300 million available under our revolving credit facility as well as available cash with which to execute strategic M&A opportunities. Historically, the majority of our M&A opportunities have comprised small, strategic technology tuck-ins. For example, in FY’09 we acquired Relex and Synapsis (InSight) to build out our product analytics platform, and in FY’10 we acquired technology in the fast growing carbon information management market, further enhancing our product analytics platform with “green product development” capabilities. We will evaluate other strategic acquisition opportunities as they arise.
WRAP-UP
We are very optimistic about the long-term opportunity for PTC. From a strategic perspective, our technology leadership position is becoming clear: PLM license revenue was up 73% in FY’10; we are off to a strong start in Q1; we have won a cumulative total of 22 domino accounts, and expect to have a total of 30 by the end of FY’11; we had 22 large deals (>$1 M in license and service revenue) in Q1; our pipeline remains very robust; we are seeing year over year license growth in the CAD and SMB markets; and we have very exciting opportunities with Creo and our Arbortext SIS strategy to continue to drive further growth in FY’12 and beyond.
Based on the strength of our FY’10 and our FY’11 outlook, we remain confident and committed to achieving accelerating revenue growth and our 20% non-GAAP EPS growth target through 2014. We intend to continue to make prudent, strategic investments that we believe are critical to delivering value to our customers and gaining market share.
Thank you for your on-going support.
Important Information About Non-GAAP References
PTC provides non-GAAP supplemental information to its financial results. Non-GAAP operating expenses, margin and EPS exclude stock-based compensation expense, gain on litigation resolution, foreign currency transaction losses related to a litigation resolution, amortization of acquired intangible assets, acquired in-process research and development expense, restructuring charges, and the related tax effects of the preceding items and any one-time tax items. We use these non-GAAP measures, and we believe that they assist our investors, to make period-to-period comparisons of our operational performance because they provide a view of our operating results without items that are not, in our view, indicative of our core operating results. We believe that these non-GAAP measures help illustrate underlying trends in our business, and we use the measures to establish budgets and operational goals, communicated internally and externally, for managing our business and evaluating our performance. We believe that providing non-GAAP measures affords investors a view of our operating results that may be more easily compared to the results of peer companies. In addition, compensation of our executives is based in part on the performance of our business based on these non-GAAP measures. However, non-GAAP information should not be construed as an alternative to GAAP information as the items excluded from the non-GAAP measures often have a material impact on PTC’s financial results. Management uses, and investors should consider, non-GAAP measures in conjunction with our GAAP results.
Forward-Looking Statements
Statements in these prepared remarks that are not historic facts, including statements about our fiscal 2011 and other future financial and growth expectations, future product releases, anticipated tax rates, the expected impact of our planned strategic investments and product releases on our future success, expected market growth rates and the long-term prospects for PTC are forward-looking statements that involve risks and uncertainties that could cause actual results to differ materially from those projected. These risks include the possibility that customers may not purchase our solutions when or at the rates we expect, the possibility the foreign currency exchange rates may vary from our expectations and thereby affect our reported revenue and expense, the possibility that we may not achieve the license, services or maintenance growth rates that we expect, which could result in a different mix of revenue between license, service and maintenance and could impact our EPS results, the possibility that our customers may not renew maintenance at historic rates and that our services business may not recover when we expect, the possibility that strategic customer wins may not generate the revenue we expect, the possibility that our strategic investments, including Creo, and product releases may not have the effects or generate the revenue we expect, the possibility that we will experience a shortfall in revenue that causes us to decrease or eliminate planned strategic investments in our business, the possibility that we may be unable to attain or maintain a technology leadership position or that any such leadership position may not generate the revenue we expect, the possibility that planned product releases may be delayed, and the possibility that we may be unable to draw upon our revolving credit facility when or to the extent we decide to do so. In addition, our assumptions concerning our future GAAP and non-GAAP effective income tax rates are based on estimates and other factors that could change, including the geographic mix of our revenue, expenses and profits and loans and cash repatriations from foreign subsidiaries. Other risks and uncertainties that could cause actual results to differ materially from those projected are detailed from time to time in reports we file with the Securities and Exchange Commission, including our Annual Report on Form 10-K and our Quarterly Reports on Form 10-Q.
|
NON-GAAP FINANCIAL MEASURES AND RECONCILIATIONS (UNAUDITED)
|
||||||||||||||||||||||||||||||||||||||||||||
|
(in thousands)
|
||||||||||||||||||||||||||||||||||||||||||||
|
GAAP OPERATING EXPENSES
|
||||||||||||||||||||||||||||||||||||||||||||
|
Q1 '09
|
Q2 '09
|
Q3 '09
|
Q4 '09
|
FY '09
|
Q1 '10
|
Q2 '10
|
Q3 '10
|
Q4 '10
|
FY '10
|
Q1 '11
|
||||||||||||||||||||||||||||||||||
|
Cost of license revenue
|
$ | 7,584 | $ | 6,976 | $ | 7,644 | $ | 7,758 | $ | 29,962 | $ | 8,147 | $ | 8,232 | $ | 7,621 | $ | 7,047 | $ | 31,047 | $ | 5,954 | ||||||||||||||||||||||
|
Cost of service revenue
|
75,741 | 72,302 | 66,162 | 65,592 | 279,797 | 70,524 | 68,934 | 67,090 | 70,100 | 276,648 | 80,107 | |||||||||||||||||||||||||||||||||
|
Sales & marketing
|
79,862 | 71,387 | 73,823 | 76,297 | 301,369 | 78,598 | 75,137 | 79,121 | 84,676 | 317,532 | 84,521 | |||||||||||||||||||||||||||||||||
|
Research & development
|
48,361 | 44,752 | 46,562 | 48,826 | 188,501 | 50,690 | 49,960 | 50,597 | 50,320 | 201,567 | 51,522 | |||||||||||||||||||||||||||||||||
|
General & administrative
|
21,437 | 17,693 | 19,245 | 22,295 | 80,670 | 24,071 | 22,807 | 22,755 | 23,242 | 92,875 | 23,484 | |||||||||||||||||||||||||||||||||
|
Amortization of acquired
|
||||||||||||||||||||||||||||||||||||||||||||
|
intangible assetes
|
3,868 | 3,815 | 3,827 | 4,110 | 15,620 | 4,058 | 3,975 | 3,836 | 3,736 | 15,605 | 3,854 | |||||||||||||||||||||||||||||||||
|
In-process research &
|
||||||||||||||||||||||||||||||||||||||||||||
|
development
|
- | - | 300 | - | 300 | - | - | - | - | - | - | |||||||||||||||||||||||||||||||||
|
Restructuring charge, net
|
- | 9,788 | 6,609 | 6,274 | 22,671 | - | - | - | - | - | - | |||||||||||||||||||||||||||||||||
|
GAAP Operating Expenses
|
$ | 236,853 | $ | 226,713 | $ | 224,172 | $ | 231,152 | $ | 918,890 | $ | 236,088 | $ | 229,045 | $ | 231,020 | $ | 239,121 | $ | 935,274 | $ | 249,442 | ||||||||||||||||||||||
|
ADJUSTMENTS TO DERIVE NON-GAAP MEASURES
|
||||||||||||||||||||||||||||||||||||||||||||
|
Q1 '09
|
Q2 '09
|
Q3 '09
|
Q4 '09
|
FY '09
|
Q1 '10
|
Q2 '10
|
Q3 '10
|
Q4 '10
|
FY '10
|
Q1 '11
|
||||||||||||||||||||||||||||||||||
|
Cost of license revenue:
|
||||||||||||||||||||||||||||||||||||||||||||
|
Acquired intangible
|
||||||||||||||||||||||||||||||||||||||||||||
|
amortization
|
$ | 4,668 | $ | 4,703 | $ | 5,221 | $ | 5,082 | $ | 19,674 | $ | 4,898 | $ | 4,928 | $ | 4,659 | $ | 3,882 | $ | 18,367 | $ | 3,363 | ||||||||||||||||||||||
|
Stock-based
|
||||||||||||||||||||||||||||||||||||||||||||
|
compensation
|
14 | 3 | 11 | 22 | 50 | 17 | 2 | 2 | 3 | 24 | 3 | |||||||||||||||||||||||||||||||||
|
Cost of service revenue:
|
||||||||||||||||||||||||||||||||||||||||||||
|
Acquired intangible
|
||||||||||||||||||||||||||||||||||||||||||||
|
amortization
|
8 | - | - | - | 8 | - | - | - | - | - | - | |||||||||||||||||||||||||||||||||
|
Stock-based
|
||||||||||||||||||||||||||||||||||||||||||||
|
compensation
|
2,255 | 1,291 | 2,055 | 2,562 | 8,163 | 2,580 | 2,241 | 2,186 | 2,115 | 9,122 | 2,137 | |||||||||||||||||||||||||||||||||
|
Sales & marketing:
|
||||||||||||||||||||||||||||||||||||||||||||
|
Stock-based
|
||||||||||||||||||||||||||||||||||||||||||||
|
compensation
|
2,908 | 2,193 | 3,491 | 4,205 | 12,797 | 3,074 | 3,520 | 3,471 | 3,367 | 13,432 | 2,429 | |||||||||||||||||||||||||||||||||
|
Research & development:
|
||||||||||||||||||||||||||||||||||||||||||||
|
Stock-based
|
||||||||||||||||||||||||||||||||||||||||||||
|
compensation
|
2,258 | 1,566 | 1,986 | 2,404 | 8,214 | 2,659 | 2,383 | 2,252 | 2,186 | 9,480 | 2,393 | |||||||||||||||||||||||||||||||||
|
General & administrative:
|
||||||||||||||||||||||||||||||||||||||||||||
|
Stock-based
|
||||||||||||||||||||||||||||||||||||||||||||
|
compensation
|
3,096 | 1,677 | 3,969 | 5,362 | 14,104 | 5,525 | 4,146 | 3,599 | 3,583 | 16,853 | 4,065 | |||||||||||||||||||||||||||||||||
|
Amortization of acquired
|
||||||||||||||||||||||||||||||||||||||||||||
|
intangible assets
|
3,868 | 3,815 | 3,827 | 4,110 | 15,620 | 4,058 | 3,975 | 3,836 | 3,736 | 15,605 | 3,854 | |||||||||||||||||||||||||||||||||
|
In-process research &
|
||||||||||||||||||||||||||||||||||||||||||||
|
development
|
- | - | 300 | - | 300 | - | - | - | - | - | - | |||||||||||||||||||||||||||||||||
|
Restructuring charge, net
|
- | 9,788 | 6,609 | 6,274 | 22,671 | - | - | - | - | - | - | |||||||||||||||||||||||||||||||||
|
Non-GAAP adjustments
|
$ | 19,075 | $ | 25,036 | $ | 27,469 | $ | 30,021 | $ | 101,601 | $ | 22,811 | $ | 21,195 | $ | 20,005 | $ | 18,872 | $ | 82,883 | $ | 18,244 | ||||||||||||||||||||||
|
NON-GAAP OPERATING EXPENSES
|
||||||||||||||||||||||||||||||||||||||||||||
|
Q1 '09
|
Q2 '09
|
Q3 '09
|
Q4 '09
|
FY '09
|
Q1 '10
|
Q2 '10
|
Q3 '10
|
Q4 '10
|
FY '10
|
Q1 '11
|
||||||||||||||||||||||||||||||||||
|
Cost of license revenue
|
$ | 2,902 | $ | 2,270 | $ | 2,412 | $ | 2,654 | $ | 10,238 | $ | 3,232 | $ | 3,302 | $ | 2,960 | $ | 3,162 | $ | 12,656 | $ | 2,588 | ||||||||||||||||||||||
|
Cost of service revenue
|
73,478 | 71,011 | 64,107 | 63,030 | 271,626 | 67,944 | 66,693 | 64,904 | 67,985 | 267,526 | 77,970 | |||||||||||||||||||||||||||||||||
|
Sales & marketing
|
76,954 | 69,194 | 70,332 | 72,092 | 288,572 | 75,524 | 71,617 | 75,650 | 81,309 | 304,100 | 82,092 | |||||||||||||||||||||||||||||||||
|
Research & development
|
46,103 | 43,186 | 44,576 | 46,422 | 180,287 | 48,031 | 47,577 | 48,345 | 48,134 | 192,087 | 49,129 | |||||||||||||||||||||||||||||||||
|
General & administrative
|
18,341 | 16,016 | 15,276 | 16,933 | 66,566 | 18,546 | 18,661 | 19,156 | 19,659 | 76,022 | 19,419 | |||||||||||||||||||||||||||||||||
|
Amortization of acquired
|
||||||||||||||||||||||||||||||||||||||||||||
|
intangible assetes
|
- | - | - | - | - | - | - | - | - | - | - | |||||||||||||||||||||||||||||||||
|
In-process research &
|
||||||||||||||||||||||||||||||||||||||||||||
|
development
|
- | - | - | - | - | - | - | - | - | - | - | |||||||||||||||||||||||||||||||||
|
Restructuring charge, net
|
- | - | - | - | - | - | - | - | - | - | - | |||||||||||||||||||||||||||||||||
|
Non-GAAP Operating Expenses
|
$ | 217,778 | $ | 201,677 | $ | 196,703 | $ | 201,131 | $ | 817,289 | $ | 213,277 | $ | 207,850 | $ | 211,015 | $ | 220,249 | $ | 852,391 | $ | 231,198 | ||||||||||||||||||||||
|
PARAMETRIC TECHNOLOGY CORPORATION
|
||||||||||||
|
NON-GAAP FINANCIAL MEASURES AND RECONCILIATIONS (UNAUDITED)
|
||||||||||||
|
(in thousands, except per share data)
|
||||||||||||
|
Three Months Ended
|
||||||||||||
|
January 1,
|
January 2,
|
|||||||||||
|
2011
|
2010
|
|||||||||||
|
GAAP operating income
|
$ | 17,110 | $ | 22,341 | ||||||||
|
Stock-based compensation
|
11,027 | 13,855 | ||||||||||
|
Amortization of acquired intangible assets
|
||||||||||||
|
included in cost of license revenue
|
3,363 | 4,898 | ||||||||||
|
Amortization of acquired intangible assets
|
3,854 | 4,058 | ||||||||||
|
Non-GAAP operating income (1)
|
$ | 35,354 | $ | 45,152 | ||||||||
|
GAAP net income
|
$ | 13,260 | $ | 17,863 | ||||||||
|
Stock-based compensation
|
11,027 | 13,855 | ||||||||||
|
Amortization of acquired intangible assets
|
||||||||||||
|
included in cost of license revenue
|
3,363 | 4,898 | ||||||||||
|
Amortization of acquired intangible assets
|
3,854 | 4,058 | ||||||||||
|
Non-operating foreign currency transaction loss (2)
|
722 | - | ||||||||||
|
Income tax adjustments (4)
|
(5,810 | ) | (7,377 | ) | ||||||||
|
Non-GAAP net income
|
$ | 26,416 | $ | 33,297 | ||||||||
|
GAAP diluted earnings per share
|
$ | 0.11 | $ | 0.15 | ||||||||
|
Stock-based compensation
|
0.09 | 0.11 | ||||||||||
|
Income tax adjusments
|
(0.05 | ) | (0.06 | ) | ||||||||
|
All other items identified above
|
0.07 | 0.07 | ||||||||||
|
Non-GAAP diluted earnings per share
|
$ | 0.22 | $ | 0.27 | ||||||||
| (1 | ) |
Operating margin impact of non-GAAP adjustments:
|
||||||||||
|
Three Months Ended
|
||||||||||||
|
January 1,
|
January 2,
|
|||||||||||
| 2011 | 2010 | |||||||||||
|
GAAP operating margin
|
6.4% | 8.6% | ||||||||||
|
Stock-based compensation
|
4.2% | 5.4% | ||||||||||
|
Amortization of acquired intangibles
|
2.7% | 3.5% | ||||||||||
|
Non-GAAP operating margin
|
13.3% | 17.5% | ||||||||||
| (2 | ) |
Reflects foreign currency transaction losses related to a previously announced litigation settlement in
|
||||||||||
| Japan. | ||||||||||||
| (3 | ) |
Reflects the tax effects of non-GAAP adjustments for the first quarter of 2011 and 2010, which are
|
||||||||||
| calculated by applying the applicable tax rate by jurisdiction to the non-GAAP adjustments listed | ||||||||||||
| above. | ||||||||||||