Attached files
 First
Midwest Bancorp Fourth Quarter 2010 Supplemental Schedules
January 26, 2011
Exhibit 99.3 |
 1
1
Forward Looking Statement
Forward Looking Statement
This presentation may contain, and during this presentation our management may
make statements
that
may
constitute
“forward-looking
statements”
within
the
meaning
of
the
safe
harbor provisions of the Private Securities Litigation Reform Act of 1995.
Forward-looking statements
are
not
historical
facts
but
instead
represent
only
our
beliefs
regarding
future
events,
many of which, by their nature, are inherently uncertain and outside our
control. Forward- looking statements include, among other things,
statements regarding our financial performance, business prospects, future
growth and operating strategies, objectives and results. Actual
results, performance or developments could differ materially from those
expressed or implied by these forward-looking statements. Important factors
that could cause actual results to differ from those in the
forward-looking statements include, among others, those discussed in
our Annual Report on Form 10-K and other reports filed with the Securities
and Exchange Commission, copies of which will be made available upon
request. The information contained herein is unaudited. Except
as required by law, we undertake no duty to update the contents of this
presentation after the date of this presentation. |
 NPA
Resolution Strategy Shift ($ in millions)
2
2
Strategy Objective:
More Aggressively Pursue NPA Resolution
Focus:
Selected Construction and Land Related Assets
Fourth Quarter 2010 Net Charge-Offs
Selected Assets
and OREO Write-Downs
Charge-Offs
Charge-Offs as
Beginning
Related to
Balance at
a % of
Related to
Balance
Strategy Shift
Dec. 31, 2010
Beginning Balance
Ordinary
Strategy Shift
Total
Asset Class
Residential Construction & Land Loans
$ 55
$ 26
$ 29
47%
$ 10
$ 26
$ 36
Commercial Construction & Land Loans
15
8
7
53%
0
8
8
Other Loans
21
3
14
14%
27
3
30
Subtotal
$ 91
$ 37
$ 54
41%
$ 37
$ 37
$ 74
OREO (Primarily Construction & Land)
24
11
13
46%
4
11
15
Total
$ 115
$ 48
$ 67
42%
$ 41
$ 48
$ 89
Reported Fourth Quarter 2010 Net Income to Common
($30)
Plus: NCOs / Losses Related to Shift in Strategy
48
Less: Tax Benefit
(19)
Adjusted Fourth Quarter 2010 Net Income to Common
($1)
Adjusted Fourth Quarter 2010 Earnings per Share
($0.02) |
 3
3
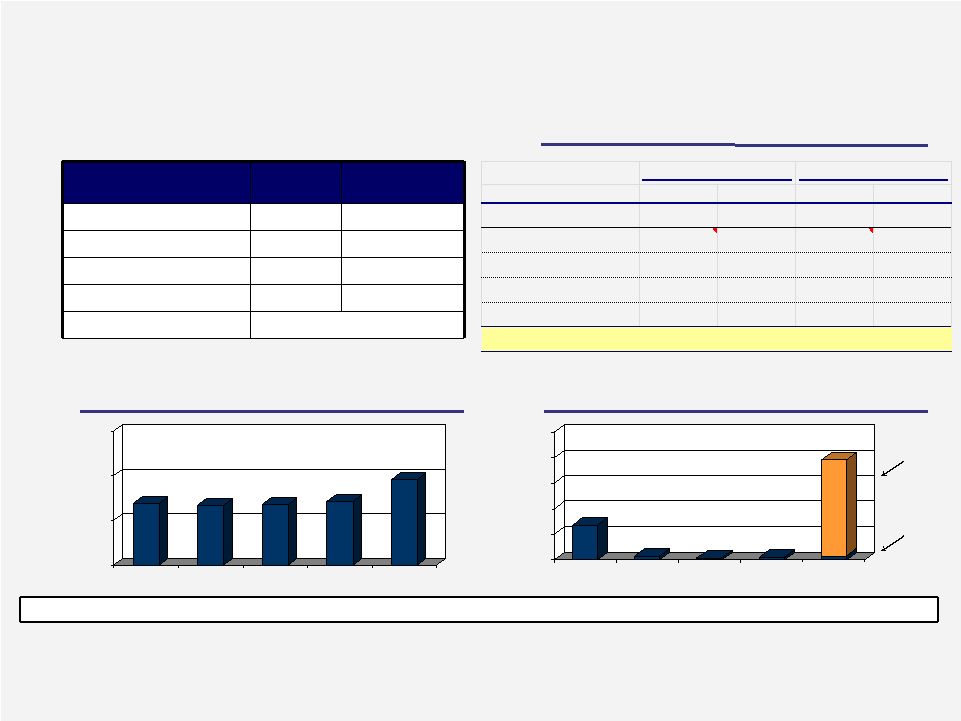
Residential Construction & Land Loans
Residential Construction & Land Loans
(Represent 3% of Total Loans; $ in Millions)
(Represent 3% of Total Loans; $ in Millions)
$113
$93
$71
$61
$52
$0
$60
$120
$180
4Q09
1Q10
2Q10
3Q10
4Q10
Non-Performing Loans
Net Charge-Offs
$38
$4
$10
$4
$10
$26
$0
$10
$20
$30
$40
$50
4Q09
1Q10
2Q10
3Q10
4Q10
Loan Summary
Performing
Non-
Performing
Size of Portfolio
$123
$52¹
Avg. Loan Size ($000s)
$542
$747
Supported by Interest Reserve
2%
0%
30-89 Days Past Due
$0
$0
Allocated Loss Reserve
$27
NPLs / Loans
35.9%
33.8%
29.5%
27.0%
30.0%
NCOs / Avg. Loans²
42.90%
6.03%
15.45%
7.64%
71.72%
Note: Portfolio data as of December 31, 2010, excludes covered loans.
¹
Includes $29 million of selected loans impacted by shift in strategy.
²
Annualized.
$36
Charge-
Offs
Related to
Shift in
Strategy
Ordinary
Charge-
Offs
Performing Loans
Non-Performing Loans
$
%
$
%
Raw Land
$
16
13
%
$
19
37
%
Developed Land
70
57
13
25
Under Construction
13
10
2
4
Substantially Completed
22
18
11
21
Mixed & Other
2
2
7
13
Total Loans
$
123
100
%
$
52
100
% |
 4
4
Commercial Construction & Land Loans
Commercial Construction & Land Loans
(Represent 3% of Total Loans; $ in Millions)
(Represent 3% of Total Loans; $ in Millions)
$21
$20
$20
$21
$29
$0
$15
$30
$45
4Q09
1Q10
2Q10
3Q10
4Q10
Non-Performing Loans
Net Charge-Offs
$3
<$1
<$1
<$1
<$1
$8
$0
$2
$4
$6
$8
$10
4Q09
1Q10
2Q10
3Q10
4Q10
NPLs
/ Loans
9.0%
8.6%
10.1%
11.1%
17.4%
NCOs / Avg. Loans²
4.07%
0.46%
0.21%
0.46%
17.33%
Performing
Non-Performing
Size of Portfolio
$135
$29¹
Avg. Loan Size ($000s)
$993
$3,490
Supported by Interest Reserve
11%
$0
30-89 Days Past Due
$0
$0
Allocated Loss Reserve
$8
Note: Portfolio data as of December 31, 2010, excludes covered loans.
¹
Includes $7 million of selected loans impacted by shift in strategy.
²
Annualized.
$8
Charge-
Offs
Related to
Shift in
Strategy
Ordinary
Charge-
Offs
Loan Summary
Performing Loans
Non-Performing Loans
$
%
$
%
Raw Land
$
28
21
%
$
19
66
%
Developed Land
62
46
10
34
Under Construction
23
17
–
–
Substantially Completed
22
16
–
–
Mixed & Other
0
0
–
–
Total Loans
$
135
100
%
$
29
100
% |
 5
5
Overview of Other Real Estate Owned (OREO)
Overview of Other Real Estate Owned (OREO)
($ in millions)
($ in millions)
Write-Downs As
Beginning
Write-Downs Related to
Balance at
a % Of Beginning
Property Type
Balance
Strategy Shift
December 31, 2010
Balance
Residential Lots
$ 13.6
$ 6.0
$ 7.6
44.2 %
Raw Land
11.0
3.5
7.5
31.9 %
Farm
5.6
1.0
4.7
17.2 %
Office, Retail, Industrial
4.3
0.0
4.3
0.0 %
Commercial Lots
4.1
0.0
4.1
0.0 %
Other Commercial
1.3
0.2
1.1
14.9 %
Single Family
1.1
0.0
1.1
0.0 %
Condo
0.8
0.0
0.8
0.0 %
Total
$ 41.8
$ 10.7
$ 31.1
25.5 %
Note: Portfolio data as of December 31, 2010, excludes covered OREO
|
 6
6 |