Attached files
| file | filename |
|---|---|
| 8-K - FORM 8-K - REGIONS FINANCIAL CORP | d8k.htm |
| EX-99.2 - SUPPLEMENTAL FINANCIAL INFORMATION - REGIONS FINANCIAL CORP | dex992.htm |
| EX-99.1 - PRESS RELEASE - REGIONS FINANCIAL CORP | dex991.htm |
 Regions Financial
4
th
Quarter Earnings Conference Call
January 25, 2011
Exhibit 99.3 |
 ›Forward-Looking Statements
2 |
 Summary of Fourth Quarter
2010 Results Earnings Highlights
›
Credit trends are improving
›
Non-performing loans, excluding loans HFS,
declined $212 million to $3.2 billion
›
Loan loss provision of $682 million; provision
essentially equaled net charge-offs
Credit Update
($ in millions)
4Q09
3Q10
4Q10
Non-performing loans *
$ 3,488
$ 3,372
$ 3,160
Net Charge Offs
$ 692
$ 759
$ 682
Provision Build
$ 487
$ 1
$ -
Loan Loss Provision
$ 1,179
$ 760
$ 682
Note: Amounts exclude non-core items impacting the current and prior quarters
* Non –
GAAP; Refer to Financial Supplement for adjustments to PPNR
($ in millions)
4Q09
3Q10
4Q10
Net Interest Income
$ 850
$ 868
$ 877
Adjusted Non-Interest Revenue*
$ 743
$ 748
$ 795
Adjusted Non-Interest Expense*
$ 1,207
$ 1,162
$ 1,211
Adjusted PPNR*
$ 386
$ 454
$ 461
EPS
($0.51)
($0.17)
$0.03
›
Earnings per diluted share of $0.03
›
Adjusted Pre-tax Pre-provision Net Revenue
(“PPNR”) of $461 million; compared to 3Q10:
›
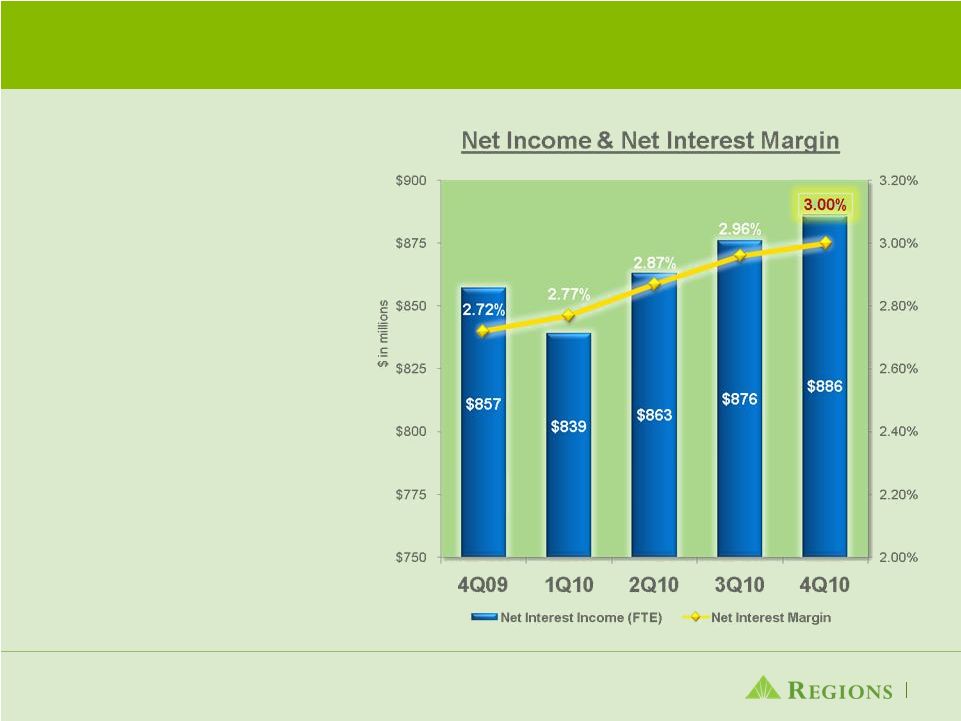
Net interest income increased $9 million and
net interest margin expanded 4 bps to 3.00%
›
Adjusted
non-interest
revenues
increased $47
million or 6% reflecting strong revenue at
Morgan Keegan
›
Adjusted non-interest expenses increased
$49 million or 4% primarily due to higher
professional and legal fees and Morgan
Keegan incentive-based compensation
1
*Excluding loans held for sale |
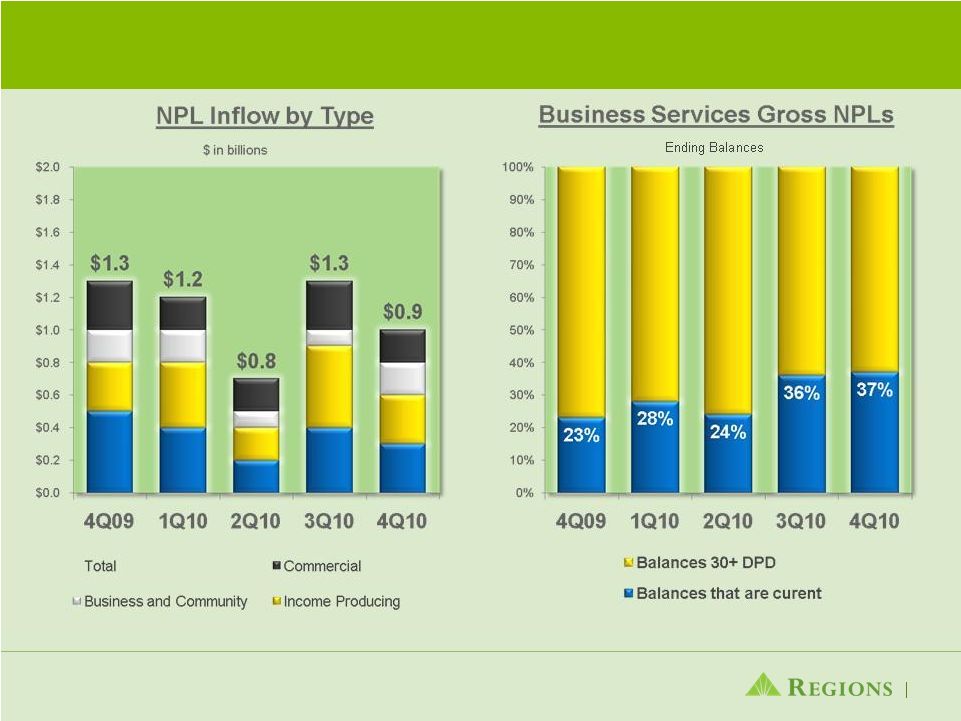 Non-Performing Loan
Inflows Decline 2 |
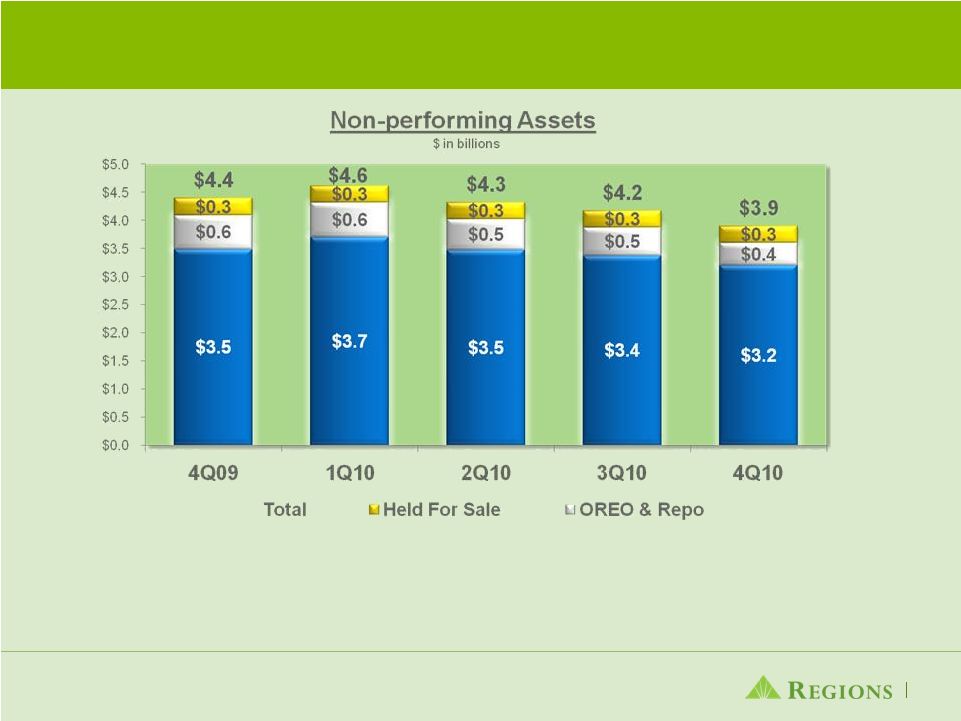 Non-performing Asset
Levels Decline ›
Non-performing loans declined $212 million
›
Non-performing assets declined $308 million from third quarter
›
For the full year non-performing assets declined $494 million
3 |
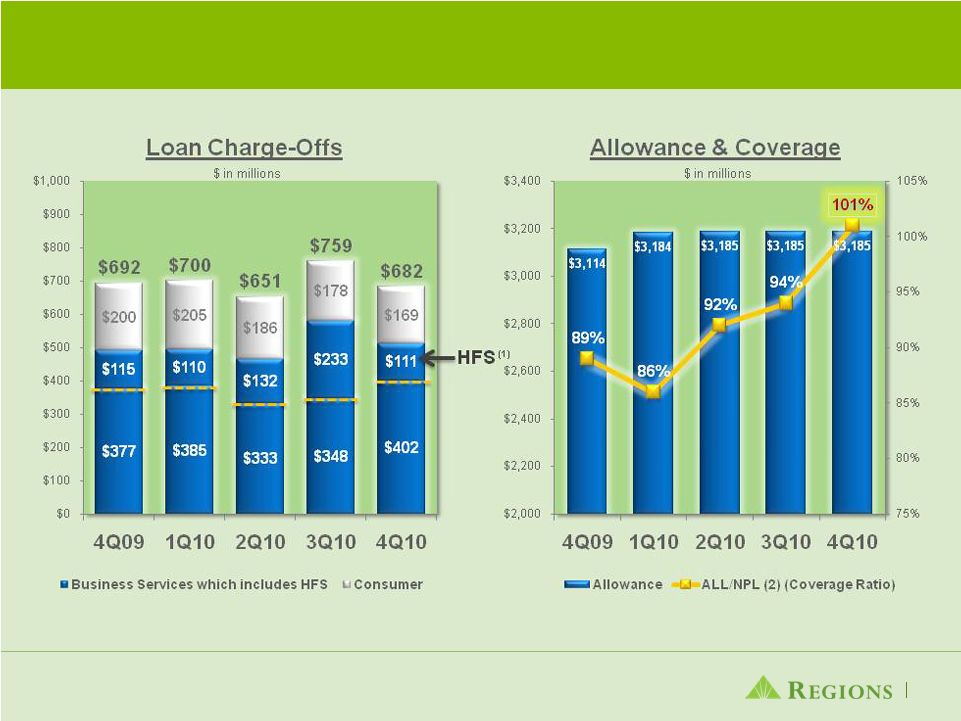 Loan Charge-Offs and
Allowance (1) Loan charge-offs related Sales / Transfer to Held for Sale
(2) Excludes loans held for sale
4 |
 Commercial and Industrial
Growing; Investor Real Estate Reflects De-risking Efforts
›
Specialty Lending Groups
›
Small Business Focus
›
Growth in C&I more broadly distributed across market and in more industries than the
3
rd
quarter
›
Investor Real Estate declined $1.6 billion; down close to $6 billion year-over-year
›
Targeting Specific Areas for Growth:
›
Direct Consumer
›
Underserved Banking Segment
($ in millions)
9/30/2010
12/31/2010
$ Change
% Change
Commercial & Industrial
21,501
$
22,540
$
1,039
$
5%
Commercial Real Estate - Owner-Occupied
12,372
12,516
144
1%
Investor Real Estate
17,464
15,908
(1,556)
-9%
Residential First Mortgage
15,723
14,898
(825)
-5%
Home Equity
14,534
14,226
(308)
-2%
Other consumer
2,826
2,776
(50)
-2%
Total Loans
84,420
$
82,864
$
(1,556)
$
-2%
Ending Balances
5 |
 Decline in Deposit Costs
Driven by Changing Deposit Mix
›
As anticipated, our improving cost structure impacted overall deposit balances
›
Deposit costs declined 6 bps linked quarter; down 51 bps year-over-year
›
Total funding costs declined 11 bps linked quarter to 0.91%
($ in millions)
3Q10
Avg Rate
4Q10
Avg Rate
$ Change
% Change
Low Cost Deposits
69,917
$
0.17%
71,273
$
0.17%
1,356
$
2%
Time Deposits
25,100
2.16%
23,347
2.07%
(1,753)
-7%
Customer Deposits
95,017
0.70%
94,620
0.64%
(397)
0%
Corporate Treasury Deposits
61
1.30%
22
3.61%
(39)
-64%
Total Deposits
95,078
$
0.70%
94,642
$
0.64%
(436)
$
0%
($ in millions)
9/30/2010
Deposit Mix %
12/31/2010
Deposit Mix %
$ Change
% Change
Low Cost Deposits
70,745
$
74%
71,813
$
76%
1,068
$
2%
Time Deposits
24,177
26%
22,784
24%
(1,393)
-6%
Customer Deposits
94,922
100%
94,597
100%
(325)
0%
Corporate Treasury Deposits
56
0%
17
0%
(39)
-70%
Total Deposits
94,978
$
100%
94,614
$
100%
(364)
$
0%
Ending Balances and Deposit Mix
Average Balances and Average Rates
6 |
 Decline in Deposit Costs
and Improvement in Loan Yields Drive Net Interest Income Higher
›
Net interest margin climbed
4bps linked quarter; up 28 bps
year-to-date
›
Repricing
opportunities remain
with over $13.5 billion of CD’s
maturing in the next 12
months at an average of
2.05%
›
Loan yields increased 5 bps
linked quarter; improvement
going forward will be driven by
widening loan spreads
›
Excess liquidity impacted
margin 11 bps compared to 8
bps in Q3
7 |
 Solid non-interest
revenue; focused expense management
›
Adjusted non-interest revenue* 6% higher versus prior quarter
›
Increase in interchange income reflects increased debit card volume and fee-
based account growth
›
Morgan Keegan’s revenues were solid reflecting strength in private client and
investment banking revenue
›
Mortgage revenue down due to MSR valuations
›
Adjusted non-interest expenses* 4% higher versus prior quarter
›
Increase in professional and legal fees
›
Increase in Morgan Keegan incentive-based compensation
›
Credit-related costs continue to result in higher non-interest expenses
8
* Non –
GAAP; Refer to page 26 of the Financial Supplement |
 Capital Ratios Remain
Strong; Liquidity Profile Solid
(1)
Current Quarter ratios are estimated
(2)
Subject to change as interpretation of Basel III rules is ongoing and dependent on guidance from Basel
and regulators.
›
Solid liquidity at both the bank and holding company
›
Loan-to-deposit ratio of 88 percent
›
Well-positioned with respect to the Liquidity Coverage Ratio
prescribed under Basel III
3Q10
4Q10
(1)
Pro forma for Basel III
4Q10
(2)
Tier 1 Common
7.6%
7.9%
7.6%
Tier 1 Capital
12.1%
12.4%
11.4%
Total Risk-Based Capital
16.0%
16.4%
14.9%
9 |
 |