Attached files
| file | filename |
|---|---|
| 8-K - FORM 8-K - COMERICA INC /NEW/ | d8k.htm |
| EX-99.1 - PRESS RELEASE - COMERICA INC /NEW/ | dex991.htm |
 Fourth Quarter 2010 Financial Review
January 18, 2011
Comerica Incorporated
Exhibit 99.2 |
 2
Safe Harbor Statement
Any statements in this presentation that are not historical facts are forward-looking statements
as defined in the Private Securities Litigation Reform Act of 1995. Words such as
"anticipates," "believes," "feels," "expects," "estimates," "seeks," "strives," "plans," "intends," "outlook," "forecast," "position,"
"target," "mission," "assume," "achievable," "potential,"
"strategy," "goal," "aspiration," "outcome," "continue," "remain," "maintain," "trend," "objective" and
variations of such words and similar expressions, or future or conditional verbs such as
"will," "would," "should," "could," "might," "can," "may" or similar
expressions, as they relate to Comerica or its management, are intended to identify
forward-looking statements. These forward-looking statements are predicated on the
beliefs and assumptions of Comerica’s management based on information known to Comerica’s management as of the date of this
news release and do not purport to speak as of any other date. Forward-looking statements may
include descriptions of plans and objectives of Comerica’s management for future or past
operations, products or services, and forecasts of Comerica’s revenue, earnings or other measures of
economic performance, including statements of profitability, business segments and subsidiaries,
estimates of credit trends and global stability. Such statements reflect the view of
Comerica’s management as of this date with respect to future events and are subject to risks and uncertainties. Should one
or more of these risks materialize or should underlying beliefs or assumptions prove incorrect,
Comerica’s actual results could differ materially from those discussed. Factors that
could cause or contribute to such differences are further economic downturns, changes in the pace of an economic recovery and
related changes in employment levels, changes in real estate values, fuel prices, energy costs or
other events that could affect customer income levels or general economic conditions, the
effects of recently enacted legislation, actions taken by or proposed by the U.S. Department of Treasury, the Board of
Governors of the Federal Reserve System, the Texas Department of Banking and the Federal Deposit
Insurance Corporation, legislation or regulations enacted in the future, and the impact and
expiration of such legislation and regulatory actions, the effects of war and other armed conflicts or acts of
terrorism, the effects of natural disasters including, but not limited to, hurricanes, tornadoes,
earthquakes, fires, droughts and floods, the disruption of private or public utilities,
the implementation of Comerica’s strategies and business models, management’s ability to maintain and expand customer
relationships, changes in customer borrowing, repayment, investment and deposit practices,
management’s ability to retain key officers and employees, changes in the accounting
treatment of any particular item, the impact of regulatory examinations, declines or other changes in the businesses or
industries in which Comerica has a concentration of loans, including, but not limited to, the
automotive production industry and the real estate business lines, the anticipated performance
of any new banking centers, the entry of new competitors in Comerica’s markets, changes in the level of fee income,
changes in applicable laws and regulations, including those concerning taxes, banking, securities and
insurance, changes in trade, monetary and fiscal policies, including the interest rate policies
of the Board of Governors of the Federal Reserve System, fluctuations in inflation or interest rates, changes in
general economic, political or industry conditions and related credit and market conditions, the
interdependence of financial service companies and adverse conditions in the stock market.
Comerica cautions that the foregoing list of factors is not exclusive. For discussion of factors that may cause
actual results to differ from expectations, please refer to our filings with the Securities and
Exchange Commission. In particular, please refer to “Item 1A. Risk Factors” beginning
on page 11 of Comerica’s Annual Report on Form 10-K for the year ended December 31, 2009, “Item 1A. Risk Factors”
beginning on page 67 of Comerica’s Quarterly Report on Form 10-Q for the quarter ended March
31, 2010, “Item 1A. Risk Factors” beginning on page 71 of Comerica’s Quarterly
Report on Form 10-Q for the quarter ended June 30, 2010 and “Item 1A. Risk Factors” beginning on page 72 of Comerica’s
Quarterly Report on Form 10-Q for the quarter ended September 30, 2010. Forward-looking
statements speak only as of the date they are made. Comerica does not undertake to update
forward-looking statements to reflect facts, circumstances, assumptions or events that occur after the date the
forward-looking statements are made. For any forward-looking statements made in this
presentation or in any documents, Comerica claims the protection of the safe harbor for
forward-looking statements contained in the Private Securities Litigation Reform Act of 1995. |
 3
Financial Results
$ in millions, except per share data
1
Estimated
2
Excludes trust preferred securities, fully redeemed on 10/1/10
3
See Supplemental Financial Data slides for reconciliation of non-GAAP financial
measures 1,640
789
480
3.24%
1,646
0.88
153
123
$277
FY10
134
_
_
Preferred stock dividends to U.S. Treasury
10.54%
10.08%
1
437
215
57
3.29%
405
0.53
95
$96
4Q10
9.96%
2
Tier 1 capital ratio
(118)
59
Net income (loss) attributable to common
shares
1,650
402
Noninterest expenses
10.39%
Tangible
common
equity
ratio
3
1,050
186
Noninterest income
1,082
122
Provision for loan losses
2.72%
3.23%
Net interest margin
1,567
404
Net interest income
(0.79)
0.33
Diluted income (loss) per common share
$17
$59
Net income
FY09
3Q10 |
 4
Fourth Quarter 2010 Highlights
Analysis of 4Q10 compared to 3Q10
1
Inflow to nonaccrual loans with book balances greater than $2 million
2
Watch
list:
generally
consistent
with
regulatory
defined
special
mention,
substandard
and
doubtful
loans
3
See Supplemental Financial Data slides for reconciliation of non-GAAP financial
measures Broad-based improvement in credit quality continues
•
Net credit related charge-offs declined $19 million to $113 million
•
Nonperforming assets declined $76 million
•
Inflow
to
nonaccrual
1
slowed
by
$114
million,
to
$180
million
•
Watch
list
loans
declined
$629
million,
to
$5,542
million
2
•
Provision for loan losses declined $65 million to $57 million
Period-end loan outstandings were stable with Commercial loans
increasing $713 million or 3%
•
Average loans increased $229 million, excluding $332 million decrease in
Commercial Real Estate line of business
Average core deposits increased $1.1 billion
•
Average noninterest bearing deposits increased $687 million
Revenue increased 5%
•
Strong fee income generation
Net interest margin increased 6 basis points to 3.29%
Capital ratios remain solid
•
Tangible
common
equity
ratio
3
of
10.54%
•
Fully redeemed trust preferred securities on October 1, 2010
|
 5
Commercial Loan Growth
Increases in:
•
National Dealer Services $276MM
•
Mortgage Banker Finance $158MM
•
Energy $73MM
Average balances in $ millions
1
CRE: Owner-occupied and Commercial Real Estate line of business construction
and mortgage loans 2
4Q10 compared to 3Q10
Decreases in:
•
Commercial Real Estate line of
business ($332MM)
•
Middle Market ($178MM)
•
Small Business Banking ($72MM)
3Q09
4Q09
1Q10
2Q10
3Q10
4Q10
Total Loans
44,782
42,753
41,313
40,672
40,102
39,999
Q-Q Change
(2,029)
(1,440)
(641)
(570)
(103)
Commerical
23,401
21,971
21,015
20,910
20,967
21,464
Q-Q Change
(1,430)
(956)
(105)
57
497
CRE
14,392
14,096
13,773
13,359
12,882
12,336
Q-Q Change
(296)
(323)
(414)
(477)
(546)
Average
loan
outstandings
included
2
:
Balance Sheet
Lines of Business
1 |
 6
$0
$10
$20
$30
$40
4Q08
1Q09
2Q09
3Q09
4Q09
1Q10
2Q10
3Q10
4Q10
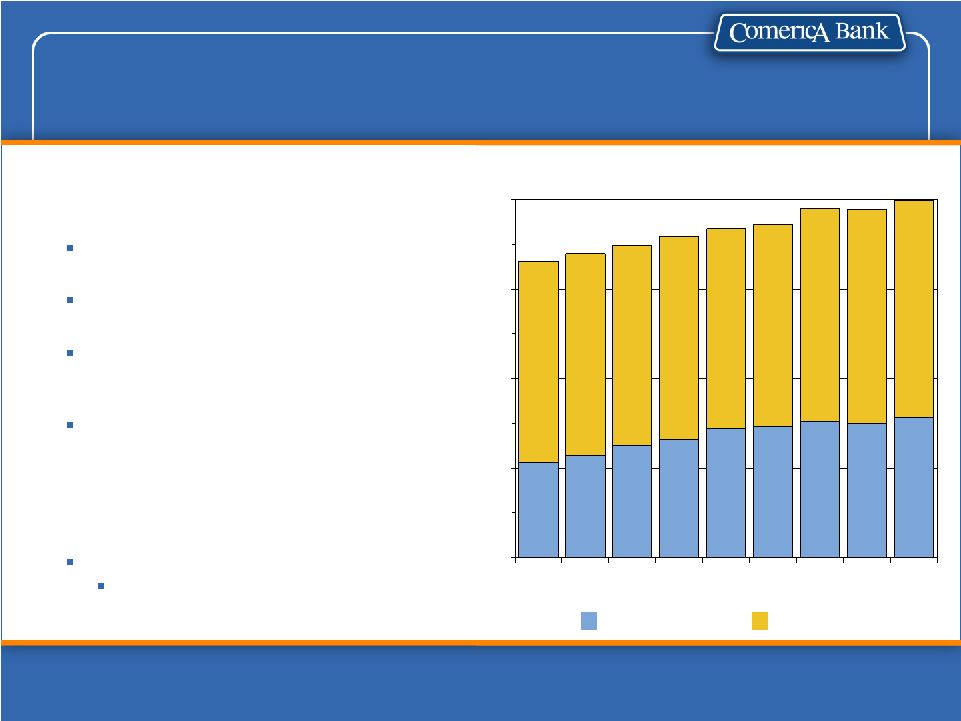
Core Deposits Increased
Average Core Deposits
$ in billions; 4Q10 vs 3Q10
1
Core
deposits
exclude
Institutional
CDs,
Retail
Brokered
CDs
and
foreign
office
time
deposits
Total
average
core
deposits
1
of
$39.9B, a $1.1B increase primarily
due to:
Noninterest-bearing deposits increased
$687MM
Money market and NOW deposits
increased $621MM
Customer CDs decreased $206MM
Total avg. core deposits:
Increased in:
•
Middle Market $442MM
•
Small Business $296MM
•
Technology & Life Sciences $152MM
•
Wealth Management $124MM
•
Financial Services Division $56MM
Decreased in:
Commercial Real Estate ($47MM)
Noninterest-bearing
Interest-bearing |
 7
3.29%
3.23%
3.28%
3.18%
2.94%
2.68%
2.25%
2.50%
2.75%
3.00%
3.25%
3Q09
4Q09
1Q10
2Q10
3Q10
4Q10
Net Interest Margin Improves
Excess
liquidity
position
2
:
4Q10
average $1.8B, down from
$3.0B in 3Q10
12/31/10 period end $1.3B
Negative impact on 4Q10 margin was
approximately 12 basis points
1
4Q10 vs. 3Q10
2
Excess liquidity represented by average deposits held at the Federal Reserve
Bank. See Supplemental Financial Data slide for reconciliation of
non-GAAP financial measures. Net interest margin increased six
basis
points
to
3.29%
reflecting
1
:
+
Decline
in
excess
liquidity
+
Redemption
of
higher-cost
Trust
Preferred securities (TruPS)
-
Decrease in yields on mortgage-
backed securities |
 8
A Leaner, More Efficient Company
6,000
8,000
10,000
12,000
2001
2002
2003
2004
2005
2006
2007
2008
2009
2010
Workforce Reductions
1
4Q10 vs. 3Q10
2
Offset by increase in deferred compensation asset returns in noninterest
income Noninterest
expenses
1
:
Salaries expense increased:
•
$10MM increase in incentives
as a result of improved financial
performance and rankings
relative to peers
•
$6MM increase in Deferred
Compensation
2
•
$3MM increase in Severance
Trust preferred securities
redemption charge of $5MM |
 9
$ in millions
Credit Quality Positive Trends Continued
$1,292
3.06%
$1,251
3.06%
$1,214
2.98%
$1,311
3.24%
$1,235
3.06%
Nonperforming assets
to total loans & foreclosed property
$266
$245
$199
$294
$180
Nonperforming assets inflow
$111
$89
$93
$120
$112
Foreclosed property
$101
$83
$115
$104
$62
Loans past due 90 days or more
and still accruing
$7,730
$7,502
$6,651
$6,171
$5,542
Total Watch list loans
$57
$113
1.13%
4Q10
$122
$132
1.32%
3Q10
$126
$146
1.44%
2Q10
$256
$175
Provision for Loan Losses
$173
1.68%
1Q10
$225
2.10%
4Q09
Net credit-related charge-offs
to average total loans
We believe we will continue to see improving credit quality reflecting
positive migration trends with some variability quarter to quarter
|
 10
108
91
62
86
36
60
40
140
148
162
87
110
73
72
$0
$100
$200
$300
2Q09
3Q09
4Q09
1Q10
2Q10
3Q10
4Q10
Positive trends in credit quality
resulted in significant decline in
the provision for loan losses
Allowance for credit losses of
$936MM
•
Decreased $59MM, reflecting
the positive trend in all credit
metrics, particularly the watch list
•
Allowance for loan losses to total
loans 2.24%
•
Allowance for loan losses to
nonperforming loans of 80%
Recoveries of $27MM, an
increase of $14MM
Loan Sales of $70MM, an
increase of $51MM
Provision for Loan Losses
Provision and Net Charge-offs
$ in millions; 4Q10 vs 3Q10
Credit Quality Positive Trends Continued
CRE Net Charge-Offs
Non CRE Net Charge-Offs
312
311
256
175
126
122
57 |
 11
Specialty
Businesses
$73MM
Small Business
$111MM
Other
$132MM
Middle
Market
$287MM
Commercial
Real Estate
$449MM
Global Corp
Banking
$28MM
$ in millions (MM); 4Q10 vs. 3Q10
Nonperforming Assets Declined
Nonperforming Assets of $1,235MM
included:
Nonaccrual loans decreased $83MM
•
Commercial Real Estate decreased
$80MM
•
Specialty Businesses decreased $14MM
$43MM Troubled Debt Restructurings
Foreclosed Property decreased $8MM
to $112MM
Average carrying value of nonaccrual
loans 54% (46% write-down)
Accruing Troubled Debt
Restructurings total $44MM
No nonaccrual loans Held-For-Sale
December 31, 2010
Nonaccrual Loans $1,080 million
By Line of Business |
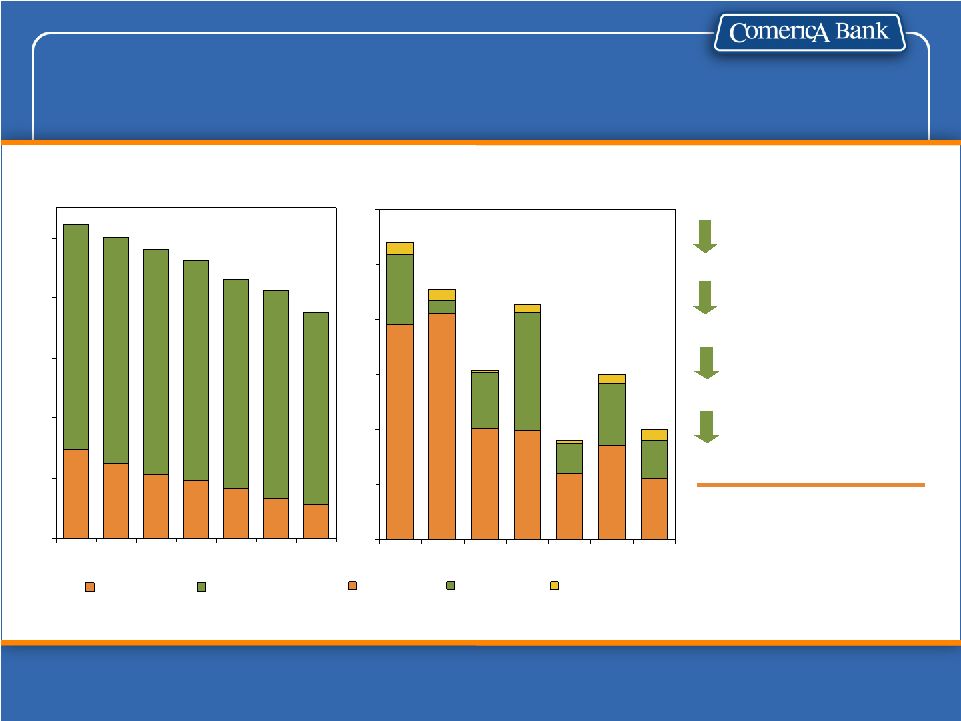 12
Expect variability
in credit metrics
with a general
improving trend
108
91
62
86
36
40
60
$0
$20
$40
$60
$80
$100
$120
2Q09
3Q09
4Q09
1Q10
2Q10
3Q10
4Q10
Residential
Commercial
Not Secured by RE
3,763
4,114
4,316
4,812
5,006
5,228
4,621
$0
$1,000
$2,000
$3,000
$4,000
$5,000
2Q09
3Q09
4Q09
1Q10
2Q10
3Q10
4Q10
Residential
Commercial
Commercial Real Estate Line of Business
Outstandings By
Property Type
Net Charge-offs By
Project Type
Period-end outstandings in $millions; excludes Commercial Real Estate line of
business loans not secured by real estate; Net Charge-offs $millions;
4Q10 vs. 3Q10
Commercial: Multi-Family, Retail, Office, Warehouse, Multi-use and
Commercial Charge-offs
decreased $19MM
Inflows to nonaccrual
decreased $61MM
Nonaccrual loans
decreased $80MM
Watch list loans
declined
$245MM |
 13
0%
2%
4%
6%
8%
10%
12%
4Q09
1Q10
2Q10
3Q10
4Q10
Strong Capital Ratios
Tier
I
Common
Capital
Ratio
1
Peer Median
Comerica
Among the best capitalized in
peer group
Quality of capital is solid
Tier 1 made up of 100% common
equity as of 10/1/10
Fully redeemed preferred stock
issued to U.S. Treasury in 1Q10
Redeemed $500MM of 6.57%
Trust Preferreds
(TruPS) on
10/01/10
Doubled quarterly common stock
dividend to $0.10 per share
Authorized share and warrant
repurchases
Strong capital supports future
growth
Source: SNL Financial
Peer Group: BBT, FITB, HBAN, KEY, MI, MTB, PNC, RF, STI, USB, ZION
1
See Supplemental Financial Data slides for reconcilements of non-GAAP financial
measures; 4Q10 estimated |
 14
2011 Full-Year Outlook
1
For the full-year 2011, management expects the following compared to
full-year 2010: Average loans: low single-digit decline
•
Excluding the Commercial Real Estate line of business, a low single-digit
increase in average loans •
Average earning assets of $48 billion
Net interest margin similar to 2010
•
Assumes no change in federal funds rate
Net credit-related charge-offs of $350 million to $400 million
•
Provision for credit losses to be $150 million to $200 million
Noninterest income: low single-digit decline
•
Fee income growth more than offset by impact of new regulations
Noninterest expenses: low single-digit increase
•
Reflects rising benefit costs
Income tax expense
•
36% of pre-tax income less $60 million in tax benefits
Cautiously manage capital
•
Commence share repurchase program that, combined with dividend payments, results
in a payout ratio less than 50% of earnings
1
This outlook is provided as of January 18, 2011 and does not include any impact
from the acquisition of Sterling Bancshares. Based on a continuation of modest
economic growth |
 Appendix |
 16
Basel III Implementation
New rules effective between 2013 and 2019; US adoption expected to occur over a
similar timeframe, but the final form of the US rules is uncertain
CMA is not a mandatory Basel II bank
CMA
Tier
1
Common
1
12/31/10:
10.1%
Regulatory required minimum by 2019: 7%
(4.5% minimum plus 2.5% “conservation
buffer”)
CMA has NO material impact from:
•
Mortgage servicing rights
•
Trust Preferreds
•
Deferred tax assets
•
Investments in financial institutions
Expected change in Risk Weighted Assets
not material
Higher degree of uncertainty regarding
implementation and interpretation
Will likely require more on-balance sheet
liquidity
•
Possibly increase or change the mix of
the investment securities portfolio
•
Continued focus on retail deposit
generation
Careful management of off-balance sheet
commitments; expect evolution of pricing
and terms of off-balance sheet commercial
commitments
Expected to be manageable given proven
ability to administer our balance sheet
Capital Requirement:
Liquidity Requirement:
1
See Supplemental Financial Data slides for reconciliation of non-GAAP financial
measures Impact
on
Comerica
is
estimated
and
subject
to
final
rulemaking.
Comerica
may
be
affected
by
other
changes
due
to
Basel
III. |
 17
Based on the two options contemplated in the draft
Fed rules, total debit card PIN ($9 million annual
revenue
)
and
signature-based
($31
million
annual
revenue
)
interchange
fees
in
2011
would
be
reduced
by
$13MM
-
$15MM
Direct impact on client-driven energy derivatives
business
($1
million
annual
revenue
)
As currently proposed by the FDIC, CMA expects
2011 FDIC insurance expense to remain consistent
with 2010 expense ($62 million).
As currently proposed by the FDIC, there will not be
a separate assessment for unlimited deposit
insurance coverage for this period.
Could lead to increased cost of commercial demand
deposits, depending on interplay of interest, deposit
credits, and service charges
Impacts
Allows for continued growth of CMA’s core client-
driven foreign exchange ($39 million annual
revenue
)
and
interest
rate
($7
million
annual
revenue
)
derivatives
business
Derivatives –
Allows continued trading of
foreign exchange and interest rate derivatives;
energy, uncleared commodities and agriculture
derivatives will move to a separate subsidiary
New rule is consistent with CMA’s focus on core
deposit growth
Deposit Insurance
–
Changes definition of
assessment base, increases fund’s minimum
reserve ratio & permanently increases insurable
level
Could provide impetus for additional deposit
generation
TAG Extension
-
Provide unlimited deposit
insurance on noninterest-bearing accounts from
12/31/10 to 12/31/12
Government card programs, such as the
DirectExpress Social Security program, are exempt
Interchange Fees -
Limits debit card transaction
processing fees that card issuers can charge
merchants
On October 1, 2010 fully redeemed all $500
million of Trust Preferred Securities at par
Trust Preferreds
-
Prohibits certain banks from
including Trust Preferreds in Tier 1 Capital
(phase out beginning 1/1/13)
Could provide impetus for additional deposit
generation
Interest
on
Demand
Deposits
-
Allows
interest
on commercial demand deposits (one year from
enactment)
Opportunities
Key Changes
1
Dodd-Frank
Wall
Street
Reform
and
Consumer
Protection
Act;
2
Based
on
2010
full-year
results
Impact
on
Comerica
is
estimated
and
subject
to
final
rulemaking.
Comerica
may
be
impacted
by
other
changes
due
to
the
financial reform legislation.
Timing of prescribed changes varies by rule.
Overall, relative impact from Financial Reform will likely be less than other major
banks Financial Reform
1
2
2
2
2
2 |
 18
Business and Market Segment
Contributions to Net Income
$17
(15)
(110)
43
(48)
$147
FY 09
$277
TOTAL
16
Other
1
(234)
Finance
(3)
Wealth &
Institutional
Management
(31)
Retail Bank
$529
Business Bank
FY 10
$ in millions
1
Includes discontinued operations and items not directly associated with the three
major business segments or the Finance Division 2
Includes discontinued operations and items not directly associated with the
geographic markets $17
(125)
24
77
(23)
40
(16)
$40
FY09
100
Other Markets
(13)
Florida
114
Western
$277
TOTAL
(218)
Finance and
Other
2
53
International
70
Texas
$171
Midwest
FY 10 |
 19
Investment Securities Portfolio
Consists primarily of AAA
mortgage-backed Freddie
Mac and Fannie Mae
government agency
securities
•
Net unrealized pre-tax gain
$55MM as of 12/31/10
•
Average life of 3.4 years as
of 12/31/10
Repurchased customers’
Auction-Rate Securities in
4Q08
•
Cumulative redemptions and
sales of $668MM
(4Q10 $12MM)
•
Cumulative gains on
redemptions and sales of
$27MM (4Q10 $1MM)
$ in millions (MM)
$3,500
$4,500
$5,500
$6,500
$7,500
$8,500
$9,500
$10,500
1Q09
2Q09
3Q09
4Q09
1Q10
2Q10
3Q10
4Q10
Average Auction-Rate Securities
Average Investment Securities Available-for-Sale
Target:
Mortgage-backed
Securities $6.5B |
 20
Other
Markets
$3.7B 9%
Int'l
$1.5B 4%
Florida
$1.6B 4%
Midwest
$14.3B 36%
Western
$12.5B 31%
Texas
$6.4B 16%
Diverse Loan Portfolio
1
Specialty Businesses includes: Financial Services Division, Entertainment,
Energy, Leasing, Mortgage Banker Finance and Technology and Life Sciences
(TLS ) Geography based on office of origination; Midwest: MI, OH, IL;
Western: CA, AZ, NV, CO, WA; Other
Markets
include
markets
not
separately
identified
above
in
addition
to
businesses
with
a
national
perspective
Average 4Q10: $40.0 billion
By Geographic Market
By Line of Business
Global Corp
Banking
$4.3B 11%
Commercial
Real Estate
$4.7B 12%
Middle
Market
$11.9B 30%
Nat'l Dealer
Services
$3.8B 9%
Specialty
Businesses
1
$5.3B 13%
Personal
Banking
$1.8B 4%
Small
Business
Banking
$3.4B 9%
Private
Banking
$4.8B 12% |
 21
Loans By Geographic Market
Average loans in $billions; Geography based on office of origination; Midwest: MI,
OH, IL; Western: CA, AZ, NV, CO, WA; Other
Markets
include
markets
not
separately
identified
above
in
addition
to
businesses
with
a
national
perspective
4Q10
3Q10
FY10
FY09
Midwest
$14.3
$14.3
$14.5
$17.0
Western
12.5
12.6
12.7
14.3
Texas
6.4
6.3
6.5
7.4
Florida
1.6
1.6
1.6
1.7
Other Markets
3.7
3.8
3.7
3.9
International
1.5
1.5
1.5
1.9
TOTAL
$40.0
$40.1
$40.5
$46.2 |
 22
Loans by Line of Business
Average loans in $billions;
1
Specialty Businesses includes: Financial Services Division, Entertainment, Energy,
Leasing, Mortgage Banker Finance, and TLS 4Q10
3Q10
FY10
FY09
Middle Market
$11.9
$12.0
$12.1
$14.3
Commercial Real Estate
4.7
5.1
5.2
6.1
Global Corporate Banking
4.3
4.4
4.6
6.0
National Dealer Services
3.8
3.5
3.4
3.5
Specialty Businesses
1
5.3
5.0
5.0
5.5
SUBTOTAL –
BUSINESS BANK
$30.0
$30.0
$30.3
$35.4
Small Business Banking
3.4
3.5
3.5
3.9
Personal Banking
1.8
1.8
1.9
2.1
SUBTOTAL –
RETAIL BANK
$5.2
$5.3
$5.4
$6.0
Private Banking
4.8
4.8
4.8
4.8
SUBTOTAL –
WEALTH &
INSTITUTIONAL MANAGEMENT
$4.8
$4.8
$4.8
$4.8
TOTAL
$40.0
$40.1
$40.5
$46.2 |
 23
Fourth Quarter 2010 Average Loans Detail
$ in billions; geography based on office of origination.
1
Specialty Businesses includes: Financial Services Division, Entertainment, Energy,
Leasing, Mortgage Banker Finance and TLS Midwest
Western
Texas
Florida
Other
Markets
Int’l
TOTAL
Middle Market
$5.3
$3.8
$1.7
$0.2
$0.9
$0.0
$11.9
Commercial Real Estate
0.9
1.4
1.2
0.4
0.8
-
4.7
Global Corporate Banking
1.3
0.8
0.2
0.1
0.4
1.5
4.3
National Dealer Services
0.7
2.4
0.2
0.3
0.2
-
3.8
Specialty Businesses
1
1.0
1.5
1.5
0.0
1.3
-
5.3
SUBTOTAL –
BUSINESS BANK
$9.2
$9.9
$4.8
$1.0
$3.6
$1.5
$30.0
Small Business Banking
1.7
0.8
0.9
-
-
-
3.4
Personal Banking
1.4
0.1
0.2
-
0.1
-
1.8
SUBTOTAL –
RETAIL BANK
$3.1
$0.9
$1.1
$-
$0.1
$-
$5.2
Private Banking
2.0
1.7
0.5
0.6
-
-
4.8
SUBTOTAL –
WEALTH &
INSTITUTIONAL MANAGEMENT
$2.0
$1.7
$0.5
$0.6
$0.0
$-
$4.8
TOTAL
$14.3
$12.5
$6.4
$1.6
$3.7
$1.5
$40.0 |
 24
Shared National Credit Relationships
Approx. 940
borrowers
Majority of relationships
include ancillary business
Comerica is agent for
approximately 17.5%
Adhere to same credit
underwriting standards as
rest of loan book
Credit quality mirrors total
portfolio
December 31, 2010: $7.3 billion
Shared National Credit (SNC): Facilities greater than $20 million shared by three
or more federally supervised financial institutions which are reviewed by
regulatory authorities at the agent bank level. Period-end outstandings
as of December 31, 2010 Global Corp
Banking
$2.3B 32%
Nat'l Dealer
Services $0.3B
4%
Energy
$1.3B 18%
Other
$0.5B 7%
Middle Market
$1.7B 23%
Commercial
Real Estate
$1.2B 16% |
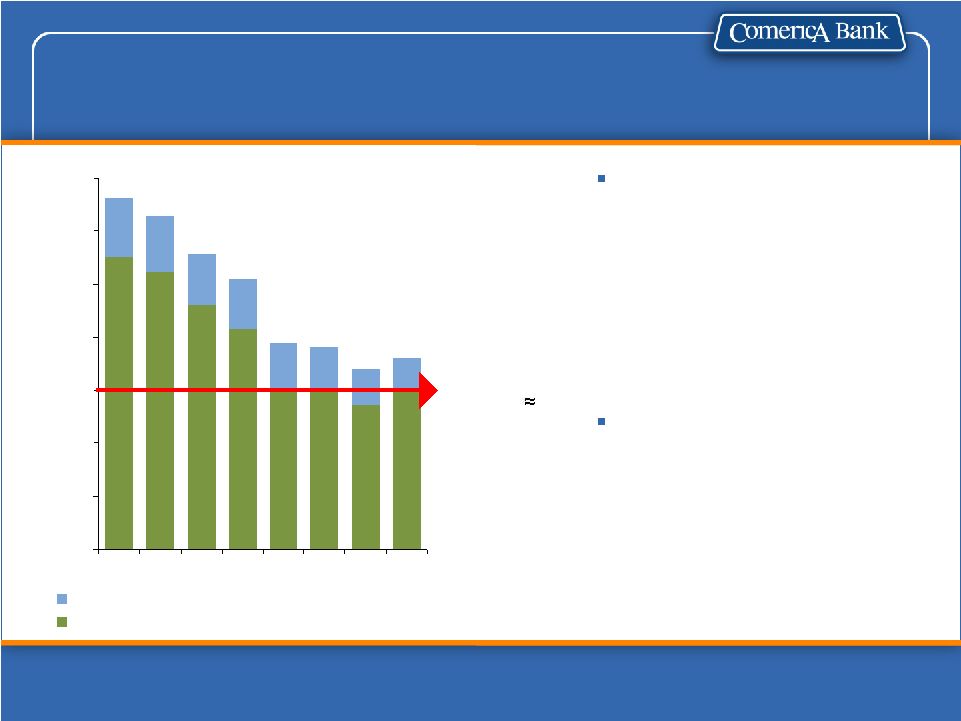
 25
5,542
8,250
6,651
7,502
7,730
6,171
3Q09
4Q09
1Q10
2Q10
3Q10
4Q10
Total
Watch
List
Loans
1
Watch List Improvement Continued
Watch list loans
1
decreased
$629MM, fifth
consecutive quarter
of decline
Watch list loans
1
decreased $2.7B
over past five
quarters
Loans past due 90 days or more
and still accruing declined
Foreclosed property decreased
and remains relatively small
$ in millions; Analysis of 4Q10 compared to 3Q10
1
Watch
list:
generally
consistent
with
regulatory
defined
special
mention,
substandard
and
doubtful
(nonaccrual)
loans |
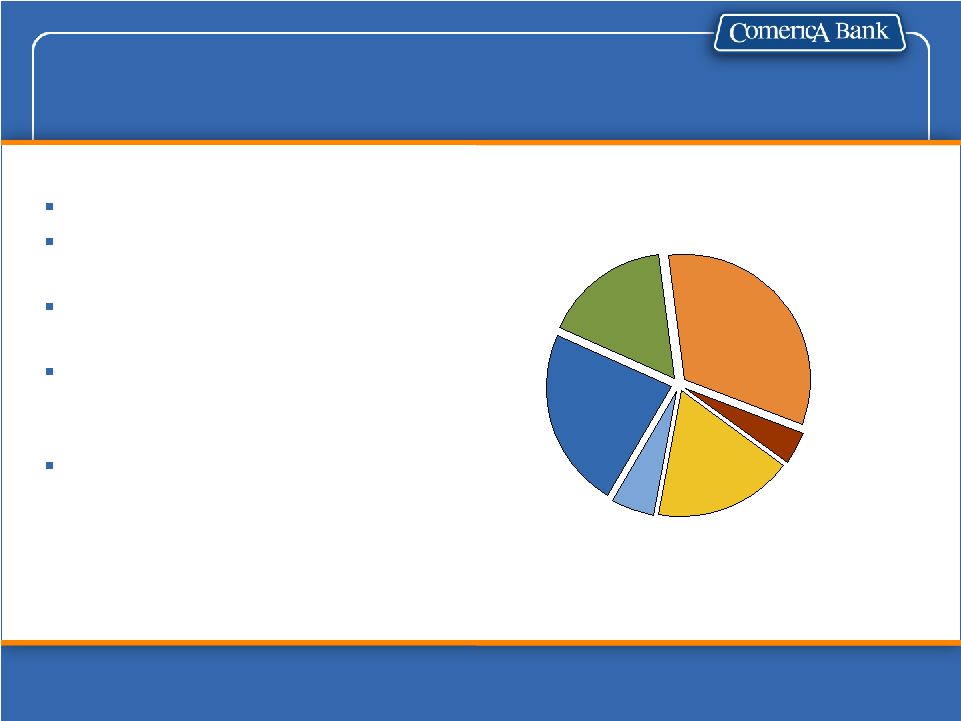
 26
By Geographic Market
Texas
$9MM 8%
Western
$42MM 37%
Midwest
$52MM 46%
Florida
$8MM 7%
Other Markets
$2MM 2%
Specialty
Businesses
$4MM 4%
Middle Market
$23MM 20%
Private Banking
$18MM 16%
Small Business
Banking $17MM
14%
Personal
Banking $5MM
5%
Global
Corporate
Banking $6MM
5%
Commercial
Real Estate
$40MM 36%
4Q10: $113 Million
Net Loan Charge-offs
By Line of Business
$ in millions; Geography based on office of origination; Midwest: MI, OH,
IL; Western: CA, AZ, NV, CO, WA Other
Markets
include
markets
not
separately
identified
above
in
addition
to
businesses
with
a
national
perspective
Specialty Businesses includes: Financial Services Division, Entertainment, Energy,
Leasing, Mortgage Banker Finance, TLS and National Dealer Services
|
 27
Net Loan Charge-offs by Line of Business
$ in millions;
1
Includes $26MM related to a Middle Market/National group that focused on higher
levered relationships 2
Specialty Businesses includes: Financial Services Division, Entertainment, Energy,
Leasing, Mortgage Banker Finance, TLS and National Dealer Services
4Q10
3Q10
2Q10
1Q10
4Q09
Commercial Real Estate
$40
$60
$36
$86
$62
Middle Market
23
32
71
1
39
76
Small Business Banking
17
14
16
20
22
Wealth & Institutional
Management
18
14
11
10
12
Specialty Businesses
4
8
4
10
18
Personal Banking
5
4
6
6
8
Global Corporate Banking
6
0
2
2
26
TOTAL
$113
$132
$146
$173
$224
Provision for loan losses
$57
$122
$126
$175
$256
2 |
 28
Net Loan Charge-offs by Market
$ in millions
Geography based on office of origination; Midwest: MI, OH, IL; Western: CA,
AZ, NV, CO, WA; 1
Other
Markets
include
markets
not
separately
identified
above
in
addition
to
businesses
with
a
national
perspective
2
Includes $26MM related to a Middle Market/National group that focused on higher
levered relationships 4Q10
3Q10
2Q10
1Q10
4Q09
Midwest
$52
$61
$44
$55
$97
Western
42
58
47
65
85
Texas
9
5
8
25
13
Florida
8
6
7
10
4
Other Markets /
International
2
2
40
2
18
25
TOTAL
$113
$132
$146
$173
$224
Provision for loan losses
$57
$122
$126
$175
$256
1 |
 29
Nonaccrual Loans
36
248
$5–$10
3
84
Over $25
1,066
$1,080
Total
23
342
$10–$25
58
179
$2–$5
946
$227
Under $2
# of Relationships
Outstanding
Period-end balances in $ millions (MM) as of December 31, 2010
Sold $41MM in nonperforming loans
at prices approximating carrying
value plus reserves in 4Q10
Proactively review nonaccrual loans
every quarter
Charge-offs and reserves taken to
reflect current market conditions
Granularity of nonaccrual loans:
72%
68%
66%
64%
61%
59%
56%
56%
55%
55%
54%
25%
40%
55%
70%
2Q08
4Q08
2Q09
4Q09
2Q10
4Q10
Carrying Value of Nonaccrual Loans
as % of Contractual Value |
 30
Commercial Real Estate Loan Portfolio
4Q10: $12.3 billion
4Q10 averages in $billions
1
Included in Commercial Real Estate line of business
Commercial Real Estate
Line of Business:
Nonaccrual loans of $449MM, down
$80MM from 3Q10
Loans over $2MM transferred to
nonaccrual totaled $71MM
($132MM in 3Q10 and $32MM in
2Q10)
Net loan charge-offs of
$40MM ($60MM in 3Q10
and $36MM in 2Q10)
Primarily
Owner-
Occupied
Commercial
Mortgages
$8.4B 68%
Real Estate
Construction
$1.9B 16%
Commercial
Mortgages
$2.0B 16%
1
1 |
 31
Commercial Real Estate Line of Business
December
31,
2010
Loan
Outstandings:
$3.8
billion
1
By Project Type
By Location of Property
Period-end balances in $billions;
1
Excludes Commercial Real Estate line of business loans not secured by real
estate Land Carry
$0.4B 10%
Land
Development
$0.2B 5%
Single Family
$0.3B 7%
Retail
$0.9B 23%
Multi-family
$0.9B 26%
Comml/Other
$0.3B 8%
Multi-use
$0.5B 12%
Other
Markets
$0.6B 15%
Florida
$0.5B 12%
Western
$1.2B 35%
Michigan
$0.5B 12%
Texas
$1.0B 26%
Office
$0.3B 9% |
 32
Real Estate Construction Loans
December 31, 2010 period-end $ in millions; Western: CA, AZ, NV
Commercial Real Estate Line of Business by Location of Property
47
-
-
33
14
-
Commercial
119
-
14
42
6
57
Office
201
27
-
52
5
117
Multi-use
579
92
131
227
-
129
Multi-family
Other CRE:
157
27
9
52
9
60
Land Development
353
45
48
74
27
159
Total Residential
485
29
27
262
48
119
Retail
18
-
2
6
-
10
Other
$1,826
$193
$222
$707
$109
$595
TOTAL
Residential:
-
$18
Other
Markets
24
-
11
9
4
Land Development
$196
$39
$22
$18
$99
Single Family
TOTAL
Florida
Texas
Michigan
Western |
 33
Commercial Mortgage Loans
Commercial Real Estate Line of Business by Location of Property
December 31, 2010 period-end $ in millions; Western: CA, AZ, NV
239
16
18
20
45
140
Land Carry
386
80
64
16
98
128
Retail
249
87
-
31
16
115
Multi-use
Other CRE:
202
41
37
35
31
58
Total
Residential
$69
$30
$6
$17
$3
$13
Single Family
Residential:
121
22
-
17
33
49
Commercial
221
17
11
12
34
147
Office
404
45
115
138
55
51
Multi-family
115
61
-
-
47
7
Other
$369
11
Other
Markets
$1,937
$245
$269
$359
$695
TOTAL
133
31
18
28
45
Land Carry
TOTAL
Florida
Texas
Michigan
Western |
 34
Residential Real Estate Development
$0
$500
$1,000
$1,500
$2,000
$2,500
2Q09
3Q08
4Q08
1Q09
2Q09
3Q09
4Q09
1Q10
2Q10
3Q10
4Q10
Single Family
Residential - Land Carry/Development
Period-end balances in $millions
Western: CA, AZ, NV
Reduced Residential Real
Estate Development
exposure by $1.7B since
6/30/08 to $555MM at
12/31/10
Geographic breakdown:
•
Western
39%
•
Texas
20%
•
Florida
15%
•
Michigan
11%
•
Other
15%
Reduced Western Market
Local Residential Real
Estate Developer Portfolio to
$105MM at 12/31/10 from
$932MM at 12/31/07 |
 35
Consumer Loan Portfolio
9.9% of total outstandings
No sub-prime mortgage programs
Self-originated & relationship
oriented
Net loan charge-offs of $17MM
4Q10: $4.0 billion
4Q10 averages in $billions; Geography based on office of origination
1
Residential mortgages on the balance sheet are primarily associated with Private
Banking customers. Residential mortgages originated through the
banking centers are typically sold to a third party. 2
The “other”
category includes automobile, personal watercraft, student and recreational
vehicle loans. 3
Data on loans booked through the Consumer Loan Center which encompasses about 86%
of the Home Equity Lines and Loans Consumer Loan Portfolio
Midwest
62%
Florida
3%
Texas
9%
Western
26%
About 85% home equity lines and 15%
home equity loans
Avg. FICO score of 753 at origination
86%
have
CLTV
80%
at
origination
Average loan vintage is 5.3 years
4Q10: $1.7 billion
Home Equity Portfolio
3
Consumer loans-
Other
2
$0.7B
17%
Consumer
Loans-Home
Equity $1.7B
43%
Residential
Mortgages
1
$1.6B
40% |
 36
Core Deposits By Geographic Market
Average
deposits
in
$
billions;
Geography
based
on
office
of
origination;
Midwest:
MI,
OH,
IL;
Western:
CA,
AZ,
NV,
CO,
WA;
Other
Markets
include
markets
not
separately
identified
above
in
addition
to
businesses
with
a
national
perspective
Excludes
Foreign
Office
Time
Deposits
(4Q10
$0.5B,
3Q10
$0.4B,
FY10
$0.5B,
FY09
$0.7B)
and
Inst.
&
Retail
Brokered
CDs
of
$0.1B
in
3Q10;
$0.3B
in
FY10;
and
$4.1B
in
FY09
4Q10
3Q10
FY10
FY09
Midwest
$17.9
$17.8
$17.7
$17.0
Western
12.5
11.8
12.0
11.1
Texas
5.6
5.4
5.3
4.5
Florida
0.4
0.4
0.4
0.3
Other Markets
2.2
2.2
2.2
1.6
International
1.1
1.1
1.0
0.8
Finance/Other
0.2
0.1
0.1
0.0
TOTAL
$39.9
$38.8
$38.7
$35.3 |
 37
Line of Business Deposits
4Q10
3Q10
FY10
FY09
Middle Market
$5.3
$4.8
$4.9
$4.3
Commercial Real Estate
0.9
0.9
1.0
0.7
Global Corporate Banking
6.6
6.6
6.6
5.1
National Dealer Services
0.2
0.2
0.2
0.1
Specialty Businesses
1
7.0
6.7
6.4
5.1
SUBTOTAL –
BUSINESS BANK
$20.0
$19.2
$19.1
$15.3
Small Business Banking
4.5
4.2
4.1
3.9
Personal Banking
12.7
12.8
12.8
13.5
SUBTOTAL –
RETAIL BANK
$17.2
$17.0
$16.9
$17.4
Private Banking
2.7
2.6
2.8
2.7
SUBTOTAL –
WEALTH &
INSTITUTIONAL MANAGEMENT
$2.7
$2.6
$2.8
$2.7
Finance/Other
2
0.5
0.5
0.7
4.6
TOTAL
$40.4
$39.3
$39.5
$40.0
Average deposits in $billions
1
Specialty Businesses includes: Entertainment, Energy, Financial Services Division, Leasing, Mortgage
Banker Finance and TLS 2
Finance/Other includes Inst. and Retail Brokered CD’s: 4Q10 - none; 3Q10 - $0.1B; FY10
- $0.3B; FY09 - $4.1B |
 38
Fourth Quarter 2010 Average Deposits Detail
$ in billions
1
Specialty
Businesses
includes:
Entertainment,
Energy,
Financial
Services
Division,
Leasing,
Mortgage
Banker
Finance
and
TLS
2
Finance/Other includes $0.1B in Inst. and Retail Brokered CD’s; included in
Finance Division segment Midwest
Western
Texas
Florida
Other
Markets
Int’l
TOTAL
Middle Market
$1.2
$3.4
$0.6
$0.0
$0.1
-
$5.3
Commercial Real Estate
0.2
0.5
0.1
0.0
0.1
-
0.9
Global Corporate Banking
3.0
0.5
0.9
0.1
0.8
1.3
6.6
National Dealer Services
0.1
0.1
0.0
0.0
0.0
-
0.2
Specialty Businesses
0.7
4.3
0.9
0.1
1.0
-
7.0
SUBTOTAL
–
BUSINESS
BANK
$5.2
$8.8
$2.5
$0.2
$2.0
$1.3
$20.0
Small Business Banking
2.2
1.1
1.2
-
-
-
4.5
Personal Banking
9.8
1.1
1.7
-
0.1
-
12.7
SUBTOTAL
–
RETAIL
BANK
$12.0
$2.2
$2.9
$--
$0.1
$--
$17.2
Private Banking
0.8
1.4
0.2
0.2
0.1
-
2.7
SUBTOTAL
–
WEALTH
&
INSTITUTIONAL MANAGEMENT
$0.8
$1.4
$0.2
$0.2
$0.1
$--
$2.7
Finance/Other
0.5
-
-
-
-
-
0.5
TOTAL
$18.5
$12.4
$5.6
$0.4
$2.2
$1.3
$40.4
1
2 |
 39
A
A
A-
A2
Comerica
BBB-
BBB-
BBB+
A-
BBB+
A-
BBB+
A-
A+
A+
AA-
Fitch
BBB
BB+
Ba3
Regions Financial
BBB
BBB
Baa2
Huntington
BBB (low)
BBB-
B2
Zions Bancorporation
BBB (high)
BB+
Baa1
Marshall & Ilsley
Baa1
Baa1
Baa1
A3
A3
A2
Aa3
Moody’s
A (high)
A
PNC
A (low)
A-
M&T Bank
A (high)
A
BB&T
A (low)
BBB
Fifth Third
A (low)
BBB
SunTrust
BBB (high)
BBB+
KeyCorp
AA
DBRS
S&P
Senior Unsecured/Long-Term Issuer Rating
A+
US Bancorp
Holding Company Debt Ratings
As of 01/11/2011
Source: SNL Financial
Debt Ratings are not a recommendation to buy, sell, or hold securities.
|
 40
Supplemental Financial Data
The
Tier
1
common
capital
ratio
removes
preferred
stock
and
qualifying
trust
preferred
securities
from
Tier
1
capital
as
defined
by
and calculated
in
conformity
with
bank
regulations.
The
tangible
common
equity
ratio
removes
preferred
stock
and
the
effect of
intangible assets from capital and the effect of intangible assets from total
assets. The Corporation believes these measurements are meaningful measures
of capital adequacy used by investors, regulators, management and others to
evaluate the adequacy of common equity and to compare against other companies in the industry.
1
Regulatory Capital, Tier 1 Capital and risk-weighted assets as defined and
calculated in accordance with regulation. 2
December 31, 2010 Regulatory Capital, Tier 1 Capital, and Risk-Weighted assets
are estimated. 10.39%
$54,848
$55,004
150
6
$5,701
$5,857
--
150
6
5,940
59,608
9.96%
$5,940
--
--
$8,566
9/30/10
10.54%
$53,511
$53,667
150
6
$5,637
$5,793
--
150
6
6,027
59,806
10.08%
$6,027
--
--
$8,654
12/31/10
10.11%
$55,729
$55,885
150
6
$5,636
$5,792
--
150
6
5,876
59,877
9.81%
$6,371
--
495
$9,001
6/30/10
9.68%
$56,949
$57,106
150
7
$5,511
$5,668
--
150
7
5,816
60,792
9.57%
$6,311
--
495
$9,062
3/31/10
$10,468
Total
Regulatory
Capital
2
7.99%
$59,091
$59,249
150
8
$4,720
$7,029
2,151
150
8
5,058
61,815
8.18%
$7,704
2,151
495
12/31/09
Total shareholders’
equity
Less:
Less: Goodwill
Less: Other intangible assets
Tangible common equity ratio
Total assets
Less: Goodwill
Less: Other intangible assets
Tangible common equity
Tier 1 capital
1,2
Less:
Less: Trust preferred securities
Tangible assets
Tier
1
common
capital
2
Risk-weighted
assets
1,2
Tier
1
common
capital
ratio
2
Fixed rate cumulative perpetual preferred stock
Fixed rate cumulative perpetual preferred stock
Reconciliation of non-GAAP financial measures with financial measures defined by GAAP ($ in
millions) |
 41
The Corporation believes this measurement provides meaningful information to investors, regulators,
management and others of the impact on net interest income and net interest margin resulting
from the Corporation’s short-term investment in low yielding instruments.
1
Excess liquidity represented by interest earned on and average balances deposited with the Federal
Reserve Bank. (0.19)%
3.23%
3.42%
$47,026
$50,009
2,983
$50,189
180
$403
$405
2
3Q10
$53,953
107
$52,941
62
$51,835
80
$49,102
139
Average earnings assets
Less: Average net unrealized gains on
investment securities available-for-sale
(0.12)%
3.29%
3.41%
$47,170
$48,963
1,793
$405
$406
1
4Q10
(0.23)%
3.28%
3.51%
$48,036
$51,755
3,719
$422
$424
2
2Q10
(0.24)%
3.18%
3.42%
$48,787
$52,879
4,092
$ 413
$ 416
3
1Q10
(0.13)%
2.94%
3.07%
$51,393
$53,846
2,453
$ 397
$ 398
1
4Q09
Average earnings assets for net interest
margin (FTE)
Less: Excess liquidity
1
Net interest margin (FTE)
Net interest margin (FTE), excluding
excess liquidity
Average earnings assets for net interest
margin (FTE), excluding excess liquidity
Net interest income (FTE)
Less: Interest earned on excess liquidity
Impact of excess liquidity on net interest
margin (FTE)
Net interest income (FTE), excluding
excess liquidity
Supplemental Financial Data
Reconciliation of non-GAAP financial measures with financial measures defined by GAAP ($ in
millions)
1 |
 |