Attached files
| file | filename |
|---|---|
| 8-K - KAMAN CORPORATION FORM 8-K DATED JANUARY 11, 2011 - KAMAN Corp | form8-k.htm |

Kaman Corporation (NASDAQ-GS: KAMN)
Kaman Corporation (NASDAQ-GS: KAMN)
Investor Presentation
January 12, 2011

2
Investment Summary
§ Significant long-term organic growth opportunities in Aerospace
and Industrial Distribution
and Industrial Distribution
§ High margin Aerospace business anchored by market leading
position in specialty bearings
position in specialty bearings
§ Participation on Military platforms in Aerospace provides recurring
revenue stream
revenue stream
§ Industrial Distribution business benefiting from industrial sector
momentum and gaining scale via recent acquisitions
momentum and gaining scale via recent acquisitions
§ Investing in new product development, new product applications,
acquisitions and technology to position the Company for long-term
growth
acquisitions and technology to position the Company for long-term
growth
§ Strong balance sheet to drive growth and strategic initiatives
3
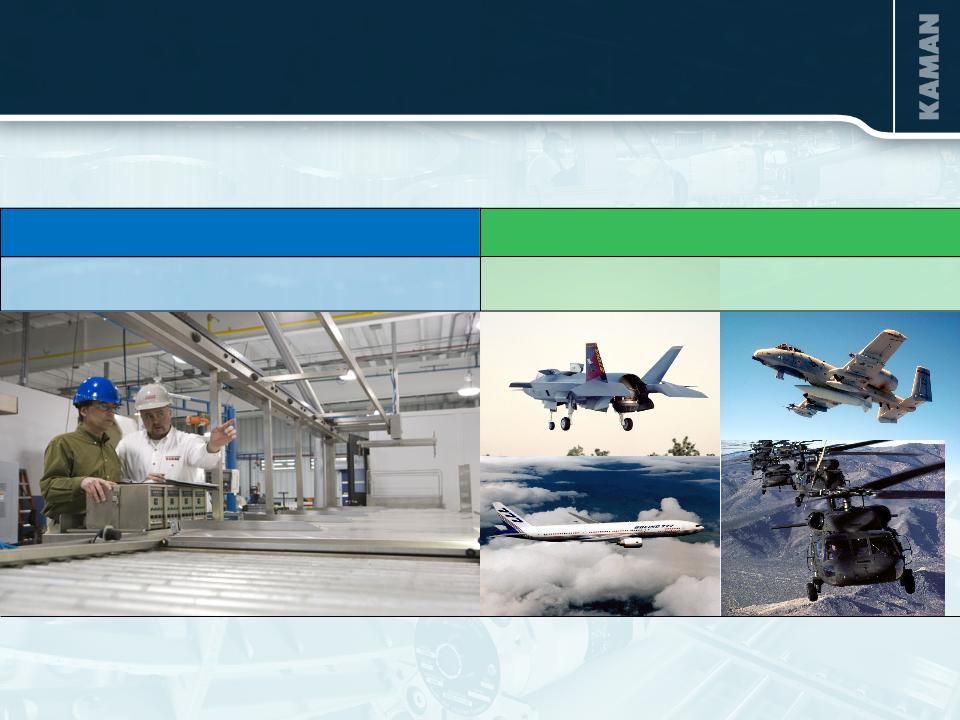
Operator of two diversified business segments:
(2010 Nine Month YTD Sales $953 Million)
Industrial Distribution
Aerospace
3rd largest power transmission/motion
control industrial distributor in North
America
control industrial distributor in North
America
Manufacturer and subcontractor in the
global commercial and military
aerospace and defense markets
global commercial and military
aerospace and defense markets
64% of 2010 Nine Month YTD Revenue
34% of 2010 Nine Month YTD Operating Profit
36% of 2010 Nine Month YTD Revenue
66% of 2010 Nine Month YTD Operating Profit
Corporate Overview

4
AEROSPACE
2010 Nine Month YTD Sales $340 Million

5
Aerospace Strategy
§ GROWTH - Increased capabilities through both internal
development and acquisitions to win major OEM and Tier 1
programs
development and acquisitions to win major OEM and Tier 1
programs
§ DIVERSIFICATION - Expand commercial content via growth
initiatives to achieve a better balance of aerospace revenues
initiatives to achieve a better balance of aerospace revenues
§ PROFITABILITY - Expand engineering capability to provide
differentiation and improved margins
differentiation and improved margins

6
Progress in Aerospace
§ Global Aerosystems acquisition
- Strongly supports strategic initiative to grow design content for
higher more protected margins (life of program vs. build to print)
higher more protected margins (life of program vs. build to print)
- Strong experienced base of 120 engineers
- Key customer positions
• Boeing, Kawasaki Heavy Industries, Mitsubishi Aircraft Corporation,
Mitsubishi Heavy Industries, Bombardier, Aviation Partners Boeing and
the Department of Defense
Mitsubishi Heavy Industries, Bombardier, Aviation Partners Boeing and
the Department of Defense
§ Team K-Max® awarded deployment contract for two unmanned
aerial systems
aerial systems
§ Building backlog through contract awards and an expanded
customer base
customer base

7
Aerospace End-Markets
Business/
Regional
3%
Military
69%
Commercial
28%
Based on 2009 Sales

8
Fixed trailing edge
Fuel tank access doors
Top covers
Red denotes bearing products
Nose landing gear
Rudder
Main landing gear
Flaps
Horizontal stabilizer
Doors
Engine/thrust reverser
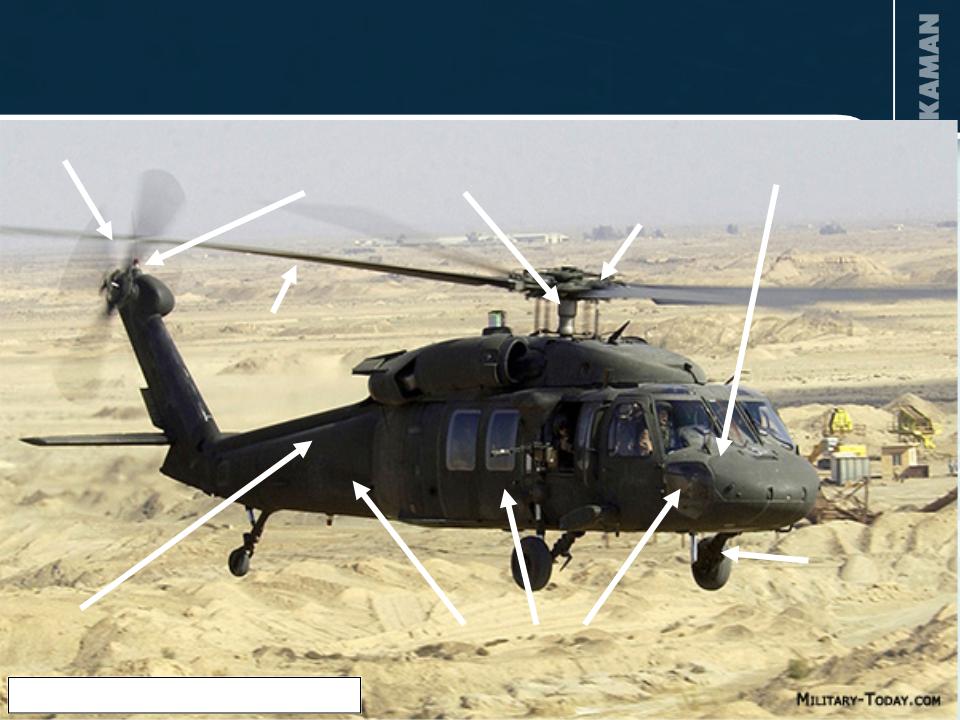
Aircraft Programs/Capabilities
Flight controls
9
Manufacture of cockpit
Blade erosion coating
Manufacture and assembly
of tail rotor pylon
of tail rotor pylon
Sub assembly and
joining of fuselage
joining of fuselage
Blade manufacture,
repair and overhaul
repair and overhaul
Driveline couplings
Bushings
Flight control bearings
Aircraft Programs/Capabilities
Red denotes bearing products

10
Market Leading Self Lube Airframe Bearing
Product Lines
Product Lines
§ Content on virtually every aircraft manufactured today
with a growing installed base
with a growing installed base
§ Proprietary technology:
– KAron® bearing liner system
– KAflex® driveline couplings
– Tufflex® machined driveline couplings
§ 95% of sales are for custom engineered applications
§ Operational excellence through lean manufacturing
§ Industry leading lead times

11
Strong Base Business
§ BLACK HAWK
§ Joint Programmable Fuze (JPF)
§ C-17

12
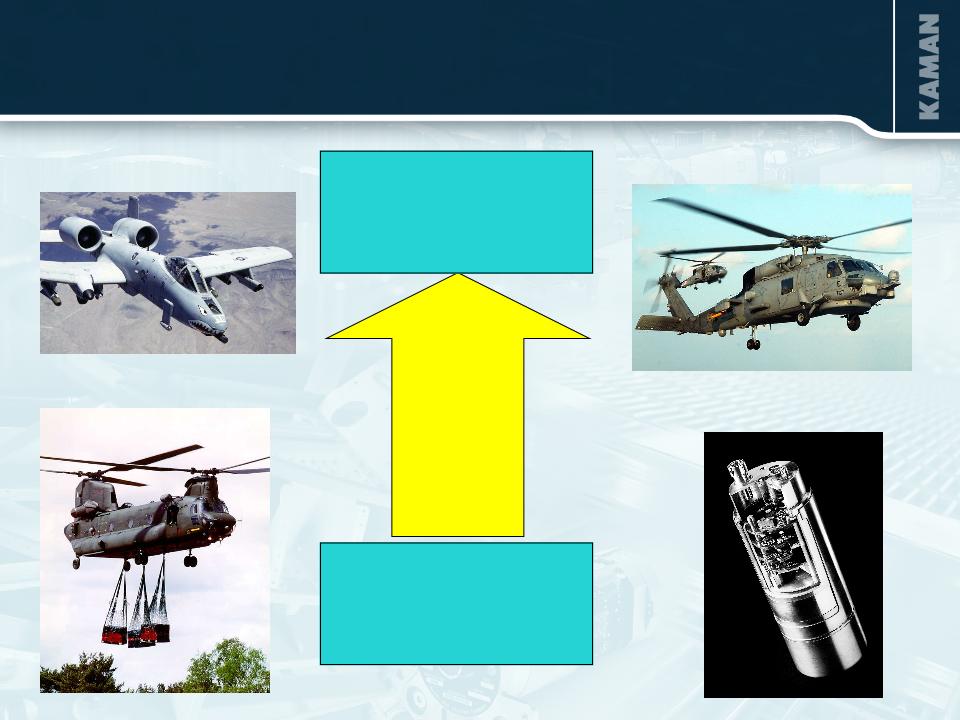
Growth Programs
§ A-10 re-wing
§ Boeing 787
§ F-35 (Joint Strike Fighter)
§ Airbus A380
§ Bell Helicopters
13
UP
25%
$524 Million
at 10/01/10
$418 Million
at 10/02/09
Opportunities Are Driving Backlog

14
Opportunities - New programs
§ Unmanned K-MAX®
§ SH-2G(I)
§ Airbus A350
§ JSF STOVL lift fan application
§ AW 169
§ Sukhoi Superjet 100

15
INDUSTRIAL DISTRIBUTION
2010 Nine Month YTD Sales $613 Million

16
Deliver Profitable Growth
Profitability
Operating ROS 3.4% à 7.0%
I
II
III
Strategic Pricing
Management
Management
Optimized Supply
Chain & Logistics
Chain & Logistics
Higher Margin Product
Lines
Lines
Global Sourcing /
Leverage purchasing
Leverage purchasing
9
10
11
12
Growth
Sales $800M+ à $1.5B
2
3
4
1
Productivity
Sales/employee $430k à $600k
6
7
8
5
Industrial Distribution Strategy

17
Executing Strategy and Building Network

18
§ Third largest industrial distribution firm serving $15 billion of the $23
billion power transmission / motion control market.
billion power transmission / motion control market.
§ 207 branches and 5 distribution centers
§ Major product categories:
- Bearings
- Mechanical and electrical power transmission
- Fluid Power
- Motion control
- Automation
- Material handling
§ Metrics:
- $371,000 sales per employee (2009)
- 2,000 employees (approximately one third outside sales)
- 3.5 million SKUs
- 50,000+ customers
Industrial Distribution Overview

19
Industrial Distribution

20
§ Organic growth strong
- Q310 up 17.1%, Q210 up 17.5%
- OEM markets extremely strong Q310 OEM sales (base business) up 45%
- MRO markets turned positive in Q2
- Sales trends remained consistent in Q410
- Broad based growth across geographies and end markets
§ Acquisitions accelerating top line and building scale
- Added geographic coverage, product line expansions, strong franchises
- Acquisitions expected to add $95 to $100 million in 2010
- Minarik and Allied expected to be accretive in 2010
Growing via Positive Sector Fundamentals
and Acquisitions
and Acquisitions

21
Industrial Distribution
Organic Sales Per Day Trends
Organic Sales Per Day Trends

22
Industrial Distribution
Growth Opportunities
Growth Opportunities
§ Broaden product offering organically and through acquisition to win
additional business from existing customers and gain market share
additional business from existing customers and gain market share
§ Enhance margins through new higher margin product lines, a focus
on pricing management and leverage from higher sales
on pricing management and leverage from higher sales
§ Recognize sales and cost synergies from the three acquisitions
completed in 2010
completed in 2010
§ Expand geographic footprint through additional acquisitions to
enhance Kaman’s position in the competition for national accounts
enhance Kaman’s position in the competition for national accounts
§ Improve productivity through technology investments to enhance
return on sales
return on sales

23
Metrics That Impact Management
Compensation
Compensation
§ 71% of CEO’s compensation in 2009 was performance related
§ Annual cash incentive
– Return on investment (Corporate* and Business Units)
– EPS growth (Corporate*)
– EPS performance against plan (Corporate*)
– Growth in operating income (Business Units)
– Annual objectives determined by business priorities (Business Units)
§ Long-term incentives
– Return on investment*
– Growth in EPS*
– Total shareholder return*
*Based on multi-year comparisons against the Russell 2000 index

24
Investment Merits
§ Leading Market Position in Both Business Segments
§ Two Distinct Markets Balance Overall Company Performance
§ Continued Focus on Profit Optimization, Increasing Cash
Flows
Flows
and Strengthening Competitive Position
§ Strong Liquidity and Conservative Financial Profile
§ Disciplined and Focused Acquisition Strategy
§ Experienced Management Team

25
Acquisitions
3 Acquisitions Completed to Date in 2010:
§ Minarik (April 30, 2010)
- Only national distributor of motion control & automation products
- 2009 sales: $84 million; Purchase price: $42.5 million
- Expands geographic coverage in 3 of the top 15 markets where Kaman has not been
well represented (e.g. San Jose, Cleveland, Chicago)
well represented (e.g. San Jose, Cleveland, Chicago)
- Diversifies traditional MRO customer base through primary OEM presence
- Expands product offering; positions Kaman as a leader in motion control &
automation
automation
§ Allied Bearings Supply (April 5, 2010)
- Distributor of bearings, power transmission, material handling, and industrial supplies
- 2009 sales: $22 million; Purchase price: $15 million
- Expands Kaman’s coverage in Oklahoma, Arkansas and Texas
- Adds volume in core product lines and provides access to chemical and petro-
chemical industries and oil and gas industries
chemical industries and oil and gas industries
§ Fawick de Mexico (February 26, 2010)
- Mexico City based fluid power distributor with coverage throughout most of Mexico
- 2009 sales: ~$4 million (USD); Purchase price: ~$5.0 million (USD)

26
FINANCIAL SUMMARY
36%
2010 Nine Month YTD Sales $953 Million

27
(1) Corporate expense percentage is to Total Sales
(2) As Adjusted
|
SEGMENT PERFORMANCE
(In thousands)
|
Net
Sales |
Operating
Income/(Loss) |
Operating
Margin |
|||
|
Q3 2010
|
Q3 2009
|
Q3 2010
|
Q3 2009
|
Q3 2010
|
Q3 2009
|
|
|
Industrial Distribution
|
$ 223,127
|
$ 162,921
|
$ 8,494
|
$ 3,388
|
3.8%
|
2.1%
|
|
Aerospace
|
126,980
|
20,986(2) |
19,906
|
15.7%(2) |
15.7%
|
|
|
Net gain/(loss) on sale of assets
|
|
|
(5)
|
(3)
|
|
|
|
Corporate expense
|
|
|
(7,914)
|
(8,625)
|
(2.2%)(1) |
(3.0%)(1)
|
|
Sales/Op. inc. from continuing ops
|
$357,245(2)
|
$ 289,901
|
$ 21,561(2)
|
$ 14,666
|
6.0%
|
5.1%
|
|
|
|
|
|
|
|
|
|
GAAP reconciliation:
As reported Aerospace
|
$ 136,418
|
|
$ 19,017
|
|
|
|
|
Aerospace contract settlement
|
(2,259)
|
|
1,969
|
|
|
|
|
Adjusted - Aerospace
|
$ 134,118(2)
|
|
$ 20,986(2)
|
|
|
|
Recent Results

28
|
(In Millions)
|
As of 10/01/10
|
As of 12/31/09
|
As of 12/31/08
|
|
Cash and Cash Equivalents
|
$ 11.9
|
$ 18.0
|
$ 8.2
|
|
Notes Payable and Long-term Debt
|
$ 106.3
|
$ 63.6
|
$ 94.2
|
|
Shareholders’ Equity
|
$ 353.4
|
$ 312.9
|
$ 274.3
|
|
Debt as % of Total Capitalization
|
23.1% |
16.9%
|
25.6%
|
|
Capital Expenditures
|
$14.5(1) |
$ 13.6
|
$ 16.0
|
|
Depreciation & Amortization |
$15.3(1) |
$ 16.1
|
$ 12.8
|
Balance Sheet and Capital Factors
(1)YTD at 10/1/10

29
APPENDIX

30
Source: Boeing and Airbus historical data and ISM
Aerospace Orders and Deliveries vs. ISM Index
Why Two Businesses? Diversifies Revenue
0
500
1,000
1,500
2,000
2,500
3,000
30.0
35.0
40.0
45.0
50.0
55.0
60.0
65.0
70.0
Boeing
Airbus
Boeing
Airbus
ISM index
Orders
Deliveries

31
Kamatics Lean Journey
§ Bloomfield Kamatics facility has successfully
implemented lean manufacturing processes
implemented lean manufacturing processes
§ Since introducing lean in 2000 Kamatics has:
- Doubled sales
- Increased return on identifiable assets by more than
5,400 basis points
5,400 basis points
- Kept headcount constant
- Doubled sales per employee
- Increased on-time deliveries to more than 90% from less
than 50%
than 50%
- Developed industry leading lead-times of 4-8 weeks from
12-18 weeks
12-18 weeks

32
Aerospace Awards
§ UTC Supplier Gold at Kamatics
§ Top 100 Supplier to Sikorsky
- Kamatics
- Aerostructures - Jacksonville
§ Aviation Week - Top Performing Companies
- 2009 Five-Year Most Improved

33
Unmanned K-MAX® Award

34
Recent JPF Contract Awards

35
FORWARD-LOOKING STATEMENTS
This presentation contains forward-looking information relating to the company's business and prospects, including the Aerospace and Industrial
Distribution businesses, operating cash flow, and other matters that involve a number of uncertainties that may cause actual results to differ materially
from expectations. Those uncertainties include, but are not limited to: 1) the successful conclusion of competitions for government programs and
thereafter contract negotiations with government authorities, both foreign and domestic; 2) political conditions in countries where the company does or
intends to do business; 3) standard government contract provisions permitting renegotiation of terms and termination for the convenience of the
government; 4) domestic and foreign economic and competitive conditions in markets served by the company, particularly the defense, commercial
aviation and industrial production markets; 5) risks associated with successful implementation and ramp up of significant new programs; 6) potential
difficulties associated with variable acceptance test results, given sensitive production materials and extreme test parameters; 7) management's success
in increasing the volume of profitable work at the Wichita facility; 8) successful resale of the SH-2G(I) aircraft, equipment and spare parts; 9) receipt and
successful execution of production orders for the JPF U.S. government contract, including the exercise of all contract options and receipt of orders from
allied militaries, as all have been assumed in connection with goodwill impairment evaluations; 10) satisfactory resolution of the company’s litigation
relating to the FMU-143 program; 11) continued support of the existing K-MAX helicopter fleet, including sale of existing K-MAX spare parts inventory;
12) cost estimates associated with environmental remediation activities at the Bloomfield, Moosup and New Hartford, CT facilities and our U.K. facilities;
13) profitable integration of acquired businesses into the company's operations; 14) changes in supplier sales or vendor incentive policies; 15) the effects
of price increases or decreases; 16) the effects of pension regulations, pension plan assumptions and future contributions; 17) future levels of
indebtedness and capital expenditures; 18) continued availability of raw materials and other commodities in adequate supplies and the effect of
increased costs for such items; 19) the effects of currency exchange rates and foreign competition on future operations; 20) changes in laws and
regulations, taxes, interest rates, inflation rates and general business conditions; 21) future repurchases and/or issuances of common stock; and 22)
other risks and uncertainties set forth in the company's annual, quarterly and current reports, proxy statements and other filings with the U.S. Securities
and Exchange Commission. Any forward-looking information provided in this presentation should be considered with these factors in mind. The company
assumes no obligation to update any forward-looking statements contained in this presentation.
Contact: Eric Remington
V.P., Investor Relations
(860) 243-6334
Eric.Remington@kaman.com