Attached files
| file | filename |
|---|---|
| 8-K - FORM 8-K - rue21, inc. | l41328e8vk.htm |
Exhibit 99.1

| 1 |
| Safe Harbor Statement 2 2 |

| Why Invest in rue21 3 |
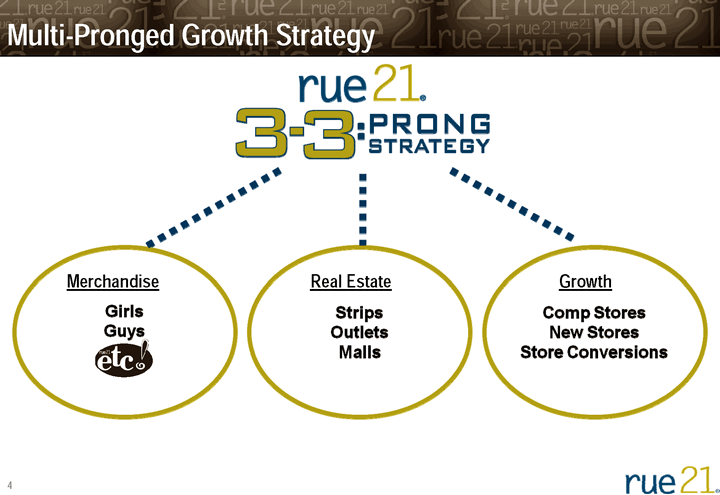
| Multi-Pronged Growth Strategy 4 Merchandise Real Estate Growth |

| Experienced Management Team 5 Bob Fisch President, CEO and Chairman Kim Reynolds Senior VP and GMM Keith McDonough Senior VP and CFO Perry Bugnar Senior VP & Director of Stores Mike Holland Senior VP, IT Mark Chrystal Senior VP, Planning & Allocation Bob Thomson Senior VP, Real Estate Executive Years in Industry Years at rue21 30+ 25+ 25+ 30+ 20+ 15+ 25+ 9 9 7 9 6 3 4 Management has ~9% ownership in the company |

| Well-Positioned for a New Reality of Retailing 6 Compelling Branded Value Proposition Speed to Market in Merchandising Speed to Market in Real Estate Leading Presence in Underserved Communities |

| Flexible Fast Fashion Business Model 7 Benefits of our sourcing strategy include: Short lead times (7 days to 90 days) Competitive product pricing Vendor accountability for merchandise performance No overseas / sourcing expenses Quickly identify and respond to newest fashion trends Item-based merchandising strategy (vs. collections) Work closely with a network of US-based importers We do not own or operate any manufacturing facilities |

| Leading Retailer in Underserved Markets We focus on small- and middle-market communities, where household incomes do not typically support higher-priced retailers Small markets (populations typically less than 50,000) rue21 tends to be the only girls and guys specialty apparel retailer in our shopping centers Positioned typically in strip centers with other value retailers (e.g. Walmart) and regional malls Middle markets (populations typically 50,000-200,000) rue21 is positioned for dominance within the community typically separating itself from the other retail competition Competition includes Walmart, Target, Kohl's and other big-box and small-box value retailers and regional malls Future store plan by market size: Strip Centers: 45% small markets, 55% middle markets Malls: 15% small markets, 85% middle markets Malls: 15% small markets, 85% middle markets Malls: 15% small markets, 85% middle markets Malls: 15% small markets, 85% middle markets Malls: 15% small markets, 85% middle markets Malls: 15% small markets, 85% middle markets Malls: 15% small markets, 85% middle markets Malls: 15% small markets, 85% middle markets Malls: 15% small markets, 85% middle markets Malls: 15% small markets, 85% middle markets Malls: 15% small markets, 85% middle markets Malls: 15% small markets, 85% middle markets Malls: 15% small markets, 85% middle markets Malls: 15% small markets, 85% middle markets 8 8 |
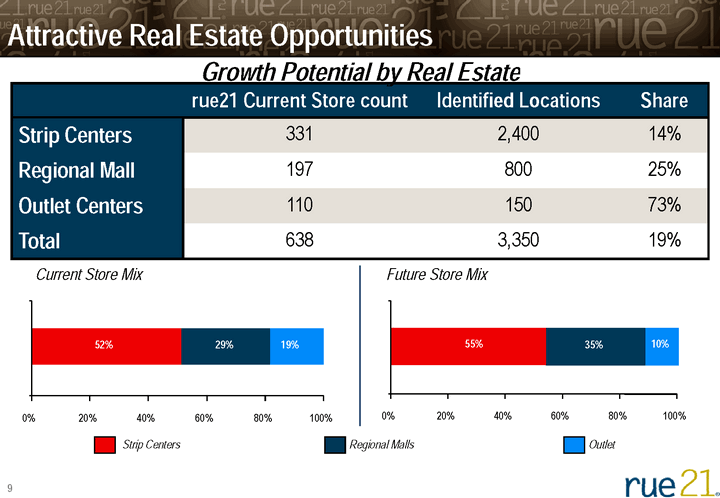
| Future Store Mix rue21 Current Store count Identified Locations Share Strip Centers 331 2,400 14% Regional Mall 197 800 25% Outlet Centers 110 150 73% Total 638 3,350 19% Attractive Real Estate Opportunities 9 Current Store Mix welshma 10/20/2009 12:38:57 PM Why do we have huge opportunity while others are at saturation - our unique real estate strategy and attractive store model --Others scratch their head at how we are able to make it work Strip centers will remain primary focus --At 256 stores currently, only 11% of total strip opportunity Regional malls also an opportunity Seeing GREAT REAL ESTATE OPPORTUNITIES in this market --Our real estate team is doing tremendous job getting us into great spaces at attractive terms Regional Malls Outlet 52% 29% 19% 0% 20% 40% 60% 80% 100% 35% 0% 20% 40% 60% 80% 100% 10% 55% Growth Potential by Real Estate |

| Proven Real Estate Execution In-House Expertise Discipline Speed to Market Entire real estate team located at headquarters 6 weeks from lease signing to store opening Track record of opening stores on or ahead of plan Opportunities filtered from 400+ potential sites to 100 best opportunities CEO reviews and approves all real estate deals Increasing New Store Productivity Decreasing Rents per New Store Results: INCREASING STORE LEVEL RETURNS 10 |
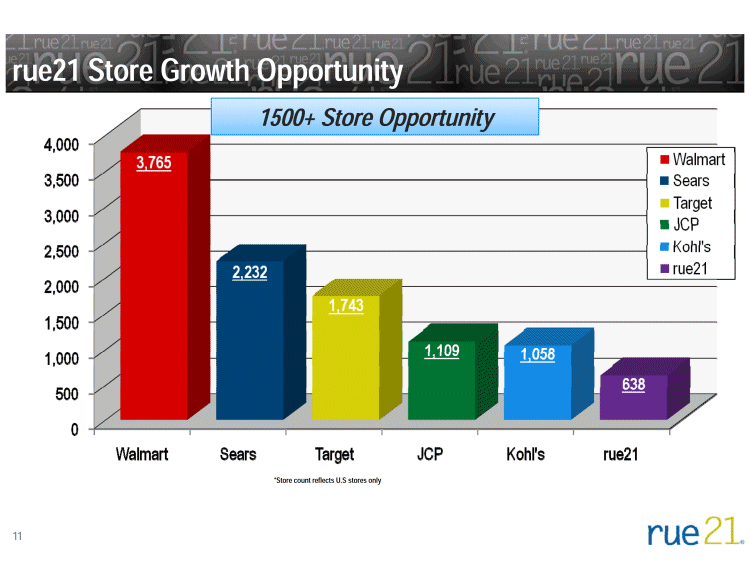
| rue21 Store Growth Opportunity 11 1500+ Store Opportunity *Store count reflects U.S stores only |

| rue21 Store Growth Opportunity 12 1500+ Store Opportunity *Store count reflects U.S stores only |
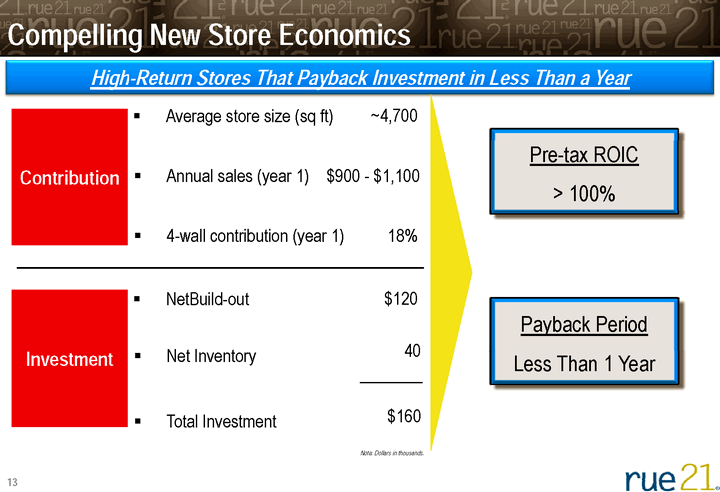
| Compelling New Store Economics 13 welshma 10/20/2009 1:29:34 PM rue21 WILL double store base in next 5 years We've done it over last 3.5 years - will do it again over next 5 Organization knows how to do it - real estate, store ops, senior management --100 stores in 2010 BEST IN INDUSTRY STORE MODEL These are profitable stores in no time - no one else can claim this --Only $160K investment --Payback in < 1 year High-Return Stores That Payback Investment in Less Than a Year Note: Dollars in thousands. Pre-tax ROIC > 100% Payback Period Less Than 1 Year Contribution Investment Average store size (sq ft) ~4,700 Annual sales (year 1) $900 - $1,100 4-wall contribution (year 1) 18% NetBuild-out $120 Total Investment $160 40 Net Inventory |

| Talking Points to Q3 Investor Call: Comps and Cotton Positioned to withstand 2011 inflation drivers Accessories etc! category is 25% of sales and not cotton dependent Good, better, best merchandise strategy creates opportunity for higher selling price mix that maintains value proposition Upside margin opportunities to be captured with improved allocation and planning business processes then later advanced systems will be added New store performances & comp sales projections are related New stores open close to full maturity and ROI is a year or less New stores fall into comp category after 15 months then comp in line with rest of chain Overall comp sales do not spike on rate of new store openings in last 1, 2 or 3 years 14 |

| Ability to Expand Net Income by Double Digits in Low Comp Growth Quarters Expansion of Net Income 15 *Includes incremental public company and stock company expenses First Second Third Fourth First Second Third Fourth Quarter Quarter Quarter Quarter Quarter Quarter Quarter Quarter Net Sales 63,745 $ 77,282 $ 72,929 $ 82,931 $ 76,779 $ 98,058 $ 97,464 $ 119,113 $ Net Income 535 $ 3,288 $ 1,855 $ 3,455 $ 836 $ 4,315 $ 2,890 $ 4,598 $ Net Sales Growth 40.1% 42.0% 27.9% 20.9% 20.4% 26.9% 33.6% 43.6% Net Income Growth 249.7% 59.0% 50.9% 22.5% 56.3% 31.2% 55.8% 33.1% Comp Store Sales 12.7% 8.9% 9.8% 1.8% -5.2% 0.7% 6.6% 11.2% First Second Third Fourth First Second Third Quarter Quarter Quarter Quarter Quarter Quarter Quarter Net Sales 107,998 $ 125,106 $ 137,110 $ 155,386 $ 137,772 $ 142,950 $ 163,914 $ Net Income 2,989 $ 5,328 $ 5,978 $ 7,722 $ 5,821 $ 6,391 $ 7,144 $ * Net Sales Growth 40.7% 27.6% 40.7% 30.5% 27.6% 14.3% 19.5% Net Income Growth 257.5% 23.5% 106.9% 67.9% 94.7% 20.0% 19.5% * Comp Store Sales 8.3% 0.6% 13.5% 8.6% 7.7% -1.6% 1.8% Fiscal 2007 Fiscal 2009 Fiscal 2010 Fiscal 2008 |
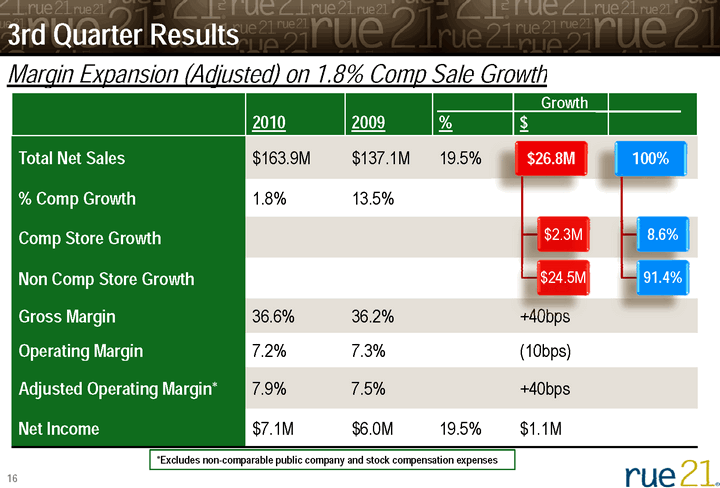
| 2010 2009 % $ Total Net Sales $163.9M $137.1M 19.5% % Comp Growth 1.8% 13.5% Comp Store Growth Non Comp Store Growth Gross Margin 36.6% 36.2% +40bps Operating Margin 7.2% 7.3% (10bps) Adjusted Operating Margin* 7.9% 7.5% +40bps Net Income $7.1M $6.0M 19.5% $1.1M 3rd Quarter Results 16 Margin Expansion (Adjusted) on 1.8% Comp Sale Growth welshma 10/20/2009 1:35:18 PM As a CFO, this is what I love to see - clean balance sheet --Low working capital needs --Pro forma - net cash balance --Plus we increased size of our asset backed revolver - $85mm with $15mm accordion Our operating and store model translates into a cash generating business that we re- invest into growth *Excludes non-comparable public company and stock compensation expenses Growth |

| Long-Term Margin Expansion Opportunity 17 |

| LONG-TERM TARGET SQUARE FOOTAGE CAGR MID TO HIGH TEENS COMPARABLE STORE SALES GROWTH LOW SINGLE DIGITS GROSS MARGIN 150 BPS IMPROVEMENT NET INCOME CAGR 20-25% Financial Targets 18 welshma 10/20/2009 1:35:18 PM As a CFO, this is what I love to see - clean balance sheet --Low working capital needs --Pro forma - net cash balance --Plus we increased size of our asset backed revolver - $85mm with $15mm accordion Our operating and store model translates into a cash generating business that we re- invest into growth |
