Attached files
 Quarterly
1
Source: SNL Financial.
Note: Quarterly PTPP ROAA ratios are annualized
PTPP is defined by SNL as: Net interest income, fees and other non-interest
income, net of non-credit-related expenses. Represents earnings
capacity that can be applied to capital or loan losses Annual
Strong Earnings Ability and Capacity
Net Income
PTPP ROAA
$10,476
$10,547
$10,708
$6,351
$581
2.28%
2.09%
1.94%
1.87%
1.99%
1.00%
1.50%
2.00%
2.50%
$0
$2,000
$4,000
$6,000
$8,000
$10,000
$12,000
2005
2006
2007
2008
2009
$(594)
$91
$312
$772
$696
$855
$2,042
1.79%
1.89%
2.06%
2.20%
1.87%
1.76%
1.72%
-0.5%
0.0%
0.5%
1.0%
1.5%
2.0%
2.5%
($600)
($100)
$400
$900
$1,400
$1,900
$2,400
Q1'09
Q2'09
Q3'09
Q4'09
Q1'10
Q2'10
Q3'10
Performance
2005
2006
2007
2008
2009
Net Income (Loss)
$10,476
$10,547
$10,708
$6,351
$581
PTPP Earnings
$16,328
$16,644
$16,905
$16,747
$19,468
PTPP ROAA
2.28%
2.09%
1.94%
1.87%
1.99%
Q1'09
Q2'09
Q3'09
Q4'09
Q1'10
Q2'10
Q3'10
($594)
$91
$312
$772
$696
$855
$2,042
$4,235
$4,581
$5,022
$5,630
$4,746
$4,428
$5,261
1.79%
1.89%
2.06%
2.20%
1.87%
1.76%
1.72%
Exhibit 99.2 |
 2
Non-Covered Loan Portfolio
Construction Portfolio
Financial data as of September 30, 2010 and does not include loans covered by
the FDIC under a loss sharing agreement from the Cowlitz Bank acquisition
or the loans purchased in the Pierce Commercial Bank acquisition. Diversified
Loan Portfolio CRE Owner
Occupied
22%
Occupied
29%
Commercial and
Industrial
31%
Residential
Construction
4%
Commercial
Construction
4%
Residential Real
Estate
7%
Consumer
3%
Commercial
16%
Commercial Land
12%
Condos
25%
Residential Land
6%
Single Family
Residential
21%
A&D Residential &
Lots
20%
Total Non-Covered Loans: $759 million
Total Construction Loans: $63 million
CRE Non-Owner |
 3
Commercial Loan Portfolio
Commercial Real Estate
Diversified Loan Portfolio
Financial data as of September 30, 2010 and does not include loans covered by
the FDIC under a loss sharing agreement from the Cowlitz Bank
acquisition or the loans purchased in the Pierce Commercial Bank acquisition.
CRE Owner
Occupied
26.2%
CRE Non-Owner
Occupied
35.9%
Commercial and
Industrial
37.9%
Ind./Warehouse
12.4%
Hotel/Motel
1.2%
Other
3.7%
Retail
28.1%
Office
35.3%
Multi
-
Family
9.3%
Agricultural
0.6%
Ret./Nurs./DayCare
2.0%
Church
2.0%
Recreational
1.9%
Tax-Exempt
Affordable Housing
3.5%
Total Commercial Loans: $621 million
Total Commercial Real Estate Loans: $386 million |
 0.00%
0.50%
1.00%
1.50%
2.00%
2.50%
3.00%
3.50%
4.00%
4.50%
2009Q1
2009Q2
2009Q3
2009Q4
2010Q1
2010Q2
2010Q3
0.00%
20.00%
40.00%
60.00%
80.00%
100.00%
120.00%
2009Q1
2009Q2
2009Q3
2009Q4
2010Q1
2010Q2
2010Q3
NPAs
/ Assets*
NCOs / Avg. Loans
Reserves / NPLs*
Texas Ratio
(1)
Source: SNL Financial
(1)
Texas
Ratio
=
nonperforming
assets
+
loans
90
or
more
days
past
due
/
tangible
common
equity
+
loan
loss
reserve
Please reference page 27 for a list of the companies used for the peer
group. * HFWA ratios do not include FDIC covered loans
Superior Credit Quality Relative to Peers
4
HFWA
Regional Peers
NPA level less than 1/2 of peer level
Reserve coverage over twice that of peer levels
Texas Ratio less than 1/3 of peer level
0.00%
25.00%
50.00%
75.00%
100.00%
125.00%
150.00%
175.00%
200.00%
2009Q1
2009Q2
2009Q3
2009Q4
2010Q1
2010Q2
2010Q3
0.00%
1.00%
2.00%
3.00%
4.00%
5.00%
6.00%
7.00%
8.00%
2009Q1
2009Q2
2009Q3
2009Q4
2010Q1
2010Q2
2010Q3 |
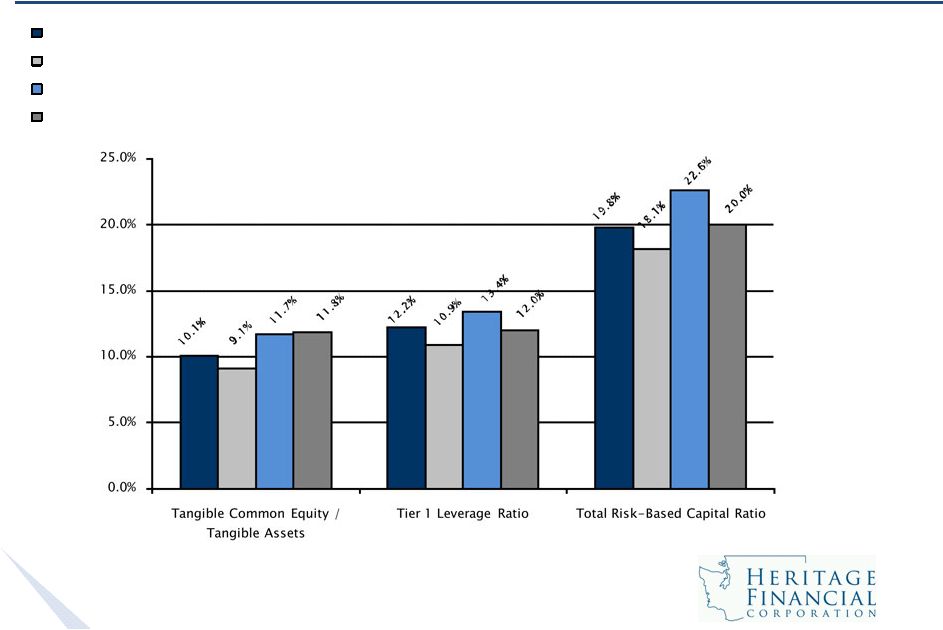 5
Strong Capital Ratios
Note: Ratios inclusive of a capital raise assuming gross proceeds of $45
million HFWA 9/30/10 as reported on 10-Q
Proforma HFWA 9/30/10 including Pierce Commercial Bank Acquisition
Proforma HFWA 9/30/10 including Pierce Commercial Bank Acquisition and Capital
Raise Proforma HFWA 9/30/10 including Pierce Commercial Bank Acquisition
and Capital Raise without TARP |