Attached files
| file | filename |
|---|---|
| 8-K - 8-K - Walter Energy, Inc. | a10-22438_18k.htm |
| EX-2.1 - EX-2.1 - Walter Energy, Inc. | a10-22438_1ex2d1.htm |
| EX-99.2 - EX-99.2 - Walter Energy, Inc. | a10-22438_1ex99d2.htm |
| EX-10.1 - EX-10.1 - Walter Energy, Inc. | a10-22438_1ex10d1.htm |
Exhibit 99.1
|
|
Creating The Leading Global, Publicly Traded, “Pure-Play” Metallurgical Coal Producer December 3, 2010 |
|
|
Safe Harbor Statements Except for historical information contained herein, the statements in this document are forward-looking and made pursuant to the safe harbor provisions of the Private Securities Litigation Reform Act of 1995 and may involve a number of risks and uncertainties. Forward-looking statements are based on information available to management at the time, and they involve judgments and estimates. There can be no assurance that the transaction with Western Coal will close. The transaction is subject to a number of closing conditions which may be outside of Walter Energy's control. Forward-looking statements include expressions such as "believe," "anticipate," "expect," "estimate," "intend," "may," “plan,” “predict,” "will," and similar terms and expressions. These forward-looking statements are made based on expectations and beliefs concerning future events affecting us and are subject to various risks, uncertainties and factors relating to our operations and business environment, all of which are difficult to predict and many of which are beyond our control, that could cause our actual results to differ materially from those matters expressed in or implied by these forward-looking statements. The following factors are among those that may cause actual results to differ materially from our forward-looking statements: the market demand for coal, coke and natural gas as well as changes in pricing and costs; the availability of raw material, labor, equipment and transportation; changes in weather and geologic conditions; changes in extraction costs, pricing and assumptions and projections concerning reserves in our mining operations; changes in customer orders; pricing actions by our competitors, customers, suppliers and contractors; changes in governmental policies and laws, including with respect to safety enhancements and environmental initiatives; availability and costs of credit, surety bonds and letters of credit; and changes in general economic conditions. Forward- looking statements made by us in this document, or elsewhere, speak only as of the date on which the statements were made. See also the “Risk Factors” in our 2009 Annual Report on Form 10-K and subsequent filings with the SEC which are currently available on our website at www.walterenergy.com. New risks and uncertainties arise from time to time, and it is impossible for us to predict these events or how they may affect us or our anticipated results. We have no duty to, and do not intend to, update or revise the forward-looking statements in this document, except as may be required by law. In light of these risks and uncertainties, readers should keep in mind that any forward-looking statement made in this press document may not occur. All data presented herein is as of the date of this document unless otherwise noted. This release may contain forward-looking statements that may involve risks and uncertainties. Such statements relate to the Company’s expectations, intentions, plans and beliefs including, in particular, statements relating to a potential strategic business combination between the Company and Walter and the terms of any such transaction. These statements are not guarantees of future performance and involve risks, uncertainties and assumptions that are difficult to predict. Actual outcomes and results may differ materially from what is expressed or forecasted in these forward-looking statements as a result of various important factors, including, but not limited to: the Company’s ability to negotiate a potential strategic business combination with Walter; the price, terms and conditions of any such transaction; the benefits of any such transaction and its impact on the Company’s business;, changes in commodity prices; strengths of various economies; the effects of competition and pricing pressures; the oversupply of, or lack of demand for, the Company’s products; currency and interest rate fluctuations; various events which could disrupt the Company’s construction schedule or operations; the Company’s ability to obtain additional funding on favourable terms, if at all; and the Company’s ability to anticipate and manage the foregoing factors and risks. Additionally, statements related to the quantity or magnitude of coal deposits are deemed to be forward looking statements. The reliability of such information is affected by, among other things, uncertainties involving geology of coal deposits; uncertainties of estimates of their size or composition; uncertainties of projections related to costs of production; the possibilities in delays in mining activities; changes in plans with respect to exploration, development projects or capital expenditures; and various other risks including those related to health, safety and environmental matters. Readers are referred to the documents filed by the Company on SEDAR. 1 |
|
|
Joe Leonard Interim Chief Executive Officer Walter Energy, Inc. 2 |
|
|
Combination Rationale Industry Leader Creates the leading global, publicly traded, “pure-play” met coal producer Targeting in excess of 20 million tons of production by 2012 Increased Diversification Adds significant geographic, end-market and operational diversification for both companies Unparalleled Seaborne Market Access Unique ability to deliver to Pacific and Atlantic markets Advantaged transportation enhances market reach and customer service Strong Growth 96% volume increase in total coal production from 2009 - 2012 Production profile balanced between existing production assets and high growth assets Attractive Met Coal Industry Dynamics Met coal demand underpinned by projected growth in world steel production by 50% over the next 10 years Financially Compelling Strong free cash flow and industry leading margins EPS accretive in first year following close of transaction Rapid deleveraging creates additional growth opportunities Stewardship Both companies have a culture of commitment to health, safety and the environment 3 |
|
|
Transaction Structure Terms CAD$11.50 per share for all outstanding shares of WTN or 0.114 shares of WLT WTN shareholders can elect to receive all cash or all stock, or a combination thereof, subject to pro-ration Enterprise value of CAD$3.3 billion (USD$3.3 billion), net of cash on the balance sheet Pro Forma Ownership 86% WLT 14% WTN Capital Markets Benefits EPS accretive to all shareholders during the first full year following close Liquid stock with global investor base Continued participation for WTN shareholders in growth and value creation LTM Financials WLT Revenue of $1,423 bn + WTN Revenue of $679 mn = $2.1 billion WLT EBITDA* of $577 mn + WTN EBITDA of $191 m = $768 million Listing Primary: NYSE Secondary: will apply for listing on TSX Shareholder & Regulatory Approvals Must receive approval of at least two-thirds of the votes cast by WTN shareholders and a simple majority of the votes cast by WTN shareholders other than WLT and other interested shareholders Customary regulatory approvals include Hart-Scott Rodino in the U.S. and Investment Canada Act in Canada and Competition Act in Canada Closing Expected to close by second quarter 2011 4 *Source: Company information *EBITDA is a non-GAAP measure. GAAP reconciliation can be found in the appendix. |
|
|
Walter and Western: An Ideal Partnership 5 Leading producer of met coal with mines in British Columbia, West Virginia and the United Kingdom Range of high quality hard coking coal, low-vol PCI, and anthracite Competitive delivered cost structure Proximity to customers in Asia, with a focus on Japan, Korea and China Underutilized transportation infrastructure Positioned for growth Supplies premium met coal to growing global steel industry from mines in Alabama Coking coal among the highest quality globally; consistently achieves prices at or above the benchmark Low cost producer Focused on long-term customer relationships in South America and Europe Transportation cost advantages Positioned for growth |

|
|
13 Mines in 3 Countries 6 Wales : 1 mine 7.6 million tons* Western Canada: 3 mines Reserves: 156 million tons* West Virginia: 2 mines Reserves: 45 million tons* Alabama: 7 mines Reserves: 168 million tons* *Reserves as of [March 31, 2010]. Reserves for WTN in Western Canada, West Virginia and Wales are run-of-mine. Reserves for WLT’s mines in Alabama is recoverable. Please see page 17 of WTN’s 2010 annual report for the appropriate disclosures. |
|
|
Increased Scale Creates A Global Leader 7 - 5th largest met coal producer in the world - Leading global, publicly traded, “pure-play” metallurgical coal producer FY2011E Metallurgical Coal Production (Million Short Tons) Note: (1) Western data based on fiscal year ending March 31st, 2012 Source: Equity Research Reports; WLT and WTN company presentations (1) 44.1 26.0 18.7 18.7 16.6 12.2 11.0 11.0 8.8 8.0 7.9 5.0 0 5 10 15 20 25 30 35 40 45 50 BHP Teck Xstrata Anglo Combined Alpha Rio Tinto Massey Walter Patriot Western Macarthur |
|
|
8 Keith Calder President & Chief Executive Officer Western Coal Corp. |
|
|
Asset & Geographic Diversification 9 Last Two Quarters Product Mix Last Two Quarters Geographic Sales Mix Reserves (1) Last Two Quarters Geographic Production Mix 2013E Production Profile Walter Energy Western Coal Alabama 100% North America 21% South America 25% Europe 54% Thermal 16% HCC 84% Alabama 100% Expansion 23% Producing 77% W. VA 21% UK 4% Canada 75% Europe 14% USA 30% Asia 56% Thermal 17% Anthracite 2% HCC 51% Low-Vol PCI 30% W. VA 30% UK 2% Canada 68% Expansion 50% Producing 50% Note: (1) Based on Walter reserves of 175MM tons, and Western reserves of 141.8MM tonnes in Canada, 41.0MM tonnes in West Virginia, and of 6.9MM tonnes in the U.K. |
|
|
Asset & Geographic Diversification 10 Last Two Quarters Product Mix Last Two Quarters Geographic Sales Mix Reserves (1) Last Two Quarters Geographic Production Mix 2012E Production Profile Note: (1) Based on Walter reserves of 175MM tons, and Western reserves of 141.8MM tonnes in Canada, 41.0MM tonnes in West Virginia, and of 6.9MM tonnes in the U.K. Note: Walter production based on fiscal year ending December 31st, Western production based on fiscal year ending March 31st Combined W. VA 12% UK 2% Alabama 45% Canada 41% South America 16% Asia 21% North America 24% Europe 39% Low-Vol PCI 11% Thermal 17% HCC 71% Canada 27% UK 1% USA 72% Expansion 35% Producing 65% |
|
|
Attractive Industry Dynamics 11 Global situation Our advantage World steel production to grow by 50% over 10 years* Ramping up met coal production to meet customer needs China and Brazil have among the highest projected growth rates for steel Our mines are ideally located to meet the needs of these customers New supply of met coal is scarce in politically stable countries Our production is in the most stable countries (Canada, US & UK) Congestion at most of the world’s coal ports is creating a supply bottleneck The ports that currently serve our fastest growing mines are underutilized and has capacity for expansion *Macquarie Research |
|
|
Unconstrained Access to High Growth Global Markets 12 Significant scale and strength across key regions and a leading presence in multiple distribution channels |
|
|
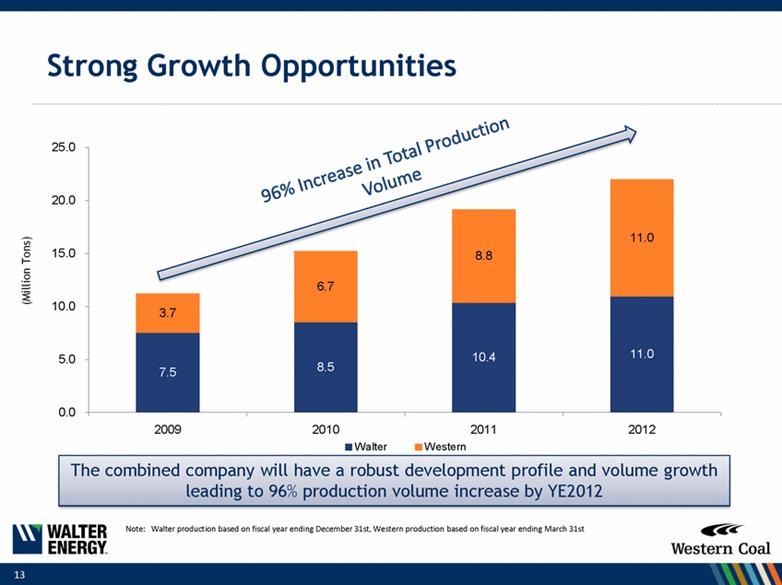
Strong Growth Opportunities The combined company will have a robust development profile and volume growth leading to 96% production volume increase by YE2012 96% Increase in Total Production Volume 13 (Million Tons) Note: Walter production based on fiscal year ending December 31st, Western production based on fiscal year ending March 31st 7.5 8.5 10.4 11.0 3.7 6.7 8.8 11.0 0.0 5.0 10.0 15.0 20.0 25.0 2009 2010 2011 2012 Walter Western |
|
|
Joe Leonard Interim Chief Executive Officer Walter Energy, Inc. 14 |

|
|
Leading Financial Profile Among U.S. Peers Robust EBITDA and cash flow Industry leading EBITDA margins Expected to be EPS accretive within the first year following close Rapid deleveraging and additional growth opportunities Committed $2.7bn credit facility, 2.4 billion debt *Source: Company information ($ Millions) 15 *EBITDA is a non-GAAP measure. GAAP reconciliation can be found in the appendix. *EBITDA Margin is calculated as a EBITDA/Total Revenue |
|
|
Financing Overview Walter has arranged for a $2,725 million committed credit facility with a syndicate of banks 16 Tranche Tranche Amount Drawn Amount Maturity Revolver $375 $0 5 Years Term Loan A $600 $600 5 Years Term Loan B $1,750 $1,750 7 Years The facility will become effective at the time of closing of the merger with Western Walter will use cash-on-hand to support additional cash requirements from the transaction |
|
|
Right Transaction at the Right Time 17 |
|
|
APPENDIX 18 |
|
|
Walter Energy GAAP to Non-GAAP Reconciliation 19 Income from continuing operations $ 329.1 Plus: net interest expense 17.3 Plus: income tax expense 139.8 Plus: depreciation and amortization 90.8 Earnings before Interest, Taxes, Depreciation & Amortization $577.0 USD in Millions Data TTM as of 9-30-10 The Company reports all financial information required in accordance with U.S. generally accepted accounting principles (GAAP). The Company believes, however, that evaluating its ongoing operating results will be enhanced if it also discloses certain non-GAAP information. This non-GAAP financial measure exclude non-cash and certain other special charges that many investors believe may obscure the user’s overall understanding of the Company’s current financial performance and the Company’s prospects for the future. The Company believes that this non-GAAP measure provide useful information to investors because it improves the comparability of the financial results between periods and provide for greater transparency of key measures used to evaluate the Company’s performance. The Company provides EBITDA (defined as income from continuing operations plus net interest expense, income tax expense, and depreciation & amortization), which is a non-GAAP measure that the Company believes provides useful information to both management and investors by excluding certain expenses, which management believes are not indicative of the Company’s core operations. This non-GAAP measure is used by the Company to evaluate its business strategies and management’s performance. Non-GAAP financial measures, when presented, are reconciled to the most closely applicable GAAP measure. Non-GAAP measures are provided as additional information and should not be considered in isolation or as a substitute for results prepared in accordance with GAAP. |
|
|
Creating The Leading Global, Publicly Traded, “Pure-Play” Metallurgical Coal Producer December 3, 2010 |