Attached files
| file | filename |
|---|---|
| 8-K - FORM 8-K - PROVIDENT FINANCIAL SERVICES INC | d8k.htm |
 Sandler O’Neill & Partners
East Coast Financial Services Conference
November 11, 2010
Exhibit 99.1 |
 Forward Looking Statements
2
Certain statements contained herein are "forward-looking statements" within the meaning of
Section 27A of the Securities Act of 1933 and Section 21E of the Securities Exchange Act of
1934. Such forward-looking statements may be identified by reference to a future period or
periods, or by the use of forward-looking terminology, such as "may," "will,"
"believe," "expect," "estimate," "anticipate," "continue,"
or similar terms or variations on those terms, or the negative of those terms.
Forward-looking statements are subject to numerous risks and uncertainties, including, but
not limited to, those related to the economic environment, particularly in the market areas in
which Provident Financial Services, Inc. (the “Company”) operates, competitive products
and pricing, fiscal and monetary policies of the U.S. Government, changes in government
regulations affecting financial institutions, including regulatory fees and capital requirements,
changes in prevailing interest rates, acquisitions and the integration of acquired businesses,
credit risk management, asset-liability management, the financial and securities markets and
the availability of and costs associated with sources of liquidity. The Company cautions readers not to place undue reliance on any such forward-looking
statements which speak only as of the date made. The Company also advises readers that the
factors listed above could affect the Company's financial performance and could cause the
Company's actual results for future periods to differ materially from any opinions or statements
expressed with respect to future periods in any current statements. The Company does not
undertake and specifically declines any obligation to publicly release the result of any revisions
which may be made to any forward-looking statements to reflect events or circumstances after
the date of such statements or to reflect the occurrence of anticipated or unanticipated
events. |
 3
Christopher Martin
Christopher Martin
Chairman, President &
Chief Executive Officer |
 NYSE
Symbol - PFS
$6.8 billion in assets
Headquartered in Jersey City, NJ
Holding company for The Provident Bank
Oldest NJ bank chartered in 1839
Converted from mutual form in 2003
81 branch locations throughout northern and central NJ
3 Loan Production Offices in NJ
Moving / Consolidating administrative operations to Metro Park (Iselin)
in March 2011 from 3 locations to 1
No TARP, No TRUPS, No dilution with a secondary offering
CORPORATE PROFILE
4 |
 Senior management team has, on average, over 25 years of
banking experience with large commercial banks & thrifts in
our primary markets
Extremely knowledgeable and results-oriented
Culture of accountability, efficiency and integrity
Majority of officers have been with publicly-traded
organizations
360°
leadership development program to assure management
succession
Executive Leadership Team
5 |
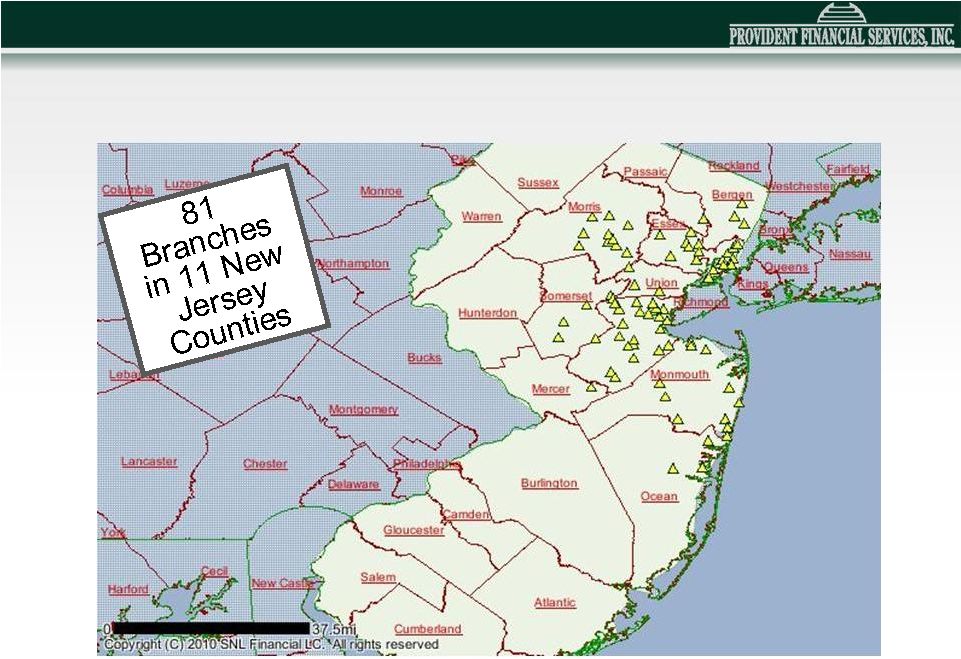 Current Retail Franchise
6 |
   Market
Demographics (as of 6/30/10) Source: FDIC-Summary of
Deposit & SNL County
Market
Rank
Number
of
Branches
Company
Deposits
in Market
($000)
Deposit
Market
Share
(%)
Total
Population
2010
(Actual)
Median
HH
Income
2010
($)
Middlesex
5
24
1,596,006
7.46
794,605
78,561
Hudson
4
15
915,698
3.81
607,650
52,525
Morris
10
10
712,897
3.80
496,157
104,165
Essex
13
7
479,095
2.28
783,531
55,914
Monmouth
9
10
459,179
2.63
649,429
82,974
Bergen
26
3
223,296
0.58
910,386
84,344
Somerset
9
4
178,191
2.11
333,075
101,044
Ocean
13
4
163,070
1.27
578,728
60,936
Union
20
3
139,796
0.80
531,112
73,602
Mercer
20
1
53,031
0.47
371,697
75,009
Passaic
25
1
7,990
0.08
500,140
62,332
NJ Totals
82
4,928,249
6,556,510
7 |
 Challenge: Increase revenue in difficult environment
Community Bank with commercial emphasis
SBA Initiative
Reduce marginally accretive asset classes
Expand non-interest income with concentration on Wealth
Management
Aggressively manage credit quality
Branch rationalization
Healthcare Lending Group established in 2010
Acquisitions where accretive & improve franchise value
Seeking Out Strategic Growth & Opportunities
8 |
 Market
Capitalization: $740.6 million 59,922,431 Shares Outstanding
5,879 Registered Stockholders
15.90% Insider Ownership (includes 7.76% held by ESOP)
61.34% Institutional Ownership
3.56% Current Dividend Yield
130.8% Price/TBV
80.4% Price/BV
14.0x
P/E
(as
of
10/26/10)
12.1x
Price/2011
Est.
Earnings
(as
of
10/26/10)
Market Data as 9/30/10
9 |
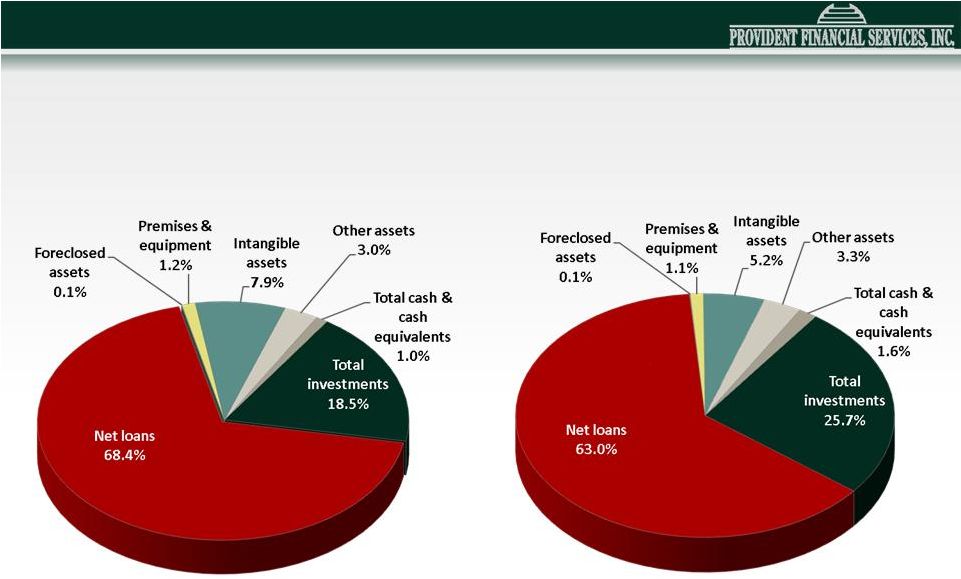 Asset
Composition 9/30/10
9/30/10
12/31/08
12/31/08
10 |
 Loan
Originations 11 |
 Loan
Portfolio Net total of $6.8MM representing premiums, discounts & deferred
fees, has not been included in the outstanding loan totals Total Loans =
$4,337 MM Total Loans = $4,337 MM
12
(as of 9/30/10)
(in thousands) |
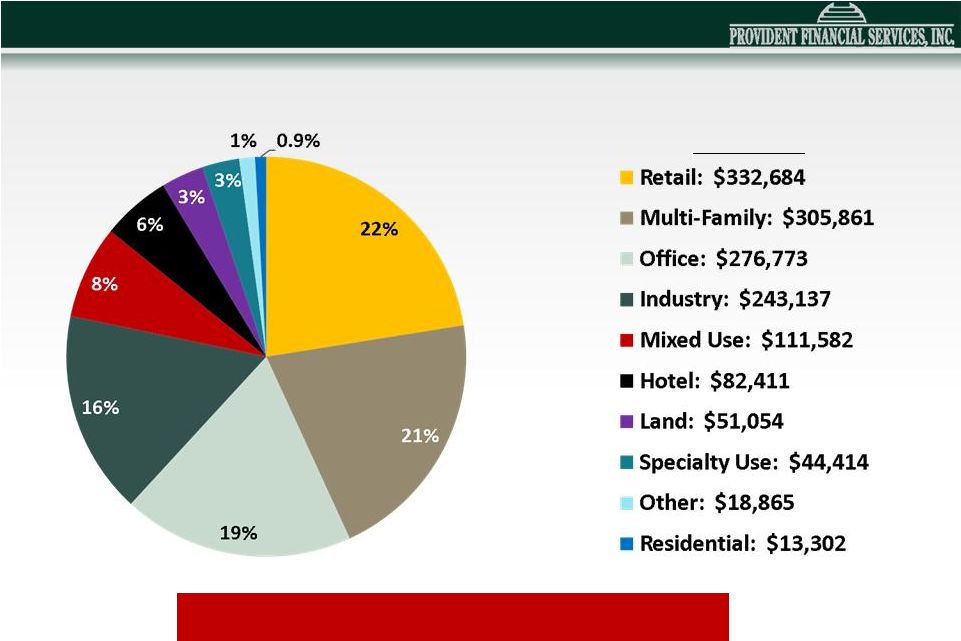 CRE
Portfolio by Industry Total CRE Loans = $1,480 MM
Total CRE Loans = $1,480 MM
13
(as of 9/30/10)
(in thousands) |
 Construction Loan Portfolio
Total Construction Loans = $134 MM
Total Construction Loans = $134 MM
Construction loan balance does not reflect unfunded commitments of $75MM. No
loans are located outside of NJ/NY/PA
14
(as of 9/30/10)
(in thousands) |
  Portfolio Performance
(in thousands)
CRE/CONST
C & I
CONSUMER
1-4
FAMILY
TOTAL
LOAN PORTFOLIO BALANCE
1,614,071
$
741,367
$
568,533
$
1,413,877
$
4,337,848
$
NON-PERFORMING LOANS
29,575
$
28,515
$
7,123
$
38,297
$
103,510
$
% OF PORTFOLIO
1.83%
3.85%
1.25%
2.71%
2.39%
% OF TOTAL LOANS
0.68%
0.66%
0.16%
0.88%
2.39%
NET CHARGE-OFFS
7,134
$
6,824
$
3,131
$
1,491
$
18,580
$
ANNUALIZED NET CHARGE-
OFFS AS % OF AVG. O/S
0.61%
1.24%
0.73%
0.14%
0.57%
15
(as of 9/30/10)
Net total of $6.8MM representing premiums, discounts & deferred fees, has not
been included in the outstanding loan totals |
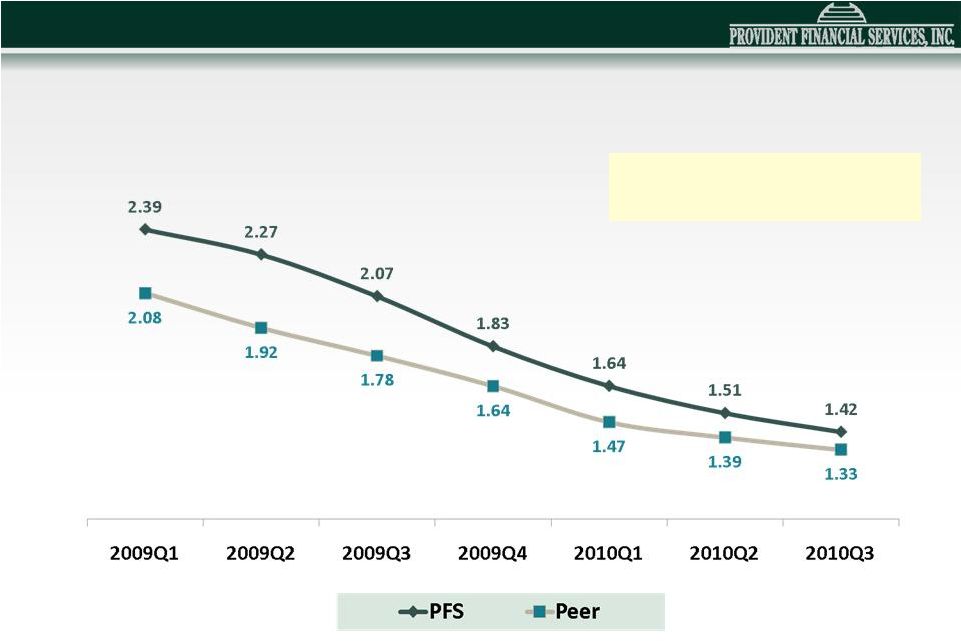
 Asset
Quality PFS
PEER*
Non-performing Loans/Loans (%)
2.39
2.41
Loan Loss Reserves/ Loans (%)
1.58
1.67
Loan Loss Reserves/ Non-performing Loans (%)
66.4
89.0
Net Charge-offs / Avg Loans (%)
0.57
1.22
Non-Performing Assets / Assets (%)
1.61
1.87
Source: SNL
16
(as of 9/30/10)
*Peer Group : BNCL, CBU, FNB, FCF, FFIC, INDB, ISBC, NPBC, NBTB, NAL, NWBI,
STBA, SASR, SUSQ, UBSI, VLY, WSBC, WSFS |
 NPAs
& 90+ day Delinquencies / Loans & REO (%)
17
*Peer Group : BNCL, CBU, FNB, FCF, FFIC, INDB, ISBC, NPBC, NBTB, NAL, NWBI,
STBA, SASR, SUSQ, UBSI, VLY, WSBC, WSFS Source: SNL
|
    Aaa
Aa1
Baa2
Baa3
B1
B3
Caa1
55%
9%
4%
6%
3%
4%
19%
Aa1
Aa2
Aa3
A1
A2
A3
Baa1
B1
5%
22%
3%
19%
41%
4%
3%
3%
Aaa
Aa1
Aa2
Aa3
A1
A2
Baa1
NR
5%
9%
47%
23%
10%
2%
2%
2%
Municipal
Corporate Notes
Private Label CMO
18
Note: 80% are Available for Sale.
(as of 9/30/10)
Investment Securities
(in thousands) |
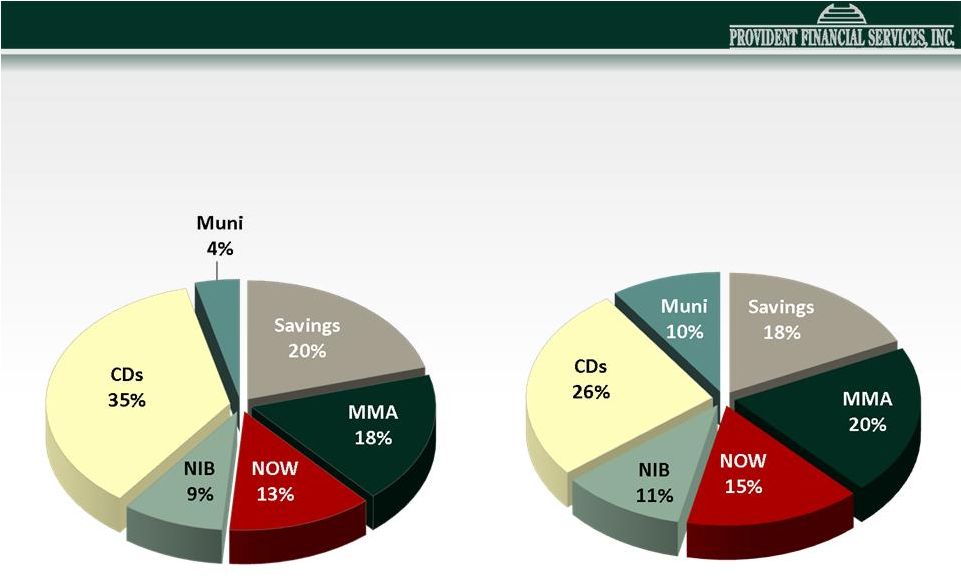 Deposit Composition
At 9/30/10
At 9/30/10
At 12/31/08
At 12/31/08
Total Cost of Deposits: 1.91%
Total Cost of Deposits: 1.91%
Total Cost of Deposits: 1.15%
Total Cost of Deposits: 1.15%
19 |
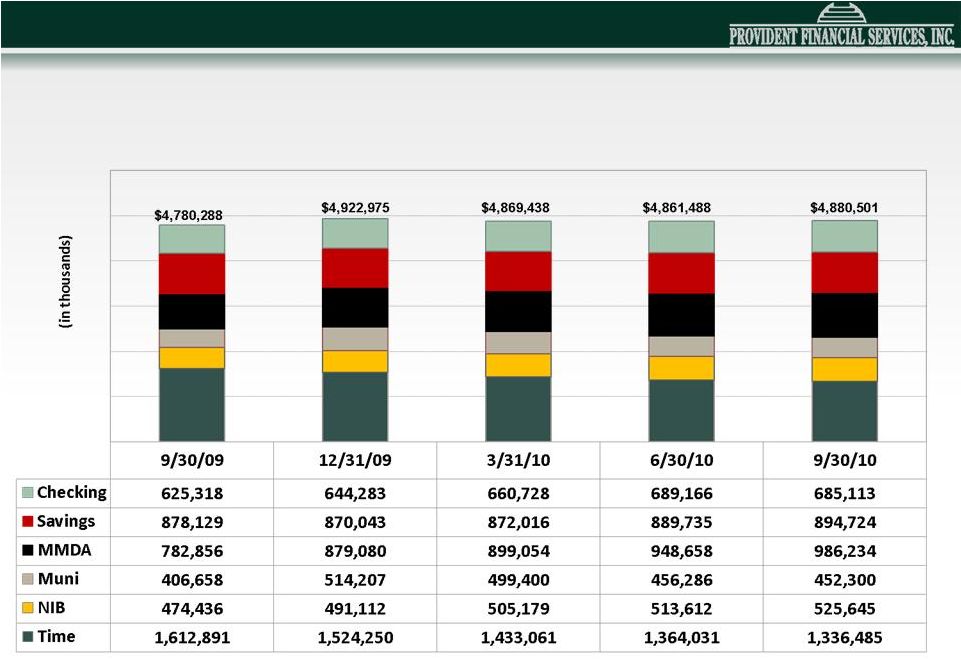 Average Deposits
20 |
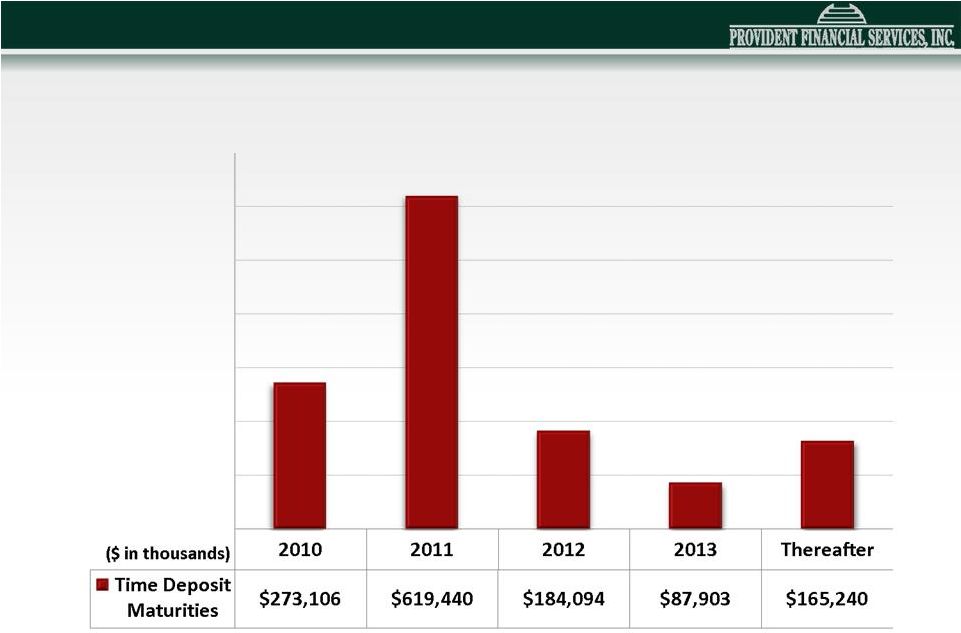 Time
Deposit Maturities 1.00%*
1.17%*
2.13%*
3.58%*
2.96%*
*Weighted Average Cost
21
(as of 9/30/10) |
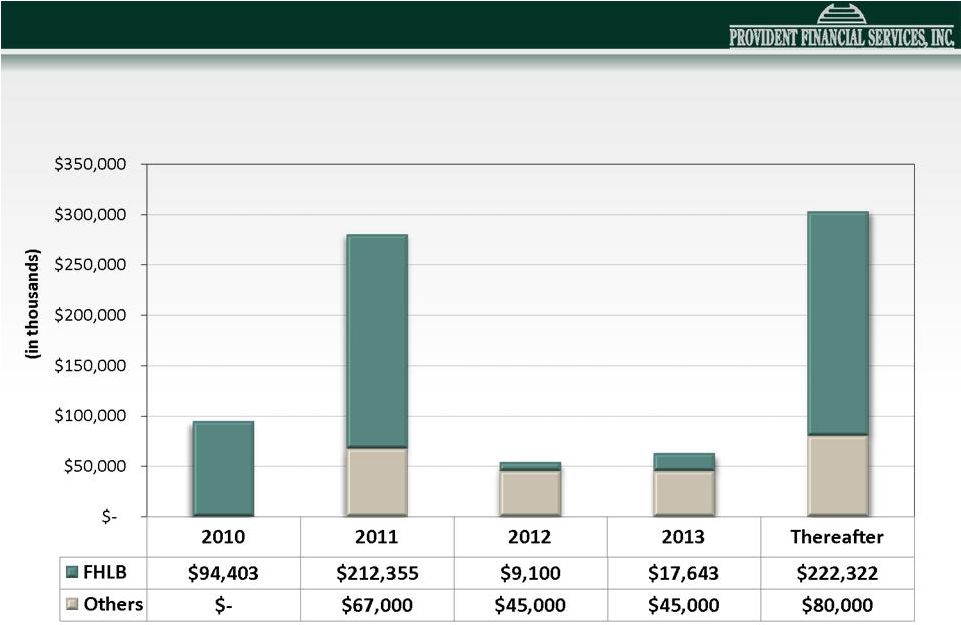 Borrowings
4.26%*
3.81%*
3.76%*
2.99%*
3.00%*
*Weighted Average Cost
22
(as of 9/30/10) |
 Thomas M. Lyons
Senior Vice President &
Chief Financial Officer
23 |
 Financial
Highlights 24
(Dollars in thousands)
BALANCE SHEET:
9/30/10
12/31/09
Total assets
$6,782,295
$6,836,172
Total loans
4,344,657
4,384,194
Total deposits
4,904,556
4,899,177
Total investments
1,744,815
1,702,513
Total borrowed funds
903,610
999,233
Total stockholders' equity
921,048
884,555 |
 Financial Highlights
(Dollars in thousands except
Earnings per Share)
INCOME STATEMENT:
9/30/10
9/30/09*
Operating Income *
$37,590
$23,904
Operating Diluted Earnings per Share
$0.66
$0.43
Operating ROAE
5.55%
3.46%
Operating ROAA
0.74%
0.48%
Net Interest Margin
3.45%
3.02%
Operating Efficiency Ratio
57.18%
68.50%
Nine Months Ended
*Excludes impact of goodwill impairment charge in 2009
25 |
 Return on Average Assets
Source: SNL
26
*Peer Group : BNCL, CBU, FNB, FCF, FFIC, INDB, ISBC, NPBC, NBTB, NAL, NWBI,
STBA, SASR, SUSQ, UBSI, VLY, WSBC, WSFS |
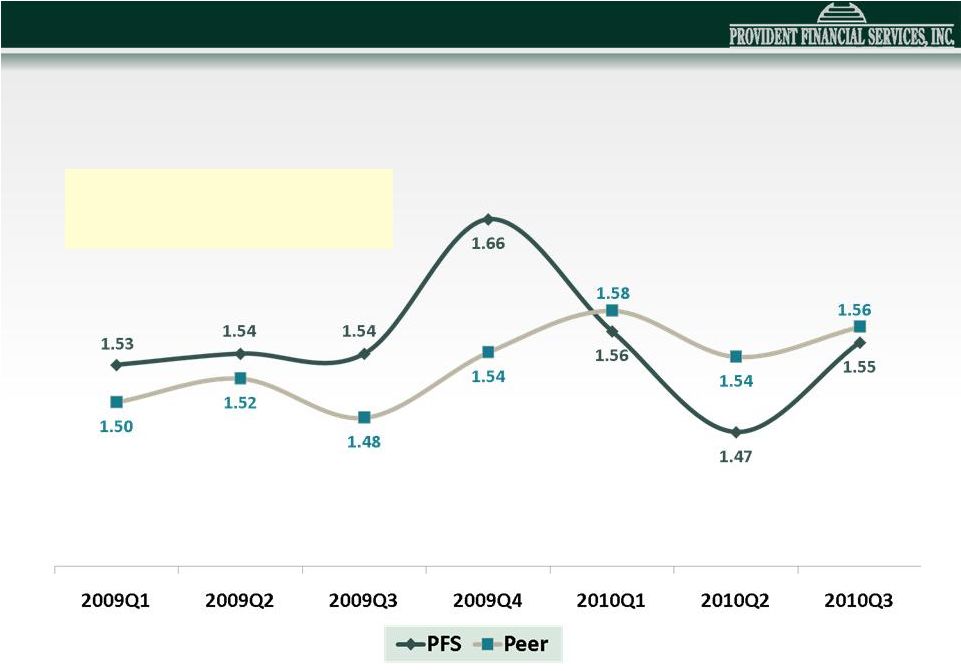
 Net
Interest Rate Margin 27
Source: SNL
*Peer Group : BNCL, CBU, FNB, FCF, FFIC, INDB, ISBC, NPBC, NBTB, NAL, NWBI,
STBA, SASR, SUSQ, UBSI, VLY, WSBC, WSFS |
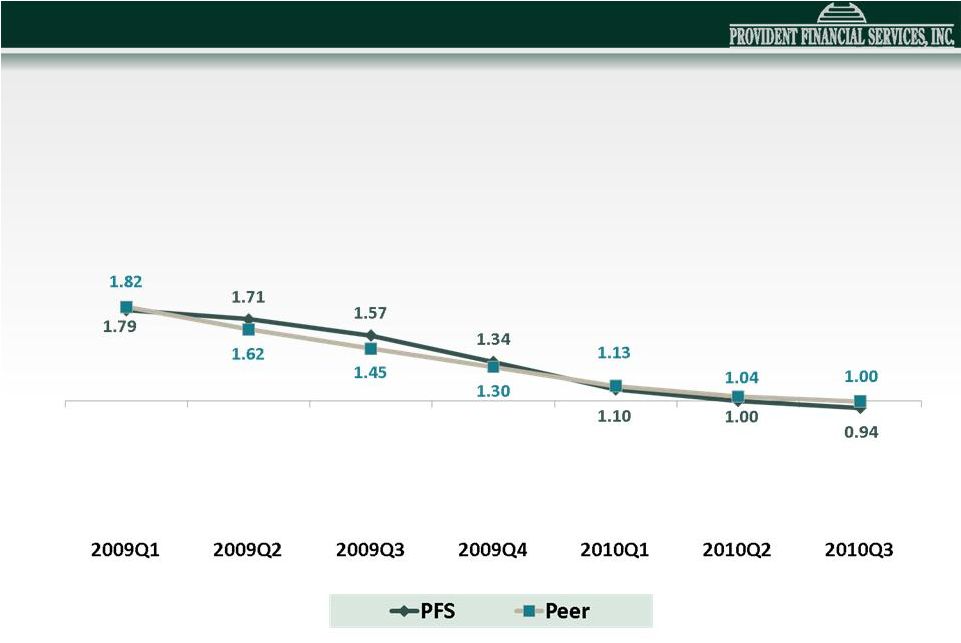 Interest Cost: Total Deposits
Source: SNL
28
*Peer Group : BNCL, CBU, FNB, FCF, FFIC, INDB, ISBC, NPBC, NBTB, NAL, NWBI,
STBA, SASR, SUSQ, UBSI, VLY, WSBC, WSFS |
 Cost
of Funds Source: SNL
29
*Peer Group : BNCL, CBU, FNB, FCF, FFIC, INDB, ISBC, NPBC, NBTB, NAL, NWBI,
STBA, SASR, SUSQ, UBSI, VLY, WSBC, WSFS [Total Interest Expense
/ (Average Interest Bearing Liabilities + Average Noninterest
Bearing Deposits)]. |
 Pre-Provision Net Interest Income
30 |
 (Total
noninterest
expense
-
(foreclosed
property
expense + amortization of intangibles expense +
total noninterest income)) as a percentage of average
assets. (Annualized)
Net Operating Exp / Avg
Assets (%)
Source: SNL
31
*Peer Group : BNCL, CBU, FNB, FCF, FFIC, INDB, ISBC, NPBC, NBTB, NAL, NWBI,
STBA, SASR, SUSQ, UBSI, VLY, WSBC, WSFS |
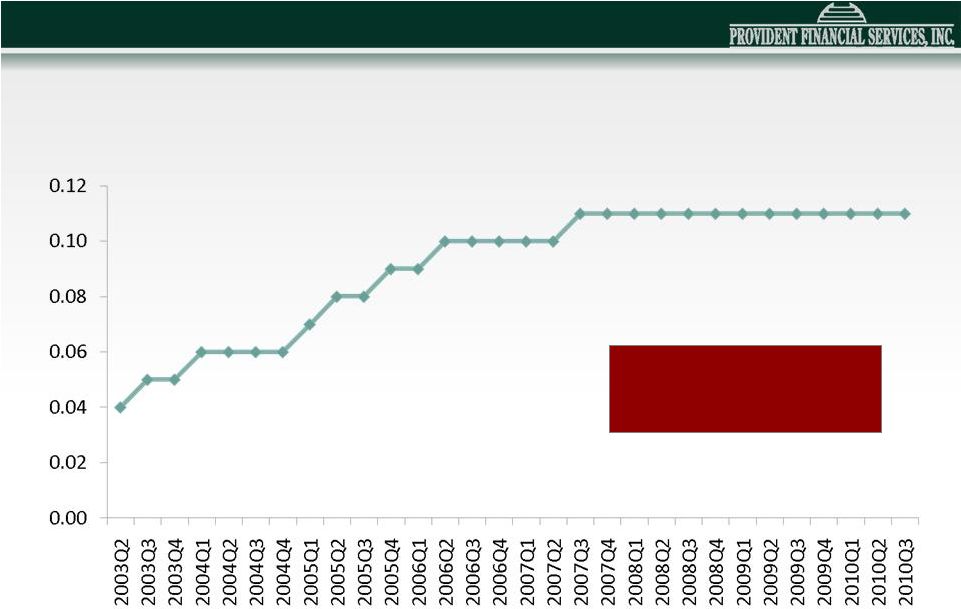 Quarterly Cash Dividend since IPO
Current Dividend
Yield = 3.56%
32 |
 Capital
The Company continues to exceed all current regulatory
The Company continues to exceed all current regulatory
requirements and is “well capitalized.”
requirements and is “well capitalized.”
33
(as of 9/30/10)
Amount
Ratio
Amount
Ratio
Regulatory Tier 1 leverage capital
256,613
$
4.00%
545,017
$
8.50%
Tier 1 risk-based capital
168,832
$
4.00%
545,017
$
12.91%
Total risk-based capital
337,664
$
8.00%
597,975
$
14.17%
REQUIRED
ACTUAL
(Dollars in thousands) |
 Looking Forward
Clear Strategy and Effective Execution
Expand relationships while regional and national banks remain dislocated
Cultivate and reward existing relationships to defend from competition
Implement process improvements to achieve efficiency target and achieve Line of
Business profitability targets
Continue to enhance branch franchise
Adapt to new regulations from Dodd-Frank and SEC
Improve net interest income while managing risk
Maintain appropriate capital levels while assessing opportunities
Provide tax-efficient return to stockholders
34 |