Attached files
| file | filename |
|---|---|
| 8-K - OVERSEAS SHIPHOLDING GROUP INC | osg3q20108k.htm |
| EX-99 - OVERSEAS SHIPHOLDING GROUP INC | osg3q20108kex991.htm |
Third Quarter Fiscal 2010
Conference Call
Conference Call
November 2, 2010

page 2
This presentation contains forward-looking statements regarding the Company's prospects, including the outlook
for tanker and articulated tug barge markets, changing oil trading patterns, anticipated levels and timing of
newbuilding and scrapping, prospects for certain strategic alliances and investments, forecasted newbuilding
delivery schedule for 2010 through 2013, projected scheduled drydock and off hire days for the fourth quarter of
2010, projected locked-in charter revenue and locked-in time charter days for 2010 through 2014 and thereafter,
forecasted 2010 vessel expenses, charter hire expenses, depreciation and amortization, general and
administrative expenses, interest expense, and levels of equity income and capital expenditures, projected 2011
vessel operating expenses and general and administrative expenses, ability to meet refinancing obligations in
2011 and 2012, the sustainability of OSG’s annual dividend, prospects of OSG’s strategy of being a market
leader in the segments in which it competes and the forecast of world economic activity and oil demand. These
statements are based on certain assumptions made by OSG management based on its experience and
perception of historical trends, current conditions, expected future developments and other factors it believes are
appropriate in the circumstances. Forward-looking statements are subject to a number of risks, uncertainties and
assumptions, many of which are beyond the control of OSG, which may cause actual results to differ materially
from those implied or expressed by the forward-looking statements. Factors, risks and uncertainties that could
cause actual results to differ from the expectations reflected in these forward-looking statements are described in
the Company’s Annual Report for 2009 on Form 10-K and those risks discussed in the other reports OSG files
with the Securities and Exchange Commission.
Forward-Looking Statements

page 3
< Third quarter fiscal 2010 results
• TCE revenues were $209M up from $207M
• Reported net loss of $31.8M or $1.06 per diluted share
• Adjusted net loss was $26.8M; adjusted loss per share $0.89
< Converging events in third quarter led to tough market conditions
• Vessel supply increased due to release of floating storage and deliveries
• Ton-mile demand declined relative to 2Q 2010 due to China sourcing more
crude from the Middle East vs. West Africa
crude from the Middle East vs. West Africa
< TCE revenues impacted by mix of spot vs. synthetic and time charters
and expiring fixed rate business compared to 2009
and expiring fixed rate business compared to 2009
• While VLCC spot rates were up 40%, the mix drove a decline in TCE
quarter-over-quarter
quarter-over-quarter
• In the Products MR class, fixed days decreased and spot days increased
quarter-over-quarter
quarter-over-quarter
Financial Highlights
page 4
Quarterly Highlights
< Continued execution on our newbuild and fleet expansion
program
program
• Crude
- FSO Africa commenced 3-year service contract in August
- FSO joint venture expected to be profitable 4Q 2010 and beyond
- Restructuring of joint venture debt expected to return ~$60M in cash to
OSG Q4 2010
OSG Q4 2010
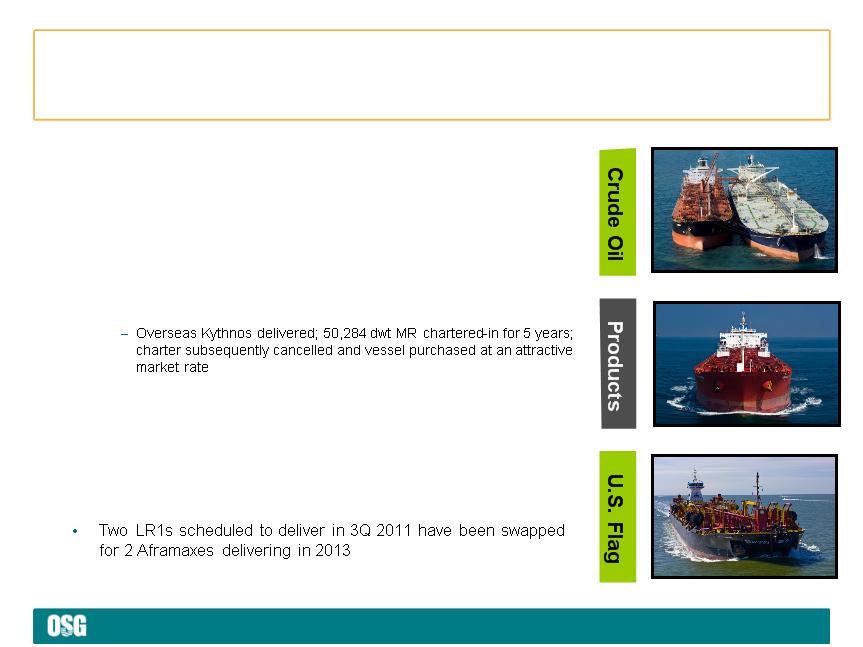
• Products
- Addition brings International Flag MR fleet to 31 vessels
• U.S. Flag
- Overseas Anacortes delivered; chartered-out to Tesoro for 3 years
- Two older vessels sold; one additional single hull vessel sale pending
- U.S. Flag fleet totals 23
< We continue to actively manage our orderbook
- Transaction increased construction commitments by < $5M
page 5
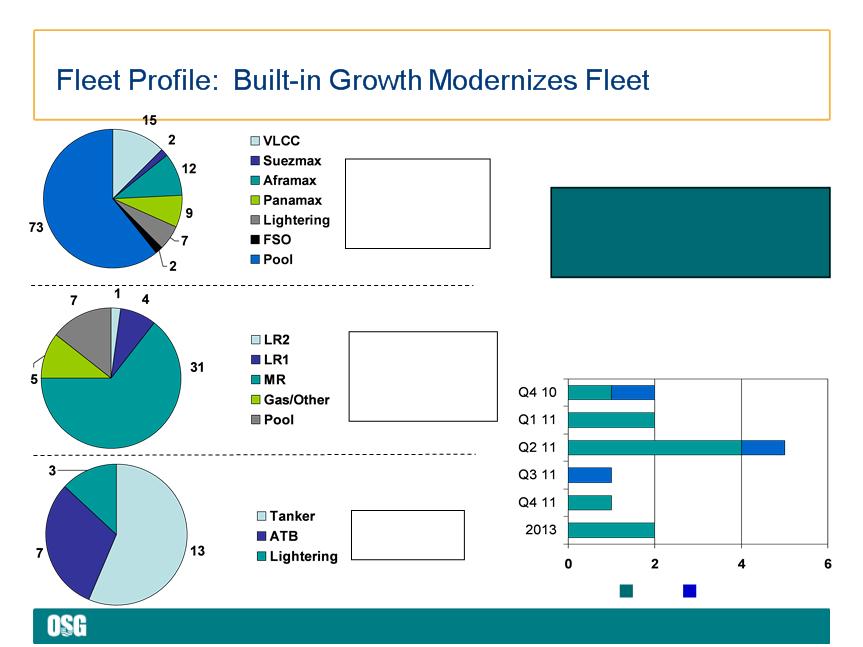
Vessel Delivery Schedule
Crude
47 OSG
73 Pool Ships
120
47 OSG
73 Pool Ships
120
Chartered-in
Owned
Total operating fleet 111
Total newbuild fleet 13
Total pool vessels 80
Total Fleet 204
Total newbuild fleet 13
Total pool vessels 80
Total Fleet 204
Products & Gas
41 OSG*
7 Pool Ships
48
41 OSG*
7 Pool Ships
48
U.S. Flag
23 OSG
23 OSG
* Includes car carrier and 4 LNG carriers
As of October 30, 2010
Operating Fleet
Operating Fleet
Operating Fleet
page 6
Commercial pools, COAs and triangulation trades
optimize OSG’s fleet, particularly in down markets
optimize OSG’s fleet, particularly in down markets
|
|
OSG Spot
Rates |
Clarksons
Average Spot *
|
Outperformance
|
|
VLCC
(Tankers International)
|
$32,017
|
$17,276
|
$14,741
|
|
Suezmax
(Suezmax International)
|
$19,185
|
$14,308
|
$4,877
|
|
Aframax
(Aframax International) |
$15,518
|
$13,932
|
$1,586
|
|
Panamax
(Panamax International)
|
$16,557
|
$11,216
|
$5,341
|
|
MR
|
$13,057
|
$9,709
|
$3,348
|
*Clarksons rates for the period have been weighted according to the routes on which OSG’s vessels operate. See page 17 for more information.
Outperforming in Tough Market Conditions: 3Q 2010

page 7
(1) 2009 G&A excludes severance and relocation costs
G&A Expenses (1)
(~37%)
($ in millions)
Disciplined Expense Management
< Disciplined expense management continues
across shoreside operations
across shoreside operations
• Consolidation of Products and Gas business
units in the third quarter better leverages existing
staff
units in the third quarter better leverages existing
staff
• Renegotiated rents in Tampa, Singapore and
Athens; moved Philadelphia office to smaller
facility in Delaware
Athens; moved Philadelphia office to smaller
facility in Delaware
• New policies related to travel and
communications
communications
• New hires and replacement positions require
senior management approval
senior management approval
• Process improvement efforts and IT
infrastructure changes
infrastructure changes
< Tight vessel opex management by fleet
managers; expect to hold flat through 2011
managers; expect to hold flat through 2011
< Focused efforts on reducing G&A will continue
in 2011 and beyond
in 2011 and beyond
page 8
< Strong liquidity and balance sheet profile
• $1.5B in liquidity
• Attractive debt maturity profile
• Manageable debt and refinancing obligations
over next two years
over next two years
• Future construction commitments of $375M
fully funded
fully funded
< $1.75 annual dividend sustainable
< Ample room within covenants
As of September 30, 2010; future construction commitments after LR1/Aframax swap transaction.
|
Limit on Secured Debt
Maximum 30% |
18%
|
|
Maximum Leverage
Funded indebtedness to total capitalization <60% |
41%
|
|
Minimum Net Worth
Tangible net worth ³ $1.2B |
$2.6B
|
|
Minimum Unencumbered Assets
Tangible assets to unsecured debt ³ 150% |
256%
|
Covenants on $1.8B facility
Strong Balance Sheet and Liquidity

page 9
1Source IMF; 2Source IEA
While fourth quarter is starting out weaker than normal,
we expect the winter market will improve.
We believe a 2011 market turnaround is possible.
we expect the winter market will improve.
We believe a 2011 market turnaround is possible.
Outlook
< Demand expectations
• GDP estimated to grow 4.2% in 20111
• World oil demand forecasted to grow by 1.4%2
• China
- Refinery expansion and demand growth continue
- Ton-mile expands as China sources more oil from Brazil, Caribbean and other Atlantic ports
< Products
• Ton-mile growth expected to continue from longer-haul trading patterns
• Ton-mile growth in the MR sector expected to exceed supply growth in 2011
• India’s export capacity is increasing
• Diesel arbitrage opportunities likely
< U.S. Flag
• Fundamentals expected to improve since Jones Act fleet expected to decline
< Orderbook. 2011 slippage could exceed 2010.
• With 2011 orderbook contract values well in excess of asset values and financing levels at
60% of market value, orderbook remains wildcard
60% of market value, orderbook remains wildcard

page 10
In Summary
< Focused on executing our strategy in any market
• We have reduced costs at sea and ashore
• We have negotiated improvements in our newbuilding commitments
• We have been patient about pursuing opportunities
• Challenging U.S. Flag and Crude newbuild/conversion projects are operational
• Scale, cargo systems and commercial infrastructure positions OSG to
outperform in weak markets
outperform in weak markets
• High levels of liquidity and financial flexibility maintained
< Following a consistent strategy throughout this difficult period positions
OSG to emerge ahead of the pack when markets recover
OSG to emerge ahead of the pack when markets recover

page *
Financial Review
Myles Itkin, CFO
page 12
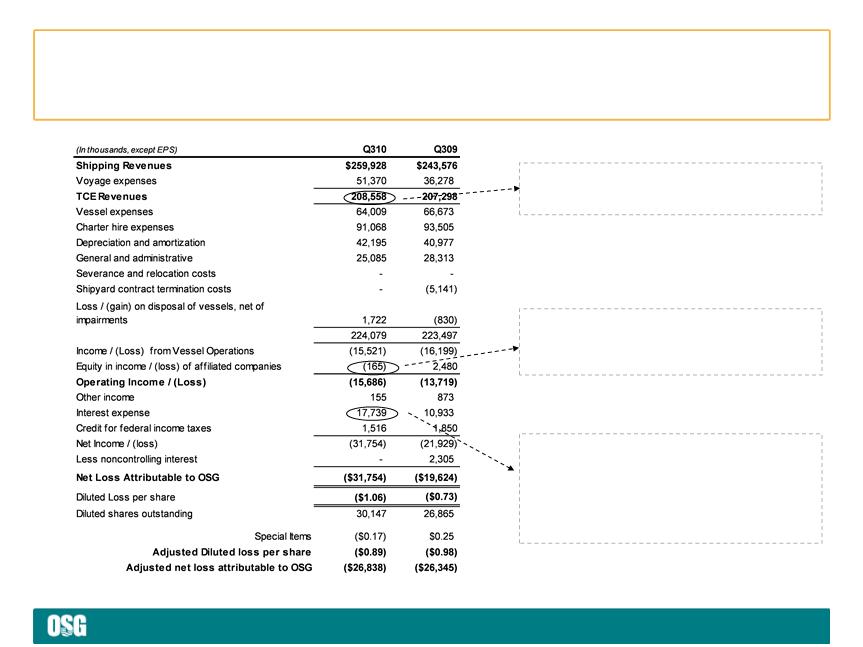
63% of TCE revenues derived from spot market
compared with 43% in Q309. Expiring fixed rate
business was replaced at lower rates
compared with 43% in Q309. Expiring fixed rate
business was replaced at lower rates
FSO Africa commenced employment August 30.
OSG’s share of loss for the quarter was $5.7M, which
included $3.0M related to interest rate swaps that are
marked-to-market through earnings
OSG’s share of loss for the quarter was $5.7M, which
included $3.0M related to interest rate swaps that are
marked-to-market through earnings
Debt maturity pushed out by issuing $300M of Notes
due 2018 which resulted in $5.0M increase in interest
expense, net of reduction in expense achieved by
repaying $42.0M in secured loans with an average
interest rate of 6%; average amount of floating rate
debt increased $193M quarter-over-quarter; 40bp
increase in average rate paid on floating rate debt
Financial Review - Income Statement
page 13
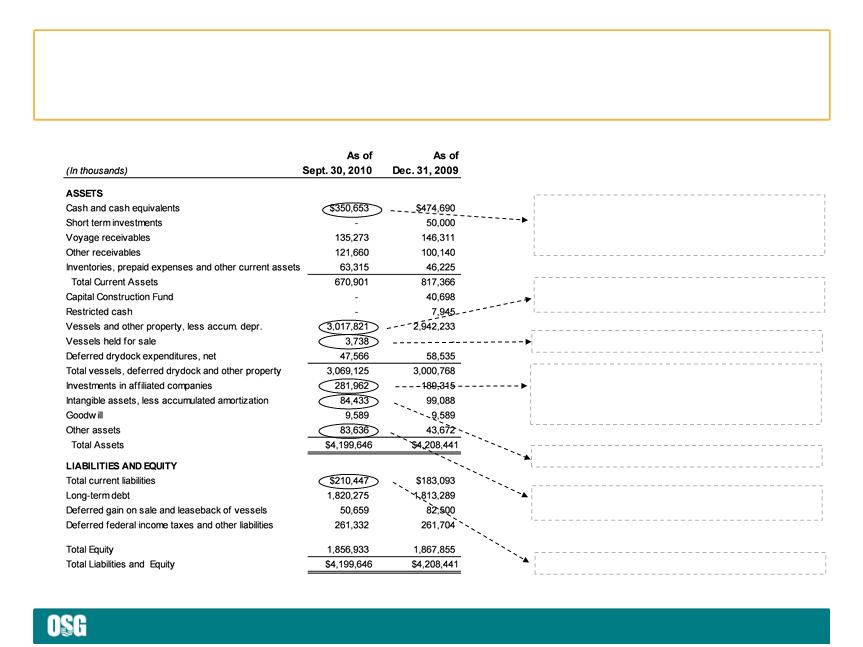
Raised $450M in capital market transactions Q1; net
reduction in outstanding balances under credit facilities of
$308M; vessel expenditures totaled $240M and $152M
advanced to FSO joint venture
reduction in outstanding balances under credit facilities of
$308M; vessel expenditures totaled $240M and $152M
advanced to FSO joint venture
Includes deposit related to the purchase of the Overseas
Kythnos, completed in Q4
Kythnos, completed in Q4
Includes CIP of $632M; reflects Q2 impairment of $12.5M
Represents Overseas Galena Bay
Funding conversion of FSOs and FSO Africa operating
costs ($80M); cash collateral required by FSO JV banking
facility ($72M); offset by net operating losses ($5.5M) and
distributions ($9M)
costs ($80M); cash collateral required by FSO JV banking
facility ($72M); offset by net operating losses ($5.5M) and
distributions ($9M)
Reflects Q2 impairment in crude lightering operations
Includes $13.3M dividend payable November 23
Financial Review - Balance Sheet

page 14
2010 Guidance
< Estimated vessel expenses (updated from $275M to $290M due to reductions in lubricating oils, stores, spares and repairs)
• $265M to $270M
< Time and bareboat charter hire expenses
• $365M to $380M
< Depreciation and Amortization
• $170M to $190M
< G&A (updated from $100M to $115M)
• Approximately $105M
< Equity income of affiliated companies (updated from $3M to $8M due to 3Q mark-to-market loss on FSO Africa interest
rate swaps due to further decline in long-term interest rates)
rate swaps due to further decline in long-term interest rates)
• $0M to $5M
< Interest expense
• Interest expense approx. $65M to $75M
< Capital expenditures
• $22M in full year drydock costs (Q4 detail: $8M on 8 vessels)
• $433M in full year newbuild progress payments, vessel improvements and capitalized interest (Q4
detail: $193M)
detail: $193M)

page 15
An invitation to OSG’s investors and lenders meeting
December 15, 2010
New York
Registration Required
Contact: Jennifer Schlueter
December 15, 2010
New York
Registration Required
Contact: Jennifer Schlueter

page *
Appendix
page 17
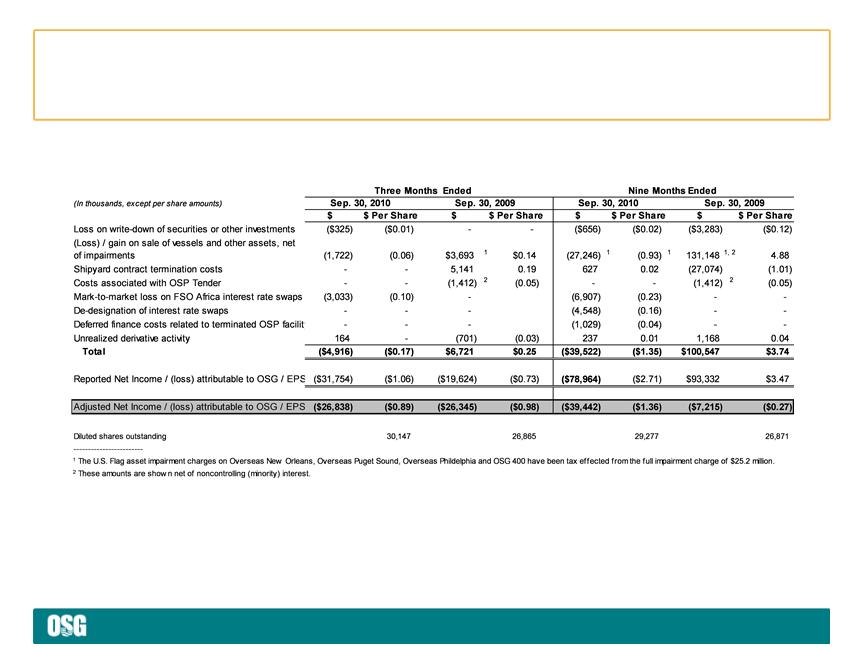
Set forth below are significant items of income and expense that affected the Company’s results for the three and nine months ended September
30, 2010 and 2009, all of which are typically excluded by securities analysts in their published estimates of the Company’s financial results
30, 2010 and 2009, all of which are typically excluded by securities analysts in their published estimates of the Company’s financial results
Special Items Affecting Net Income/(Loss)
In calculating Clarksons average spot rates, each vessel class was weighted following OSG’s typical trading routes. This follows a similar
methodology used in how OSG calculates average spot rates during the period in the Operations section of Management’s Discussion and
Analysis reported in the Company’s 10-Q and 10-K filings. VLCC voyages were weighted 60% Arabian Gulf-East and 40% Arabian Gulf-
West; Suezmaxes weighted 100% using W. Africa to U.S.Gulf; Aframaxes weighted 100% using Caribbean-U.S. Gulf and U.S. Atlantic Coast;
Panamaxes are weighted 100% Caribbean-U.S. Gulf/U.S. Atlantic Coast since Clarksons does not publish rates for Ecuador-U.S. West Coast;
MRs weighted using 60% trans-Atlantic and 40% Caribbean-U.S. Atlantic Coast.
Methodology Used for Calculating Clarksons Average Spot Rates
Reconciling Items
page 18
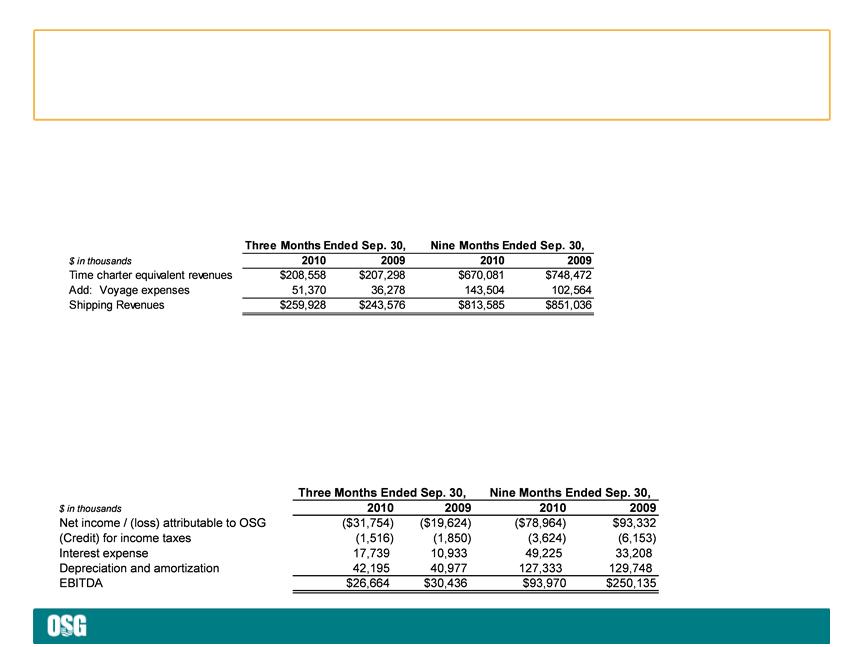
EBITDA represents operating earnings excluding net income / (loss) attributable to the noncontrolling interest, which is before interest expense and
income taxes, plus other income and depreciation and amortization expense. EBITDA is presented to provide investors with meaningful additional
information that management uses to monitor ongoing operating results and evaluate trends over comparative periods. EBITDA should not be
considered a substitute for net income / (loss) attributable to the Company or cash flow from operating activities prepared in accordance with
accounting principles generally accepted in the United States or as a measure of profitability or liquidity. While EBITDA is frequently used as a
measure of operating results and performance, it is not necessarily comparable to other similarly titled captions of other companies due to
differences in methods of calculation.
EBITDA
Consistent with general practice in the shipping industry, the Company uses time charter equivalent revenues, which represents shipping revenues
less voyage expenses, as a measure to compare revenue generated from a voyage charter to revenue generated from a time charter. Time charter
equivalent revenues, a non-GAAP measure, provides additional meaningful information in conjunction with shipping revenues, the most directly
comparable GAAP measure, because it assists Company management in making decisions regarding the deployment and use of its vessels and in
evaluating their financial performance.
TCE Revenues
Reconciling Items
page 19
|
|
Owned
|
Chartered-in
|
Total
|
Newbuild
|
Total
|
|
VLCC
|
9
|
6
|
15
|
2
|
17
|
|
FSO
|
2
|
-
|
2
|
-
|
2
|
|
Suezmax
|
-
|
2
|
2
|
-
|
2
|
|
Aframax
|
6
|
6
|
12
|
2
|
14
|
|
Panamax
|
9
|
-
|
9
|
-
|
9
|
|
Lightering
|
2
|
5
|
7
|
-
|
7
|
|
Total Crude
|
28
|
19
|
47
|
4
|
51
|
|
LR2
|
-
|
1
|
1
|
-
|
1
|
|
LR1
|
2
|
2
|
4
|
2
|
6
|
|
MR*
|
15
|
17
|
32
|
4
|
36
|
|
Total Products
|
17
|
20
|
37
|
6
|
43
|
|
Handysize
|
4
|
9
|
13
|
2
|
15
|
|
ATB
|
7
|
-
|
7
|
-
|
7
|
|
Lightering
|
3
|
-
|
3
|
1
|
4
|
|
Total U.S. Flag
|
14
|
9
|
23
|
3
|
26
|
|
Total Gas
|
4
|
-
|
4
|
-
|
4
|
|
TOTAL
|
63
|
48
|
111
|
13
|
124
|
*Products operating fleet Includes 2 owned U.S. Flag MRs that trade internationally and a car carrier; Products newbuild fleet includes a chemical tanker
Fleet Composition - As of 10/30/10

page 20
Off Hire and Scheduled Drydock
In addition to regular inspections by OSG personnel, all vessels are subject to periodic drydock, special survey and other
scheduled or known maintenance and repairs. The table below sets forth actual days off hire for the third quarter of 2010
and anticipated days off hire for the above-mentioned events by vessel class for the fourth quarter of 2010.
scheduled or known maintenance and repairs. The table below sets forth actual days off hire for the third quarter of 2010
and anticipated days off hire for the above-mentioned events by vessel class for the fourth quarter of 2010.
Off Hire Schedule
page 21
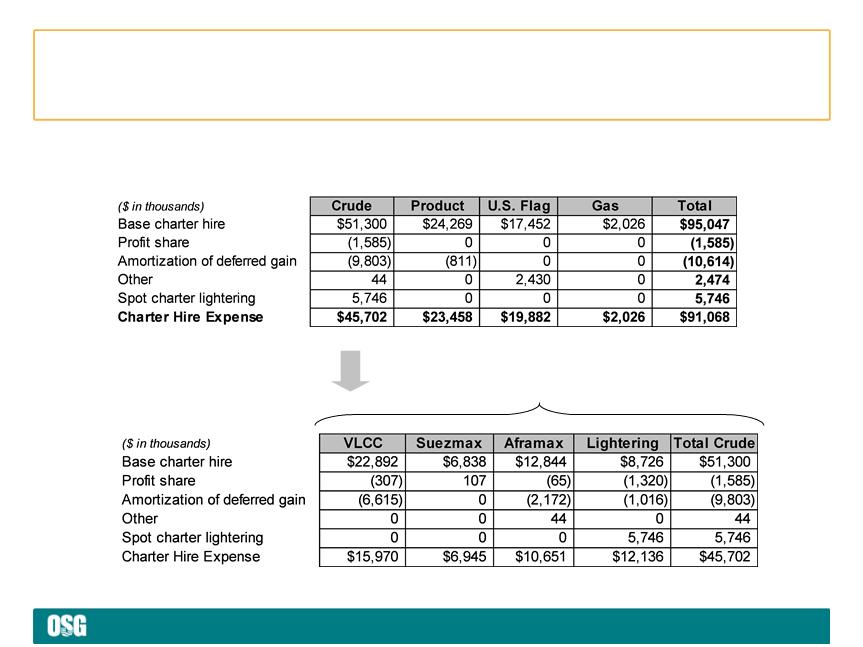
For the Quarter Ended September 30, 2010
Note: Vessels chartered-in for less than one year are not on the Company’s fleet list. During the second quarter, the Gas segment chartered in an LPG
carrier for an initial term that was less than one year.
carrier for an initial term that was less than one year.
Charter Hire Expense by Segment
page 22
Locked-in Time Charter
Days by Segment
Days by Segment
Locked-in Time Charter
Revenue by Segment
Revenue by Segment
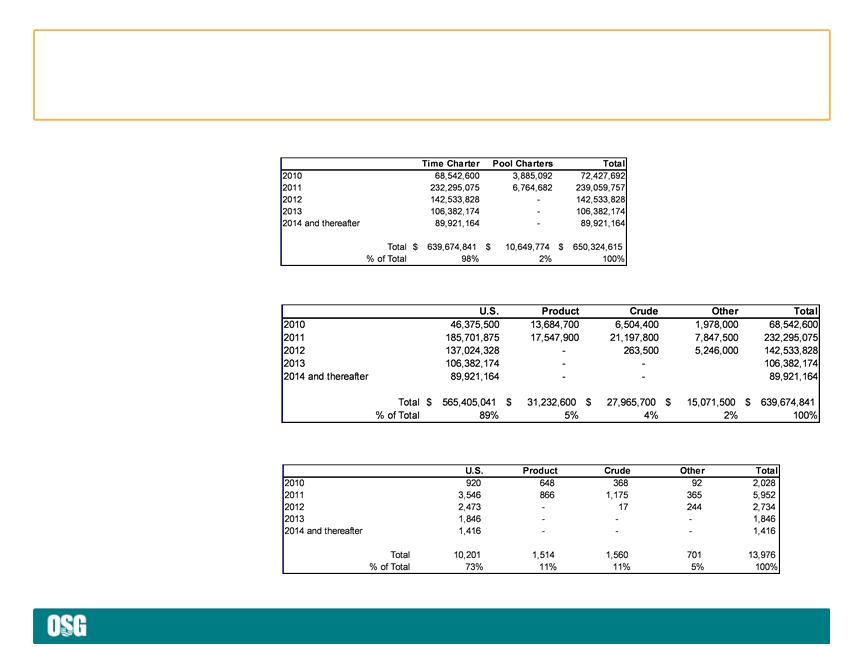
Locked-in
Charter Revenue
Charter Revenue
Locked-in time charter days for 2010 are as of 9/30/10 and will differ from a more current date used in Appendices 3 and 4 in the quarterly earnings
press release
press release
Future Revenue $/Days by Segment - As of 9/30/10

page *
www.osg.com