Attached files
| file | filename |
|---|---|
| EX-21 - UNIFIRST CORP | exhibit-21.htm |
| EX-23.1 - UNIFIRST CORP | exhibit-23_1.htm |
| EX-31.2 - UNIFIRST CORP | exhibit-31_2.htm |
| EX-31.1 - UNIFIRST CORP | exhibit-31_1.htm |
| EX-32.2 - UNIFIRST CORP | exhibit-32_2.htm |
| EX-32.1 - UNIFIRST CORP | exhibit-32_1.htm |
UNITED STATES SECURITIES AND EXCHANGE COMMISSION
WASHINGTON, D.C. 20549
FORM 10-K
(Mark One)
|
x
|
Annual Report Pursuant to Section 13 or 15(d) of the Securities Exchange Act of 1934
For the Fiscal Year Ended August 28, 2010
|
|
o
|
Transition Report Pursuant to Section 13 or 15(d) of the Securities Exchange Act of 1934
|
Commission file number 0-8504
UNIFIRST CORPORATION
(Exact Name of Registrant as Specified in Its Charter)
|
Massachusetts
|
04-2103460
|
|
|
(State or Other Jurisdiction of Incorporation or Organization)
|
(IRS Employer Identification No.)
|
68 Jonspin Road
Wilmington, Massachusetts 01887
(Address of Principal Executive Offices)(Zip Code)
Registrant’s telephone number, including area code: (978) 658-8888
Securities registered pursuant to Section 12(b) of the Act:
|
Title of Class
|
Name of Each Exchange on
Which Registered
|
|
|
Common Stock,
|
New York Stock Exchange
|
|
|
$0.10 par value per share
|
Securities registered pursuant to Section 12(g) of the Act: None
Indicate by check mark whether the registrant is a well-known seasoned issuer, as defined in Rule 405 of the Securities Act.
Yes No ü
Indicate by check mark if the registrant is not required to file reports pursuant to Section 13 or Section 15(d) of the Act.
Yes No ü
Indicate by check mark whether the registrant (1) has filed all reports required to be filed by Section 13 or 15(d) of the Securities Exchange Act of 1934 during the preceding 12 months (or for such shorter period that the registrant was required to file such reports), and (2) has been subject to such filing requirements for the past 90 days.
Yes ü No
Indicate by check mark whether the registrant has submitted electronically and posted on its corporate Web site, if any, every Interactive Data File required to be submitted and posted pursuant to Rule 405 of Regulation S-T (§232.405 of this chapter) during the preceding 12 months (or for such shorter period that the registrant was required to submit and post such files).
Yes No
Indicate by check mark if disclosure of delinquent filers pursuant to Item 405 of Regulation S-K (§229.405 of this chapter) is not contained herein, and will not be contained, to the best of registrant’s knowledge, in definitive proxy or information statements incorporated by reference in Part III of this Form 10-K or any amendment to this Form 10-K. ü
Indicate by check mark whether the registrant is a large accelerated filer, an accelerated filer, or a non-accelerated filer. See definition of “accelerated filer” and “large accelerated filer” in Rule 12b-2 of the Exchange Act (Check one):
Large accelerated filer ü Accelerated filer Smaller Reporting Company Non-accelerated filer
Indicate by check mark whether the registrant is a shell company (as defined in Rule 12b-2 of the Exchange Act).
Yes No ü
The number of outstanding shares of the Registrant’s Common Stock and Class B Common Stock at October 15, 2010 were 14,913,379 and 4,913,369, respectively. The aggregate market value of the voting stock of the Registrant held by non-affiliates as of February 26, 2010 (the last business day of the Registrant’s most recently completed second fiscal quarter), computed by reference to the closing sale price of such shares on such date, was approximately $752,372,958.
Documents Incorporated By Reference
The Registrant intends to file a Definitive Proxy Statement pursuant to Regulation 14A promulgated under the Securities Exchange Act of 1934, as amended, for its 2011 Annual Meeting of Shareholders within 120 days of the end of the fiscal year ended August 28, 2010. Portions of such Proxy Statement are incorporated by reference in Part III of this Annual Report on Form 10-K.
UniFirst Corporation
Annual Report on Form 10-K
For the Fiscal Year Ended August 28, 2010
|
Table of Contents
|
|
|
PART I
|
|
|
Item 1. Business
|
|
|
Item 1A. Risk Factors
|
|
|
Item 1B. Unresolved Staff Comments
|
|
|
Item 2. Properties
|
|
|
Item 3. Legal Proceedings
|
|
|
Item 4. (Removed and Reserved)
|
|
|
PART II
|
|
|
Item 5. Market for Registrant's Common Equity, Related Stockholder Matters and Issuer Purchases of Equity Securities
|
|
|
Item 6. Selected Financial Data
|
|
|
Item 7. Management's Discussion and Analysis of Financial Condition and Results of Operations
|
|
|
Item 7A. Quantitative and Qualitative Disclosures About Market Risk
|
|
|
Item 8. Financial Statements and Supplementary Data
|
|
|
Consolidated statements of income for each of the three years in the period ended August 28, 2010
|
|
|
Consolidated balance sheets as of August 28, 2010 and August 29, 2009
|
|
|
Consolidated statements of shareholders' equity for each of the three years in the period ended August 28, 2010
|
|
|
Consolidated statements of cash flows for each of the three years in the period ended August 28, 2010
|
|
|
Notes to Consolidated Financial Statements
|
|
|
Report of Ernst & Young LLP, Independent Registered Public Accounting Firm
|
|
|
Item 9. Changes in and Disagreements With Accountants on Accounting and Financial Disclosure
|
|
|
Item 9A. Controls and Procedures
|
|
|
Management's Report on Internal Control Over Financial Reporting
|
|
|
Report of Ernst & Young LLP, Independent Registered Public Accounting Firm
|
|
|
Item 9B. Other Information
|
|
|
PART III
|
|
|
Item 10. Directors, Executive Officers and Corporate Governance
|
|
|
Item 11. Executive Compensation
|
|
|
Item 12. Security Ownership of Certain Beneficial Owners and Management and Related Stockholder Matters
|
|
|
Item 13. Certain Relationships and Related Transactions, and Director Independence
|
|
|
Item 14. Principal Accounting Fees and Services
|
|
|
PART IV
|
|
|
Item 15. Exhibits, Financial Statement Schedules
|
|
|
Ex-21 List of Subsidiaries
|
|
|
Ex-23.1 Consent of Ernst & Young LLP, Independent Registered Public Accounting Firm
|
|
|
Ex-31.1 Section 302 Certification of CEO
|
|
|
Ex-31.2 Section 302 Certification of CFO
|
|
|
Ex-32.1 Section 906 Certification of CEO
|
|
|
Ex-32.2 Section 906 Certification of CFO
|
|
PART I
This Annual Report on Form 10-K contains forward-looking statements within the meaning of Section 27A of the Securities Act of 1933, as amended, and Section 21E of the Securities Exchange Act of 1934, as amended. Our actual results could differ materially from those set forth in the forward-looking statements. Certain factors that might cause such a difference are discussed in “Management’s Discussion and Analysis of Financial Condition and Results of Operations”; “Safe Harbor for Forward Looking Statements” and “Risk Factors” included elsewhere in this Annual Report on Form 10-K.
ITEM 1. BUSINESS
GENERAL
UniFirst Corporation, a corporation organized under the laws of the Commonwealth of Massachusetts in 1950, together with its subsidiaries, hereunder referred to as “we”, “our”, the “Company”, or “UniFirst”, is one of the largest providers of workplace uniforms and protective work wear clothing in the United States. We design, manufacture, personalize, rent, clean, deliver, and sell a wide range of uniforms and protective clothing, including shirts, pants, jackets, coveralls, lab coats, smocks, aprons and specialized protective wear, such as flame resistant and high visibility garments. We also rent industrial wiping products, floor mats, facility service products, restroom supplies, and other non-garment items, and provide first aid cabinet services and other safety supplies, to a variety of manufacturers, retailers and service companies. We serve businesses of all sizes in numerous industry categories. At certain specialized facilities, we also decontaminate and clean work clothes that may have been exposed to radioactive materials and service special cleanroom protective wear.
Our principal services include providing customers with uniforms and other non-garment items, picking up soiled uniforms or other items on a periodic basis (usually weekly), and delivering, at the same time, cleaned and processed items. We offer uniforms in a wide variety of styles, colors, sizes and fabrics and with personalized emblems selected by the customer. Our centralized services, specialized equipment and economies of scale generally allow us to be more cost effective in providing garment services than customers could be themselves, particularly those customers with high employee turnover rates. During fiscal 2010, we manufactured approximately 65% of the garments we placed in service. Because we design and manufacture a majority of our own uniforms and protective clothes, we can produce custom garment programs for our larger customers, offer a diverse range of such designs within our standard line of garments and better control the quality, price and speed at which we produce such garments. In addition, among our competitors, we believe we have the largest in-house digital image processing capability, allowing us to convert an image provided by a customer into customized, mass producible embroidered emblems, typically within two days.
We have six operating segments: US Rental and Cleaning, Canadian Rental and Cleaning, Manufacturing (“MFG”), Specialty Garments Rental and Cleaning (“Specialty Garments”), First Aid and Corporate. The US Rental and Cleaning and Canadian Rental and Cleaning operating segments have been combined to form the US and Canadian Rental and Cleaning reporting segment. The US and Canadian Rental and Cleaning reporting segment purchases, rents, cleans, delivers and sells, uniforms and protective clothing and non-garment items in the United States and Canada. The Corporate operating segment consists of costs associated with our distribution center, sales and marketing, information systems, engineering, materials management, manufacturing planning, finance, budgeting, human resources, other general and administrative costs and interest expense. The revenues generated from the Corporate operating segment represent certain direct sales we made directly from our distribution center. The products sold by this operating segment are the same products rented and sold by the US and Canadian Rental and Cleaning reporting segments. The MFG operating segment designs and manufactures uniforms and non-garment items solely for the purpose of providing these goods to the US and Canadian Rental and Cleaning reporting segment. The Specialty Garments operating segment purchases, rents, cleans, delivers and sells, specialty garments and non-garment items primarily for nuclear and cleanroom applications. The First Aid operating segment sells first aid cabinet services and other safety supplies.
In fiscal 2010, we generated $1.026 billion in revenue, of which approximately 88% was derived from the US and Canadian Rental and Cleaning and Corporate segments. Specialty Garments and First Aid accounted for approximately 9% and 3% of our 2010 revenues, respectively.
PRODUCTS AND SERVICES
We provide our customers with personalized workplace uniforms and protective work clothing in a broad range of styles, colors, sizes and fabrics. Our uniform products include shirts, pants, jackets, coveralls, lab coats, smocks, aprons and specialized protective wear, such as flame resistant and high visibility garments. At certain specialized facilities, we also decontaminate and clean clothes which may have been exposed to radioactive materials and service special cleanroom protective wear. We also offer non-garment items and services, such as industrial wiping products, floor mats, dry and wet mops, restroom supplies and other textile products.
We offer our customers a range of garment service options, including full-service rental programs in which garments are cleaned and serviced by us, lease programs in which garments are cleaned and maintained by individual employees and purchase programs to buy garments and related items directly. As part of our rental business, we pick up a customer’s soiled uniforms and/or other items on a periodic basis (usually weekly) and deliver back cleaned and processed replacement items. We believe our centralized services, specialized equipment and economies of scale generally allow us to be more cost effective in providing garment and related services than customers would be by themselves, particularly those customers with high employee turnover rates. Our uniform program is intended not only to help our customers foster greater company identity, but to enhance their corporate image and improve employee safety, productivity and morale. We primarily serve our customers pursuant to written service contracts that range in duration from three to five years.
CUSTOMERS
We serve businesses of all sizes in numerous industry categories. During each of the past five years, no single uniform rental customer accounted for more than 1% of our revenues. Our typical customers include automobile service centers and dealers, delivery services, food and general merchandise retailers, food processors and service operations, light manufacturers, maintenance facilities, restaurants, service companies, soft and durable goods wholesalers, transportation companies, and others who require employee clothing for image, identification, protection or utility purposes. Among our largest customers of our conventional uniform rental business are divisions, units, regional operations or franchised agencies of major, nationally recognized organizations. With respect to our Specialty Garment segment, typical customers include government agencies, research and development laboratories, high technology companies and utilities operating nuclear reactors. We currently service over 225,000 customer locations in the United States, Canada and Europe from 205 customer service, distribution and manufacturing facilities.
MARKETING, SALES, AND CUSTOMER SERVICE
We market our products and services to a diverse customer base and to prospects that range across virtually all industry segments. Marketing contact is made through print advertising, direct mail, publicity, trade shows, catalogs, telemarketing, multiple web sites and direct field sales representation. We have built and maintain an extensive, proprietary database of prescreened and qualified business prospects that have been sourced from our various promotional initiatives, including mailers, web site contacts, advertising responses, sales calls and lists purchased from third-party providers. These prospect records serve as a primary targeting resource for our professional sales organization and are constantly updated, expanded and maintained by an in-house team of specialist database qualifiers and managers. To aid in the effective marketing of products and services, we supply sales representatives with an extensive selection of sales aids, brochures, presentation materials and vertical market communications tools. We also provide representatives with detailed on-line profiles of high opportunity markets to educate them to the typical issues, needs and concerns of those markets. This helps establish credibility and aids their ability to deliver value-based solutions.
We employ a large team of trained professional sales representatives whose sole function is to market our services to potential customers and develop new accounts. While most of our sales representatives are capable of presenting a full range of service solutions, some are dedicated to developing business for a limited range of products and services or have a specific market focus.
For example, in select geographic markets we employ teams of dedicated facility services sales representatives who focus exclusively on developing business for our floor care, restroom and related service programs. We employ specialist executive-level salespeople in our National Account Organization—some who specialize in rental programs and some who specialize in direct sale programs—to target the very largest national companies with known uniform and/or facility services program needs. We believe that effective customer service is the most important element in developing and maintaining our market position. Our commitment to service excellence is reflected throughout our organization. Our route sales representatives are the first line of continuing customer contact, but they are supported by local customer service representatives, local service management staff and local operations management leaders, all of whom are focused on addressing the ongoing needs of customers, constantly delivering high-value service and pursuing total customer satisfaction. Our proprietary CRM information system enables us to respond to customer inquiries or issues within 24 hours and our service personnel are specially trained to handle the daily contact work necessary to effectively manage customer relations.
We measure the speed and accuracy of our customer service efforts on a weekly basis and, through our ‘‘Customers for Life’’ program, we continuously survey, record and report satisfaction levels as a means of auditing current performance and highlighting areas for improvement.
COMPETITION
The uniform rental and sales industry is highly competitive. The principal methods of competition in the industry are the quality of products, the quality of service and price. We believe that the top four companies in the uniform rental segment of the industry, including UniFirst, currently generate approximately 40% of the industry’s volume. Our leading competitors include Cintas Corporation, Aramark Corporation and G&K Services, Inc. The remainder of the market, however, is divided among more than 400 smaller businesses, many of which serve one or a limited number of markets or geographic service areas. In addition to our traditional rental competitors, we may increasingly compete in the future with businesses that focus on selling uniforms and other related items. We also compete with industry competitors for acquisitions.
MANUFACTURING AND SOURCING
We manufactured approximately 65% of all garments which we placed in service during fiscal 2010. These were primarily work pants and shirts manufactured at our plants in Cardenas, Ebano and Valles, which are located in San Luis Potosi, Mexico. The balance of the garments used in our programs are purchased from a variety of industry suppliers. While we currently acquire the raw materials with which we produce our garments from a limited number of suppliers, we believe that such materials are readily available from other sources. To date, we have experienced no significant difficulty in obtaining any of our raw materials or supplies. Currently, we also manufacture approximately 76% of the mats we place in service at our plant in Cave City, Arkansas.
EMPLOYEES
At August 28, 2010, we employed approximately 10,000 persons. Approximately 2% of our United States employees are represented by a union pursuant to a collective bargaining agreement. We consider our employee relations to be good.
EXECUTIVE OFFICERS
Our executive officers are as follows:
|
NAME
|
AGE
|
POSITION
|
|
Ronald D. Croatti
|
67
|
Chairman of the Board, President, and Chief Executive Officer
|
|
Steven S. Sintros
|
36
|
Vice President and Chief Financial Officer
|
|
Cynthia Croatti
|
55
|
Executive Vice President and Treasurer
|
|
Bruce P. Boynton
|
62
|
Senior Vice President, Operations
|
|
David A. DiFillippo
|
53
|
Senior Vice President, Operations
|
|
David M. Katz
|
46
|
Vice President, Sales and Marketing
|
The principal occupation and positions for the past five years of our executive officers named above are as follows:
Ronald D. Croatti joined our Company in 1965. Mr. Croatti became Director of our Company in 1982, Vice Chairman of the Board in 1986 and has served as Chief Executive Officer since 1991. He has also served as President since 1995 and Chairman of the Board since 2002. Mr. Croatti has overall responsibility for the management of our Company.
Steven S. Sintros joined our Company in 2004. Mr. Sintros has served as our Vice President and Chief Financial Officer since January 2009 and has primary responsibility for overseeing the financial functions of our Company, as well as our information systems department. Mr. Sintros served as a Finance Manager in 2004 and Corporate Controller from 2005 until January 2009.
Cynthia Croatti joined our Company in 1980. Ms. Croatti has served as Director since 1995, Treasurer since 1982 and Executive Vice President since 2001. In addition, she has primary responsibility for overseeing the human resources and purchasing functions of our Company.
Bruce P. Boynton joined our Company in 1976. Mr. Boynton has served as Senior Vice President, Operations since January 2001, is the chief operating officer for our Company’s Canadian operations and has primary responsibility for overseeing the operations of certain regions in the United States. From 1986 through 2000, Mr. Boynton served as Vice President, Operations.
David A. DiFillippo joined our Company in 1979. Mr. DiFillippo has served as Senior Vice President, Operations since 2002 and has primary responsibility for overseeing the operations of certain regions in the United States. From 2000 through 2002, Mr. DiFillippo served as Vice President, Central Rental Group and, prior to 2000, he served as a Regional General Manager.
David M. Katz joined our Company as Vice President, Sales and Marketing in January 2009. Mr. Katz has primary responsibility for overseeing the sales and marketing functions of our Company. Prior to joining our Company, Mr. Katz worked for DHL Express where he served as the Northeast Vice President of Field Sales, from 2003 to 2007, the Northeast Vice President of National Account Sales from 2007 to 2008 and the Senior Vice President and General Manager of the Northeast from 2008 until January 2009.
Ronald D. Croatti and Cynthia Croatti are siblings. Anthony F. DiFillippo, a member of our Board of Directors, is Cynthia Croatti’s uncle and father of David A. DiFillippo.
ENVIRONMENTAL MATTERS
We, like our competitors, are subject to various federal, state and local laws and regulations governing, among other things, the generation, handling, storage, transportation, treatment and disposal of hazardous wastes and other substances. In particular, industrial laundries currently use and must dispose of detergent waste water and other residues, and, in the past, used perchloroethylene and other dry cleaning solvents. We are attentive to the environmental concerns surrounding the disposal of these materials and have through the years taken measures to avoid their improper disposal. Over the years, we have settled, or contributed to the settlement of, actions or claims brought against us relating to the disposal of hazardous materials and there can be no assurance that we will not have to expend material amounts to remediate the consequences of any such disposal in the future. Further, under environmental laws, an owner or lessee of real estate may be liable for the costs of removal or remediation of certain hazardous or toxic substances located on or in or emanating from such property, as well as related costs of investigation and property damage. Such laws often impose liability without regard to whether the owner or lessee knew of or was responsible for the presence of such hazardous or toxic substances. There can be no assurance that acquired or leased locations have been operated in compliance with environmental laws and regulations or that future uses or conditions will not result in the imposition of liability upon us under such laws or expose us to third-party actions such as tort suits. We continue to address environmental conditions under terms of consent orders negotiated with the applicable environmental authorities or otherwise with respect to sites located in, or related to, Woburn, Massachusetts, Somerville, Massachusetts, Springfield, Massachusetts, Uvalde, Texas, Stockton, California, Williamstown, Vermont, as well as a number of additional locations that we acquired as part of our acquisition of Textilease Corporation in September 2003. In addition, we recently received notice from the Maryland Department of Environment directing us to investigate potential contamination at our Landover, Maryland facility. For additional discussion refer to “Management’s Discussion and Analysis of Financial Condition and Results of Operations” and the risk factor set forth in this Annual Report on Form 10-K.
Our nuclear garment decontamination facilities are licensed by the Nuclear Regulatory Commission, or in certain cases, by the applicable state agency, and are subject to regulation by federal, state and local authorities. In the past, scrutiny and regulation of nuclear facilities and related services have resulted in the suspension of operations at certain nuclear facilities served by us or disruptions in our ability to service such facilities. There can be no assurance that such scrutiny and regulation will not lead to the shut-down of such facilities or otherwise cause material disruptions in our garment decontamination business.
AVAILABLE INFORMATION
We make available free of charge our Proxy Statement, Annual Report on Form 10-K, Quarterly Reports on Form 10-Q, Current Reports on Form 8-K, including exhibits and any amendments to those reports, as soon as reasonably practicable after we electronically file such material with, or furnish it to, the Securities and Exchange Commission. These reports are available on our website at www.unifirst.com. In addition, you may request a copy of our filings, excluding exhibits, by contacting our Investor Relations group at (978) 658-8888 or at UniFirst Corporation, 68 Jonspin Road, Wilmington, MA 01887. Information included on our website is not deemed to be incorporated into this Annual Report on Form 10-K or the documents incorporated by reference into this Annual Report on Form 10-K.
ITEM 1A. RISK FACTORS
The statements in this section, as well as statements described elsewhere in this Annual Report on Form 10-K, or in other SEC filings, describe risks that could materially and adversely affect our business, financial condition and results of operations and the trading price of our securities. These risks are not the only risks that we face. Our business, financial condition and results of operations could also be materially affected by additional factors that are not presently known to us or that we currently consider to be immaterial to our operations.
SAFE HARBOR FOR FORWARD LOOKING STATEMENTS
This Annual Report on Form 10-K and any documents incorporated by reference may contain forward looking statements within the meaning of the federal securities laws. Forward looking statements contained in this Annual Report on Form 10-K and any documents incorporated by reference are subject to the safe harbor created by the Private Securities Litigation Reform Act of 1995. Forward looking statements may be identified by words such as “estimates,” “anticipates,” “projects,” “plans,” “expects,” “intends,” “believes,” “seeks,” “could,” “should,” “may,” “will,” or the negative versions thereof, and similar expressions and by the context in which they are used. Such forward looking statements are based upon our current expectations and speak only as of the date made. Such statements are highly dependent upon a variety of risks, uncertainties and other important factors that could cause actual results to differ materially from those reflected in such forward looking statements. Such factors include, but are not limited to, uncertainties regarding our ability to consummate and successfully integrate acquired businesses, uncertainties regarding any existing or newly-discovered expenses and liabilities related to environmental compliance and remediation, our ability to compete successfully without any significant degradation in our margin rates, seasonal and quarterly fluctuations in business levels, our ability to preserve positive labor relationships and avoid becoming the target of corporate labor unionization campaigns that could disrupt our business, the effect of currency fluctuations on our results of operations and financial condition, our dependence on third parties to supply us with raw materials, any loss of key management or other personnel, increased costs as a result of any future changes in federal or state laws, rules and regulations or governmental interpretation of such laws, rules and regulations, uncertainties regarding the price levels of natural gas, electricity, fuel and labor, the impact of adverse economic conditions and the current tight credit markets on our customers and such customers’ workforce, the level and duration of workforce reductions by our customers, the continuing increase in domestic healthcare costs, demand and prices for our products and services, rampant criminal activity and instability in Mexico where our principal garment manufacturing plants are located, additional professional and internal costs necessary for compliance with recent and proposed future changes in Securities and Exchange Commission (including the Sarbanes-Oxley Act of 2002), New York Stock Exchange and accounting rules, strikes and unemployment levels, our efforts to evaluate and potentially reduce internal costs, economic and other developments associated with the war on terrorism and its impact on the economy and general economic conditions. We undertake no obligation to update any forward looking statements to reflect events or circumstances arising after the date on which they are made.
RISKS RELATING TO OUR BUSINESS AND INDUSTRY
We face intense competition within our industry, which may adversely affect our results of operations and financial condition.
The uniform rental and sales industry is highly competitive. The principal methods of competition in the industry are quality of products, quality of service and price. We believe that the top four companies in the uniform rental segment of the industry, including us, currently generate approximately 40% of the industry’s volume. Our leading competitors include Aramark Corporation, Cintas Corporation and G&K Services, Inc. The remainder of the market, however, is divided among more than 400 smaller businesses, many of which serve one or a limited number of markets or geographic service areas. In addition to our traditional rental competitors, we may increasingly compete in the future with businesses that focus on selling uniforms and other related items. Increased competition may result in price reductions, reduced gross margins and loss of market share, any of which could have a material effect on our results of operations and financial condition. We also compete with industry competitors for acquisitions, which has the effect of increasing the price for acquisitions and reducing the number of acquisition candidates available to us. If we pay higher prices for businesses we acquire, our returns on investment and profitability may be reduced.
Adverse economic and business conditions continue to affect our customer base and may continue to negatively impact our sales and operating results.
We supply uniform services to many industries that have been subject to adverse economic and business conditions resulting in shifting employment levels, changes in worker productivity, uncertainty regarding the impacts of rehiring and shifts to offshore manufacturing. As a result, many of our customers have reduced worker headcounts. The economic hardships among our customer base have also caused, and may continue to cause, some of our customers to restrict expenditures or even cease to conduct business. Lost accounts due to financial distress continue to be significant. All of these factors have, and are likely in the future to continue to have, the effect of reducing the number of employees utilizing our uniform services, which adversely affects our sales and results of operations. The current worldwide economic weakness may negatively impact our revenues and operating performance in fiscal 2011 and beyond due to the impact on spending plans and employment levels of our customers and sales prospects.
The expenses we incur to comply with environmental regulations, including costs associated with potential environmental remediation, may prove to be significant and could have a material adverse affect on our results of operations and financial condition.
We, like our competitors, are subject to various federal, state and local laws and regulations governing, among other things, the generation, handling, storage, transportation, treatment and disposal of hazardous wastes and other substances. In particular, industrial laundries currently use and must dispose of detergent waste water and other residues, and, in the past, used perchloroethylene and other dry cleaning solvents. We are attentive to the environmental concerns surrounding the disposal of these materials and have, through the years, taken measures to avoid their improper disposal. Over the years, we have settled, or contributed to the settlement of, actions or claims brought against us relating to the disposal of hazardous materials and there can be no assurance that we will not have to expend material amounts to remediate the consequences of any such disposal in the future. Further, under environmental laws, an owner or lessee of real estate may be liable for the costs of removal or remediation of certain hazardous or toxic substances located on or in or emanating from such property, as well as related costs of investigation and property damage. Such laws often impose liability without regard to whether the owner or lessee knew of or was responsible for the presence of such hazardous or toxic substances. There can be no assurance that acquired or leased locations have been operated in compliance with environmental laws and regulations or that future uses or conditions will not result in the imposition of liability upon us under such laws or expose us to third-party actions such as tort suits.
We continue to address environmental conditions under terms of consent orders negotiated with the applicable environmental authorities or otherwise with respect to sites located in or related to Woburn, Massachusetts, Somerville, Massachusetts, Springfield, Massachusetts, Uvalde, Texas, Stockton, California, three sites in Williamstown, Vermont, as well as a number of additional locations that we acquired as part of our acquisition of Textilease Corporation in September 2003. In addition, we recently received notice from the Maryland Department of Environment directing us to investigate potential contamination at our Landover, Maryland facility.
We have accrued certain costs related to the sites described above as it has been determined that the costs are probable and can be reasonably estimated. We continue to implement mitigation measures and to monitor environmental conditions at the Somerville, Massachusetts site. We also have potential exposure related to an additional parcel of land (the “Central Area”) related to the Woburn, Massachusetts site discussed above. Currently, the consent decree for the Woburn site does not define or require any remediation work in the Central Area. The United States Environmental Protection Agency (the “EPA”) has provided us and other signatories to the consent decree with comments on the design and implementation of groundwater and soil remedies at the Woburn site and investigation of environmental conditions in the Central Area. We met with EPA to discuss its comments, and we and another signatory to the consent decree subsequently submitted work plans to perform additional environmental investigations. Such work pursuant to these work plans has been initiated. We have accrued costs to perform certain work responsive to EPA’s comments.
On a quarterly basis, we assess each of our environmental sites to determine whether the costs of investigation and remediation of environmental conditions are probable and can be reasonably estimated as well as the adequacy of our accruals with respect to such costs. There can be no assurance that our accruals with respect to our environmental sites will be sufficient or that the costs of remediation and investigation will not substantially exceed our accruals as new facts, circumstances or estimates arise.
Our nuclear garment decontamination facilities are licensed by the Nuclear Regulatory Commission, or in certain cases, by the applicable state agency, and are subject to regulation by federal, state and local authorities. In the past, scrutiny and regulation of nuclear facilities and related services have resulted in the suspension of operations at certain nuclear facilities served by us or disruptions in our ability to service such facilities. There can be no assurance that such scrutiny and regulation will not lead to the shut-down of such facilities or otherwise cause material disruptions in our garment decontamination business.
Recent economic trends could adversely affect our financial performance.
Economic downturns and declines in consumption in our markets may affect the levels of both our sales and profitability. The domestic and global economies and financial and credit markets continue to experience declines or slow growth and there continues to be diminished liquidity and credit availability. We believe these conditions have not materially impacted our financial position as of August 28, 2010 or our liquidity for the year ended August 28, 2010. However, we could be negatively impacted if these conditions continue for a sustained period of time, or if there is further deterioration in financial markets and major economies. The current tight credit conditions in financial markets are likely to continue to adversely affect the ability of our customers and suppliers to obtain financing, which could result in a decrease in, or cancellation of, our services. In addition, weakening economic conditions and outlook may result in a further decline in the level of our customers’ spending that could adversely affect our results of operations and liquidity. We are unable to predict the likely duration and severity of the current disruption in the domestic and global financial markets and the related adverse economic conditions.
Our failure to implement successfully our acquisition strategy and to grow our business could adversely affect our ability to increase our revenues and could negatively impact our profitability.
As part of our growth strategy, we intend to continue to actively pursue additional acquisition opportunities. However, as discussed above, we compete with others within our industry for suitable acquisition candidates. This competition may increase the price for acquisitions and reduce the number of acquisition candidates available to us. Moreover, the current economic recession has resulted in, and may continue to result in, the sale of fewer target businesses at prices consistent with the current declining market. As a result, acquisition candidates may not be available to us in the future on favorable terms. Even if we are able to acquire businesses on favorable terms, managing growth through acquisition is a difficult process that includes integration and training of personnel, combining plant and operating procedures and additional matters related to the integration of acquired businesses within our existing organization. Unanticipated issues related to integration may result in additional expense or in disruption to our operations, either of which could negatively impact our ability to achieve anticipated benefits. While we believe we will be able to fully integrate acquired businesses, we can give no assurance that we will be successful in this regard.
Growth of our business will likely require us to increase our work force, the scope of our operating and financial systems and the geographic area of our operations. We believe this growth will increase our operating complexity and the level of responsibility for both existing and new management personnel. Managing and sustaining our growth and expansion may require substantial enhancements to our operational and financial systems and controls, as well as additional administrative, operational and financial resources. There can be no assurance that we will be able to manage our expanding operations successfully or that we will be able to maintain or accelerate our growth, and any failure to do so could have an adverse effect on our results of operations and financial condition.
In order to finance such acquisitions, we may need to obtain additional funds either through public or private financings, including bank and other secured and unsecured borrowings and the issuance of debt or equity securities. There can be no assurance that such financings would be available to us on reasonable terms or that any future issuances of securities in connection with acquisitions will not be dilutive to our shareholders.
If we are unable to preserve positive labor relationships or become the target of corporate labor unionization campaigns, the resulting labor unrest could disrupt our business by impairing our ability to produce and deliver our products.
We employ approximately 10,000 persons. Approximately 2% of our United States employees are represented by a union pursuant to a collective bargaining agreement. Competitors within our industry have been the target of corporate unionization campaigns by multiple labor unions. While our management believes that our employee relations are good, we cannot assure you that we will not experience pressure from labor unions or become the target of campaigns similar to those faced by our competitors. The potential for unionization could increase if the United States Congress passes federal “card check” legislation. If we do encounter pressure from labor unions, any resulting labor unrest could disrupt our business by impairing our ability to produce and deliver our products. In addition, significant union representation would require us to negotiate wages, salaries, benefits and other terms with many of our employees collectively and could adversely affect our results of operations by increasing our labor costs or otherwise restricting our ability to maximize the efficiency of our operations.
Our business may be adversely affected by global, national, regional or industry specific economic slowdowns.
Global, national, regional or industry specific economic slowdowns, as well as events or conditions in a particular area, such as adverse weather and other factors, may adversely affect our operating results. In addition, increases in interest rates that may lead to a decline in economic activity, while simultaneously resulting in higher interest expense to us under our credit facility and floating rate notes, may adversely affect our operating results.
Our failure to retain our current customers and renew our existing customer contracts could adversely affect our results of operations and financial condition.
Our success depends on our ability to retain our current customers and renew our existing customer contracts. Our ability to do so generally depends on a variety of factors, including the quality, price and responsiveness of our services, as well as our ability to market these services effectively and to differentiate ourselves from our competitors. In addition, renewal rates are generally adversely affected by the difficult economic and business conditions. We cannot assure you that we will be able to renew existing customer contracts at the same or higher rates or that our current customers will not turn to competitors, cease operations, elect to self-operate or terminate contracts with us. The failure to renew a significant number of our existing contracts would have an adverse effect on our results of operations and financial condition.
Increases in fuel and energy costs could adversely affect our results of operations and financial condition.
The price of fuel and energy needed to run our vehicles and equipment is unpredictable and fluctuates based on events outside our control, including geopolitical developments, supply and demand for oil and gas, actions by OPEC and other oil and gas producers, war and unrest in oil producing countries, regional production patterns, limits on refining capacities, natural disasters and environmental concerns. Any increase in fuel and energy costs could adversely affect our results of operations and financial condition.
Quarterly fluctuations in our nuclear specialty garment business could disproportionately impact our revenue and net income and create volatility in the price of our Common Stock.
Our nuclear decontamination business is affected by shut-downs, outages and clean-ups of the nuclear facilities we service. We are not able to control or predict with certainty when such shut-downs, outages and clean-ups will occur. Our nuclear decontamination business tends to generate more revenue in the first and third fiscal quarters, which is when nuclear power plants typically schedule their plant outages and refuelings and thereby increase nuclear garment utilization. Quarterly fluctuations in our nuclear decontamination business could have a disproportionate impact on revenue and net income and create volatility in the price of our Common Stock.
Our international business results are influenced by currency fluctuations and other risks that could have an adverse effect on our results of operations and financial condition.
A portion of our sales is derived from international markets. Revenue denominated in currencies other than the U.S. dollar represented approximately 9% of total consolidated revenues for fiscal 2010, 8% for fiscal 2009 and 9% for fiscal 2008. The operating results of our international subsidiaries are translated into U.S. dollars and such results are affected by movements in foreign currencies relative to the U.S. dollar. Our international operations are also subject to other risks, including the requirement to comply with changing and conflicting national and local regulatory requirements; potential difficulties in staffing and labor disputes; managing and obtaining support and distribution for local operations; credit risk or financial condition of local customers; potential imposition of restrictions on investments; potentially adverse tax consequences, including imposition or increase of withholding and other taxes on remittances and other payments by subsidiaries; foreign exchange controls; and local political and social conditions. There can be no assurance that the foregoing factors will not have an adverse effect on our international operations or on our consolidated financial condition and results of operations. We own and operate manufacturing facilities in Mexico. Violence, crime and instability in Mexico has had, and may continue to have, an adverse affect on our operations, including the hijacking of our trucks and the implementation of security measures to protect our employees. We are not insured against such criminal attacks and there can be no assurance that losses that could result from an attack on our trucks or our personnel would not have a material adverse effect on our business, results of operations and financial condition. Operations in developing nations present several additional risks, including greater fluctuation in currencies relative to the U.S. dollar, economic and governmental instability, civil disturbances, volatility in gross domestic production, Foreign Corrupt Practice Act compliance issues and nationalization and expropriation of private assets.
Continuation of current adverse global financial and economic conditions may result in impairment of our goodwill and intangibles.
Our market capitalization over the past couple of years has experienced significant volatility due in part to adverse economic conditions and disruption in the global equity and credit markets. For short periods during fiscal 2009, our market capitalization was below our net book value. Under accounting principles generally accepted in the United States (“US GAAP”), we may be required to record an impairment charge if changes in circumstances or events indicate that the carrying values of our goodwill and intangible assets exceed their fair value and are not recoverable. Any significant and other-than-temporary decrease in our market capitalization could be an indicator, when considered together with other factors, that the carrying values of our goodwill and intangible assets exceed their fair value, which may result in our recording an impairment charge. In this time of economic uncertainty, we are unable to predict economic trends, but we continue to monitor the impact of changes in economic and financial conditions on our operations and on the carrying value of our goodwill and intangible assets. Should the value of one or more of our acquired intangibles become impaired, our consolidated earnings and net worth may be materially adversely affected.
Failure to comply with the other state and federal regulations to which we are subject may result in penalties or costs that could have a material adverse effect on our business.
Our business is subject to various other state and federal regulations, including employment laws and regulations, minimum wage requirements, overtime requirements, working condition requirements, citizenship requirements and other laws and regulations. Any appreciable increase in the statutory minimum wage rate, income or overtime pay, adoption of mandated health benefits, or changes to immigration laws and citizenship requirements would likely result in an increase in our labor costs and/or contribute to a shortage of available labor and such cost increase or labor shortage, or the penalties for failing to comply with such statutory minimums or regulations, could have an adverse effect on our business, liquidity and results of operations.
Our business may be subject to seasonal and quarterly fluctuations.
Historically, our revenues and operating results have varied from quarter to quarter and are expected to continue to fluctuate in the future. In addition, our operating results historically have been seasonally lower during the second and fourth fiscal quarters than during the other quarters of the fiscal year. We incur various costs in integrating or establishing newly acquired businesses or start-up operations, and the profitability of a new location is generally expected to be lower in the initial period of its operation than in subsequent periods. Start-up operations in particular lack the support of an existing customer base and require a significantly longer period to develop sales opportunities and meet targeted operating results.
These factors, among others, make it likely that in some future quarters our results of operations may be below the expectations of securities analysts and investors, which could have an adverse effect on the market price of our Common Stock.
Loss of our key management or other personnel could adversely impact our business.
Our success is largely dependent on the skills, experience and efforts of our senior management and certain other key personnel. If, for any reason, one or more senior executives or key personnel were not to remain active in our Company, our results of operations could be adversely affected. Our future success also depends upon our ability to attract and retain qualified managers and technical and marketing personnel, as well as sufficient numbers of hourly workers. There is competition in the market for the services of such qualified personnel and hourly workers and our failure to attract and retain such personnel or workers could adversely affect our results of operations.
We depend on third parties to supply us with raw materials and ship a large portion of our products, and our results of operations could be adversely affected if we are unable to obtain adequate raw materials and ship our products in a timely manner.
We manufactured approximately 65% of all garments which we placed in service during fiscal 2010. These were primarily work pants and shirts manufactured at our plants in Cardenas, Ebano and Valles, which are located in San Luis Potosi, Mexico. The balance of the garments used in our programs are purchased from a variety of industry suppliers. While we currently acquire the raw materials with which we produce our garments from a limited number of suppliers, we believe that such materials are readily available from other sources. To date, we have experienced no significant difficulty in obtaining any of our raw materials or supplies. However, if we were to experience difficulty obtaining any of our raw materials from such suppliers and were unable to obtain new materials or supplies from other industry suppliers, it could adversely affect our results of operations.
We utilize United Parcel Service and other common carriers to ship a large portion of our products. Strikes or other service interruptions affecting such carriers could impair our ability to deliver products on a timely and cost-effective basis. In addition, because we typically bear the cost of shipment to our customers, any increase in shipping rates could adversely affect our operating results.
Unexpected events could disrupt our operations and adversely affect our operating results.
Unexpected events, including, without limitation, fires at facilities, natural disasters, such as hurricanes and tornados, public health emergencies, war or terrorist activities, unplanned utility outages, supply disruptions, failure of equipment or systems or changes in laws and/or regulations impacting our business, could adversely affect our operating results. These events could result in disruption of customer service, physical damage to one or more key operating facilities, the temporary closure of one or more key operating facilities or the temporary disruption of information systems.
Changes in or new interpretations of the governmental regulatory framework may affect our contract terms and may reduce our sales or profits.
A portion of our total consolidated revenues is derived from business with U.S. federal, state and local governments and agencies. Changes or new interpretations in, or changes in the enforcement of, the statutory or regulatory framework applicable to services provided under governmental contracts or bidding procedures could result in fewer new contracts or contract renewals, modifications to the methods we apply to price government contracts or in contract terms of shorter duration than we have historically experienced, any of which could result in lower sales or profits than we have historically achieved, which could have an adverse effect on our results of operations.
The price of our Common Stock may be highly volatile, which could result in significant price declines.
The price of our Common Stock may experience significant volatility. Such volatility may be caused by fluctuations in our operating results, changes in earnings estimated by investment analysts, the number of shares of our Common Stock traded each day, the degree of success we achieve in implementing our business and growth strategies, changes in business or regulatory conditions affecting us, our customers or our competitors and other factors. In addition, the New York Stock Exchange historically has experienced extreme price and volume fluctuations that often have been unrelated to, or disproportionate to, the operating performance of its listed companies. These fluctuations, as well as general economic, political and market conditions, may adversely affect the market price of our Common Stock.
We are controlled by our principal shareholders, and our other shareholders may be unable to affect the outcome of shareholder voting.
As of October 15, 2010, the members of the Croatti family owned, directly or indirectly, in the aggregate approximately 616,502 shares of our Common Stock and approximately 4,913,369 shares of our Class B Common Stock, which represents approximately 25.8% of the aggregate number of outstanding shares of our Common Stock and Class B Common Stock, but approximately 75.8% of the combined voting power of the outstanding shares of our Common Stock and Class B Common Stock. As a result, the members of the Croatti family, acting with other family members, could effectively control most matters requiring approval by our shareholders, including the election of a majority of the directors. While historically the members of the Croatti family have individually voted their respective shares of Class B Common Stock in the same manner, there is no contractual understanding requiring this and there is no assurance that the family members will continue to individually vote their shares of Class B Common Stock in the same manner. This voting control by the members of the Croatti family, together with certain provisions of our by-laws and articles of organization, could have the effect of delaying, deferring or preventing a change in control of our Company that would otherwise be beneficial to our public shareholders.
ITEM 1B. UNRESOLVED STAFF COMMENTS
None.
ITEM 2. PROPERTIES
As of August 28, 2010, we owned or occupied approximately 230 facilities containing an aggregate of approximately 5.6 million square feet located in the United States, Canada, Mexico and Europe. We owned 120 of these facilities, containing approximately 4.6 million square feet. These facilities include our 320,000 square foot Owensboro, Kentucky distribution center and almost all of our industrial laundry processing plants. We believe our industrial laundry facilities are among the most modern in the industry.
We own substantially all of the machinery and equipment used in our operations. We believe that our facilities and our production, cleaning and decontamination equipment have been well maintained and are adequate for our present needs. We also own a fleet of approximately 2,800 delivery vans, trucks and other vehicles.
ITEM 3. LEGAL PROCEEDINGS
From time to time, we are subject to legal proceedings and claims arising from the current conduct of our business operations, including personal injury, customer contract, employment claims and environmental matters as described in our Consolidated Financial Statements. We maintain insurance coverage providing indemnification against the majority of such claims, and we do not expect that we will sustain any material loss as a result thereof.
In addition, we, like our competitors, are subject to various federal, state and local laws and regulations governing, among other things, the generation, handling, storage, transportation, treatment and disposal of hazardous wastes and other substances. In particular, industrial laundries currently use and must dispose of detergent waste water and other residues, and, in the past, used perchloroethylene and other dry cleaning solvents. Over the years, we have settled, or contributed to the settlement of, actions or claims brought against us relating to the disposal of hazardous materials and there can be no assurance that we will not have to expend material amounts to remediate the consequences of any such disposal in the future. Further, under environmental laws, an owner or lessee of real estate may be liable for the costs of removal or remediation of certain hazardous or toxic substances located on or in or emanating from such property, as well as related costs of investigation and property damage. Such laws often impose liability without regard to whether the owner or lessee knew of or was responsible for the presence of such hazardous or toxic substances. There can be no assurance that acquired or leased locations have been operated in compliance with environmental laws and regulations or that future uses or conditions will not result in the imposition of liability upon us under such laws or expose us to third-party actions such as tort suits. Refer to Note 11, “Commitments and Contingencies”, of these Consolidated Financial Statements for further discussion.
ITEM 4. (REMOVED AND RESERVED)
PART II
ITEM 5. MARKET FOR REGISTRANT’S COMMON EQUITY, RELATED STOCKHOLDER MATTERS AND ISSUER PURCHASES OF EQUITY SECURITIES
COMMON STOCK INFORMATION
Our Common Stock trades on the New York Stock Exchange under the symbol “UNF”, while our Class B Common Stock is not publicly traded. The following table sets forth, for the periods indicated, the high and low closing prices of our Common Stock on the New York Stock Exchange, and the dividends per share paid on our Common Stock and Class B Common Stock.
|
Price Per Share
|
Dividends Per Share
|
|||||||||||||||
|
High
|
Low
|
Common Stock
|
Class B
Common Stock
|
|||||||||||||
|
Year ended August 28, 2010
|
||||||||||||||||
|
First Quarter
|
$
|
46.55
|
$
|
38.88
|
$
|
0.0375
|
$
|
0.0300
|
||||||||
|
Second Quarter
|
54.47
|
43.95
|
0.0375
|
0.0300
|
||||||||||||
|
Third Quarter
|
55.74
|
44.25
|
0.0375
|
0.0300
|
||||||||||||
|
Fourth Quarter
|
45.92
|
38.56
|
0.0375
|
0.0300
|
||||||||||||
|
Price Per Share
|
Dividends Per Share
|
|||||||||||||||
|
High
|
Low
|
Common Stock
|
Class B
Common Stock
|
|||||||||||||
|
Year ended August 29, 2009
|
||||||||||||||||
|
First Quarter
|
$
|
47.39
|
$
|
25.60
|
$
|
0.0375
|
$
|
0.0300
|
||||||||
|
Second Quarter
|
30.55
|
23.96
|
0.0375
|
0.0300
|
||||||||||||
|
Third Quarter
|
38.37
|
20.24
|
0.0375
|
0.0300
|
||||||||||||
|
Fourth Quarter
|
42.79
|
34.30
|
0.0375
|
0.0300
|
||||||||||||
The approximate number of shareholders of record of our Common Stock and Class B Common Stock as of October 15, 2010 was 86 and 21, respectively. We believe that the number of beneficial owners of our Common Stock is substantially greater than the number of record holders because a large portion of our Common Stock is held of record in broker ‘‘street names.’’
We have paid regular quarterly dividends since 1983 and intend to continue such policy subject to, among other factors, our earnings, financial condition and capital requirements. No dividends will be payable unless declared by our Board of Directors and then only to the extent funds are legally available for the payment of such dividends. In the event that our Board of Directors votes to pay a dividend, our Common Stock must receive a dividend equal to no less than 125% of any dividend paid on the Class B Common Stock. On July 6, 2010, our Board of Directors declared a quarterly dividend of $0.0375 and $0.0300 per share on our Common Stock and Class B Common Stock, respectively, which was paid on October 1, 2010 to shareholders of record on September 10, 2010.
The following table sets forth information concerning our equity compensation plans as of August 28, 2010.
|
Equity Compensation Plan Information
|
|||||||||||
|
Plan category
|
Number of securities to be
issued upon exercise of
outstanding options,
warrants and rights
|
Weighted average
exercise price of
outstanding options,
warrants and rights
|
Number of securities
remaining available for
future issuance under
equity compensation plan
(excluding securities
referenced in column (a))
|
||||||||
|
(a)
|
|||||||||||
|
Equity compensation plans approved by security holders
|
447,300
|
$
|
35.49
|
816,275
|
|||||||
|
Equity compensation plans not approved by security holders
|
—
|
N/A
|
—
|
||||||||
|
Total
|
447,300
|
$
|
35.49
|
816,275
|
|||||||
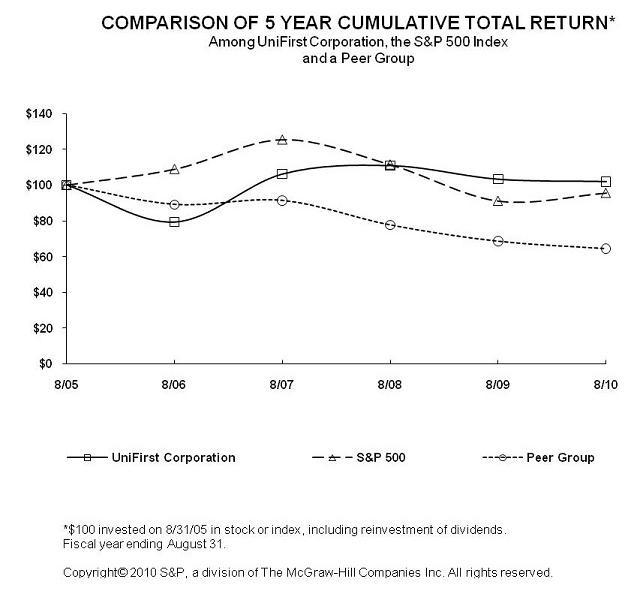
Stock Performance Graph
Set forth below is a line graph comparing the yearly percentage change in the cumulative total shareholder return on our Common Stock, based on the market price of our Common Stock, with the cumulative total shareholder return of a peer group and of companies within the Standard & Poor’s 500 Stock Index, in each case assuming reinvestment of dividends. The calculation of cumulative total shareholder return assumes a $100 investment in our Common Stock, the peer group and the S&P 500 Stock Index on August 31, 2005. The peer group is composed of Cintas Corporation and G & K Services, Inc.
ITEM 6. SELECTED FINANCIAL DATA
The following selected consolidated financial data should be read in conjunction with our Consolidated Financial Statements and Notes to Consolidated Financial Statements included in Item 8.
The selected consolidated balance sheet data set forth below as of August 28, 2010 and August 29, 2009 and the selected consolidated income statement data for the three years in the period ended August 28, 2010 are derived from our audited Consolidated Financial Statements included in this Annual Report on Form 10-K. All other selected consolidated financial data set forth below are derived from our audited financial statements not included in this Annual Report on Form 10-K. Current accounting guidance requires the income per share for each class of common stock to be calculated assuming 100% of our earnings are distributed as dividends to each class of common stock based on their respective dividend rights. Our Common Stock has a 25% dividend preference to our Class B Common Stock. The Class B Common Stock, which has ten votes per share as opposed to one vote per share for the Common Stock, is not freely transferable but may be converted at any time on a one-for-one basis into Common Stock at the option of the holder of the Class B Common Stock.
Five Year Financial Summary
UniFirst Corporation and Subsidiaries
|
Fiscal Year Ended August
(In thousands, except per share data)
|
2010
|
2009
|
2008
|
2007
|
2006
|
|||||||||||||
|
Selected Balance Sheet Data:
|
||||||||||||||||||
|
Total assets
|
$
|
1,092,295
|
$
|
1,002,099
|
$
|
981,667
|
$
|
874,464
|
$
|
829,702
|
||||||||
|
Long-term debt
|
$
|
181,464
|
$
|
182,015
|
$
|
235,539
|
$
|
206,049
|
$
|
210,535
|
||||||||
|
Shareholders' equity
|
$
|
708,050
|
$
|
627,035
|
$
|
556,770
|
$
|
497,327
|
$
|
452,545
|
||||||||
|
Selected Income Statement Data:
|
||||||||||||||||||
|
Revenues
|
$
|
1,025,939
|
$
|
1,013,416
|
$
|
1,023,175
|
$
|
902,102
|
$
|
820,972
|
||||||||
|
Depreciation and amortization
|
$
|
61,477
|
$
|
57,789
|
$
|
53,784
|
$
|
48,512
|
$
|
45,310
|
||||||||
|
Income from operations
|
$
|
130,272
|
$
|
134,036
|
$
|
108,638
|
$
|
84,152
|
$
|
73,403
|
||||||||
|
Other expense, net
|
$
|
7,420
|
$
|
7,571
|
$
|
9,939
|
$
|
10,690
|
$
|
9,146
|
||||||||
|
Provision for income taxes
|
$
|
46,444
|
$
|
50,613
|
$
|
37,721
|
$
|
28,267
|
$
|
25,049
|
||||||||
|
Net income
|
$
|
76,408
|
$
|
75,852
|
$
|
60,978
|
$
|
45,195
|
$
|
39,208
|
||||||||
|
Income per share:
|
||||||||||||||||||
|
Basic - Common stock
|
$
|
4.11
|
$
|
4.14
|
$
|
3.33
|
$
|
2.47
|
$
|
2.25
|
||||||||
|
Basic - Class B Common Stock
|
$
|
3.29
|
$
|
3.31
|
$
|
2.66
|
$
|
1.98
|
$
|
1.80
|
||||||||
|
Diluted - Common stock
|
$
|
3.90
|
$
|
3.92
|
$
|
3.15
|
$
|
2.34
|
$
|
2.03
|
||||||||
|
Dividends per share:
|
||||||||||||||||||
|
Common stock
|
$
|
0.15
|
$
|
0.15
|
$
|
0.15
|
$
|
0.15
|
$
|
0.15
|
||||||||
|
Class B Common Stock
|
$
|
0.12
|
$
|
0.12
|
$
|
0.12
|
$
|
0.12
|
$
|
0.12
|
||||||||
ITEM 7. MANAGEMENT’S DISCUSSION AND ANALYSIS OF FINANCIAL CONDITION AND RESULTS OF OPERATIONS
Business Overview
UniFirst Corporation, together with its subsidiaries, hereunder referred to as “we”, “our”, the “Company”, or “UniFirst”, is one of the largest providers of workplace uniforms and protective clothing in the United States. We design, manufacture, personalize, rent, clean, deliver, and sell a wide range of uniforms and protective clothing, including shirts, pants, jackets, coveralls, lab coats, smocks, aprons and specialized protective wear, such as flame resistant and high visibility garments. We also rent industrial wiping products, floor mats, facility service products and other non-garment items, and provide first aid cabinet services and other safety supplies, to a variety of manufacturers, retailers and service companies.
We serve businesses of all sizes in numerous industry categories. Typical customers include automobile service centers and dealers, delivery services, food and general merchandise retailers, food processors and service operations, light manufacturers, maintenance facilities, restaurants, service companies, soft and durable goods wholesalers, transportation companies, and others who require employee clothing for image, identification, protection or utility purposes. We also provide our customers with restroom supplies, including air fresheners, paper products and hand soaps.
At certain specialized facilities, we also decontaminate and clean work clothes that may have been exposed to radioactive materials and service special cleanroom protective wear. Typical customers for these specialized services include government agencies, research and development laboratories, high technology companies and utilities operating nuclear reactors.
We continue to expand into additional geographic markets through acquisitions and organic growth. We currently service over 225,000 customer locations in the United States, Canada and Europe from 205 customer service, distribution and manufacturing facilities.
US GAAP establishes standards for reporting information regarding operating segments in annual financial statements and requires selected information of those segments to be presented in interim financial reports issued to shareholders. Operating segments are identified as components of an enterprise for which separate discrete financial information is available for evaluation by the chief operating decision-maker, or decision-making group, in making decisions on how to allocate resources and assess performance. Our chief operating decision-maker is our chief executive officer. We have six operating segments based on the information reviewed by our chief executive officer: US Rental and Cleaning, Canadian Rental and Cleaning, Manufacturing (“MFG”), Specialty Garments Rental and Cleaning (“Specialty Garments”), First Aid and Corporate. The US Rental and Cleaning and Canadian Rental and Cleaning operating segments have been combined to form the US and Canadian Rental and Cleaning reporting segment. Refer to Note 15, “Segment Reporting”, of these Consolidated Financial Statements for our disclosure of segment information.
The US and Canadian Rental and Cleaning reporting segment purchases, rents, cleans, delivers and sells, uniforms and protective clothing and non-garment items in the United States and Canada. The operations of the US and Canadian Rental and Cleaning reporting segment are referred to by us as our ‘industrial laundry operations’ and we refer to the locations related to this reporting segment as our ‘industrial laundries’.
The MFG operating segment designs and manufactures uniforms and non-garment items primarily for the purpose of providing these goods to the US and Canadian Rental and Cleaning reporting segment. The amounts reflected as revenues of MFG are generated when goods are shipped from our manufacturing facilities to our other locations. These revenues are recorded at a transfer price which is typically in excess of the actual manufacturing cost. The transfer price is determined by our management and may not necessarily represent the fair value of the products manufactured. Products are carried in inventory and subsequently placed in service and amortized at this transfer price. On a consolidated basis, intercompany MFG revenues and MFG income are eliminated and the carrying value of inventories and rental merchandise in service is reduced to the manufacturing cost. Income before income taxes from MFG, net of the intercompany MFG elimination, offsets the merchandise amortization costs incurred by the US and Canadian Rental and Cleaning reporting segment as the merchandise costs of this reporting segment are amortized and recognized based on inventories purchased from MFG at the transfer price which is above our manufacturing cost.
The Corporate operating segment consists of costs associated with our distribution center, sales and marketing, information systems, engineering, materials management, manufacturing planning, finance, budgeting, human resources, other general and administrative costs and interest expense. The revenues generated from the Corporate operating segment represent certain direct sales made directly from our distribution center. The products sold by this operating segment are the same products rented and sold by the US and Canadian Rental and Cleaning reporting segment. In the segment disclosures in Note 15, “Segment Reporting”, of these Consolidated Financial Statements, no assets or capital expenditures are presented for the Corporate operating segment as no assets are allocated to this operating segment in the information reviewed by our chief executive officer. However, depreciation and amortization expense related to certain assets are reflected in income from operations and income before income taxes for the Corporate operating segment. The assets that give rise to this depreciation and amortization are included in the total assets of the US and Canadian Rental and Cleaning reporting segment as this is how they are tracked and reviewed by us.
We refer to our US and Canadian Rental and Cleaning, MFG, and Corporate segments combined as our ‘core laundry operations’.
The Specialty Garments operating segment purchases, rents, cleans, delivers and sells, specialty garments and non-garment items primarily for nuclear and cleanroom applications. The First Aid operating segment sells first aid cabinet services and other safety supplies.
Approximately 88% of our revenues in fiscal 2010 were derived from US and Canadian Rental and Cleaning, and Corporate. A key driver of this business is the number of workers employed by our customers. Our revenues are directly impacted by fluctuations in these employment levels. Revenues from Specialty Garments, which accounted for 9% of our 2010 revenues, increase during outages and refueling by nuclear power plants, as garment usage increases at these times. First Aid represented 3% of our total revenue in fiscal 2010.
Critical Accounting Policies and Estimates
We believe the following critical accounting policies reflect our more significant judgments and estimates used in the preparation of our Consolidated Financial Statements.
Use of Estimates
We prepare our financial statements in conformity with US GAAP, which requires management to make estimates and assumptions that affect the reported amounts in the financial statements and accompanying notes. These estimates are based on historical information, current trends, and information available from other sources. The actual results could differ from our estimates.
Foreign Currency Translation
The functional currency of our foreign operations is the local country’s currency. Transaction gains and losses, including gains and losses on our intercompany transactions, are included in other expense (income), in the accompanying Consolidated Statements of Income. Assets and liabilities of operations outside the United States are translated into U.S. dollars using period-end exchange rates. Revenues and expenses are translated at the average exchange rates in effect during each month of the fiscal year. The effects of foreign currency translation adjustments are included in shareholders’ equity as a component of accumulated other comprehensive income (loss) in the accompanying Consolidated Balance Sheets.
Revenue Recognition and Allowance for Doubtful Accounts
We recognize revenue from rental operations in the period in which the services are provided. Direct sale revenue is recognized in the period in which the services are performed or when the product is shipped. Our judgment and estimates are used in determining the collectability of accounts receivable and evaluating the adequacy of the allowance for doubtful accounts. We consider specific accounts receivable and historical bad debt experience, customer credit worthiness, current economic trends and the age of outstanding balances as part of our evaluation. Changes in our estimates are reflected in the period they become known. If the financial condition of our customers were to deteriorate, resulting in an impairment of their ability to make payments, additional allowances may be required. Material changes in our estimates may result in significant differences in the amount and timing of bad debt expense recognition for any given period. Our revenues do not include taxes we collect from our customers and remit to governmental authorities.
Inventories and Rental Merchandise in Service
Our inventories are stated at the lower of cost or market value, net of any reserve for excess and obsolete inventory. Judgments and estimates are used in determining the likelihood that new goods on hand can be sold to our customers or used in our rental operations. Historical inventory usage and current revenue trends are considered in estimating both excess and obsolete inventories. If actual product demand and market conditions are less favorable than the amount we projected, additional inventory write-downs may be required. We use the first-in, first-out (“FIFO”) method to value our inventories, which primarily consist of finished goods.
Rental merchandise in service is being amortized on a straight-line basis over the estimated service lives of the merchandise, which range from 6 to 36 months. In establishing estimated lives for merchandise in service, our management considers historical experience and the intended use of the merchandise. Material differences may result in the amount and timing of operating profit for any period if we make significant changes to our estimates.
Goodwill, Intangibles and Other Long-Lived Assets
In accordance with US GAAP, we do not amortize goodwill. Instead, current accounting guidance requires that companies test goodwill for impairment on an annual basis. In addition, US GAAP requires that companies test goodwill if events occur or circumstances change that would more likely than not reduce the fair value of a reporting unit to which goodwill is assigned below its carrying amount. Our evaluation considers changes in the operating environment, competitive information, market trends, operating performance and cash flow modeling.
We complete our annual impairment test in the fourth quarter of each fiscal year and there have been no impairments of goodwill or other intangible assets in fiscal 2010, 2009 or 2008.
In addition, during the fiscal quarter ended February 28, 2009, there was a decline in the market value of the Company’s stock as well as significant deterioration in general economic conditions. The decline in the Company’s market capitalization prompted the Company's management to conduct a goodwill analysis, in accordance with US GAAP, to determine if an impairment of goodwill existed. Based on the outcome of the Company’s analysis, it concluded that no impairment existed as of February 28, 2009.
We cannot predict future economic conditions or the future market value of our stock or their impact on the Company. A decline in our market capitalization and/or deterioration in general economic conditions could negatively and materially impact our assumptions and assessment of the fair value of our business. If general economic conditions or our financial performance deteriorate, we may be required to record a goodwill impairment charge in the future which could have a material impact on our financial condition and results of operations.
Property, plant and equipment, and definite-lived intangible assets are depreciated or amortized over their useful lives. Useful lives are based on our estimates of the period that the assets will generate revenue. Long-lived assets are evaluated for impairment whenever events or circumstances indicate an asset may be impaired. There were no impairments of property, plant and equipment, goodwill or definite-lived intangible assets in fiscal 2010, 2009 or 2008.
Insurance
We self-insure for certain obligations related to health, workers’ compensation, vehicles and general liability programs. We also purchase stop-loss insurance policies to protect ourselves from catastrophic losses. Judgments and estimates are used in determining the potential value associated with reported claims and for events that have occurred, but have not been reported. Our estimates consider historical claim experience and other factors. Our liabilities are based on our estimates, and, while we believe that our accruals are adequate, the ultimate liability may be significantly different from the amounts recorded. Changes in our claim experience, our ability to settle claims or other estimates and judgments we use could have a material impact on the amount and timing of expense for any given period.
Environmental and Other Contingencies
We are subject to legal proceedings and claims arising from the conduct of our business operations, including environmental matters, personal injury, customer contract matters and employment claims. Accounting principles generally accepted in the United States require that a liability for contingencies be recorded when it is probable that a liability has occurred and the amount of the liability can be reasonably estimated. Significant judgment is required to determine the existence of a liability, as well as the amount to be recorded. We regularly consult with our attorneys and outside consultants, in our consideration of the relevant facts and circumstances, before recording a contingent liability. We record accruals for environmental and other contingencies based on enacted laws, regulatory orders or decrees, our estimates of costs, insurance proceeds, participation by other parties, the timing of payments, and the input of our attorneys and outside consultants.
The estimated liability for environmental contingencies has been discounted using risk-free interest rates ranging from 3.5% to 4.2% over periods ranging from ten to thirty years. The estimated current costs, net of legal settlements with insurance carriers, have been adjusted for the estimated impact of inflation at 3% per year. Changes in enacted laws, regulatory orders or decrees, our estimates of costs, risk-free interest rates, insurance proceeds, participation by other parties, the timing of payments and the input of our attorneys and outside consultants based on changing legal or factual circumstances could have a material impact on the amounts recorded for our environmental and other contingent liabilities. Refer to Note 11, “Commitments and Contingencies”, of these Consolidated Financial Statements for additional discussion and analysis.
Asset Retirement Obligations
Under US GAAP, asset retirement obligations generally apply to legal obligations associated with the retirement of long-lived assets that result from the acquisition, construction, development and/or the normal operation of a long-lived asset. Current accounting guidance requires that we recognize asset retirement obligations in the period in which they are incurred if a reasonable estimate of fair value can be made. The associated asset retirement costs are capitalized as part of the carrying amount of the long-lived asset.
We have recognized as a liability the present value of the estimated future costs to decommission our nuclear laundry facilities in accordance with US GAAP. We depreciate, on a straight-line basis, the amount added to property, plant and equipment and recognize accretion expense in connection with the discounted liability over the various remaining lives which range from approximately one to thirty-four years.
Our estimated liability has been based on historical experience in decommissioning nuclear laundry facilities, estimated useful lives of the underlying assets, external vendor estimates as to the cost to decommission these assets in the future, and federal and state regulatory requirements. The estimated current costs have been adjusted for the estimated impact of inflation at 3% per year. The liability has been discounted using credit-adjusted risk-free rates that range from approximately 5.7% to 7.5%. Revisions to the liability could occur due to changes in the estimated useful lives of the underlying assets, estimated dates of decommissioning, changes in decommissioning costs, changes in federal or state regulatory guidance on the decommissioning of such facilities, or other changes in estimates. Changes due to revisions in our estimates will be recognized by adjusting the carrying amount of the liability and the related long-lived asset if the assets are still in service, or charged to expense in the period if the assets are no longer in service.
Derivative Financial Instruments
US GAAP requires that all our derivative instruments be recorded as other assets or other liabilities at fair value. All subsequent changes in a derivative’s fair value are recognized in income, unless specific hedge accounting criteria are met. Cash flows associated with derivatives are classified in the same category as the cash flows hedged in our Consolidated Statements of Cash Flows.
Derivative instruments that qualify for hedge accounting are classified as a hedge of the variability of cash flows to be paid related to a recognized liability or a forecasted transaction. Changes in the fair value of a derivative that is highly effective and designated as a cash flow hedge are recognized in accumulated other comprehensive income (loss) until expense from the cash flows of the hedged items are recognized. We perform an assessment at the inception of the hedge and on a quarterly basis thereafter, to determine whether our derivatives are highly effective in offsetting changes in the value of the hedged items. Any changes in the fair value resulting from hedge ineffectiveness, is immediately recognized as income or expense.
Our hedging activities are transacted only with highly rated institutions, which reduces our exposure to credit risk in the event of nonperformance.
Supplemental Executive Retirement Plan and other Pension Plans
We recognize pension expense on an accrual basis over our employees’ estimated service periods. Pension expense is generally independent of funding decisions or requirements.
The calculation of pension expense and the corresponding liability requires us to use a number of critical assumptions, including the expected long-term rate of return on plan assets and the assumed discount rate. Changes in our assumptions can result in different expense and liability amounts, and future actual experience can differ from these assumptions. Pension expense increases as the expected rate of return on pension plan assets decreases. Future changes in plan asset returns, assumed discount rates and various other factors related to the participants in our pension plans will impact our future pension expense and liabilities. We cannot predict with certainty what these factors will be in the future.
Income Taxes
We compute income tax expense by jurisdiction based on our operations in each jurisdiction. Deferred income taxes are provided for temporary differences between the amounts recognized for income tax and financial reporting purposes at currently enacted tax rates.
We are periodically reviewed by U.S. domestic and foreign tax authorities regarding the amount of taxes due. These reviews typically include inquiries regarding the timing and amount of deductions and the allocation of income among various tax jurisdictions. In evaluating our exposure associated with various filing positions, we have recorded estimated reserves. Refer to Note 4, “Income Taxes”, of these Consolidated Financial Statements for further discussion regarding our accounting for income taxes and uncertain tax positions for financial accounting purposes.
Results of Operations
The following table presents, as a percent of total revenue, certain selected financial data for our three fiscal years ended August 28, 2010, August 29, 2009 and August 30, 2008. Cost of revenues presented in the table below include merchandise costs related to the amortization of rental merchandise in service and direct sales as well as labor and other production, service and delivery costs associated with operating our industrial laundries, Specialty Garments facilities, First Aid locations and our distribution center. Selling and administrative costs include costs related to our sales and marketing functions as well as general and administrative costs associated with our corporate offices and operating locations including information systems, engineering, materials management, manufacturing planning, finance, budgeting, and human resources.
|
% Change
|
||||||||||||||||||||||||||||
|
(In thousands, except for percentages)
|
FY 2010
|
% of
Revenues
|
FY 2009
|
% of
Revenues
|
FY 2008
|
% of
Revenues
|
FY 2010
vs.
FY 2009
|
FY 2009
vs.
FY 2008
|
||||||||||||||||||||
|
Revenues
|
$
|
1,025,939
|
100.0
|
%
|
$
|
1,013,416
|
100.0
|
%
|
$
|
1,023,175
|
100.0
|
%
|
1.2
|
%
|
-1.0
|
%
|
||||||||||||
|
Costs and expenses:
|
||||||||||||||||||||||||||||
|
Cost of revenue (1)
|
620,727
|
60.5
|
609,629
|
60.2
|
643,886
|
62.9
|
1.8
|
-5.3
|
||||||||||||||||||||
|
Selling and administrative expenses (1)
|
213,463
|
20.8
|
211,962
|
20.9
|
216,867
|
21.2
|
0.7
|
-2.3
|
||||||||||||||||||||
|
Depreciation and amortization
|
61,477
|
6.0
|
57,789
|
5.7
|
53,784
|
5.3
|
6.4
|
7.4
|
||||||||||||||||||||
|
895,667
|
87.3
|
879,380
|
86.8
|
914,537
|
89.4
|
1.9
|
-3.8
|
|||||||||||||||||||||
|
Income from operations
|
130,272
|
12.7
|
134,036
|
13.2
|
108,638
|
10.6
|
-2.8
|
23.4
|
||||||||||||||||||||
|
Other expense (income)
|
7,420
|
0.7
|
7,571
|
0.7
|
9,939
|
1.0
|
-2.0
|
-23.8
|
||||||||||||||||||||
|
Income before income taxes
|
122,852
|
12.0
|
126,465
|
12.5
|
98,699
|
9.6
|
-2.9
|
28.1
|
||||||||||||||||||||
|
Provision for income taxes
|
46,444
|
4.5
|
50,613
|
5.0
|
37,721
|
3.7
|
-8.2
|
34.2
|
||||||||||||||||||||
|
Net income
|
$
|
76,408
|
7.4
|
%
|
$
|
75,852
|
7.5
|
%
|
$
|
60,978
|
6.0
|
%
|
0.7
|
%
|
24.4
|
%
|
||||||||||||
(1) Exclusive of depreciation on our property, plant and equipment and amortization of our intangible assets.
Revenues and income (loss) from operations by reporting segment for the three fiscal years ended August 28, 2010, August 29, 2009, and August 30, 2008, are presented in the following table. Refer to Note 15, “Segment Reporting”, of these Consolidated Financial Statements for discussion of our reporting segments.
|
Fiscal year ended August
|
|||||||||||||
|
(In thousands)
|
2010
|
2009
|
2008
|
||||||||||
|
Segment Information
|
|||||||||||||
|
Revenues
|
|||||||||||||
|
US and Canadian Rental and Cleaning
|
$
|
899,791
|
$
|
904,902
|
$
|
911,044
|
|||||||
|
MFG
|
99,256
|
86,139
|
91,834
|
||||||||||
|
Net intercompany MFG elimination
|
(99,256
|
)
|
(86,139
|
)
|
(91,834
|
)
|
|||||||
|
Corporate
|
8,074
|
7,759
|
8,942
|
||||||||||
|
Subtotal: Core Laundry Operations
|
907,865
|
912,661
|
919,986
|
||||||||||
|
Specialty Garments
|
88,001
|
72,340
|
71,637
|
||||||||||
|
First Aid
|
30,073
|
28,415
|
31,552
|
||||||||||
|
Total consolidated revenues
|
$
|
1,025,939
|
$
|
1,013,416
|
$
|
1,023,175
|
|||||||
|
Income (loss) from operations
|
|||||||||||||
|
US and Canadian Rental and Cleaning
|
$
|
149,464
|
$
|
158,198
|
$
|
137,341
|
|||||||
|
MFG
|
35,970
|
27,828
|
32,067
|
||||||||||
|
Net intercompany MFG elimination
|
(5,982
|
)
|
(420
|
)
|
(2,632
|
)
|
|||||||
|
Corporate
|
(65,106
|
)
|
(60,213
|
)
|
(63,229
|
)
|
|||||||
|
Subtotal: Core Laundry Operations
|
114,346
|
125,393
|
103,547
|
||||||||||
|
Specialty Garments
|
13,891
|
7,360
|
4,204
|
||||||||||
|
First Aid
|
2,035
|
1,283
|
887
|
||||||||||
|
Total income from operations
|
$
|
130,272
|
$
|
134,036
|
$
|
108,638
|
|||||||
The current worldwide economic weakness may negatively impact our revenues and operating performance into fiscal 2011 due to the impact on spending plans and employment levels of our customers and sales prospects. Throughout fiscal 2010, U.S. unemployment rates remained high, which impacted our broad customer base. Lost accounts continue to be significant as our customers are impacted by challenging economic and business conditions.
General
We derive our revenues through the design, manufacture, personalization, rental, cleaning, delivering, and selling of a wide range of uniforms and protective clothing, including shirts, pants, jackets, coveralls, lab coats, smocks and aprons and specialized protective wear, such as flame resistant and high visibility garments. We also rent industrial wiping products, floor mats, facility service products, other non-garment items, and provide first aid cabinet services and other safety supplies, to a variety of manufacturers, retailers and service companies. We have five reporting segments, US and Canadian Rental and Cleaning, Manufacturing (“MFG”), Corporate, Specialty Garments Rental and Cleaning (“Specialty Garments”), and First Aid. We refer to the US and Canadian Rental and Cleaning, MFG, and Corporate reporting segments combined as our “core laundry operations.”
Cost of revenues include merchandise costs related to the amortization of rental merchandise in service and direct sales as well as labor and other production, service and delivery costs, and distribution costs associated with operating our core laundry operations, Specialty Garments facilities, and First Aid locations. Selling and administrative costs include costs related to our sales and marketing functions as well as general and administrative costs associated with our corporate offices and operating locations including information systems, engineering, materials management, manufacturing planning, finance, budgeting, and human resources.
Fiscal Year Ended August 28, 2010 Compared with Fiscal Year Ended August 29, 2009
Revenues
|
August 28,
|
August 29,
|
Dollar
|
Percent
|
|||||||||||||
|
2010
|
2009
|
Change
|
Change
|
|||||||||||||
|
(In thousands, except percentages)
|
||||||||||||||||
|
Core Laundry Operations
|
$
|
907,865
|
$
|
912,661
|
$
|
(4,796
|
)
|
-0.5
|
%
|
|||||||
|
Specialty Garments
|
88,001
|
72,340
|
15,661
|
21.6
|
||||||||||||
|
First Aid
|
30,073
|
28,415
|
1,658
|
5.8
|
||||||||||||
|
Total consolidated revenues
|
$
|
1,025,939
|
$
|
1,013,416
|
$
|
12,523
|
1.2
|
%
|
||||||||
In fiscal 2010, our consolidated revenues increased by $12.5 million from the comparable period in 2009, or 1.2%. The consolidated increase was primarily driven by a $15.7 million increase in the Specialty Garments segment, which was partially offset by a $4.8 million decline in our core laundry operations. Specialty Garments revenues increased from $72.3 million in fiscal 2009 to $88.0 million in fiscal 2010, or 21.6%. The increase in Specialty Garment’s revenues was primarily the result of higher than expected revenues from certain U.S. and Canadian reactor projects, as well as continued growth in our Canadian customers and our cleanroom operations.
Core laundry operations’ revenues decreased by 0.5% to $907.9 million in fiscal 2010 from $912.7 million in fiscal 2009. This decrease was due to negative organic growth of 2.5%. Organic growth is comprised of new sales, additions to our existing customer base and price increases offset by lost accounts and reductions to our existing customer base. The negative organic growth rate in fiscal 2010 was primarily due to the high rate of wearer reductions that we experienced in our existing customer base throughout fiscal 2009. Throughout fiscal 2010, the challenging worldwide economic conditions resulted in continuing domestic layoffs in the United States, which were reflected in the reduction of wearers throughout our broad customer base. Our negative organic growth in core laundry operations was partially offset by acquisition-related growth of 1.1% and the effect of favorable fluctuations in the Canadian foreign exchange rate, which accounted for a 0.9% increase in revenue.
Cost of Revenues
Cost of revenues increased as a percentage of revenues from 60.2%, or $609.6 million, to 60.5%, or $620.7 million, for fiscal 2009 and fiscal 2010, respectively. This increase was primarily the result of an increase in production costs as a percentage of revenues, as well as higher payroll-related costs, including healthcare costs, worker’s compensation, auto liability claims and unemployment insurance. In addition, overall energy costs were higher as a percentage of revenues as a result of higher fuel costs associated with operating our fleet of delivery trucks. Partially offsetting these higher costs were lower bad debt expense and lower overall costs as a percentage of revenues for our Specialty Garments segment.
Selling and administrative expense
Our selling and administrative expenses decreased as a percentage of revenues from 20.9%, or $212.0 million, to 20.8%, or $213.5 million, for fiscal 2009 and fiscal 2010, respectively. This decrease was primarily due to charges we recorded to our environmental reserves in fiscal 2009 which totaled $6.2 million compared to $1.0 million we recorded in fiscal 2010. The favorable comparison was partially offset by higher payroll and payroll related costs, including $2.0 million of stock compensation expense related to a grant of restricted stock to our Chief Executive Officer in fiscal 2010. In addition, we incurred an increase in costs during fiscal 2010 associated with certain legal contingencies.
Depreciation and amortization
Depreciation and amortization expense increased $3.7 million, from $57.8 million in fiscal 2009 to $61.5 million in fiscal 2010. The increase in depreciation and amortization expense was due to capital expenditure and acquisition activity.
Income from operations
For the year ended August 28, 2010, the changes in revenues in our core laundry operations, Specialty Garments and First Aid segments, as well as the changes in our costs discussed above, resulted in the following changes in our income from operations:
|
August 28,
|
August 29,
|
Dollar
|
Percent
|
|||||||||||||
|
2010
|
2009
|
Change
|
Change
|
|||||||||||||
|
(In thousands, except percentages)
|
||||||||||||||||
|
Core Laundry Operations
|
$
|
114,346
|
$
|
125,393
|
$
|
(11,047
|
)
|
-8.8
|
%
|
|||||||
|
Specialty Garments
|
13,891
|
7,360
|
6,531
|
88.7
|
||||||||||||
|
First Aid
|
2,035
|
1,283
|
752
|
58.7
|
||||||||||||
|
Total consolidated income from operations
|
$
|
130,272
|
$
|
134,036
|
$
|
(3,764
|
)
|
-2.8
|
%
|
|||||||
|
Percentage of total revenues
|
12.7
|
%
|
13.2
|
%
|
||||||||||||
Other expense (income)
Other expense (income), which includes interest expense, interest income and foreign currency exchange loss, decreased by $0.2 million to $7.4 million in fiscal 2010 compared to $7.6 million in fiscal 2009. Net interest expense decreased from $7.3 million in fiscal 2009 to $6.7 million in fiscal 2010 due to lower debt outstanding during fiscal 2010. Our average debt outstanding decreased to $181.7 million during fiscal 2010 from $208.8 million during fiscal 2009. This was partially offset by an increase in foreign exchange losses from $0.3 million in fiscal 2009 to $0.7 million in fiscal 2010.
Provision for income taxes
Our effective tax rate was 37.8% for fiscal 2010 compared to 40.0% for fiscal 2009. This change was primarily due to decreases in our reserves for income tax exposures as well as lower U.S. state income taxes compared to prior year.
Fiscal Year Ended August 29, 2009 Compared with Fiscal Year Ended August 30, 2008
Revenues
|
August 29,
|
August 30,
|
Dollar
|
Percent
|
|||||||||||||
|
2009
|
2008
|
Change
|
Change
|
|||||||||||||
|
(In thousands, except percentages)
|
||||||||||||||||
|
Core Laundry Operations
|
$
|
912,661
|
$
|
919,986
|
$
|
(7,325
|
)
|
-0.8
|
%
|
|||||||
|
Specialty Garments
|
72,340
|
71,637
|
703
|
1.0
|
||||||||||||
|
First Aid
|
28,415
|
31,552
|
(3,137
|
)
|
-9.9
|
|||||||||||
|
Total consolidated revenues
|
$
|
1,013,416
|
$
|
1,023,175
|
$
|
(9,759
|
)
|
-1.0
|
%
|
|||||||
In fiscal 2009, our consolidated revenues decreased by $9.8 million from the comparable period in 2008, or 1.0%. The consolidated decrease was primarily driven by a $7.3 million decrease in revenues from our core laundry operations. Core laundry operations’ revenues decreased from $920.0 million in fiscal 2008 to $912.7 million in fiscal 2009, or 0.8%. This decrease was primarily due to the effect of an extra week in fiscal 2008 compared to 2009, which accounted for a 1.9% decrease in revenues. Unfavorable fluctuations in the Canadian foreign exchange rate also accounted for a 1.3% decrease in revenue. These decreases were offset by organic growth of 1.3% and acquisition-related growth of 1.1%. Organic growth is comprised of new sales, additions to our existing customer base and price increases offset by lost accounts and reductions to our existing customer base. The decrease in our organic growth rate from 7.2% in fiscal 2008 to 1.3% in fiscal 2009 is primarily due to the high rate of wearer reductions in our existing customer base. Throughout fiscal 2009, the deteriorating worldwide economic conditions resulted in increased domestic layoffs, which were reflected in the reduction of wearers throughout our broad customer base. Lost accounts also increased over the prior year as we saw a larger number of accounts either go out of business or in financial distress.
Specialty Garments revenues increased from $71.6 million in fiscal 2008 to $72.3 million in fiscal 2009, or 1.0%. This increase was primarily due to growth in our Canadian customers and our cleanroom operations. Revenues for the First Aid segment decreased 9.9%, from $31.6 million in fiscal 2008 to $28.4 million in fiscal 2009. This segment of our business was particularly impacted by the declining economic conditions in fiscal 2009.
Operating costs
Operating costs decreased as a percentage of revenues from 62.9%, or $643.9 million, to 60.2%, or $609.6 million, for fiscal 2008 and fiscal 2009, respectively. This decrease was primarily driven by lower merchandise costs in our core laundry operations as well as lower fuel costs associated with operating our fleet of delivery trucks and lower natural gas costs for our industrial laundries. As a result of headcount reductions during fiscal 2009, there was a decrease in payroll costs. These benefits were partially offset by higher healthcare and other payroll-related costs as a percentage of revenues.
Specialty Garments operating costs decreased from prior year primarily due to lower merchandise amortization as well as improved direct sale margins. In addition, the segment benefitted from lower production payroll-related costs as a percent of revenues.
Selling and administrative expense
Our selling and administrative expenses decreased as a percentage of revenues from 21.2%, or $216.9 million, to 20.9%, or $212.0 million, for fiscal 2008 and fiscal 2009, respectively. This decrease was primarily due to a decrease in payroll costs, as a result of headcount reductions in fiscal 2009, as well as lower workers’ compensation costs. We also benefitted from reduced travel and other administrative costs as we continued to focus on controlling our expenses. These benefits were partially offset by higher healthcare and other payroll-related costs as a percentage of revenues. We also recorded charges to our environmental reserves totaling $6.2 million in fiscal 2009 compared to adjustments totaling only $2.5 million in fiscal year 2008.
Depreciation and amortization
Depreciation and amortization expense increased $4.0 million, from $53.8 million in fiscal 2008 to $57.8 million in fiscal 2009. The increase in depreciation and amortization expense was due to capital expenditure and acquisition activity.
Income from operations
For the year ended August 29, 2009, the changes in our core laundry operations’, Specialty Garments and First Aid segment’s revenues, as well as the changes in our costs discussed above, resulted in the following changes in our income from operations:
|
August 29,
|
August 30,
|
Dollar
|
Percent
|
|||||||||||||
|
2009
|
2008
|
Change
|
Change
|
|||||||||||||
|
(In thousands, except percentages)
|
||||||||||||||||
|
Core Laundry Operations
|
$
|
125,393
|
$
|
103,547
|
$
|
21,846
|
21.1
|
%
|
||||||||
|
Specialty Garments
|
7,360
|
4,204
|
3,156
|
75.1
|
||||||||||||
|
First Aid
|
1,283
|
887
|
396
|
44.5
|
||||||||||||
|
Total consolidated income from operations
|
$
|
134,036
|
$
|
108,638
|
$
|
25,398
|
23.4
|
%
|
||||||||
|
Percentage of total revenues
|
13.2
|
%
|
10.6
|
%
|
||||||||||||
Other expense (income)
Other expense (income), which includes interest expense, interest income and foreign currency exchange (gain) loss, decreased by $2.3 million to $7.6 million in fiscal 2009 compared to $9.9 million in fiscal 2008. Net interest expense decreased due to lower debt outstanding during fiscal 2009 as well as lower interest rates affecting our variable interest borrowings. Our average debt outstanding decreased from $220.8 million during fiscal 2008 to $208.8 million during fiscal 2009.
Provision for income taxes
Our effective income tax rate was 40.0% for fiscal 2009 and 38.2% for fiscal 2008. The increase was primarily due to changes in the Company’s reserves for income tax exposures as well as an increase in U.S state income taxes compared to the prior year.
Liquidity and Capital Resources
General
For the fiscal year ended August 28, 2010, we had a net increase in cash and cash equivalents of $61.1 million. As of August 28, 2010, we had cash and cash equivalents of $121.3 million and working capital of $167.1 million. We believe that current cash and cash equivalent balances, cash generated from operations and amounts available under our Credit Agreement (defined below) will be sufficient to meet our currently anticipated working capital and capital expenditure requirements for at least the next 12 months.
Sources and uses of cash
During the fiscal year ended August 28, 2010, we generated cash from operating activities of $134.0 million resulting primarily from net income of $76.4 million, net of non-cash amounts charged for depreciation, amortization and accretion of $63.1 million and stock based compensation of $3.7 million. We also generated cash as a result of increases in accounts payable and accruals of $14.0 million. These inflows were partially offset by increases in rental merchandise in-service of $11.5 million, accounts receivable of $6.3 million, inventories of $4.3 million and decreases in accrued and deferred income taxes of $1.0 million. We used cash to, among other things, invest $50.0 million in capital expenditures and fund the acquisition of businesses in the amount of approximately $20.9 million.
Long-term debt and borrowing capacity
We have a $225.0 million unsecured revolving credit agreement (“Credit Agreement”) with a syndicate of banks, which matures on September 13, 2011. Under the Credit Agreement, we can borrow funds at variable interest rates based on the Eurodollar rate or the bank’s prime rate, as selected by us. Availability of credit requires our compliance with certain financial and other covenants, including a maximum funded debt ratio and minimum interest coverage as defined in the Credit Agreement. We test our compliance with these financial covenants on a fiscal quarterly basis. At August 28, 2010, the interest rates applicable to any of the Company’s borrowings under the Credit Agreement would be calculated as LIBOR plus 50 basis points at the time of the respective borrowing. As of August 28, 2010, under the Credit Agreement we had no outstanding borrowings and outstanding letters of credit of $35.9 million, which leaves $189.1 million available for borrowing as of that date.
On June 14, 2004, we issued $165.0 million of fixed and floating rate notes pursuant to a Note Purchase Agreement (“Note Agreement”). Under the Note Agreement, we issued $75.0 million of notes with a seven year term (June 2011) bearing interest at 5.27% (“Fixed Rate Notes”). We also issued $90.0 million of floating rate notes which were repaid in September 2005 and September 2006.
On September 14, 2006, we issued $100.0 million of floating rates notes (“2006 Floating Rate Notes”) pursuant to a Note Purchase Agreement (“2006 Note Agreement”). The 2006 Floating Rate Notes mature on September 14, 2013, bear interest at LIBOR plus 50 basis points and may be repaid at face value two years from the date of issuance. The proceeds from the issuance of the 2006 Floating Rate Notes were used to first repay the $75.0 million of outstanding Floating Rate Notes and then to pay down outstanding amounts under the Credit Agreement.
As of August 28, 2010, we were in compliance with all the covenants under the Credit Agreement, the Note Agreement and the 2006 Note Agreement.
Our Credit Agreement expires and our Fixed Rate Notes mature in 2011. We are currently in the process of evaluating refinancing alternatives. We believe that we will be able to enter into a new revolving credit facility agreement on terms satisfactory to us and that the repayment or refinancing of the Fixed Rate Notes will not adversely affect our financial condition. If we choose not to refinance, we would utilize our current cash reserves to satisfy this debt obligation. We believe that utilizing our cash in this manner should not negatively impact our liquidity or operations.
In January 2008, we entered into an interest rate swap agreement to manage our exposure to interest rate movements and the related effect on our variable rate debt. The swap agreement, with a notional amount of $100.0 million, matures on March 14, 2011. We pay a fixed rate of 3.51% and receive a variable rate tied to the three month LIBOR rate. We have accounted for this instrument as a cash flow hedge and, as a result, have recorded all changes in the fair value of the swap agreement in accumulated other comprehensive income, a component of shareholders’ equity. For additional information on the interest rate swap, see Note 6, “Derivative Instruments and Hedging Activities”, of these Consolidated Financial Statements.
Environmental and Legal Contingencies
We are subject to various federal, state and local laws and regulations governing, among other things, the generation, handling, storage, transportation, treatment and disposal of hazardous wastes and other substances. In particular, industrial laundries currently use and must dispose of detergent waste water and other residues, and, in the past, used perchloroethylene and other dry cleaning solvents. We are attentive to the environmental concerns surrounding the disposal of these materials and have, through the years, taken measures to avoid their improper disposal. Over the years, we have settled, or contributed to the settlement of, actions or claims brought against us relating to the disposal of hazardous materials and there can be no assurance that we will not have to expend material amounts to remediate the consequences of any such disposal in the future.
US GAAP requires that a liability for contingencies be recorded when it is probable that a liability has occurred and the amount of the liability can be reasonably estimated. Significant judgment is required to determine the existence of a liability, as well as the amount to be recorded. We regularly consult with attorneys and outside consultants in our consideration of the relevant facts and circumstances before recording a contingent liability. Changes in enacted laws, regulatory orders or decrees, management’s estimates of costs, insurance proceeds, participation by other parties, the timing of payments and the input of outside consultants and attorneys based on changing legal or factual circumstances could have a material impact on the amounts recorded for environmental and other contingent liabilities.
Under environmental laws, an owner or lessee of real estate may be liable for the costs of removal or remediation of certain hazardous or toxic substances located on, or in, or emanating from such property, as well as related costs of investigation and property damage. Such laws often impose liability without regard to whether the owner or lessee knew of, or was responsible for, the presence of such hazardous or toxic substances. There can be no assurances that acquired or leased locations have been operated in compliance with environmental laws and regulations or that future uses or conditions will not result in the imposition of liability upon our Company under such laws or expose our Company to third party actions such as tort suits. We continue to address environmental conditions under terms of consent orders negotiated with the applicable environmental authorities or otherwise with respect to sites located in or related to Woburn, Massachusetts, Somerville, Massachusetts, Springfield, Massachusetts, Uvalde, Texas, Stockton, California, three sites in Williamstown, Vermont, as well as a number of additional locations that we acquired as part of our acquisition of Textilease Corporation in September 2003. In addition, we recently received notice from the Maryland Department of Environment directing us to investigate potential contamination at our Landover, Maryland facility.
We have accrued certain costs related to the sites described above as it has been determined that the costs are probable and can be reasonably estimated. We continue to implement mitigation measures and to monitor environmental conditions at the Somerville, Massachusetts site. We also have potential exposure related to an additional parcel of land (the “Central Area”) related to the Woburn, Massachusetts site discussed above. Currently, the consent decree for the Woburn site does not define or require any remediation work in the Central Area. The United States Environmental Protection Agency (the “EPA”) has provided us and other signatories to the consent decree with comments on the design and implementation of groundwater and soil remedies at the Woburn site and investigation of environmental conditions in the Central Area. We met with EPA to discuss its comments, and we and another signatory to the consent decree subsequently submitted work plans to perform additional environmental investigations. Such work pursuant to these work plans has been initiated. We have accrued costs to perform certain work responsive to EPA's comments.
We routinely review and evaluate sites that may require remediation and monitoring and determine our estimated costs based on various estimates and assumptions. These estimates are developed using our internal sources or by third-party environmental engineers or other service providers. Internally developed estimates are based on:
|
•
|
Management’s judgment and experience in remediating and monitoring our sites;
|
||
|
•
|
Information available from regulatory agencies as to costs of remediation and monitoring;
|
||
|
•
|
The number, financial resources and relative degree of responsibility of other potentially responsible parties (PRPs) who may be liable for remediation and monitoring of a specific site; and
|
||
|
•
|
The typical allocation of costs among PRPs.
|
||
There is usually a range of reasonable estimates of the costs associated with each site. We generally use the amount within the range that constitutes our best estimate. When we believe that both the amount of a particular liability and the timing of the payments are reliably determinable, we adjust the cost in current dollars using a rate of 3% for inflation until the time of expected payment and discount the cost to present value using the current risk-free interest rates. As of August 28, 2010 the risk-free interest rates utilized by the Company ranged from 3.5% to 4.2%.
For environmental liabilities that have been discounted, we include interest accretion, based on the effective interest method, in cost of revenues on the Consolidated Statements of Income. The changes to the amounts of our environmental liabilities for the years ended August 28, 2010 and August 29, 2009 are as follows (in thousands):
|
Year ended
|
August 28,
2010
|
August 29,
2009
|
||||||
|
Beginning balance
|
$ | 19,384 | $ | 15,097 | ||||
|
Costs incurred for which reserves have been provided
|
(2,392 | ) | (2,755 | ) | ||||
|
Insurance proceeds received
|
216 | 168 | ||||||
|
Interest accretion
|
794 | 668 | ||||||
|
Changes in discount rates
|
865 | 153 | ||||||
|
Revisions in estimates
|
119 | 6,053 | ||||||
|
Ending balance
|
$ | 18,986 | $ | 19,384 | ||||
In fiscal 2010 and 2009, we made revisions in estimates related to our environmental reserves totaling $0.1 million and $6.1 million, respectively. The increase in fiscal 2009 was primarily due to ongoing investigation and remediation efforts at two of our environmental exposure sites.
Anticipated payments and insurance proceeds of currently identified environmental remediation liabilities as of August 28, 2010 for the next five fiscal years and thereafter as measured in current dollars are reflected below.
|
(In thousands)
|
2011
|
2012
|
2013
|
2014
|
2015
|
Thereafter
|
Total
|
|||||||||||||||||||||
|
Estimated costs – current dollars
|
$ | 4,046 | $ | 3,061 | $ | 1,806 | $ | 934 | $ | 804 | $ | 13,002 | $ | 23,653 | ||||||||||||||
|
Estimated insurance proceeds
|
(158 | ) | (180 | ) | (150 | ) | (180 | ) | (150 | ) | (2,047 | ) | (2,865 | ) | ||||||||||||||
|
Net anticipated costs
|
$ | 3,888 | $ | 2,881 | $ | 1,656 | $ | 754 | $ | 654 | $ | 10,955 | $ | 20,788 | ||||||||||||||
|
Effect of inflation
|
7,303 | |||||||||||||||||||||||||||
|
Effect of discounting
|
(9,105 | ) | ||||||||||||||||||||||||||
|
Balance as of August 28, 2010
|
$ | 18,986 | ||||||||||||||||||||||||||
Estimated insurance proceeds are primarily received from an annuity received as part of our legal settlement with an insurance company. Annual proceeds of approximately $0.3 million are deposited into an escrow account which funds remediation and monitoring costs for three sites related to our former operations in Williamstown, Vermont. Annual proceeds received but not expended in the current year accumulate in this account and may be used in future years for costs related to this site through the year 2027. As of August 28, 2010, the balance in this escrow account, which is held in a trust and is not recorded in our Consolidated Balance Sheet, was approximately $3.0 million. Also included in estimated insurance proceeds are amounts we are entitled to receive pursuant to legal settlements as reimbursements from three insurance companies for estimated costs at the site in Uvalde, Texas.
Our nuclear garment decontamination facilities are licensed by the Nuclear Regulatory Commission (“NRC”), or, in certain cases, by the applicable state agency, and are subject to regulation by federal, state and local authorities. There can be no assurance that such regulation will not lead to material disruptions in our garment decontamination business.
From time to time, we are also subject to legal proceedings and claims arising from the conduct of our business operations, including litigation related to charges for certain ancillary services on invoices, personal injury claims, customer contract matters, employment claims and environmental matters as described above.
While it is impossible for us to ascertain the ultimate legal and financial liability with respect to contingent liabilities, including lawsuits and environmental contingencies, we believe that the aggregate amount of such liabilities, if any, in excess of amounts we have accrued or covered by insurance, will not have a material adverse effect on our consolidated financial position or results of operations. It is possible, however, that future financial position and/or results of operations for any particular future period could be materially affected by changes in our assumptions or strategies related to these contingencies or changes out of our control.
Acquisitions
As part of our business, we regularly evaluate opportunities to acquire other garment service companies. In recent years, we have typically paid for acquisitions with cash and may continue to do so in the future. To pay for an acquisition, we may use cash on hand, cash generated from operations or borrowings under our Credit Agreement, or we may pursue other forms of debt financing. Our ability to secure short-term and long-term debt financing in the future will depend on several factors, including our future profitability, our levels of debt and equity, and the overall credit and equity market environments.
Contractual Obligations and Other Commercial Commitments
The following information is presented as of August 28, 2010 (in thousands).
|
Payments Due by Fiscal Period
|
||||||||||||||||||||
|
Contractual Obligations
|
Total
|
Less
than 1
year
|
1 - 3
years
|
3 - 5
years
|
More than
5 years
|
|||||||||||||||
|
Private placement
|
$ | 175,000 | $ | 75,000 | $ | — | $ | 100,000 | $ | — | ||||||||||
|
Other debt
|
6,464 | 6,160 | 142 | — | 162 | |||||||||||||||
|
Total debt
|
181,464 | 81,160 | 142 | 100,000 | 162 | |||||||||||||||
|
Operating leases
|
11,452 | 4,326 | 4,941 | 1,452 | 733 | |||||||||||||||
|
Total contractual cash obligations
|
$ | 192,916 | $ | 85,486 | $ | 5,083 | $ | 101,452 | $ | 895 | ||||||||||
We have uncertain tax positions that are reserved totaling $3.6 million as of August 28, 2010 that are excluded from the above table as we cannot make a reasonably reliable estimate of the period of cash settlement with the respective taxing authority.
As discussed above under “Long-Term Debt and Borrowing Capacity”, as of August 28, 2010, we had borrowing capacity of $225.0 million under our Credit Agreement, of which approximately $189.1 million was available for borrowing. Also, as of such date, we had no outstanding borrowings included in bank debt in the above schedule and letters of credit of $35.9 million. All letters of credit expire in less than one year.
Off Balance Sheet Arrangements
At August 28, 2010 and August 29, 2009, we did not have any off balance sheet arrangements.
Seasonality
Historically, our revenues and operating results have varied from quarter to quarter and are expected to continue to fluctuate in the future. These fluctuations have been due to a number of factors, including: general economic conditions in our markets; the timing of acquisitions and of commencing start-up operations and related costs; our effectiveness in integrating acquired businesses and start-up operations; the timing of nuclear plant outages; capital expenditures; seasonal rental and purchasing patterns of our customers; and price changes in response to competitive factors. In addition, our operating results historically have been lower during the second and fourth fiscal quarters than during the other quarters of the fiscal year. The operating results for any historical quarter are not necessarily indicative of the results to be expected for an entire fiscal year or any other interim periods.
Effects of Inflation
In general, we believe that our results of operations are not dependent on moderate changes in the inflation rate. Historically, we have been able to manage the impacts of more significant changes in inflation rates through our customer relationships, customer agreements that generally provide for price increases consistent with the rate of inflation, and continued focus on improvements of operational productivity.
Energy Costs
Energy costs associated with operating our fleet of delivery trucks increased during fiscal year 2010. Significant increases in energy costs, specifically with respect to natural gas and gasoline, can materially affect our results of operations and financial condition. During fiscal 2010, our energy costs, which include fuel, natural gas, and electricity, represented approximately 5% of our total revenue.
Recent Accounting Pronouncements
In June 2008, the FASB issued revised guidance which clarifies whether instruments granted in share-based payment transactions are participating securities prior to vesting and therefore need to be included in the earnings allocation in computing earnings per share ("EPS"). We adopted the revised guidance on August 30, 2009. See Note 1, “Summary of Significant Accounting Policies”, of these Consolidated Financial Statements for more discussion on this revised guidance and our EPS calculations.
In June 2009, the FASB approved its Accounting Standards Codification (the “Codification”), as the single source of authoritative United States accounting and reporting standards applicable for all non-governmental entities, with the exception of the SEC and its staff. The Codification, which changes the referencing of financial standards, is effective for interim or annual financial periods ending after September 15, 2009. Therefore, starting in our first quarter of fiscal 2010, any references made to US GAAP use the new Codification numbering system prescribed by the FASB. The Codification was not intended to change or alter existing US GAAP, and as a result, it did not have any impact on Consolidated Financial Statements.
In January 2010, the FASB issued revised guidance which requires additional disclosures about items transferring into and out of Levels 1 and 2 measurements in the fair value hierarchy, requires additional separate disclosures about purchases, sales, issuances, and settlements relative to Level 3 measurements, and clarifies, among other things, the existing fair value disclosures about the level of disaggregation. This pronouncement was effective for interim and annual financial periods beginning after December 15, 2009, except for the disclosures about purchases, sales, issuances, and settlements relative to Level 3 measurements, which are effective for interim and annual financial periods beginning after December 15, 2010. We partially adopted this revised guidance on February 28, 2010, as required, and the adoption did not have a material impact on our Consolidated Financial Statements. We also do not expect the adoption of the delayed portion of the revised guidance to have a material impact on our Consolidated Financial Statements.
ITEM 7A. QUANTITATIVE AND QUALITATIVE DISCLOSURES ABOUT MARKET RISK
Foreign Currency Exchange Risk
We have determined that all of our foreign subsidiaries operate primarily in local currencies that represent the functional currencies of such subsidiaries. All assets and liabilities of our foreign subsidiaries are translated into U.S. dollars using the exchange rate prevailing at the balance sheet date. The effect of exchange rate fluctuations on the translation of assets and liabilities are recorded as a component of shareholders’ equity. Revenues and expenses are translated at the average exchange rates in effect during each month of the fiscal year. As such, our financial condition and operating results are affected by fluctuations in the value of the U.S. dollar as compared to currencies in foreign countries. Revenues denominated in currencies other than the U.S. dollar represented approximately 9%, 8%, and 9% of our total consolidated revenues for the fiscal years ended August 28, 2010, August 29, 2009 and August 30, 2008, respectively. Total assets denominated in currencies other than the U.S. dollar represented approximately 10% of our total consolidated assets at August 28, 2010, August 29, 2009 and August 30, 2008. If exchange rates had changed by 10% from the actual rates in effect during the year ended August 28, 2010, our revenues and assets for the year ended and as of August 28, 2010 would have increased or decreased by approximately $9.3 million and $11.2 million, respectively.
We do not operate a hedging program to mitigate the effect of a significant change in the value of our foreign subsidiaries functional currencies, which include the Canadian Dollar, Euro, British Pound, and Mexican Peso, as compared to the U.S. dollar. Any gains or losses resulting from foreign currency transactions, including exchange rate fluctuations on intercompany accounts are reported as transaction (gains) losses in our other expense (income). The intercompany payables and receivables are denominated in Canadian Dollars, Euros, British Pounds and Mexican Pesos. During the year ended August 28, 2010, transaction losses included in other expense (income) were $0.7 million. If the exchange rates had changed by 10% during the year ended August 28, 2010, we would have recognized exchange gains or losses of approximately $0.8 million.
Interest Rate Sensitivity
We are exposed to market risk from changes in interest rates which may adversely affect our financial position, results of operations and cash flows. In seeking to minimize the risks from interest rate fluctuations, we manage these exposures through our regular operating and financing activities. We are exposed to interest rate risk primarily through our borrowings under our $225.0 million Credit Agreement with a syndicate of banks and our 2006 Floating Rate Notes which were purchased by a group of insurance companies pursuant to the 2006 Note Agreement. Under both agreements, we borrow funds at variable interest rates based on the Eurodollar rate or LIBOR rates. If the LIBOR and Eurodollar rates fluctuated by 10% from the actual rates in effect during the year ended August 28, 2010, our interest expense would have fluctuated by approximately $0.1 million from the interest expense recognized for the year ended August 28, 2010.
In January 2008, we entered into an interest rate swap agreement to manage our exposure to interest rate movements and the related effect on our variable rate debt. The swap agreement, with a notional amount of $100.0 million, matures on March 14, 2011. We pay a fixed rate of 3.51% and receive a variable rate tied to the three month LIBOR rate. We have accounted for this instrument as a cash flow hedge under SFAS No. 133 and, as a result, have recorded all changes in the fair value of the swap agreement in accumulated other comprehensive income, a component of shareholders’ equity.
ITEM 8. FINANCIAL STATEMENTS AND SUPPLEMENTARY DATA
Consolidated Statements of Income
UniFirst Corporation and Subsidiaries
|
Year ended
(In thousands, except per share data)
|
August 28,
2010
|
August 29,
2009
|
August 30,
2008
|
|||||||||
|
Revenues
|
$ | 1,025,939 | $ | 1,013,416 | $ | 1,023,175 | ||||||
|
Operating expenses:
|
||||||||||||
|
Cost of revenues (1)
|
620,727 | 609,629 | 643,886 | |||||||||
|
Selling and administrative expenses (1)
|
213,463 | 211,962 | 216,867 | |||||||||
|
Depreciation and amortization
|
61,477 | 57,789 | 53,784 | |||||||||
|
Total operating expenses
|
895,667 | 879,380 | 914,537 | |||||||||
|
Income from operations
|
130,272 | 134,036 | 108,638 | |||||||||
|
Other expense (income):
|
||||||||||||
|
Interest expense
|
8,778 | 9,313 | 11,999 | |||||||||
|
Interest income
|
(2,104 | ) | (1,992 | ) | (2,224 | ) | ||||||
|
Foreign exchange loss
|
746 | 250 | 164 | |||||||||
|
Total other expense (income)
|
7,420 | 7,571 | 9,939 | |||||||||
|
Income before income taxes
|
122,852 | 126,465 | 98,699 | |||||||||
|
Provision for income taxes
|
46,444 | 50,613 | 37,721 | |||||||||
|
Net income
|
$ | 76,408 | $ | 75,852 | $ | 60,978 | ||||||
|
Income per share – Basic:
|
||||||||||||
|
Common Stock
|
$ | 4.11 | $ | 4.14 | $ | 3.33 | ||||||
|
Class B Common Stock
|
$ | 3.29 | $ | 3.31 | $ | 2.66 | ||||||
|
Income per share – Diluted:
|
||||||||||||
|
Common Stock
|
$ | 3.90 | $ | 3.92 | $ | 3.15 | ||||||
|
Income allocated to – Basic:
|
||||||||||||
|
Common Stock
|
$ | 59,921 | $ | 59,526 | $ | 47,827 | ||||||
|
Class B Common Stock
|
$ | 15,875 | $ | 16,326 | $ | 13,151 | ||||||
|
Income allocated to – Diluted:
|
||||||||||||
|
Common Stock
|
$ | 75,827 | $ | 75,852 | $ | 60,978 | ||||||
|
Weighted average number of shares outstanding – Basic:
|
||||||||||||
|
Common Stock
|
14,570 | 14,394 | 14,363 | |||||||||
|
Class B Common Stock
|
4,823 | 4,935 | 4,937 | |||||||||
|
Weighted average number of shares outstanding – Diluted:
|
||||||||||||
|
Common Stock
|
19,458 | 19,373 | 19,353 | |||||||||
|
Dividends per share:
|
||||||||||||
|
Common Stock
|
$ | 0.15 | $ | 0.15 | $ | 0.15 | ||||||
|
Class B Common Stock
|
$ | 0.12 | $ | 0.12 | $ | 0.12 | ||||||
(1) Exclusive of depreciation on the Company’s property, plant and equipment and amortization of its intangible assets.
The accompanying notes are an integral part of these
Consolidated Financial Statements.
UniFirst Corporation and Subsidiaries
|
(In thousands, except share data)
|
August 28,
2010
|
August 29,
2009
|
||||||
|
Assets
|
||||||||
|
Cash and cash equivalents
|
$ | 121,258 | $ | 60,151 | ||||
|
Receivables, less reserves of $4,102 and $5,567 respectively
|
105,247 | 97,784 | ||||||
|
Inventories
|
47,630 | 43,586 | ||||||
|
Rental merchandise in service
|
86,633 | 73,063 | ||||||
|
Prepaid and deferred income taxes
|
14,252 | 18,215 | ||||||
|
Prepaid expenses
|
3,004 | 2,889 | ||||||
|
Total current assets
|
378,024 | 295,688 | ||||||
|
Property, plant and equipment:
|
||||||||
|
Land, buildings and leasehold improvements
|
334,037 | 325,034 | ||||||
|
Machinery and equipment
|
370,088 | 352,511 | ||||||
|
Motor vehicles
|
121,135 | 113,048 | ||||||
|
Total property, plant and equipment
|
825,260 | 790,593 | ||||||
|
Less -- accumulated depreciation
|
444,061 | 407,823 | ||||||
|
Total property, plant and equipment, net
|
381,199 | 382,770 | ||||||
|
Goodwill
|
271,857 | 261,171 | ||||||
|
Customer contracts, net
|
56,528 | 56,616 | ||||||
|
Other intangible assets, net
|
2,509 | 3,438 | ||||||
|
Other assets
|
2,178 | 2,416 | ||||||
|
Total assets
|
$ | 1,092,295 | $ | 1,002,099 | ||||
|
Liabilities and shareholders' equity
|
||||||||
|
Current liabilities:
|
||||||||
|
Current maturities of long-term debt
|
$ | 81,160 | $ | 6,447 | ||||
|
Accounts payable
|
45,931 | 41,180 | ||||||
|
Accrued liabilities
|
83,804 | 76,885 | ||||||
|
Accrued income taxes
|
— | 2,437 | ||||||
|
Total current liabilities
|
210,895 | 126,949 | ||||||
|
Long-term liabilities:
|
||||||||
|
Long-term debt, net of current maturities
|
100,304 | 175,568 | ||||||
|
Accrued liabilities
|
30,290 | 27,118 | ||||||
|
Accrued and deferred income taxes
|
42,756 | 45,429 | ||||||
|
Total long-term liabilities
|
173,350 | 248,115 | ||||||
|
Commitments and Contingencies (Note 11)
|
||||||||
|
Shareholders' equity:
|
||||||||
|
Preferred Stock, $1.00 par value; 2,000,000 shares authorized; no shares issued and outstanding
|
— | — | ||||||
|
Common Stock, $0.10 par value; 30,000,000 shares authorized; 14,913,379 and 14,435,254 issued and outstanding in 2010 and 2009, respectively
|
1,491 | 1,443 | ||||||
|
Class B Common Stock, $0.10 par value; 20,000,000 shares authorized; 4,913,369 and 4,933,369 issued and outstanding in 2010 and 2009, respectively
|
491 | 493 | ||||||
|
Capital surplus
|
25,329 | 20,137 | ||||||
|
Retained earnings
|
678,876 | 605,262 | ||||||
|
Accumulated other comprehensive income (loss)
|
1,863 | (300 | ) | |||||
|
Total shareholders' equity
|
708,050 | 627,035 | ||||||
|
Total liabilities and shareholders’ equity
|
$ | 1,092,295 | $ | 1,002,099 | ||||
The accompanying notes are an integral part of these
Consolidated Financial Statements.
UniFirst Corporation and Subsidiaries
|
(In thousands)
|
Common
Shares
|
Class B
Common
Shares
|
Common
Stock
|
Class B
Common
Stock
|
Capital
Surplus
|
Retained
Earnings
|
Accumulated
Other
Comprehensive
Income
(Loss)
|
Total
Equity
|
||||||||||||||||||
|
Balance, August 25, 2007
|
14,352
|
4,938
|
$
|
1,435
|
$
|
494
|
$
|
16,332
|
$
|
473,934
|
$
|
5,132
|
$
|
497,327
|
||||||||||||
|
Net income
|
—
|
—
|
—
|
—
|
—
|
60,978
|
—
|
60,978
|
||||||||||||||||||
|
Pension benefit liabilities, net (1)
|
—
|
—
|
—
|
—
|
—
|
—
|
(458
|
)
|
(458
|
)
|
||||||||||||||||
|
Foreign currency translation
|
—
|
—
|
—
|
—
|
—
|
—
|
(52
|
)
|
(52
|
)
|
||||||||||||||||
|
Change in interest rate swap, net (1)
|
—
|
—
|
—
|
—
|
—
|
—
|
(188
|
)
|
(188
|
)
|
||||||||||||||||
|
Comprehensive income
|
60,280
|
|||||||||||||||||||||||||
|
Dividends declared
|
—
|
—
|
—
|
—
|
—
|
(2,748
|
)
|
—
|
(2,748
|
)
|
||||||||||||||||
|
Shares converted
|
3
|
(3
|
)
|
—
|
—
|
—
|
—
|
—
|
—
|
|||||||||||||||||
|
Share-based compensation
|
6
|
—
|
—
|
—
|
1,118
|
—
|
—
|
1,118
|
||||||||||||||||||
|
Stock options exercised, net (1)
|
28
|
—
|
3
|
—
|
790
|
—
|
—
|
793
|
||||||||||||||||||
|
Balance, August 30, 2008
|
14,389
|
4,935
|
$
|
1,438
|
$
|
494
|
$
|
18,240
|
$
|
532,164
|
$
|
4,434
|
$
|
556,770
|
||||||||||||
|
Net income
|
—
|
—
|
—
|
—
|
—
|
75,852
|
—
|
75,852
|
||||||||||||||||||
|
Pension benefit liabilities, net (1)
|
—
|
—
|
—
|
—
|
—
|
—
|
(117
|
)
|
(117
|
)
|
||||||||||||||||
|
Foreign currency translation
|
—
|
—
|
—
|
—
|
—
|
—
|
(2,604
|
)
|
(2,604
|
)
|
||||||||||||||||
|
Change in interest rate swap, net (1)
|
—
|
—
|
—
|
—
|
—
|
—
|
(2,013
|
)
|
(2,013
|
)
|
||||||||||||||||
|
Comprehensive income
|
71,118
|
|||||||||||||||||||||||||
|
Dividends declared
|
—
|
—
|
—
|
—
|
—
|
(2,754
|
)
|
—
|
(2,754
|
)
|
||||||||||||||||
|
Shares converted
|
2
|
(2
|
)
|
1
|
(1)
|
—
|
—
|
—
|
—
|
|||||||||||||||||
|
Share-based compensation
|
12
|
—
|
1
|
—
|
1,024
|
—
|
—
|
1,025
|
||||||||||||||||||
|
Stock options exercised, net (1)
|
32
|
—
|
3
|
—
|
873
|
—
|
—
|
876
|
||||||||||||||||||
|
Balance, August 29, 2009
|
14,435
|
4,933
|
$
|
1,443
|
$
|
493
|
$
|
20,137
|
$
|
605,262
|
$
|
(300
|
)
|
$
|
627,035
|
|||||||||||
|
Net income
|
—
|
—
|
—
|
—
|
—
|
76,408
|
—
|
76,408
|
||||||||||||||||||
|
Pension benefit liabilities, net (1)
|
—
|
—
|
—
|
—
|
—
|
—
|
(847
|
)
|
(847
|
)
|
||||||||||||||||
|
Foreign currency translation
|
—
|
—
|
—
|
—
|
—
|
—
|
1,801
|
1,801
|
||||||||||||||||||
|
Change in interest rate swap, net (1)
|
—
|
—
|
—
|
—
|
—
|
—
|
1,209
|
1,209
|
||||||||||||||||||
|
Comprehensive income
|
78,571
|
|||||||||||||||||||||||||
|
Dividends declared
|
—
|
—
|
—
|
—
|
—
|
(2,794
|
)
|
—
|
(2,794
|
)
|
||||||||||||||||
|
Shares converted
|
20
|
(20)
|
2
|
(2
|
)
|
—
|
—
|
—
|
—
|
|||||||||||||||||
|
Share-based compensation
|
412
|
—
|
41
|
—
|
3,621
|
—
|
—
|
3,662
|
||||||||||||||||||
|
Stock options exercised, net (1)
|
46
|
—
|
5
|
—
|
1,571
|
—
|
—
|
1,576
|
||||||||||||||||||
|
Balance, August 28, 2010
|
14,913
|
4,913
|
$
|
1,491
|
$
|
491
|
$
|
25,329
|
$
|
678,876
|
$
|
1,863
|
$
|
708,050
|
||||||||||||
(1) These amounts are shown net of the effect of income taxes.
The accompanying notes are an integral part of these
Consolidated Financial Statements.
UniFirst Corporation and Subsidiaries
|
Year ended
(In thousands)
|
August 28,
2010
|
August 29,
2009
|
August 30,
2008
|
|||||||||
|
Cash flows from operating activities:
|
||||||||||||
|
Net income
|
$ | 76,408 | $ | 75,852 | $ | 60,978 | ||||||
|
Adjustments to reconcile net income to cash provided by operating activities:
|
||||||||||||
|
Depreciation
|
52,107 | 48,855 | 45,432 | |||||||||
|
Amortization of intangible assets
|
9,370 | 8,934 | 8,352 | |||||||||
|
Amortization of deferred financing costs
|
267 | 267 | 267 | |||||||||
|
Share-based compensation
|
3,662 | 1,025 | 1,118 | |||||||||
|
Accretion on environmental contingencies
|
794 | 668 | 783 | |||||||||
|
Accretion on asset retirement obligations
|
568 | 517 | 486 | |||||||||
|
Deferred income taxes
|
705 | 1,328 | 1,206 | |||||||||
|
Changes in assets and liabilities, net of acquisitions:
|
||||||||||||
|
Receivables
|
(6,308 | ) | 4,079 | (8,542 | ) | |||||||
|
Inventories
|
(4,331 | ) | 2,452 | (1,816 | ) | |||||||
|
Rental merchandise in service
|
(11,451 | ) | 19,334 | (2,011 | ) | |||||||
|
Prepaid expenses
|
(99 | ) | (1,174 | ) | 9 | |||||||
|
Accounts payable
|
4,748 | (13,365 | ) | 9,606 | ||||||||
|
Accrued liabilities
|
9,257 | 7,556 | 2,992 | |||||||||
|
Prepaid and accrued income taxes
|
(1,724 | ) | 2,867 | 605 | ||||||||
|
Net cash provided by operating activities
|
133,973 | 159,195 | 119,465 | |||||||||
|
Cash flows from investing activities:
|
||||||||||||
|
Acquisition of businesses
|
(20,908 | ) | (4,730 | ) | (60,952 | ) | ||||||
|
Capital expenditures
|
(50,015 | ) | (65,323 | ) | (73,795 | ) | ||||||
|
Other
|
(1,794 | ) | 304 | 1,116 | ||||||||
|
Net cash used in investing activities
|
(72,717 | ) | (69,749 | ) | (133,631 | ) | ||||||
|
Cash flows from financing activities:
|
||||||||||||
|
Proceeds from long-term debt
|
8,850 | 140,628 | 175,455 | |||||||||
|
Payments on long-term debt
|
(9,113 | ) | (193,761 | ) | (145,620 | ) | ||||||
|
Proceeds from exercise of Common Stock options
|
1,177 | 689 | 518 | |||||||||
|
Payment of cash dividends
|
(2,777 | ) | (2,754 | ) | (2,748 | ) | ||||||
|
Net cash (used in) provided by financing activities
|
(1,863 | ) | (55,198 | ) | 27,605 | |||||||
|
Effect of exchange rate changes
|
1,714 | 248 | (482 | ) | ||||||||
|
Net increase in cash and cash equivalents
|
61,107 | 34,496 | 12,957 | |||||||||
|
Cash and cash equivalents at beginning of period
|
60,151 | 25,655 | 12,698 | |||||||||
|
Cash and cash equivalents at end of period
|
$ | 121,258 | $ | 60,151 | $ | 25,655 | ||||||
|
Supplemental disclosure of cash flow information:
|
||||||||||||
|
Interest paid
|
$ | 8,503 | $ | 9,110 | $ | 12,071 | ||||||
|
Income taxes paid, net of refunds received
|
$ | 48,764 | $ | 45,954 | $ | 36,771 | ||||||
The accompanying notes are an integral part of these
Consolidated Financial Statements.
UniFirst Corporation and Subsidiaries
1. Summary of Significant Accounting Policies
Business Description
UniFirst Corporation (the “Company”) is one of the largest providers of workplace uniforms and protective clothing in the United States. The Company designs, manufactures, personalizes, rents, cleans, delivers, and sells a wide range of uniforms and protective clothing, including shirts, pants, jackets, coveralls, lab coats, smocks, aprons and specialized protective wear, such as flame resistant and high visibility garments. The Company also rents industrial wiping products, floor mats, facility service products and other non-garment items, and provides first aid cabinet services and other safety supplies, to a variety of manufacturers, retailers and service companies.
The Company serves businesses of all sizes in numerous industry categories. Typical customers include automobile service centers and dealers, delivery services, food and general merchandise retailers, food processors and service operations, light manufacturers, maintenance facilities, restaurants, service companies, soft and durable goods wholesalers, transportation companies, and others who require employee clothing for image, identification, protection or utility purposes. The Company also provides its customers with restroom supplies, including air fresheners, paper products and hand soaps.
At certain specialized facilities, the Company also decontaminates and cleans work clothes that may have been exposed to radioactive materials and services special cleanroom protective wear. Typical customers for these specialized services include government agencies, research and development laboratories, high technology companies and utilities operating nuclear reactors.
As discussed and described in Note 15, “Segment Reporting”, to these Consolidated Financial Statements, the Company has five reporting segments: US and Canadian Rental and Cleaning, Manufacturing (“MFG”), Specialty Garments Rental and Cleaning (“Specialty Garments”), First Aid and Corporate. The operations of the US and Canadian Rental and Cleaning reporting segment are referred to by the Company as its “industrial laundry operations” and the locations related to this reporting segment are referred to as “industrial laundries”. The Company refers to its US and Canadian Rental and Cleaning, MFG, and Corporate segments combined as its “core laundry operations”.
Principles of Consolidation
The Consolidated Financial Statements include the accounts of the Company and its subsidiaries, all of which are wholly-owned. Intercompany balances and transactions are eliminated in consolidation.
Use of Estimates
The preparation of financial statements is in conformity with US GAAP which requires management to make estimates and assumptions that affect the reported amounts in the financial statements and accompanying notes. These estimates are based on historical information, current trends, and information available from other sources. Actual results could differ from these estimates.
Fiscal Year
The Company’s fiscal year ends on the last Saturday in August. For financial reporting purposes, fiscal 2010 consisted of 52 weeks, fiscal 2009 consisted of 52 weeks and fiscal 2008 consisted of 53 weeks. The additional week was included in the second quarter of fiscal 2008.
Cash and Cash Equivalents
Cash and cash equivalents include cash in banks and bank short-term investments with maturities of less than ninety days.
The Company’s financial instruments, which may expose the Company to concentrations of credit risk, include cash and cash equivalents, receivables, accounts payable, notes payable and long-term debt. Each of these financial instruments is recorded at cost, which approximates its fair value.
Revenue Recognition and Allowance for Doubtful Accounts
The Company recognizes revenue from rental operations in the period in which the services are provided. Direct sales revenue is recognized in the period in which the services are performed or when the product is shipped. Management judgments and estimates are used in determining the collectability of accounts receivable and evaluating the adequacy of the allowance for doubtful accounts. The Company considers specific accounts receivable and historical bad debt experience, customer credit worthiness, current economic trends and the age of outstanding balances as part of its evaluation. Changes in estimates are reflected in the period they become known. If the financial condition of the Company’s customers were to deteriorate, resulting in an impairment of their ability to make payments, additional allowances may be required. Material changes in its estimates may result in significant differences in the amount and timing of bad debt expense recognition for any given period. Revenues do not include taxes we collect from our customers and remit to governmental authorities.
Inventories and Rental Merchandise in Service
Inventories are stated at the lower of cost or market value, net of any reserve for excess and obsolete inventory. Judgments and estimates are used in determining the likelihood that new goods on hand can be sold to customers or used in rental operations. Historical inventory usage and current revenue trends are considered in estimating both excess and obsolete inventories. If actual product demand and market conditions are less favorable than those projected by management, additional inventory write-downs may be required. The Company uses the first-in, first-out (“FIFO”) method to value its inventories, which primarily consist of finished goods.
Rental merchandise in service is amortized, primarily on a straight-line basis, over the estimated service lives of the merchandise, which range from 6 to 36 months. In establishing estimated lives for merchandise in service, management considers historical experience and the intended use of the merchandise. Material differences may result in the amount and timing of operating profit for any period if management makes significant changes to these estimates.
Property, plant and equipment
Property, plant and equipment are recorded at cost. Expenditures for maintenance and repairs are expensed as incurred, while expenditures for renewals and betterments are capitalized. The Company provides for depreciation on the straight-line method based on the following estimated useful lives:
|
Buildings
|
30-40 years
|
|
Leasehold improvements
|
Shorter of useful life
or term of lease
|
|
Machinery and equipment
|
3-10 years
|
|
Motor vehicles
|
3-5 years
|
Long-lived assets, including property, plant and equipment, are evaluated for impairment whenever events or circumstances indicate an asset may be impaired. There have been no material impairments of long-lived assets in fiscal 2010, 2009 or 2008.
Goodwill and Other Intangible Assets
In accordance with accounting guidance generally accepted in the United States (“US GAAP”), goodwill is not amortized. Instead, current accounting guidance requires that companies test goodwill for impairment on an annual basis. Management completes its annual impairment test in the fourth quarter of each fiscal year. In addition, US GAAP requires that companies test goodwill if events occur or circumstances change that would more likely than not reduce the fair value of a reporting unit to which goodwill is assigned below its carrying amount. The Company’s evaluation considers changes in the operating environment, competitive information, market trends, operating performance and cash flow modeling.
The Company cannot predict future economic conditions or the future market value of the Company's stock or their impact on the Company. A decline in the Company’s market capitalization and/or deterioration in general economic conditions could negatively and materially impact the Company's assumptions and assessment of the fair value of the Company's business. If general economic conditions or the Company's financial performance deteriorate, the Company may be required to record a goodwill impairment charge in the future which could have a material impact on the Company’s financial condition and results of operations.
Definite-lived intangible assets are amortized over their useful lives, which are based on management’s estimates of the period that the assets will generate revenue. Definite-lived intangible assets are evaluated for impairment. There were no impairments of goodwill or definite-lived intangible assets in fiscal 2010, 2009, or 2008.
As of August 28, 2010, definite-lived intangible assets have a weighted average useful life of approximately 14.3 years. Customer contracts have a weighted average useful life of approximately 14.6 years and other intangible assets, net, which consist of primarily, restrictive covenants, deferred financing costs and trademarks, have a weighted average useful lives of approximately 6.1 years.
Environmental and Other Contingencies
The Company is subject to legal proceedings and claims arising from the conduct of its business operations, including environmental matters, personal injury, customer contract matters and employment claims. Accounting principles generally accepted in the United States require that a liability for contingencies be recorded when it is probable that a liability has occurred and the amount of the liability can be reasonably estimated. Significant judgment is required to determine the existence of a liability, as well as the amount to be recorded. The Company regularly consults with attorneys and outside consultants, in its consideration of the relevant facts and circumstances, before recording a contingent liability. The Company records accruals for environmental and other contingencies based on enacted laws, regulatory orders or decrees, the Company’s estimates of costs, insurance proceeds, participation by other parties, the timing of payments, and the input of outside consultants and attorneys.
The estimated liability for environmental contingencies has been discounted using risk-free interest rates ranging from 3.5% to 4.2% over periods ranging from ten to thirty years. The estimated current costs, net of legal settlements with insurance carriers, have been adjusted for the estimated impact of inflation at 3% per year. Changes in enacted laws, regulatory orders or decrees, management’s estimates of costs, risk-free interest rates, insurance proceeds, participation by other parties, the timing of payments and the input of outside consultants and attorneys based on changing legal or factual circumstances could have a material impact on the amounts recorded for environmental and other contingent liabilities. Refer to Note 11, “Commitments and Contingencies”, of these Consolidated Financial Statements for additional discussion and analysis.
Asset Retirement Obligations
Under US GAAP, asset retirement obligations generally apply to legal obligations associated with the retirement of long-lived assets that result from the acquisition, construction, development and/or the normal operation of a long-lived asset. The Company recognizes asset retirement obligations in the period in which they are incurred if a reasonable estimate of fair value can be made. The associated asset retirement costs are capitalized as part of the carrying amount of the long-lived asset.
The Company has recognized as a liability the present value of the estimated future costs to decommission its nuclear laundry facilities. The Company depreciates, on a straight-line basis, the amount added to Property, plant and equipment and recognizes accretion expense in connection with the discounted liability over the various remaining lives which range from approximately one to thirty-four years.
The estimated liability has been based on historical experience in decommissioning nuclear laundry facilities, estimated useful lives of the underlying assets, external vendor estimates as to the cost to decommission these assets in the future, and federal and state regulatory requirements. The estimated current costs have been adjusted for the estimated impact of inflation at 3% per year. The liability has been discounted using credit-adjusted risk-free rates that range from approximately 5.7% to 7.5%. Revisions to the liability could occur due to changes in the Company’s estimated useful lives of the underlying assets, estimated dates of decommissioning, changes in decommissioning costs, changes in federal or state regulatory guidance on the decommissioning of such facilities, or other changes in estimates. Changes due to revised estimates will be recognized by adjusting the carrying amount of the liability and the related long-lived asset if the assets are still in service, or charged to expense in the period if the assets are no longer in service.
Derivative Financial Instruments
US GAAP requires that all derivative instruments be recorded as other assets or other liabilities at fair value. All subsequent changes in a derivative’s fair value are recognized in income, unless specific hedge accounting criteria are met. Cash flows associated with derivatives are classified in the same category as the cash flows hedged in the Consolidated Statements of Cash Flows.
Derivative instruments that qualify for hedge accounting are classified as a hedge of the variability of cash flows to be paid related to a recognized liability or a forecasted transaction. Changes in the fair value of a derivative that is highly effective and designated as a cash flow hedge are recognized in accumulated other comprehensive income (loss) in the Consolidated Balance Sheets until expenses from the cash flows of the hedged items are recognized. The Company performs an assessment at the inception of the hedge and on a quarterly basis thereafter, to determine whether its derivatives are highly effective in offsetting changes in the value of the hedged items. Any change in the fair value resulting from hedge ineffectiveness is immediately recognized as income or expense in the Consolidated Statements of Income.
The Company’s hedging activities are transacted only with highly rated institutions, which reduce the exposure to credit risk in the event of nonperformance. Refer to Note 6, “Derivative Instruments and Hedging Activities”, of these Consolidated Financial Statements for additional discussion and analysis.
Insurance
The Company is self-insured for certain obligations related to health, workers’ compensation, vehicles and general liability programs. The Company also purchases stop-loss insurance policies to protect itself from catastrophic losses. Judgments and estimates are used in determining the potential value associated with reported claims and for events that have occurred, but have not been reported. The Company’s estimates consider historical claims experience and other factors. The Company’s liabilities are based on estimates, and, while the Company believes that its accruals are adequate, the ultimate liability may be significantly different from the amounts recorded. Changes in claims experience, the Company’s ability to settle claims or other estimates and judgments used by management could have a material impact on the amount and timing of expense for any period.
Supplemental Executive Retirement Plan and other Pension Plans
Pension expense is recognized on an accrual basis over employees’ estimated service periods. Pension expense is generally independent of funding decisions or requirements.
The Company (1) recognizes in its statement of financial position the over-funded or under-funded status of its defined benefit postretirement plan measured as the difference between the fair value of plan assets and the benefit obligation, (2) recognizes as a component of other comprehensive income, net of tax, the actuarial gains and losses and the prior service costs and credits that arise during the period but are not recognized as components of net periodic benefit cost, (3) measures defined benefit plan assets and defined benefit plan obligations as of the date of its statement of financial position, and (4) discloses additional information in the notes to financial statements about certain effects on net periodic benefit cost in the upcoming fiscal year that arise from delayed recognition of the actuarial gains and losses and the prior service costs and credits. Refer to Note 7, “Employee Benefit Plans”, of these Consolidated Financial Statements for further discussion regarding the Company’s pension plans.
The calculation of pension expense and the corresponding liability requires the use of a number of critical assumptions, including the expected long-term rate of return on plan assets and the assumed discount rate. Changes in these assumptions can result in different expense and liability amounts, and future actual experience can differ from these assumptions. Pension expense increases as the expected rate of return on pension plan assets decreases. Future changes in plan asset returns, assumed discount rates and various other factors related to the participants in the Company’s pension plans will impact the Company’s future pension expense and liabilities. The Company cannot predict with certainty what these factors will be in the future.
Income Taxes
The Company computes income tax expense by jurisdiction based on its operations in each jurisdiction. Deferred income taxes are provided for temporary differences between the amounts recognized for income tax and financial reporting purposes at currently enacted tax rates.
The Company is periodically reviewed by U.S. domestic and foreign tax authorities regarding the amount of taxes due. These reviews typically include inquiries regarding the timing and amount of deductions and the allocation of income among various tax jurisdictions. In evaluating the exposure associated with various filing positions, the Company records estimated reserves. Refer to Note 4, “Income Taxes”, of these Consolidated Financial Statements for further discussion regarding the Company’s accounting for income taxes and its uncertain tax positions for financial accounting purposes.
Advertising Costs
Advertising costs are expensed as incurred and are classified as selling and administrative expenses. The Company incurred advertising costs of $1.5 million, $1.6 million and $1.7 million for the fiscal years ended August 28, 2010, August 29, 2009 and August 30, 2008, respectively.
Net Income Per Share
As described in Note 1, “Recent Accounting Pronouncements”, to the Consolidated Financial Statements, the Company adopted revised guidance on August 30, 2009 which clarifies whether instruments granted in share-based payment transactions are participating securities prior to vesting, and requires the Company to allocate income to its unvested participating securities as part of its EPS calculations.
The Class B Common Stock may be converted at any time on a one-for-one basis into Common Stock at the option of the holder of the Class B Common Stock. Diluted earnings per share for the Company’s Common Stock assumes the conversion of all of the Company’s Class B Common Stock into Common Stock, full vesting of outstanding restricted stock, and the exercise of outstanding stock options under the Company’s stock based employee compensation plans.
The following table sets forth the computation of basic earnings per share using the two-class method for amounts attributable to the Company’s shares of Common Stock and Class B Common Stock (in thousands, except per share data):
|
August 28,
|
August 29,
|
August 30,
|
||||||||||
|
Year ended
|
2010
|
2009
|
2008
|
|||||||||
|
Net income available to shareholders
|
$ | 76,408 | $ | 75,852 | $ | 60,978 | ||||||
|
Allocation of net income for Basic:
|
||||||||||||
|
Common Stock
|
$ | 59,921 | $ | 59,526 | $ | 47,827 | ||||||
|
Class B Common Stock
|
15,875 | 16,326 | 13,151 | |||||||||
|
Unvested participating shares
|
612 | — | — | |||||||||
| $ | 76,408 | $ | 75,852 | $ | 60,978 | |||||||
|
Weighted average number of shares for Basic:
|
||||||||||||
|
Common Stock
|
14,570 | 14,394 | 14,363 | |||||||||
|
Class B Common Stock
|
4,823 | 4,935 | 4,937 | |||||||||
|
Unvested participating shares
|
171 | — | — | |||||||||
| 19,564 | 19,329 | 19,300 | ||||||||||
|
Earnings per share for Basic:
|
||||||||||||
|
Common Stock
|
$ | 4.11 | $ | 4.14 | $ | 3.33 | ||||||
|
Class B Common Stock
|
$ | 3.29 | $ | 3.31 | $ | 2.66 | ||||||
For diluted EPS, the revised guidance requires the Company to calculate diluted EPS for Common Stock using the more dilutive of the following two methods:
|
•
|
The treasury stock method; or
|
||
|
•
|
The two-class method assuming a participating security is not exercised or converted.
|
||
For the year ended August 28, 2010, the Company’s diluted EPS was calculated using the two-class method as follows (in thousands, except per share data):
|
Earnings
|
||||||||||||
|
to Common
|
Common
|
|||||||||||
|
shareholders
|
Shares
|
EPS
|
||||||||||
|
As reported - Basic
|
$ | 59,921 | 14,570 | $ | 4.11 | |||||||
|
Add: effect of dilutive potential common shares
|
||||||||||||
|
Common Stock options
|
— | 65 | ||||||||||
|
Class B Common Stock
|
15,875 | 4,823 | ||||||||||
|
Add: Undistributed earnings allocated to unvested participating shares
|
598 | — | ||||||||||
|
Less: Undistributed earnings reallocated to unvested participating shares
|
(567 | ) | — | |||||||||
|
Diluted EPS – Common Stock
|
$ | 75,827 | 19,458 | $ | 3.90 | |||||||
Stock options to purchase 118,800 shares of Common Stock were excluded from the calculation of diluted earnings per share for the year ended August 28, 2010 because they were anti-dilutive.
For the years ended August 29, 2009, and August 30, 2008, the Company’s diluted EPS was calculated using the treasury stock method as follows (in thousands, except per share data):
|
Year ended August 29, 2009
|
Year ended August 30, 2008
|
|||||||||||||||||||||||
|
Earnings
|
Earnings
|
|||||||||||||||||||||||
|
to Common
|
Common
|
to Common
|
Common
|
|||||||||||||||||||||
|
shareholders
|
Shares
|
EPS
|
shareholders
|
Shares
|
EPS
|
|||||||||||||||||||
|
As reported - Basic
|
$ | 59,526 | 14,394 | $ | 4.14 | $ | 47,827 | 14,363 | $ | 3.33 | ||||||||||||||
|
Add: effect of dilutive potential common shares
|
||||||||||||||||||||||||
|
Common Stock options
|
— | 44 | — | 53 | ||||||||||||||||||||
|
Class B Common Stock
|
16,326 | 4,935 | 13,151 | 4,937 | ||||||||||||||||||||
|
Diluted EPS – Common Stock
|
$ | 75,852 | 19,373 | $ | 3.92 | $ | 60,978 | 19,353 | $ | 3.15 | ||||||||||||||
Stock options to purchase 213,100 shares and 144,000 shares of Common Stock were excluded from the calculation of diluted earnings per share for the years ended August 29, 2009 and August 28, 2008, respectively, because they were anti-dilutive.
The diluted earnings per share calculations assume the conversion of all of the Company’s Class B Common Stock into Common Stock; therefore, no allocation of earnings to Class B Common Stock is required.
Share-Based Compensation
The Company adopted a stock incentive plan (the “Plan”) in November 1996 and has reserved 1,500,000 shares of Common Stock for issuance under the Plan. All options issued to management under the Plan are recommended to the Board of Directors by the Compensation Committee and approved by the Board of Directors. All awards issued to the Company’s non-employee members of the Board of Directors under the Plan are recommended to the Board of Directors by the Compensation Committee and approved by the Board of Directors. Stock options granted to non-employee directors are granted on the third business day following the annual shareholders' meeting. All options are exercisable at a price equal to the fair market value of the Company’s Common Stock on the date of grant.
Options granted prior to fiscal 2003 were subject to a proportional four-year vesting schedule and expire eight years from the grant date. Beginning in fiscal 2003, option grants are subject to a five-year cliff-vesting schedule under which options become fully vested or exercisable after five years from the date of grant and expire ten years after the grant date. Options granted to the Company’s non-employee Board of Directors (the “Directors”) are fully vested as of the date of grant. Prior to fiscal 2008, non-employee director grants expired ten years from the grant date. Beginning in fiscal 2008, non-employee director grants expire eight years after the grant date.
US GAAP requires that share-based compensation cost be measured at the grant date based on the value of the award and be recognized as expense over the requisite service period, which is generally the vesting period. Determining the fair value of share-based awards at the grant date requires judgment, including estimating expected dividends, share price volatility and the amount of share-based awards that are expected to be forfeited. The fair value of each option grant is estimated on the date of grant using the Black-Scholes option pricing model.
Compensation expense for all option grants is recognized ratably over the related vesting period. Certain options were granted during fiscal 2010, 2009 and 2008 to non-employee Directors of the Company, which were fully vested upon grant and expire eight years after the grant date. Accordingly, compensation expense related to these option grants in fiscal 2010, 2009 and 2008 were recognized on the date of grant.
In both fiscal 2010 and 2009, a total of 12,000 shares of restricted stock were granted to the Company’s non-employee Directors subject to vesting in full one year from the date of grant.
On April 5, 2010, the Company entered into a Restricted Stock Award Agreement (the “Performance Criteria Restricted Stock Award Agreement”) with its Chief Executive Officer (“CEO”) pursuant to which the Company granted 350,000 shares (the “Performance Restricted Shares”) of restricted common stock to the CEO. The Performance Restricted Shares will be earned if the Company achieves certain consolidated revenues and adjusted operating margins as set forth in the Performance Criteria Restricted Stock Award Agreement during certain performance periods set forth in such agreement (collectively, the “Performance Criteria”). The Performance Restricted Shares earned upon achievement of the Performance Criteria will vest in four equal amounts on the third, fourth, fifth and sixth anniversaries of the grant date provided that the CEO continues to be employed by the Company on each such date. As the Company believes that it is probable that the Performance Criteria will be met, compensation expense began being recognized as of the grant date of these shares. As required by accounting rules, the Company will recognize compensation expense for each vesting tranche of the Performance Restricted Shares ratably from the service inception date to the vesting date for each tranche.
Also on April 5, 2010, the Company entered into a Restricted Stock Award Agreement (the “Restricted Stock Award Agreement”) with the CEO pursuant to which the Company granted 50,000 shares (the “Restricted Shares”) of restricted common stock to the CEO. The Restricted Shares will vest in equal amounts on each of the first six anniversaries of the grant date provided that the CEO continues to be employed by the Company on each such date. Compensation expense related to the Restricted Shares will be recognized ratably over the vesting period.
The fair value for each restricted stock grant is determined by using the closing price of our stock on the date of the grant. For the Performance Criteria Restricted Stock Award Agreement and the Restricted Stock Award Agreement, the fair value of the restricted shares was the closing price on April 5, 2010, which was $51.39.
Share-based compensation, which includes stock option grants and restricted stock grants, has been recorded in the Consolidated Statements of Income in selling and administrative expenses.
Refer to Note 12, “Share-based Compensation”, of these Consolidated Financial Statements for further discussion regarding the Company’s share-based compensation plans.
The fair value of each option grant is estimated on the date of grant using the Black-Scholes option pricing model with the following weighted average assumptions used:
|
Fiscal year ended August
|
2010
|
2009
|
2008
|
|||||||||
|
Risk-free interest rate
|
2.97 | % | 2.82 | % | 4.06 | % | ||||||
|
Expected dividend yield
|
0.62 | % | 0.76 | % | 0.70 | % | ||||||
|
Expected life in years
|
7.39 | 7.34 | 7.50 | |||||||||
|
Expected volatility
|
39.3 | % | 38.6 | % | 38.5 | % | ||||||
The weighted average fair values of options granted during fiscal years 2010, 2009 and 2008 were $18.86, $11.43 and $16.99, respectively.
Foreign Currency Translation
The functional currency of our foreign operations is the local country’s currency. Transaction gains and losses, including gains and losses on our intercompany transactions, are included in other expense (income), in the accompanying Consolidated Statements of Income. Assets and liabilities of operations outside the United States are translated into U.S. dollars using period-end exchange rates. Revenues and expenses are translated at the average exchange rates in effect during each month of the fiscal year. The effects of foreign currency translation adjustments are included in shareholders’ equity as a component of accumulated other comprehensive income (loss) in the accompanying Consolidated Balance Sheets.
Reclassifications
Certain prior year amounts have been reclassified to conform to current year presentation. These reclassifications did not impact current or historical net income or shareholders’ equity.
Recent Accounting Pronouncements
In June 2008, the Financial Accounting Standards Board (the "FASB") issued revised guidance which clarifies whether instruments granted in share-based payment transactions are participating securities prior to vesting and therefore, need to be included in the earnings allocation in computing earnings per share (“EPS”). The Company adopted the revised guidance on August 30, 2009. See “Net Income Per Share”, under this Note 1 for more discussion on this revised guidance and the Company’s EPS calculations.
In June 2009, the FASB approved its Accounting Standards Codification, (the “Codification”), as the single source of authoritative United States accounting and reporting standards applicable for all non-governmental entities, with the exception of the SEC and its staff. The Codification, which changes the referencing of financial standards, was effective for interim or annual financial periods ending after September 15, 2009. Therefore, starting in the Company’s first quarter of fiscal 2010, any references made to US GAAP use the new Codification numbering system prescribed by the FASB. The Codification was not intended to change or alter existing US GAAP and, as a result, it did not have any impact on the Company’s Consolidated Financial Statements.
In January 2010, the FASB issued revised guidance which requires additional disclosures about items transferring into and out of Levels 1 and 2 measurements in the fair value hierarchy. The revised guidance also requires additional separate disclosures about purchases, sales, issuances, and settlements relative to Level 3 measurements, and clarifies, among other things, the existing fair value disclosures about the level of disaggregation. This pronouncement was effective for interim and annual financial periods beginning after December 15, 2009, except for the disclosures about purchases, sales, issuances, and settlements relative to Level 3 measurements, which are effective for interim and annual financial periods beginning after December 15, 2010. The Company partially adopted this revised guidance on February 28, 2010, as required, and the adoption did not have a material impact on the Company’s Consolidated Financial Statements. The Company also does not expect the adoption of the delayed portion of the revised guidance to have a material impact on its Consolidated Financial Statements.
2. Acquisitions
During the fiscal year ended August 28, 2010, the Company completed 9 acquisitions with an aggregate purchase price of approximately $20.9 million. The results of operations of these acquisitions have been included in the Company’s consolidated financial results since their respective acquisition dates. None of these acquisitions was significant in relation to the Company’s consolidated financial results and, therefore, pro forma financial information has not been presented.
Aggregate information relating to the acquisition of businesses which were accounted for as purchases is as follows (in thousands, except number of businesses acquired):
|
Year ended
|
August 28,
2010
|
August 29,
2009
|
August 30,
2008
|
|||||||||
|
Number of businesses acquired
|
9
|
12
|
14
|
|||||||||
|
Tangible assets acquired
|
$
|
3,795
|
$
|
467
|
$
|
12,679
|
||||||
|
Intangible assets and goodwill acquired
|
17,113
|
4,263
|
48,588
|
|||||||||
|
Liabilities assumed
|
—
|
—
|
(315
|
)
|
||||||||
|
Acquisition of businesses
|
$
|
20,908
|
$
|
4,730
|
$
|
60,952
|
||||||
Tangible assets acquired primarily relate to accounts receivable, inventory and property, plant and equipment. Liabilities assumed primarily relate to accounts payable and accrued liabilities.
The following details the changes in intangible assets and goodwill, which includes changes related to additional payments associated with prior year acquisitions as well as changes to purchase allocations that had not been finalized as of the end of the prior fiscal year, for the years ended August 28, 2010 and August 29, 2009 as well as the respective periods over which the assets will be amortized on a straight-line basis (in thousands):
|
Year ended
|
August 28,
2010
|
August 29,
2009
|
Life in
Years
|
||||||||
|
Goodwill
|
$
|
10,584
|
$
|
2,475
|
N/A
|
||||||
|
Customer contracts
|
6,008
|
1,624
|
10-15
|
||||||||
|
Other intangible assets
|
521
|
164
|
3-8
|
||||||||
|
Total intangible assets and goodwill acquired
|
$
|
17,113
|
$
|
4,263
|
|||||||
The amount assigned to intangible assets acquired was based on their respective fair values determined as of the acquisition date. The excess of the purchase price over the tangible and intangible assets was recorded as goodwill. In 2010, all of the goodwill was allocated to the US and Canadian Rental and Cleaning segment. In 2009, of the $2.5 million in goodwill that was recorded, $1.9 million was allocated to the US and Canadian Rental and Cleaning segment and the remaining $0.6 million was allocated to First Aid. Goodwill is not being amortized and is tested for impairment as required, at least annually.
3. Fair Value Measurements
US GAAP establishes a framework for measuring fair value and establishes disclosure requirements about fair value measurements. Fair value is defined as the price that would be received to sell an asset or paid to transfer a liability (an exit price) in the principal or most advantageous market for the asset or liability in an orderly transaction between market participants on the measurement date. We considered non-performance risk when determining fair value of our derivative financial instruments. The fair value hierarchy prescribed under US GAAP contains three levels as follows:
|
Level 1 –
|
Quoted prices in active markets for identical assets or liabilities.
|
|
Level 2 –
|
Observable inputs other than quoted prices included in Level 1, such as quoted prices for similar assets and liabilities in active markets; quoted prices for identical or similar assets and liabilities in markets that are not active; or other inputs that are observable or can be corroborated by observable market data.
|
|
Level 3 –
|
Unobservable inputs that are supported by little or no market activity and that are significant to the fair value of the assets or liabilities. This includes certain pricing models, discounted cash flow methodologies and similar techniques that use significant unobservable inputs.
|
All financial assets or liabilities that are measured at fair value on a recurring basis (at least annually) have been segregated into the most appropriate level within the fair value hierarchy based on the inputs used to determine the fair value at the measurement date. The assets or liabilities measured at fair value on a recurring basis are summarized in the table below (in thousands):
|
As of August 28, 2010
|
||||||||||||
|
Level 1
|
Level 2
|
Level 3
|
Fair Value
|
|||||||||
|
Assets:
|
||||||||||||
|
Cash equivalents
|
$
|
28,668
|
$
|
—
|
$
|
—
|
$
|
28,668
|
||||
|
Total
|
$
|
28,668
|
$
|
—
|
$
|
—
|
$
|
28,668
|
||||
|
Liabilities:
|
||||||||||||
|
Interest rate swap
|
$
|
—
|
$
|
1,627
|
$
|
—
|
$
|
1,627
|
||||
|
Total
|
$
|
—
|
$
|
1,627
|
$
|
—
|
$
|
1,627
|
||||
4. Income Taxes
The provision for income taxes consists of the following (in thousands):
|
Year ended
|
August 28,
2010
|
August 29,
2009
|
August 30,
2008
|
|||||||||
|
Current:
|
||||||||||||
|
Federal
|
$ | 34,373 | $ | 37,843 | $ | 26,915 | ||||||
|
Foreign
|
4,336 | 3,835 | 4,708 | |||||||||
|
State
|
6,871 | 7,886 | 4,895 | |||||||||
|
Total current
|
45,580 | 49,564 | 36,518 | |||||||||
|
Deferred:
|
||||||||||||
|
Federal
|
154 | 1,769 | 1,148 | |||||||||
|
Foreign
|
366 | (563 | ) | (133 | ) | |||||||
|
State
|
344 | (157 | ) | 188 | ||||||||
|
Total deferred
|
864 | 1,049 | 1,203 | |||||||||
|
Total
|
$ | 46,444 | $ | 50,613 | $ | 37,721 | ||||||
The following table reconciles the provision for income taxes using the statutory federal income tax rate to the actual provision for income taxes (in thousands):
|
August 28,
2010
|
August 29,
2009
|
August 30,
2008
|
||||||||||
|
Income taxes at the statutory federal income tax rate
|
$ | 42,998 | $ | 44,263 | $ | 34,545 | ||||||
|
State income taxes
|
4,690 | 5,024 | 3,303 | |||||||||
|
Adjustments to tax reserves
|
(854 | ) | 1,288 | (598 | ) | |||||||
|
Permanent and other
|
(390 | ) | 38 | 471 | ||||||||
|
Total
|
$ | 46,444 | $ | 50,613 | $ | 37,721 | ||||||
The tax effect of items giving rise to the Company’s deferred tax (assets) liabilities is as follows (in thousands):
|
Year ended
|
August 28,
2010
|
August 29,
2009
|
August 30,
2008
|
|||||||||
|
Rental merchandise in service
|
$ | 11,511 | $ | 8,364 | $ | 13,498 | ||||||
|
Tax in excess of book depreciation
|
33,014 | 35,140 | 27,393 | |||||||||
|
Purchased intangible assets
|
22,167 | 20,198 | 18,467 | |||||||||
|
Accruals and other
|
(38,924 | ) | (36,488 | ) | (31,844 | ) | ||||||
|
Net deferred tax liabilities
|
$ | 27,768 | $ | 27,214 | $ | 27,514 | ||||||
The Company has evaluated its deferred tax assets and believes that they will be fully recovered. As a result, the Company has not established a valuation allowance.
As of August 28, 2010 and August 29, 2009, there was $3.0 million and $3.9 million, respectively, in total unrecognized tax benefits, which if recognized, would favorably impact the Company’s effective tax rate. The Company recognizes interest and penalties related to uncertain tax positions as a component of income tax expense which is consistent with the recognition of these items in prior reporting periods. As of August 28, 2010 and August 29, 2009, the Company had accrued a total of $1.5 million and $1.7 million in interest and penalties, respectively, in its long-term accrued liabilities. For the year ended August 28, 2010, the Company recognized a benefit in its Consolidated Statement of Income related to interest and penalties totaling $0.3 million. For the years ended August 29, 2009 and August 30, 2008, the Company recognized expense in its Consolidated Statements of Income related to interest and penalties totaling $0.6 million and $0.1 million, respectively.
A reconciliation of the beginning and ending amount of unrecognized tax benefits is as follows (in thousands):
|
Balance at August 30, 2008
|
$
|
3,042
|
||
|
Additions based on tax positions related to the current year
|
475
|
|||
|
Additions for tax positions of prior years
|
3,864
|
|||
|
Reductions for tax positions of prior years
|
(738
|
)
|
||
|
Statute expirations
|
(1,665
|
)
|
||
|
Balance at August 29, 2009
|
$
|
4,978
|
||
|
Additions based on tax positions related to the current year
|
184
|
|||
|
Additions for tax positions of prior years
|
199
|
|||
|
Statute expirations
|
(1,805
|
)
|
||
|
Balance at August 28, 2010
|
$
|
3,556
|
The Company has a significant portion of its operations in the United States and Canada. It is required to file federal income tax returns as well as state income tax returns in a majority of the U.S. states and also in the Canadian provinces of Alberta, British Columbia, Ontario, Saskatchewan and Quebec. At times, the Company is subject to audits in these jurisdictions, which typically are inherently complex and can require several years to resolve. The final resolution of any such tax audit could result in either a reduction in the Company’s accruals or an increase in its income tax provision, both of which could have a material impact on the consolidated results of operations in any given period.
All U.S. and Canadian federal income tax examinations have substantially concluded through fiscal years 2006 and 2003, respectively. With a few exceptions, the Company is no longer subject to state and local income tax examinations for periods prior to fiscal 2005. The Company is not aware of any tax positions for which it is reasonably possible that the total amounts of unrecognized tax benefits will change significantly in the next 12 months.
The Company has undistributed earnings of its international subsidiaries that it considers indefinitely reinvested and therefore has not provided for U.S. income taxes that could result from any future distribution of such earnings to the U.S. parent. If these earnings were ultimately distributed to the U.S. in the form of dividends or otherwise, or if the shares of its international subsidiaries were sold or transferred, the Company would likely be subject to additional U.S. income taxes, net of the impact of any available foreign tax credits. It is not practicable to estimate the amount of unrecognized deferred U.S. taxes on these undistributed earnings.
5. Long-term Debt
Long-term debt outstanding on the accompanying Consolidated Balance Sheets are as follows (in thousands):
|
August 28,
2010
|
August 29,
2009
|
|||||||
|
Series A, fixed rate notes due June 2011 bearing interest at 5.27%
|
$ | 75,000 | $ | 75,000 | ||||
|
Series D, floating rate notes due September 2013 bearing interest at LIBOR plus 50 basis points bearing interest at 1.04% and 1.13% as of August 28, 2010 and August 29, 2009, respectively.
|
100,000 | 100,000 | ||||||
|
Other
|
6,464 | 7,015 | ||||||
|
Current maturities of long-term debt
|
181,464 | 182,015 | ||||||
|
Less - current maturities
|
81,160 | 6,447 | ||||||
| $ | 100,304 | $ | 175,568 | |||||
Aggregate current maturities of long-term debt for the five fiscal years subsequent to August 28, 2010 and thereafter are as follows (in thousands):
|
2011
|
$ | 81,160 | ||
|
2012
|
142 | |||
|
2013
|
— | |||
|
2014
|
100,000 | |||
|
2015
|
— | |||
|
Thereafter
|
162 | |||
|
Total
|
$ | 181,464 |
The Company has a $225.0 million unsecured revolving credit agreement (“Credit Agreement”) with a syndicate of banks, which matures on September 13, 2011. Under the Credit Agreement, the Company is able to borrow funds at variable interest rates based on the Eurodollar rate or the bank’s prime rate, as selected by the Company. Availability of credit requires compliance with certain financial and other covenants, including a maximum funded debt ratio and minimum interest coverage as defined in the Credit Agreement. The Company generally tests its compliance with these financial covenants on a fiscal quarterly basis. At August 28, 2010, the interest rates applicable to any of the Company’s borrowings under the Credit Agreement would be calculated as LIBOR plus 50 basis points at the time of the respective borrowing. As of August 28, 2010, the Company had no outstanding borrowings, letters of credit of $35.9 million, and $189.1 million available for borrowing.
On June 14, 2004, the Company issued $75.0 million of fixed rate notes pursuant to a Note Purchase Agreement (“Note Agreement”) with a seven year term (June 2011) and bearing interest at 5.27%. The Company also issued $90.0 million of floating rate notes which were repaid in September 2005 and September 2006.
On September 14, 2006, the Company issued $100.0 million of floating rates notes (“Floating Rate Notes”) pursuant to a Note Purchase Agreement (“2006 Note Agreement”). The Floating Rate Notes mature on September 14, 2013, bear interest at LIBOR plus 50 basis points and may be repaid at face value two years from the date of issuance. The proceeds from the issuance of the Floating Rate Notes were used to first repay the outstanding floating rate notes under the Note Agreement in the amount of $75.0 million and then to pay down outstanding amounts under the Credit Agreement.
As of August 28, 2010, the Company was in compliance with all covenants under the Credit Agreement, the Note Agreement and the 2006 Note Agreement.
6. Derivative Instruments and Hedging Activities
All derivative financial instruments are recognized at fair value and are recorded in accrued liabilities in the Company’s Consolidated Balance Sheets. In January 2008, the Company entered into an interest rate swap agreement to manage its exposure to interest rate movements and the related effect on its variable rate debt. The Company concluded that the interest rate swap met the criteria to qualify as a cash flow hedge under US GAAP. Accordingly, the Company has reflected all changes in the fair value of the swap agreement in accumulated other comprehensive income (loss), a component of shareholders’ equity. The swap agreement, with a notional amount of $100.0 million, matures on March 14, 2011. The Company pays a fixed rate of 3.51% and receives a variable rate tied to the three month LIBOR rate.
As of August 28, 2010, the Company had recorded the fair value of the interest rate swap of $1.6 million in accrued liabilities and a corresponding loss of $1.0 million in accumulated other comprehensive income (loss), which was net of the associated tax benefit. As of August 29, 2009, the amounts recorded in accrued liabilities and other comprehensive income were $3.6 million and $2.2 million, respectively. The $1.0 million loss deferred in accumulated other comprehensive income (loss) as of August 28, 2010 is expected to be reclassified to interest expense prior to its maturity on March 14, 2011.
The Company has recorded any realized gains or losses from its interest rate swap as an adjustment to interest expense in its Consolidated Statements of Income. For the fiscal years ended August 28, 2010 and August 29, 2009, the Company reclassified a loss from accumulated other comprehensive income (loss) into interest expense totaling $3.2 million and $1.7 million, respectively.
Defined Contribution Retirement Savings Plan
The Company has a defined contribution retirement savings plan with a 401(k) feature for all eligible employees not under collective bargaining agreements. The Company matches a portion of the employee’s contribution and can make an additional contribution at its discretion. Contributions charged to expense under the plan for the years ended August 28, 2010, August 29, 2009 and August 30, 2008 were $11.0 million, $13.6 million and $10.9 million, respectively.
Pension Plans and Supplemental Executive Retirement Plans
The Company accounts for its pension plans and Supplemental Executive Retirement Plan on an accrual basis over employees’ estimated service periods.
The Company (1) recognizes in its statement of financial position the over-funded or under-funded status of its defined benefit postretirement plans measured as the difference between the fair value of plan assets and the benefit obligation, (2) recognizes as a component of other comprehensive income, net of tax, the actuarial gains and losses and the prior service costs and credits that arise during the period but are not recognized as components of net periodic benefit cost, (3) measures defined benefit plan assets and defined benefit plan obligations as of the date of its statement of financial position, and (4) discloses additional information in the notes to financial statements about certain effects on net periodic benefit cost in the upcoming fiscal year that arise from delayed recognition of the actuarial gains and losses and the prior service costs and credits.
The Company maintains an unfunded Supplemental Executive Retirement Plan (“SERP”) for certain eligible employees of the Company. The benefits are based on the employee’s compensation upon retirement. The amount charged to expense related to this plan amounted to approximately $1.5 million, $1.5 million and $1.2 million for the fiscal years ended 2010, 2009 and 2008, respectively.
The Company maintains a non-contributory defined pension plan (“UniFirst Plan”) covering union employees at one of its locations. The benefits are based on years of service and the employees’ compensation. The plan assets primarily consist of fixed income and equity securities. The amount charged to expense related to this plan amounted to approximately $0.3 million, $0.2 million and $0.2 million for fiscal years ended 2010, 2009 and 2008, respectively.
In connection with one of the Company’s acquisitions, the Company assumed liabilities related to a frozen pension plan covering many of the acquired Company’s former employees (“Textilease Plan”). The pension benefits are based on years of service and the employee’s compensation. The plan assets primarily consist of fixed income and equity securities. The amounts charged to expense related to this plan amounted to approximately $0.1 million for each of the fiscal years ended 2010, 2009 and 2008.
The Company refers to its UniFirst Plan and its Textilease Plan collectively as its “Pension Plans”.
The components of net periodic benefit cost related to the Company’s Pension Plans and SERP for the years ended August 28, 2010, August 29, 2009 and August 30, 2008 were as follows (in thousands):
|
Pension Plans
|
SERP
|
|||||||||||||||||||||||
|
2010
|
2009
|
2008
|
2010
|
2009
|
2008
|
|||||||||||||||||||
|
Service cost
|
$ | 136 | $ | 135 | $ | 115 | $ | 391 | $ | 364 | $ | 334 | ||||||||||||
|
Interest cost
|
351 | 346 | 311 | 702 | 643 | 539 | ||||||||||||||||||
|
Expected return on assets
|
(191 | ) | (243 | ) | (244 | ) | — | — | — | |||||||||||||||
|
Amortization of prior service cost
|
62 | 62 | 21 | 368 | 368 | 368 | ||||||||||||||||||
|
Amortization of unrecognized loss
|
20 | 13 | 4 | 54 | 77 | — | ||||||||||||||||||
|
Other events
|
— | — | 36 | — | — | — | ||||||||||||||||||
|
Net periodic benefit cost
|
$ | 378 | $ | 313 | $ | 243 | $ | 1,515 | $ | 1,452 | $ | 1,241 | ||||||||||||
The calculation of pension expense and the corresponding liability requires the use of a number of critical assumptions, including the expected long-term rate of return on plan assets and the assumed discount rate. Changes in these assumptions can result in different expense and liability amounts, and future actual experience can differ from these assumptions. Pension expense increases as the expected rate of return on pension plan assets decreases. Future changes in plan asset returns, assumed discount rates and various other factors related to the participants in the Company’s pension plans will impact its future pension expense and liabilities. The Company cannot predict with certainty what these factors will be in the future.
The Company’s obligations and funded status related to its Pension Plans and SERP as of August 28, 2010 and August 29, 2009 were as follows (in thousands):
|
Pension Plans
|
SERP
|
|||||||||||||||
|
2010
|
2009
|
2010
|
2009
|
|||||||||||||
|
Change in benefit obligation:
|
||||||||||||||||
|
Projected benefit obligation, beginning of year
|
$ | 6,205 | $ | 5,913 | $ | 11,925 | $ | 11,255 | ||||||||
|
Service cost
|
136 | 135 | 391 | 364 | ||||||||||||
|
Interest cost
|
351 | 346 | 702 | 643 | ||||||||||||
|
Actuarial (gain) loss
|
921 | 37 | 1,355 | (32 | ) | |||||||||||
|
Benefits paid
|
(274 | ) | (226 | ) | (386 | ) | (305 | ) | ||||||||
|
Projected benefit obligation, end of year
|
$ | 7,339 | $ | 6,205 | $ | 13,987 | $ | 11,925 | ||||||||
|
Change in plan assets:
|
||||||||||||||||
|
Fair value of plan assets, beginning of year
|
$ | 5,050 | $ | 4,995 | $ | — | $ | — | ||||||||
|
Actual return on plan assets
|
331 | 148 | — | — | ||||||||||||
|
Employer contributions
|
156 | 133 | — | — | ||||||||||||
|
Benefits paid
|
(274 | ) | (226 | ) | — | — | ||||||||||
|
Fair value of plan assets, end of year
|
$ | 5,263 | $ | 5,050 | $ | — | $ | — | ||||||||
|
Funded status (net amount recognized):
|
$ | (2,076 | ) | $ | (1,155 | ) | $ | (13,987 | ) | $ | (11,925 | ) | ||||
As of August 28, 2010 and August 29, 2009, the accumulated benefit obligations for the Company’s Pension Plans were $7.3 million and $6.2 million, respectively. As of August 28, 2010 and August 29, 2009, the accumulated benefit obligations for the Company’s SERP were $10.9 million and $9.3 million, respectively.
The amounts recorded on the Consolidated Balance Sheet for the Company’s Pension Plans and SERP as of August 28, 2010 and August 29, 2009 were as follows (in thousands):
|
Pension Plans
|
SERP
|
|||||||||||||||
|
2010
|
2009
|
2010
|
2009
|
|||||||||||||
|
Deferred tax assets
|
$ | 842 | $ | 569 | $ | 1,991 | $ | 1,722 | ||||||||
|
Accrued liabilities
|
$ | 2,076 | $ | 1,155 | $ | 13,987 | $ | 11,925 | ||||||||
|
Accumulated other comprehensive loss
|
$ | (1,317 | ) | $ | (891 | ) | $ | (3,114 | ) | $ | (2,694 | ) | ||||
As of August 28, 2010 and August 29, 2009, the amounts recognized in accumulated other comprehensive income for the Company’s Pension Plans and SERP (in thousands):
|
Pension Plans
|
SERP
|
|||||||||||||||
|
2010
|
2009
|
2010
|
2009
|
|||||||||||||
|
Net actuarial loss
|
$ | (948 | ) | $ | (484 | ) | $ | (1,380 | ) | $ | (1,604 | ) | ||||
|
Unrecognized prior service cost
|
(369 | ) | (407 | ) | (1,734 | ) | (1,090 | ) | ||||||||
| $ | (1,317 | ) | $ | (891 | ) | $ | (3,114 | ) | $ | (2,694 | ) | |||||
The weighted average assumptions used in calculating the Company’s projected benefit obligation as of August 28, 2010 and August 29, 2009, were as follows:
|
Pension Plans
|
SERP
|
|||||||||||||||
|
2010
|
2009
|
2010
|
2009
|
|||||||||||||
|
Discount rate
|
4.7 | % | 5.9 | % | 4.8 | % | 5.7 | % | ||||||||
| N/A | N/A | 5.0 | % | 5.0 | % | |||||||||||
The weighted average assumptions used in calculating the Company’s net periodic service cost for the years ended August 28, 2010, August 29, 2009 and August 30, 2008, were as follows:
|
Pension Plans
|
SERP
|
|||||||||||||||||||||||
|
2010
|
2009
|
2008
|
2010
|
2009
|
2008
|
|||||||||||||||||||
|
Discount rate
|
5.8
|
% | 6.0 | % | 6.0 | % | 5.7 | % | 6.0 | % | 6.0 | % | ||||||||||||
|
Expected return on plan assets
|
4.0 | % | 5.0 | % | 5.0 | % | N/A | N/A | N/A | |||||||||||||||
|
Rate of compensation increase
|
N/A | N/A | N/A | 5.0 | % | 5.0 | % | 5.0 | % | |||||||||||||||
8. Goodwill and Other Intangible Assets
The Company no longer amortizes goodwill, but it is reviewed annually or more frequently if certain indicators arise, for impairment. There were no impairment losses related to goodwill or intangible assets during the years ended August 28, 2010, August 29, 2009 or August 30, 2008.
The changes in the carrying amount of goodwill are as follows (in thousands):
|
Balance as of August 30, 2008
|
$
|
258,836
|
||
|
Goodwill acquired during the period
|
2,475
|
|||
|
Other
|
(140
|
)
|
||
|
Balance as of August 29, 2009
|
$
|
261,171
|
||
|
Goodwill acquired during the period
|
10,584
|
|||
|
Other
|
102
|
|||
|
Balance as of August 28, 2010
|
$
|
271,857
|
As of August 28, 2010, the Company has allocated $267.2 million, $4.1 million and $0.6 million of goodwill to its US and Canadian Rental and Cleaning, Specialty Garments and First Aid segments, respectively.
Intangible assets, net in the Company’s accompanying Consolidated Balance Sheets are as follows (in thousands):
|
Gross Carrying
Amount
|
Accumulated
Amortization
|
Net Carrying
Amount
|
||||||||||
|
August 28, 2010
|
||||||||||||
|
Customer contracts
|
$ | 133,209 | $ | 76,681 | $ | 56,528 | ||||||
|
Other intangible assets
|
26,927 | 24,418 | 2,509 | |||||||||
| $ | 160,136 | $ | 101,099 | $ | 59,037 | |||||||
|
August 29, 2009
|
||||||||||||
|
Customer contracts
|
$ | 125,112 | $ | 68,496 | $ | 56,616 | ||||||
|
Other intangible assets
|
26,360 | 22,922 | 3,438 | |||||||||
| $ | 151,472 | $ | 91,418 | $ | 60,054 | |||||||
Estimated amortization expense for the five fiscal years subsequent to August 28, 2010 and thereafter, based on intangible assets, net as of August 28, 2010 is as follows (in thousands):
|
2011
|
$ | 9,274 | |
|
2012
|
8,395 | ||
|
2013
|
7,577 | ||
|
2014
|
6,035 | ||
|
2015
|
5,596 | ||
|
Thereafter
|
22,160 | ||
| $ | 59,037 |
Accrued liabilities in the accompanying Consolidated Balance Sheet consists of the following (in thousands):
|
August 28,
2010
|
August 29,
2009
|
|||||||
|
Current liabilities:
|
||||||||
|
Payroll-related
|
$ | 28,809 | $ | 30,967 | ||||
|
Insurance related
|
29,134 | 23,031 | ||||||
|
Environmental related
|
3,888 | 4,852 | ||||||
|
Asset retirement obligations
|
8,899 | 8,584 | ||||||
|
Other
|
13,074 | 9,451 | ||||||
| $ | 83,804 | $ | 76,885 | |||||
|
Payroll-related
|
$ | 15,192 | $ | 12,586 | ||||
|
Environmental related
|
15,098 | 14,532 | ||||||
| $ | 30,290 | $ | 27,118 | |||||
|
Total accrued liabilities
|
$ | 114,094 | $ | 104,003 | ||||
10. Asset Retirement Obligations
Asset retirement obligations, generally applies to legal obligations associated with the retirement of long-lived assets that result from the acquisition, construction, development and/or the normal operation of a long-lived asset. Accordingly, the Company recognizes asset retirement obligations in the period in which they are incurred if a reasonable estimate of fair value can be made. The associated asset retirement costs are capitalized as part of the carrying amount of the long-lived asset. The Company continues to depreciate, on a straight-line basis, the amount added to property, plant and equipment and recognizes accretion expense in connection with the discounted liability over the various remaining lives which range from approximately one to thirty-four years.
The Company recognized as a liability the present value of the estimated future costs to decommission its nuclear laundry facilities. The estimated liability is based on historical experience in decommissioning nuclear laundry facilities, estimated useful lives of the underlying assets, external vendor estimates as to the cost to decommission these assets in the future, and federal and state regulatory requirements. The estimated current costs have been adjusted for the estimated impact of inflation at 3% per year. The liability has been discounted using credit-adjusted risk-free rates that range from approximately 5.7% to 7.5% over one to thirty-four years. Revisions to the liability could occur due to changes in the Company’s estimated useful lives of the underlying assets, estimated dates of decommissioning, changes in decommissioning costs, changes in federal or state regulatory guidance on the decommissioning of such facilities, or other changes in estimates. Changes due to revised estimates will be recognized by adjusting the carrying amount of the liability and the related long-lived asset if the assets are still in service, or charged to expense in the period if the assets are no longer in service.
A reconciliation of the Company’s asset retirement liabilities is as follows (in thousands):
|
August 28,
2010
|
August 29,
2009
|
|||||||
|
Beginning balance
|
$ | 8,584 | $ | 7,844 | ||||
|
Accretion expense
|
568 | 517 | ||||||
|
Asset retirement costs incurred
|
— | (104 | ) | |||||
|
Revisions in estimates
|
(253 | ) | 327 | |||||
|
Ending balance
|
$ | 8,899 | $ | 8,584 | ||||
As of August 28, 2010, the $8.9 million asset retirement obligation is included in accrued liabilities in the accompanying Consolidated Balance Sheet.
11. Commitments and Contingencies
Lease Commitments
The Company leases certain buildings and equipment from independent parties. Total rent expense on all leases was $6.3 million, $5.9 million and $5.7 million for the fiscal years ended 2010, 2009 and 2008, respectively. Annual minimum lease commitments for the five years subsequent to August 28, 2010 and thereafter are as follows (in thousands):
|
2011
|
$
|
4,326
|
|
2012
|
2,913
|
|
|
2013
|
2,028
|
|
|
2014
|
850
|
|
|
2015
|
602
|
|
|
Thereafter
|
733
|
|
|
$
|
11,452
|
Environmental and Legal Contingencies
The Company and its operations are subject to various federal, state and local laws and regulations governing, among other things, the generation, handling, storage, transportation, treatment and disposal of hazardous waste and other substances. In particular, industrial laundries use and must dispose of detergent waste water and other residues, and, in the past used perchloroethylene and other dry cleaning solvents. The Company is attentive to the environmental concerns surrounding the disposal of these materials and has, through the years, taken measures to avoid their improper disposal. In the past, the Company has settled, or contributed to the settlement of, actions or claims brought against the Company relating to the disposal of hazardous materials and there can be no assurance that the Company will not have to expend material amounts to remediate the consequences of any such disposal in the future.
US GAAP requires that a liability for contingencies be recorded when it is probable that a liability has occurred and the amount of the liability can be reasonably estimated. Significant judgment is required to determine the existence of a liability, as well as the amount to be recorded. The Company regularly consults with attorneys and outside consultants in its consideration of the relevant facts and circumstances before recording a contingent liability. Changes in enacted laws, regulatory orders or decrees, management’s estimates of costs, insurance proceeds, participation by other parties, the timing of payments and the input of outside consultants and attorneys based on changing legal or factual circumstances could have a material impact on the amounts recorded for environmental and other contingent liabilities.
Under environmental laws, an owner or lessee of real estate may be liable for the costs of removal or remediation of certain hazardous or toxic substances located on, or in, or emanating from, such property, as well as related costs of investigation and property damage. Such laws often impose liability without regard to whether the owner or lessee knew of, or was responsible for the presence of such hazardous or toxic substances. There can be no assurances that acquired or leased locations have been operated in compliance with environmental laws and regulations or that future uses or conditions will not result in the imposition of liability upon the Company under such laws or expose the Company to third-party actions such as tort suits. The Company continues to address environmental conditions under terms of consent orders negotiated with the applicable environmental authorities or otherwise with respect to sites located in or related to Woburn, Massachusetts, Somerville, Massachusetts, Springfield, Massachusetts, Uvalde, Texas, Stockton, California, three sites related to former operations in Williamstown, Vermont, as well as a number of additional locations that it acquired as part of its acquisition of Textilease Corporation in September 2003. In addition, the Company recently received a notice from the Maryland Department of Environment directing the Company to investigate potential contamination at its Landover, Maryland facility.
The Company has accrued certain costs related to the sites described above as it has been determined that the costs are probable and can be reasonably estimated. The Company continues to implement mitigation measures and to monitor environmental conditions at the Somerville, Massachusetts site. The Company also has potential exposure related to an additional parcel of land (the "Central Area") related to the Woburn, Massachusetts site discussed above. Currently, the consent decree for the Woburn site does not define or require any remediation work in the Central Area. The United States Environmental Protection Agency (the "EPA") has provided the Company and other signatories to the consent decree with comments on the design and implementation of groundwater and soil remedies at the Woburn site and investigation of environmental conditions in the Central Area. The Company met with EPA to discuss its comments, and the Company and another signatory to the consent decree subsequently submitted work plans to perform additional environmental investigations. Such work pursuant to these work plans has been initiated. The Company has accrued costs to perform certain work responsive to EPA's comments.
The Company routinely reviews and evaluates sites that may require remediation and monitoring and determines its estimated costs based on various estimates and assumptions. These estimates are developed using its internal sources or by third party environmental engineers or other service providers. Internally developed estimates are based on:
|
•
|
Management’s judgment and experience in remediating and monitoring the Company’s sites;
|
||
|
•
|
Information available from regulatory agencies as to costs of remediation and monitoring;
|
||
|
•
|
The number, financial resources and relative degree of responsibility of other potentially responsible parties (PRPs) who may be liable for remediation and monitoring of a specific site; and
|
||
|
•
|
The typical allocation of costs among PRPs.
|
||
There is usually a range of reasonable estimates of the costs associated with each site. The Company’s accruals reflect the amount within the range that constitutes its best estimate. Where it believes that both the amount of a particular liability and the timing of the payments are reliably determinable, the Company adjusts the cost in current dollars using a rate of 3% for inflation until the time of expected payment and discounts the cost to present value using risk-free rates of interest ranging from 3.5% to 4.2%.
For environmental liabilities that have been discounted, the Company includes interest accretion, based on the effective interest method, in selling and administrative expenses on the Consolidated Statements of Income. The changes to the Company’s environmental liabilities for the years ended August 28, 2010 and August 29, 2009 are as follows (in thousands):
|
Year ended
|
August 28,
2010
|
August 29,
2009
|
||||||
|
Beginning balance
|
$ | 19,384 | $ | 15,097 | ||||
|
Costs incurred for which reserves have been provided
|
(2,392 | ) | (2,755 | ) | ||||
|
Insurance proceeds received
|
216 | 168 | ||||||
|
Interest accretion
|
794 | 668 | ||||||
|
Changes in discount rates
|
865 | 153 | ||||||
|
Revisions in estimates
|
119 | 6,053 | ||||||
|
Ending balance
|
$ | 18,986 | $ | 19,384 | ||||
In fiscal 2010 and 2009, the Company made revisions in estimates related to its environmental reserves totaling $0.1 million and $6.1 million, respectively. The increase in fiscal 2009 was primarily due to ongoing investigation and remediation efforts at two of our environmental exposure sites.
Anticipated payments and insurance proceeds of currently identified environmental remediation liabilities as of August 28, 2010, for the next five fiscal years and thereafter, as measured in current dollars, are reflected below.
|
(In thousands)
|
2011
|
2012
|
2013
|
2014
|
2015
|
Thereafter
|
Total
|
|||||||||||||||||||||
|
Estimated costs – current dollars
|
$ | 4,046 | $ | 3,061 | $ | 1,806 | $ | 934 | $ | 804 | $ | 13,002 | $ | 23,653 | ||||||||||||||
|
Estimated insurance proceeds
|
(158 | ) | (180 | ) | (150 | ) | (180 | ) | (150 | ) | (2,047 | ) | (2,865 | ) | ||||||||||||||
|
Net anticipated costs
|
$ | 3,888 | $ | 2,881 | $ | 1,656 | $ | 754 | $ | 654 | $ | 10,955 | $ | 20,788 | ||||||||||||||
|
Effect of inflation
|
7,303 | |||||||||||||||||||||||||||
|
Effect of discounting
|
(9,105 | ) | ||||||||||||||||||||||||||
|
Balance as of August 28, 2010
|
$ | 18,986 | ||||||||||||||||||||||||||
Estimated insurance proceeds are primarily received from an annuity received as part of a legal settlement with an insurance company. Annual proceeds of approximately $0.3 million are deposited into an escrow account which funds remediation and monitoring costs for three sites related to former operations in Williamstown, Vermont. Annual proceeds received but not expended in the current year accumulate in this account and may be used in future years for costs related to this site through the year 2027. As of August 28, 2010, the balance in this escrow account, which is held in a trust and is not recorded in the Company’s Consolidated Balance Sheet, was approximately $3.0 million. Also included in estimated insurance proceeds are amounts the Company is entitled to receive pursuant to legal settlements as reimbursements from three insurance companies for estimated costs at the site in Uvalde, Texas.
The Company’s nuclear garment decontamination facilities are licensed by the Nuclear Regulatory Commission (“NRC”), or, in certain cases, by the applicable state agency, and are subject to regulation by federal, state and local authorities. There can be no assurance that such regulation will not lead to material disruptions in the Company’s garment decontamination business.
From time to time, the Company is also subject to legal proceedings and claims arising from the conduct of its business operations, including litigation related to charges for certain ancillary services on invoices, personal injury claims, customer contract matters, employment claims and environmental matters as described above.
While it is impossible to ascertain the ultimate legal and financial liability with respect to contingent liabilities, including lawsuits and environmental contingencies, the Company believes that the aggregate amount of such liabilities, if any, in excess of amounts accrued or covered by insurance, will not have a material adverse effect on the consolidated financial position and/or results of operations of the Company. It is possible, however, that future financial position or results of operations for any particular period could be materially affected by changes in the Company’s assumptions or strategies related to these contingencies or changes out of the Company’s control.
Other Contingent Liabilities
As security for certain agreements with the NRC and various state agencies related to the nuclear operations (see above) and certain insurance programs, the Company had standby irrevocable bank commercial letters of credit of $35.9 million and $36.5 million outstanding as of August 28, 2010 and August 29, 2009, respectively.
12. Share-based Compensation
The Company adopted a stock incentive plan (the “Plan”) in November 1996 and reserved 150,000 shares of Common Stock for issue under the Plan. In January 2002, the Company increased the number of shares of Common Stock reserved for issuance under the Plan to 450,000. Such increase was approved by the Company’s shareholders at the Company’s 2002 Annual meeting of Shareholders held on January 8, 2002. At the Company’s 2007 Annual Meeting of Shareholders held on January 9, 2007, the Company’s shareholders approved the Company’s increase in the number of shares of Common Stock reserved for issuance under the Plan to 800,000. At the Company’s 2010 Annual Meeting of Shareholders held on January 12, 2010, the Company’s shareholders approved the Company’s increase in the number of shares of Common Stock reserved for issuance under the Plan to 1,500,000. Options granted under the Plan, through August 28, 2010, are at a price equal to the fair market value of the Company’s Common Stock on the date of grant. Options granted prior to fiscal 2003 are subject to a proportional four-year vesting schedule and expire eight years from the grant date. Options granted beginning in fiscal 2003 and thereafter are subject to a five-year cliff-vesting schedule under which options become vested or exercisable after five years from date of grant and expire ten years after the grant date. Compensation expense for all option grants, whether proportional four-year vesting or five-year cliff-vesting, is recognized ratably over the related vesting period starting in fiscal 2006. Certain options were granted during fiscal 2010, 2009 and 2008 to non-employee members of the Board of Directors of the Company, which were fully vested upon grant and expire eight years after the grant date. Accordingly, compensation expense related to these option grants in fiscal 2010, 2009 and 2008 were recognized on the date of grant. In both fiscal 2010 and 2009, 12,000 shares of restricted stock were granted to the Company’s non-employee directors that were subject to a one-year vesting schedule.
On April 5, 2010, the Company entered into a Restricted Stock Award Agreement (the “Performance Criteria Restricted Stock Award Agreement”) with its Chief Executive Officer (“CEO”) pursuant to which the Company granted 350,000 shares (the “Performance Restricted Shares”) of restricted common stock to the CEO. The Performance Restricted Shares will be earned if the Company achieves certain consolidated revenues and adjusted operating margins as set forth in the Performance Criteria Restricted Stock Award Agreement during certain performance periods set forth in such agreement (collectively, the “Performance Criteria”). The Performance Restricted Shares earned upon achievement of the Performance Criteria will vest in four equal amounts on the third, fourth, fifth and sixth anniversaries of the grant date provided that the CEO continues to be employed by the Company on each such date. As the Company believes that it is probable that the Performance Criteria will be met, compensation expense began being recognized as of the grant date of these shares. As required by accounting rules, the Company will recognize compensation expense for each vesting tranche of the Performance Restricted Shares ratably from the service inception date to the vesting date for each tranche. Compensation expense related to the Performance Criteria Restricted Stock Award Agreement recognized in fiscal 2010 totaled $1.8 million.
Also on April 5, 2010, the Company entered into a Restricted Stock Award Agreement (the “Restricted Stock Award Agreement”) with the CEO pursuant to which the Company granted 50,000 shares (the “Restricted Shares”) of restricted common stock to the CEO. The Restricted Shares will vest in equal amounts on each of the first six anniversaries of the grant date provided that the CEO continues to be employed by the Company on each such date. Compensation expense related to the Restricted Shares will be recognized ratably over the vesting period. Compensation expense related to the Restricted Stock Award Agreement recognized in fiscal 2010 totaled $0.2 million.
Compensation expense for all share-based compensation for the five fiscal years subsequent to August 28, 2010 is as follows (in thousands):
|
2011
|
$
|
5,889
|
||
|
2012
|
5,484
|
|||
|
2013
|
4,621
|
|||
|
2014
|
3,099
|
|||
|
2015
|
1,764
|
|||
|
Total
|
$
|
20,857
|
As of August 28, 2010, the total compensation cost not yet recognized related to non-vested awards was approximately $21.1 million. The weighted average period over which this total compensation cost is to be recognized is approximately 4.2 years.
The following table summarizes the Common Stock option activity for the fiscal year ended August 28, 2010:
|
Number of
Shares
|
Weighted
Average
Exercise Price
|
|||||||
|
Outstanding, August 29, 2009
|
377,750 | $ | 31.76 | |||||
|
Granted
|
119,300 | 43.35 | ||||||
|
Exercised
|
(46,125 | ) | 25.49 | |||||
|
Forfeited
|
(3,625 | ) | 32.81 | |||||
|
Outstanding, August 28, 2010
|
447,300 | $ | 35.49 | |||||
|
Exercisable, August 28, 2010
|
96,500 | $ | 32.24 | |||||
The following table summarizes information relating to currently outstanding and exercisable stock options as of August 28, 2010:
|
Outstanding Options
|
Exercisable Options
|
|||||||||||||||||||||||||
|
Range of
Exercise Prices
|
Number
Outstanding
|
Weighted
Average
Remaining
Option
Life
|
Weighted
Average
Exercise
Price
|
Number
Exercisable
|
Weighted
Average
Remaining
Option
Life
|
Weighted
Average
Exercise
Price
|
||||||||||||||||||||
| $ | 19.93 – 24.35 | 22,600 | 2.84 | $ | 22.70 | 22,600 | 2.84 | $ | 22.70 | |||||||||||||||||
| 27.08 – 28.85 | 107,900 | 7.04 | 27.43 | 36,300 | 4.71 | 28.06 | ||||||||||||||||||||
| 33.13 – 38.96 | 190,500 | 6.26 | 36.40 | 20,100 | 6.55 | 36.93 | ||||||||||||||||||||
| 42.21 – 53.20 | 126,300 | 8.91 | 43.29 | 17,500 | 7.06 | 47.88 | ||||||||||||||||||||
| $ | 19.93 – 53.20 | 447,300 | 7.02 | $ | 35.49 | 96,500 | 5.08 | $ | 32.24 | |||||||||||||||||
The following table summarizes the status of the Company’s non-vested stock options at August 28, 2010:
|
Non-vested Options
|
||||||||
|
Number of
|
Weighted Average
|
|||||||
|
Shares
|
Exercise Price
|
|||||||
|
Non-vested at August 29, 2009
|
295,400
|
$
|
32.71
|
|||||
|
Granted
|
110,300
|
42.55
|
||||||
|
Vested
|
(51,400
|
)
|
28.73
|
|||||
|
Forfeited
|
(3,500
|
)
|
33.36
|
|||||
|
Non-vested at August 28, 2010
|
350,800
|
$
|
36.38
|
|||||
13. Shareholders’ Equity
The Company has two classes of common stock: Common Stock and Class B Common Stock. Each share of Common Stock is entitled to one vote, is freely transferable, and is entitled to a cash dividend equal to 125% of any cash dividend paid on each share of Class B Common Stock. Each share of Class B Common Stock is entitled to ten votes and can be converted to Common Stock on a share-for-share basis. However, until converted to Common Stock, shares of Class B Common Stock are not freely transferable. For the year ended August 28, 2010, a total of 20,000 shares of Class B Common Stock were converted to Common Stock.
14. Other Comprehensive Income (Loss)
The components of accumulated other comprehensive income (loss) are as follows (in thousands):
|
Foreign Currency Translation
|
Pension-
related
|
Interest Rate
Swap
|
Total Accumulated
Other Comprehensive
Income (Loss)
|
|||||||||||||
|
Balance, August 30, 2008
|
$ | 8,089 | (3,467 | ) | (188 | ) | 4,434 | |||||||||
|
Change during the year
|
(2,604 | ) | (117 | ) | (2,013 | ) | (4,734 | ) | ||||||||
|
Balance, August 29, 2009
|
5,485 | $ | (3,584 | ) | $ | (2,201 | ) | $ | (300 | ) | ||||||
|
Change during the year
|
1,801 | (847 | ) | 1,209 | 2,163 | |||||||||||
|
Balance, August 28, 2010
|
$ | 7,286 | $ | (4,431 | ) | $ | (992 | ) | $ | 1,863 | ||||||
15. Segment Reporting
Operating segments are identified as components of an enterprise for which separate discrete financial information is available for evaluation by the chief operating decision-maker, or decision-making group, in making decisions on how to allocate resources and assess performance. The Company’s chief operating decision maker is the Company’s chief executive officer. The Company has six operating segments based on the information reviewed by its chief executive officer; US Rental and Cleaning, Canadian Rental and Cleaning, Manufacturing ("MFG"), Corporate, Specialty Garments Rental and Cleaning ("Specialty Garments") and First Aid. The US Rental and Cleaning and Canadian Rental and Cleaning operating segments have been combined to form the US and Canadian Rental and Cleaning reporting segment, and as a result, the Company has five reporting segments.
The US and Canadian Rental and Cleaning reporting segment purchases, rents, cleans, delivers and sells, uniforms and protective clothing and non-garment items in the United States and Canada. The laundry locations of the US and Canadian Rental and Cleaning reporting segment are referred to by the Company as “industrial laundries” or “industrial laundry locations.”
The MFG operating segment designs and manufactures uniforms and non-garment items solely for the purpose of providing these goods to the US and Canadian Rental and Cleaning reporting segment. MFG revenues are generated when goods are shipped from the Company’s manufacturing facilities to other Company locations. These revenues are recorded at a transfer price which is typically in excess of the actual manufacturing cost. The transfer price is determined by management and may not necessarily represent the fair value of the products manufactured. Products are carried in inventory and subsequently placed in service and amortized at this transfer price. On a consolidated basis, intercompany revenues and income are eliminated and the carrying value of inventories and rental merchandise in service is reduced to the manufacturing cost. Income before income taxes from MFG net of the intercompany MFG elimination offsets the merchandise amortization costs incurred by the US and Canadian Rental and Cleaning reporting segment as the merchandise costs of this reporting segment are amortized and recognized based on inventories purchased from MFG at the transfer price which is above the Company’s manufacturing cost.
The Corporate operating segment consists of costs associated with the Company’s distribution center, sales and marketing, information systems, engineering, materials management, manufacturing planning, finance, budgeting, human resources, other general and administrative costs and interest expense. The revenues generated from the Corporate operating segment represent certain direct sales made by the Company directly from its distribution center. The products sold by this operating segment are the same products rented and sold by the US and Canadian Rental and Cleaning reporting segment. In the table below, no assets or capital expenditures are presented for the Corporate operating segment because no assets are allocated to this operating segment in the information reviewed by the chief executive officer. However, depreciation and amortization expense related to certain assets are reflected in income from operations and income before income taxes for the Corporate operating segment. The assets that give rise to this depreciation and amortization are included in the total assets of the US and Canadian Rental and Cleaning reporting segment as this is how they are tracked and reviewed by the Company. The majority of expenses accounted for within the Corporate segment relate to costs of the US and Canadian Rental and Cleaning segment, with the remainder of the costs relating to the Specialty Garment and First Aid segments.
The Specialty Garments operating segment purchases, rents, cleans, delivers and sells, specialty garments and non-garment items primarily for nuclear and cleanroom applications. The First Aid operating segment sells first aid cabinet services and other safety supplies.
The Company refers to the US and Canadian Rental and Cleaning, MFG, and Corporate reporting segments combined as its “core laundry operations,” which is included as a subtotal in the following tables (in thousands):
|
US and
|
||||||||||||||||||||||||
|
Canadian
|
Subtotal
|
|||||||||||||||||||||||
|
As of and for the year ended
|
Rental and
|
Net Interco
|
Core Laundry
|
Specialty
|
||||||||||||||||||||
|
August 28, 2010
|
Cleaning
|
MFG
|
MFG Elim
|
Corporate
|
Operations
|
Garments
|
First Aid
|
Total
|
||||||||||||||||
|
Revenues
|
$
|
899,791
|
$
|
99,256
|
$
|
(99,256
|
)
|
$
|
8,074
|
$
|
907,865
|
$
|
88,001
|
$
|
30,073
|
$
|
1,025,9399
|
|||||||
|
Income (loss) from operations
|
$
|
149,464
|
$
|
35,970
|
$
|
(5,982
|
)
|
$
|
(65,106
|
)
|
$
|
114,346
|
$
|
13,891
|
$
|
2,035
|
$
|
130,272
|
||||||
|
Interest (income) expense, net
|
$
|
(1,860
|
)
|
$
|
—
|
$
|
—
|
$
|
8,534
|
$
|
6,674
|
$
|
—
|
$
|
—
|
$
|
6,674
|
|||||||
|
Income (loss) before taxes
|
$
|
151,337
|
$
|
35,922
|
$
|
(5,982
|
)
|
$
|
(73,623
|
)
|
$
|
107,654
|
$
|
13,162
|
$
|
2,036
|
$
|
122,852
|
||||||
|
Depreciation and amortization
|
$
|
39,754
|
$
|
1,360
|
$
|
—
|
$
|
14,547
|
$
|
55,661
|
$
|
4,314
|
$
|
1,502
|
$
|
61,477
|
||||||||
|
Capital expenditures
|
$
|
43,652
|
$
|
3,288
|
$
|
—
|
$
|
—
|
$
|
46,940
|
$
|
2,981
|
$
|
94
|
$
|
50,015
|
||||||||
|
Total assets
|
$
|
978,738
|
$
|
22,777
|
$
|
—
|
$
|
—
|
$
|
1,001,515
|
$
|
70,222
|
$
|
20,558
|
$
|
1,092,295
|
||||||||
|
US and
|
||||||||||||||||||||||||
|
Canadian
|
Subtotal
|
|||||||||||||||||||||||
|
As of and for the year ended
|
Rental and
|
Net Interco
|
Core Laundry
|
Specialty
|
||||||||||||||||||||
|
August 29, 2009
|
Cleaning
|
MFG
|
MFG Elim
|
Corporate
|
Operations
|
Garments
|
First Aid
|
Total
|
||||||||||||||||
|
Revenues
|
$
|
904,902
|
$
|
86,139
|
$
|
(86,139
|
)
|
$
|
7,759
|
$
|
912,661
|
$
|
72,340
|
$
|
28,415
|
$
|
1,013,4166
|
|||||||
|
Income (loss) from operations
|
$
|
158,198
|
$
|
27,828
|
$
|
(420
|
)
|
$
|
(60,213
|
)
|
$
|
125,393
|
$
|
7,360
|
$
|
1,283
|
$
|
134,036
|
||||||
|
Interest (income) expense, net
|
$
|
(1,968
|
)
|
$
|
—
|
$
|
—
|
$
|
9,289
|
$
|
7,321
|
$
|
—
|
$
|
—
|
$
|
7,321
|
|||||||
|
Income (loss) before taxes
|
$
|
160,211
|
$
|
28,086
|
$
|
(420
|
)
|
$
|
(69,705
|
)
|
$
|
118,172
|
$
|
7,010
|
$
|
1,283
|
$
|
126,465
|
||||||
|
Depreciation and amortization
|
$
|
38,053
|
$
|
1,395
|
$
|
—
|
$
|
12,750
|
$
|
52,198
|
$
|
4,058
|
$
|
1,533
|
$
|
57,789
|
||||||||
|
Capital expenditures
|
$
|
58,378
|
$
|
151
|
$
|
—
|
$
|
—
|
$
|
58,529
|
$
|
6,505
|
$
|
289
|
$
|
65,323
|
||||||||
|
Total assets
|
$
|
900,186
|
$
|
10,052
|
$
|
—
|
$
|
—
|
$
|
910,238
|
$
|
70,748
|
$
|
21,113
|
$
|
1,002,099
|
||||||||
|
US and
|
||||||||||||||||||||||||
|
Canadian
|
Subtotal
|
|||||||||||||||||||||||
|
As of and for the year ended
|
Rental and
|
Net Interco
|
Core Laundry
|
Specialty
|
||||||||||||||||||||
|
August 30, 2008
|
Cleaning
|
MFG
|
MFG Elim
|
Corporate
|
Operations
|
Garments
|
First Aid
|
Total
|
||||||||||||||||
|
Revenues
|
$
|
911,044
|
$
|
91,834
|
$
|
(91,834
|
)
|
$
|
8,942
|
$
|
919,986
|
$
|
71,637
|
$
|
31,552
|
$
|
1,023,1751
|
|||||||
|
Income (loss) from operations
|
$
|
137,341
|
$
|
32,067
|
$
|
(2,632
|
)
|
$
|
(63,229
|
)
|
$
|
103,547
|
$
|
4,204
|
$
|
887
|
$
|
108,638
|
||||||
|
Interest (income) expense, net
|
$
|
(2,201
|
)
|
$
|
—
|
$
|
—
|
$
|
11,976
|
$
|
9,775
|
$
|
—
|
$
|
—
|
$
|
9,775
|
|||||||
|
Income (loss) before taxes
|
$
|
139,316
|
$
|
31,717
|
$
|
(2,632
|
)
|
$
|
(75,000
|
)
|
$
|
93,401
|
$
|
4,411
|
$
|
887
|
$
|
98,699
|
||||||
|
Depreciation and amortization
|
$
|
34,721
|
$
|
1,488
|
$
|
—
|
$
|
12,423
|
$
|
48,632
|
$
|
3,719
|
$
|
1,433
|
$
|
53,784
|
||||||||
|
Capital expenditures
|
$
|
64,046
|
$
|
572
|
$
|
—
|
$
|
—
|
$
|
64,618
|
$
|
8,678
|
$
|
499
|
$
|
73,795
|
||||||||
|
Total assets
|
$
|
881,712
|
$
|
11,691
|
$
|
—
|
$
|
—
|
$
|
893,403
|
$
|
68,282
|
$
|
19,982
|
$
|
981,667
|
||||||||
The Company’s long-lived assets as of August 28, 2010 and August 29, 2009 and revenues and income before income taxes for the years ended August 28, 2010, August 29, 2009 and August 30, 2008 were attributed to the following countries (in thousands):
|
Long-lived assets as of:
|
August 28, 2010
|
August 29, 2009
|
||||||
|
United States
|
$ | 671,689 | $ | 661,895 | ||||
|
Europe, Canada, and Mexico (1)
|
42,582 | 44,516 | ||||||
|
Total
|
$ | 714,271 | $ | 706,411 | ||||
|
Revenues for the year ended:
|
August 28, 2010
|
August 29, 2009
|
August 30, 2008
|
|||||||||
|
United States
|
$ | 932,477 | $ | 931,670 | $ | 928,811 | ||||||
|
Europe and Canada (1)
|
93,462 | 81,746 | 94,364 | |||||||||
|
Total
|
$ | 1,025,939 | $ | 1,013,416 | $ | 1,023,175 | ||||||
|
Income before income taxes for the year ended:
|
August 28, 2010
|
August 29, 2009
|
August 30, 2008
|
|||||||||
|
United States
|
$ | 107,344 | $ | 116,079 | $ | 84,214 | ||||||
|
Europe, Canada, and Mexico (1)
|
15,508 | 10,386 | 14,485 | |||||||||
|
Total
|
$ | 122,852 | $ | 126,465 | $ | 98,699 | ||||||
Report of Independent Registered Public Accounting Firm
The Board of Directors and Shareholders
UniFirst Corporation
We have audited the accompanying consolidated balance sheets of UniFirst Corporation and subsidiaries as of August 28, 2010 and August 29, 2009, and the related consolidated statements of income, shareholders' equity, and cash flows for each of the three years in the period ended August 28, 2010. Our audits also included the financial statement schedule listed in the Index at Item 15(a). These financial statements and schedule are the responsibility of the Company's management. Our responsibility is to express an opinion on these financial statements and schedule based on our audits.
We conducted our audits in accordance with the standards of the Public Company Accounting Oversight Board (United States). Those standards require that we plan and perform the audit to obtain reasonable assurance about whether the financial statements are free of material misstatement. An audit includes examining, on a test basis, evidence supporting the amounts and disclosures in the financial statements. An audit also includes assessing the accounting principles used and significant estimates made by management, as well as evaluating the overall financial statement presentation. We believe that our audits provide a reasonable basis for our opinion.
In our opinion, the financial statements referred to above present fairly, in all material respects, the consolidated financial position of UniFirst Corporation and subsidiaries at August 28, 2010 and August 29, 2009, and the consolidated results of their operations and their cash flows for each of the three years in the period ended August 28, 2010, in conformity with U.S. generally accepted accounting principles. Also, in our opinion, the related financial statement schedule, when considered in relation to the basic financial statements taken as a whole, presents fairly in all material respects the information set forth therein.
We also have audited, in accordance with the standards of the Public Company Accounting Oversight Board (United States), the UniFirst Corporation's internal control over financial reporting as of August 28, 2010, based on criteria established in Internal Control-Integrated Framework issued by the Committee of Sponsoring Organizations of the Treadway Commission and our report dated October 27, 2010 expressed an unqualified opinion thereon.
/s/ Ernst & Young LLP
Boston, Massachusetts
October 27, 2010
The following is a summary of the results of operations for each of the quarters within the years ended August 28, 2010 and August 29, 2009. This summary should be read in conjunction with these Consolidated Financial Statements and notes to Consolidated Financial Statements.
|
(In thousands, except per share data)
For the year ended August 28, 2010
|
First
Quarter
|
Second
Quarter
|
Third
Quarter
|
Fourth
Quarter
|
||||||||||||
|
Revenues
|
$ | 256,179 | $ | 253,562 | $ | 261,248 | $ | 254,950 | ||||||||
|
Income before income taxes
|
38,968 | 26,658 | 29,723 | 27,503 | ||||||||||||
|
Provision for income taxes
|
15,392 | 10,432 | 10,409 | 10,211 | ||||||||||||
|
Net income
|
$ | 23,576 | $ | 16,226 | $ | 19,314 | $ | 17,292 | ||||||||
|
Income per share – basic
|
||||||||||||||||
|
Common Stock
|
$ | 1.28 | $ | 0.88 | $ | 1.03 | $ | 0.92 | ||||||||
|
Class B Common Stock
|
$ | 1.03 | $ | 0.71 | $ | 0.83 | $ | 0.73 | ||||||||
|
Income per share – diluted
|
||||||||||||||||
|
Common Stock
|
$ | 1.21 | $ | 0.83 | $ | 0.98 | $ | 0.87 | ||||||||
|
Income allocated to – basic
|
||||||||||||||||
|
Common Stock
|
$ | 18,516 | $ | 12,750 | $ | 15,145 | $ | 13,536 | ||||||||
|
Class B Common Stock
|
$ | 5,060 | $ | 3,476 | $ | 3,949 | $ | 3,424 | ||||||||
|
Income allocated to – diluted
|
||||||||||||||||
|
Common Stock
|
$ | 23,576 | $ | 16,226 | $ | 19,106 | $ | 16,976 | ||||||||
|
Weighted average number of shares outstanding – basic
|
||||||||||||||||
|
Common Stock
|
14,440 | 14,467 | 14,645 | 14,751 | ||||||||||||
|
Class B Common Stock
|
4,932 | 4,931 | 4,766 | 4,663 | ||||||||||||
|
Weighted average number of shares outstanding – diluted
|
||||||||||||||||
|
Common Stock
|
19,434 | 19,477 | 19,490 | 19,472 | ||||||||||||
|
(In thousands, except per share data)
For the year ended August 29, 2009
|
First
Quarter
|
Second
Quarter
|
Third
Quarter
|
Fourth
Quarter
|
||||||||||||
|
Revenues
|
$ | 262,554 | $ | 257,285 | $ | 252,105 | $ | 241,472 | ||||||||
|
Income before income taxes
|
31,280 | 31,889 | 35,719 | 27,577 | ||||||||||||
|
Provision for income taxes
|
12,418 | 13,609 | 14,030 | 10,556 | ||||||||||||
|
Net income
|
$ | 18,862 | $ | 18,280 | $ | 21,689 | $ | 17,021 | ||||||||
|
Income per share – basic
|
||||||||||||||||
|
Common Stock
|
$ | 1.03 | $ | 1.00 | $ | 1.18 | $ | 0.93 | ||||||||
|
Class B Common Stock
|
$ | 0.82 | $ | 0.80 | $ | 0.95 | $ | 0.74 | ||||||||
|
Income per share – diluted
|
||||||||||||||||
|
Common Stock
|
$ | 0.97 | $ | 0.94 | $ | 1.12 | $ | 0.88 | ||||||||
|
Income allocated to – basic
|
||||||||||||||||
|
Common Stock
|
$ | 14,801 | $ | 14,344 | $ | 17,021 | $ | 13,361 | ||||||||
|
Class B Common Stock
|
$ | 4,061 | $ | 3,936 | $ | 4,668 | $ | 3,660 | ||||||||
|
Income allocated to – diluted
|
||||||||||||||||
|
Common Stock
|
$ | 18,862 | $ | 18,280 | $ | 21,689 | $ | 17,021 | ||||||||
|
Weighted average number of shares outstanding – basic
|
||||||||||||||||
|
Common Stock
|
14,390 | 14,389 | 14,394 | 14,408 | ||||||||||||
|
Class B Common Stock
|
4,935 | 4,935 | 4,935 | 4,933 | ||||||||||||
|
Weighted average number of shares outstanding – diluted
|
||||||||||||||||
|
Common Stock
|
19,362 | 19,354 | 19,376 | 19,415 | ||||||||||||
In the fourth quarter of fiscal 2009, the Company decreased its insurance reserves by $3.4 million resulting from its annual third-party actuarial review of its insurance reserve requirements. In addition, in the fourth quarter of fiscal 2009, the Company increased its environmental related accrual by $3.0 million due to additional information gathered from ongoing site investigations at two of its environmental exposure sites.
ITEM 9. CHANGES IN AND DISAGREEMENTS WITH ACCOUNTANTS ON ACCOUNTING AND FINANCIAL DISCLOSURE
ITEM 9A. CONTROLS AND PROCEDURES
Disclosure Controls and Procedures
As required by Rule 13a-15 under the Securities Exchange Act of 1934, as amended (the “Exchange Act”), we carried out an evaluation under the supervision and with the participation of our management, including our Chief Executive Officer and Chief Financial Officer, of the effectiveness of the design and operation of our disclosure controls and procedures as of the end of the period covered by this report. Based upon their evaluation, our Chief Executive Officer and Chief Financial Officer concluded that our disclosure controls and procedures are effective to ensure that material information relating to the Company required to be disclosed by the Company in reports we file or submit under the Exchange Act is recorded, processed, summarized and reported within the time periods specified in Securities and Exchange Commission rules and forms. In designing and evaluating the disclosure controls and procedures, our management recognized that any controls and procedures, no matter how well designed and operated, can provide only reasonable assurances of achieving the desired control objectives, and management necessarily was required to apply its judgment in designing and evaluating the controls and procedures. We continue to review our disclosure controls and procedures, and our internal control over financial reporting, and may from time to time make changes aimed at enhancing their effectiveness and to ensure that our systems evolve with our business.
Changes in Internal Control over Financial Reporting
There were no changes in our internal control over financial reporting during the quarter ended August 28, 2010 that have materially affected, or that are reasonably likely to materially affect, our internal control over financial reporting.
Management’s Responsibility for Financial Statements
Our management is responsible for the preparation, integrity and objectivity of our Consolidated Financial Statements and other financial information contained in our Annual Report on Form 10-K. Those Consolidated Financial Statements were prepared in conformity with accounting principles generally accepted in the United States. In preparing those Consolidated Financial Statements, Management was required to make certain estimates and judgments, which are based upon currently available information and Management’s view of current conditions and circumstances.
The Audit Committee of our Board of Directors, which consists solely of independent directors, oversees our process of reporting financial information and the audit of our Consolidated Financial Statements. The Audit Committee stays informed of our financial condition and regularly reviews management’s financial policies and procedures, the independence of our independent auditors, our internal control and the objectivity of our financial reporting. Our independent registered public accounting firm has free access to the Audit Committee and meets with the Audit Committee periodically, both with and without Management present.
We have retained Ernst & Young LLP, an independent registered public accounting firm, to audit our Consolidated Financial Statements found in this Annual Report on Form 10-K for the year ended August 28, 2010. We have made available to Ernst & Young LLP all of our financial records and related data in connection with their audit of our Consolidated Financial Statements.
Management’s Report on Internal Control Over Financial Reporting
Our management is responsible for establishing and maintaining adequate internal control over financial reporting. Internal control over financial reporting is a process designed to provide reasonable assurance regarding the reliability of financial reporting and the preparation of financial statements for external reporting purposes in accordance with accounting principles generally accepted in the United States. Because of its inherent limitations, internal control over financial reporting may not prevent or detect misstatements. Management has assessed the effectiveness of our internal control over financial reporting as of August 28, 2010. In making its assessment, management has utilized the criteria set forth by the Committee of Sponsoring Organizations (“COSO”) of the Treadway Commission in Internal Control—Integrated Framework. Management concluded that based on its assessment, our internal control over financial reporting was effective as of August 28, 2010. The effectiveness of our internal control over financial reporting as of August 28, 2010 has been audited by Ernst & Young LLP, and a copy of its attestation report is included below.
Report of Independent Registered Public Accounting Firm on Internal Control Over Financial Reporting
The Board of Directors and Shareholders
UniFirst Corporation
We have audited UniFirst Corporation and subsidiaries’ internal control over financial reporting as of August 28, 2010, based on criteria established in Internal Control—Integrated Framework issued by the Committee of Sponsoring Organizations of the Treadway Commission (the COSO criteria). UniFirst Corporation’s management is responsible for maintaining effective internal control over financial reporting, and for its assessment of the effectiveness of internal control over financial reporting in the accompanying Management’s Report on Internal Control Over Financial Reporting. Our responsibility is to express an opinion on the Company’s internal control over financial reporting based on our audit.
We conducted our audit in accordance with the standards of the Public Company Accounting Oversight Board (United States). Those standards require that we plan and perform the audit to obtain reasonable assurance about whether effective internal control over financial reporting was maintained in all material respects. Our audit included obtaining an understanding of internal control over financial reporting, assessing the risk that a material weakness exists, testing and evaluating the design and operating effectiveness of internal control based on the assessed risk, and performing such other procedures as we considered necessary in the circumstances. We believe that our audit provides a reasonable basis for our opinion.
A company’s internal control over financial reporting is a process designed to provide reasonable assurance regarding the reliability of financial reporting and the preparation of financial statements for external purposes in accordance with generally accepted accounting principles. A company’s internal control over financial reporting includes those policies and procedures that (1) pertain to the maintenance of records that, in reasonable detail, accurately and fairly reflect the transactions and dispositions of the assets of the company; (2) provide reasonable assurance that transactions are recorded as necessary to permit preparation of financial statements in accordance with generally accepted accounting principles, and that receipts and expenditures of the company are being made only in accordance with authorizations of management and directors of the company; and (3) provide reasonable assurance regarding prevention or timely detection of unauthorized acquisition, use, or disposition of the company’s assets that could have a material effect on the financial statements.
Because of its inherent limitations, internal control over financial reporting may not prevent or detect misstatements. Also, projections of any evaluation of effectiveness to future periods are subject to the risk that controls may become inadequate because of changes in conditions, or that the degree of compliance with the policies or procedures may deteriorate.
In our opinion, UniFirst Corporation and subsidiaries maintained, in all material respects, effective internal control over financial reporting as of August 28, 2010, based on the COSO criteria.
We also have audited, in accordance with the standards of the Public Company Accounting Oversight Board (United States), the consolidated balance sheets of UniFirst Corporation and subsidiaries as of August 28, 2010 and August 29, 2009, and the related consolidated statements of income, shareholders’ equity, and cash flows for each of the three years in the period ended August 28, 2010 of UniFirst Corporation and subsidiaries and our report dated October 27, 2010 expressed an unqualified opinion thereon.
/s/ Ernst & Young LLP
Boston, Massachusetts
October 27, 2010
ITEM 9B. OTHER INFORMATION
PART III
ITEM 10. DIRECTORS, EXECUTIVE OFFICERS AND CORPORATE GOVERNANCE
We have adopted a Statement of Corporate Policy and Code of Business Conduct and Ethics, which applies to our directors and all of our employees, including our principal executive officer, principal financial officer, principal accounting officer and corporate controller. Our Statement of Corporate Policy and Code of Business Conduct and Ethics is available, free of charge, on our website at www.unifirst.com. Information contained on our website is not part of this Annual Report on Form 10-K or the documents incorporated by reference into this Annual Report on Form 10-K. We intend to disclose any amendment to or waiver of a provision of the Statement of Corporate Policy and Code of Business Conduct and Ethics that applies to our principal executive officer, principal financial officer, principal accounting officer or controller by posting such information on our website at www.unifirst.com.
Information regarding our directors and executive officers required by this Item 10 will be included in our definitive Proxy Statement to be filed with the Securities and Exchange Commission for our 2011 Annual Meeting of Shareholders and is incorporated by reference into this Item 10. Certain information required by this Item 10 is set forth in Item 1 of this Annual Report on Form 10-K under the heading “Executive Officers”.
ITEM 11. EXECUTIVE COMPENSATION
Information required by this Item 11 will be included in our definitive Proxy Statement to be filed with the Securities and Exchange Commission for our 2011 Annual Meeting of Shareholders and is incorporated by reference into this Item 11.
ITEM 12. SECURITY OWNERSHIP OF CERTAIN BENEFICIAL OWNERS AND MANAGEMENT AND RELATED STOCKHOLDER MATTERS
Information required by this Item 12 will be included in our definitive Proxy Statement to be filed with the Securities and Exchange Commission for our 2011 Annual Meeting of Shareholders and is incorporated by reference into this Item 12.
Information concerning our equity compensation plans contained in the table entitled “Equity Compensation Plan Information” set forth in Item 5 of this Annual Report on Form 10-K is incorporated by reference into this Item 12.
ITEM 13. CERTAIN RELATIONSHIPS AND RELATED TRANSACTIONS, AND DIRECTOR INDEPENDENCE
Information required by this Item 13 will be included in our definitive Proxy Statement to be filed with the Securities and Exchange Commission for our 2011 Annual Meeting of Shareholders and is incorporated by reference into this Item 13.
ITEM 14. PRINCIPAL ACCOUNTING FEES AND SERVICES
Information required by this Item 14 will be included in our definitive Proxy Statement to be filed with the Securities and Exchange Commission for our 2011 Annual Meeting of Shareholders and is incorporated by reference into this Item 14.
ITEM 15. EXHIBITS AND FINANCIAL STATEMENT SCHEDULES
(a) The financial statements listed below are filed as part of this report:
(1) and (2) FINANCIAL STATEMENTS AND FINANCIAL STATEMENT SCHEDULES.
The financial statements listed below are included under Item 8 of this Annual Report on Form 10-K:
Consolidated statements of income for each of the three years in the period ended August 28, 2010
Consolidated balance sheets as of August 28, 2010 and August 29, 2009
Consolidated statements of shareholders’ equity for each of the three years in the period ended August 28, 2010
Consolidated statements of cash flows for each of the three years in the period ended August 28, 2010
Notes to Consolidated Financial Statements
Management’s Report on Internal Control Over Financial Reporting
Report of Ernst & Young LLP, Independent Registered Public Accounting Firm
The following additional schedule is filed herewith:
Schedule II — Valuation and qualifying accounts and reserves for each of the three years in the period ended August 28, 2010
UNIFIRST CORPORATION AND SUBSIDIARIES
SCHEDULE II VALUATION AND QUALIFYING ACCOUNTS AND RESERVES
FOR EACH OF THE THREE YEARS IN THE PERIOD ENDED
AUGUST 28, 2010 (IN THOUSANDS)
|
Description
|
Balance,
Beginning of
Period
|
Charged to
Costs and
Expenses
|
Charges for
Which Reserves
Were Created
or Deductions
|
Balance,
End of
Period
|
||||||||||||
|
Reserves for Accounts Receivable
|
||||||||||||||||
|
For the year ended August 28, 2010
|
$ | 5,567 | $ | 2,733 | $ | (4,198 | ) | $ | 4,102 | |||||||
|
For the year ended August 29, 2009
|
$ | 4,164 | $ | 5,744 | $ | (4,341 | ) | $ | 5,567 | |||||||
|
For the year ended August 30, 2008
|
$ | 4,144 | $ | 2,836 | $ | (2,816 | ) | $ | 4,164 | |||||||
|
Reserve for Obsolete Inventory
|
||||||||||||||||
|
For the year ended August 28, 2010
|
$ | 1,588 | $ | 867 | $ | (672 | ) | $ | 1,783 | |||||||
|
For the year ended August 29, 2009
|
$ | 1,722 | $ | 624 | $ | (758 | ) | $ | 1,588 | |||||||
|
For the year ended August 30, 2008
|
$ | 953 | $ | 1,039 | $ | (270 | ) | $ | 1,722 | |||||||
Separate financial statements of the Company have been omitted because the Company is primarily an operating company and all subsidiaries included in the Consolidated Financial Statements are totally held.
All other schedules have been omitted since the required information is not present or not present in amounts sufficient to require submission of the schedule, or because the information required is included in the financial statements or the notes thereto.
3. EXHIBITS. The list of exhibits filed as part of this Annual Report on Form 10-K is set forth below.
DESCRIPTION
|
3.1
|
Restated Articles of Organization (incorporated by reference to Exhibit 3.1 to the Company's Current Report on Form 8-K filed with the Commission on July 5, 2006); Articles of Amendment dated January 13, 1988 (incorporated by reference to Exhibit 3.2 to the Company's Current Report on Form 8-K filed with the Commission on July 5, 2006); and Articles of Amendment dated January 21, 1993 (incorporated by reference to Exhibit 3.3 to the Company's Current Report on Form 8-K filed with the Commission on July 5, 2006)
|
|
3.2
|
By-laws (incorporated by reference to Exhibit 3.1 to the Company’s Current Report on Form 8-K filed with the Commission on January 10, 2008)
|
|
4.1
|
Specimen Stock Certificate for Shares of Common Stock (incorporated by reference to Exhibit 4.1 to the Company's Current Report on Form 8-K filed with the Commission on July 5, 2006)
|
|
10.1
|
Form of UniFirst Corporation stock option award to non-employee directors (incorporated by reference to Exhibit 10-E to the Company’s Annual Report on Form 10-K for the fiscal year ended August 28, 2004 filed with the Commission on November 12, 2004)
|
|
10.2
|
Form of UniFirst Corporation stock option award to executive officers (incorporated by reference to Exhibit 10-F to the Company’s Annual Report on Form 10-K for the fiscal year ended August 28, 2004 filed with the Commission on November 12, 2004)
|
|
10.3
|
UniFirst Corporation Unfunded Supplemental Executive Retirement Plan dated as of March 8, 2006 (incorporated by reference to the Company’s Current Report on Form 8-K and the exhibit thereto filed with the Commission on March 8, 2006)
|
|
10.4
|
Amendment to the UniFirst Corporation Unfunded Supplemental Executive Retirement Plan dated as of January 8, 2008 (incorporated by reference to Exhibit 10.1 to the Company’s Current Report on Form 8-K filed with the Commission on January 10, 2008)
|
|
10.5
|
Amended and Restated Revolving Credit Agreement, dated as of June 14, 2004 (incorporated by reference to Exhibit 10.1 the Company’s Current Quarterly Report on Form 10-Q filed with the Commission on April 9, 2009)
|
|
10.6
|
Modification No. 1, dated as of October 31, 2005, to the Amended and Restated Revolving Credit Agreement, dated as of June 14, 2004 (incorporated by reference to Exhibit 10.2 the Company’s Current Quarterly Report on Form 10-Q filed with the Commission on April 9, 2009)
|
|
10.7
|
Modification No. 2, dated as of March 22, 2006, to the Amended and Restated Revolving Credit Agreement, dated as of June 14, 2004 (incorporated by reference to Exhibit 10.3 the Company’s Current Quarterly Report on Form 10-Q filed with the Commission on April 9, 2009)
|
|
10.8
|
Modification No. 3, dated as of September 13, 2006, to the Amended and Restated Revolving Credit Agreement, dated as of June 14, 2004 (incorporated by reference to Exhibit 10.4 the Company’s Current Quarterly Report on Form 10-Q filed with the Commission on April 9, 2009)
|
|
10.9
|
Note Purchase Agreement, dated as of June 1, 2004 (incorporated by reference to Exhibit 10.5 the Company’s Current Quarterly Report on Form 10-Q filed with the Commission on April 9, 2009)
|
|
10.10
|
Note Purchase Agreement, dated as of September 14, 2006 (incorporated by reference to Exhibit 10.6 the Company’s Current Quarterly Report on Form 10-Q filed with the Commission on April 9, 2009)
|
|
10.11
|
Form of Restricted Stock Award Agreement under the UniFirst Corporation Amended 1996 Stock Incentive Plan (incorporated by reference to Exhibit 10.7 the Company’s Current Quarterly Report on Form 10-Q filed with the Commission on April 9, 2009)
|
|
10.12
|
Employment Agreement, dated as of April 5, 2010, by and between UniFirst Corporation and Ronald D. Croatti (incorporated by reference to Exhibit 10.1 to the Company's Quarterly Report on Form 10-Q filed with the Commission on April 8, 2010)
|
|
10.13
|
Restricted Stock Award Agreement, dated April 5, 2010, by and between UniFirst Corporation and Ronald D. Croatti (incorporated by reference to Exhibit 10.2 to the Company's Quarterly Report on Form 10-Q filed with the Commission on April 8, 2010)
|
|
10.14
|
Restricted Stock Award Agreement, dated April 5, 2010, by and between UniFirst Corporation and Ronald D. Croatti (incorporated by reference to Exhibit 10.3 to the Company's Quarterly Report on Form 10-Q filed with the Commission on April 8, 2010)
|
|
10.15
|
UniFirst Corporation Amended 1996 Stock Incentive Plan (incorporated by reference to Exhibit 10.1 to the Company's Quarterly Report on Form 10-Q filed with the Commission on January 7, 2010)
|
|
10.16
|
Second Amendment to the UniFirst Corporation Amended 1996 Stock Incentive Plan (incorporated by reference to Exhibit 10.2 to the Company's Quarterly Report on Form 10-Q filed with the Commission on January 7, 2010)
|
|
10.17
|
Third Amendment to the UniFirst Corporation Amended 1996 Stock Incentive Plan (incorporated by reference to Exhibit 10.3 to the Company's Quarterly Report on Form 10-Q filed with the Commission on January 7, 2010)
|
|
10.18
|
Fourth Amendment to the UniFirst Corporation Amended 1996 Stock Incentive Plan (incorporated by reference to Exhibit 10.4 to the Company's Quarterly Report on Form 10-Q filed with the Commission on January 7, 2010)
|
|
10.19
|
Fifth Amendment to the UniFirst Corporation Amended 1996 Stock Incentive Plan (incorporated by reference to Exhibit 10.4 to the Company's Quarterly Report on Form 10-Q filed with the Commission on April 8, 2010)
|
|
* 21
|
List of Subsidiaries
|
|
* 23.1
|
Consent of Ernst & Young LLP, Independent Registered Public Accounting Firm
|
|
* 31.1
|
Rule 13a-14(a)/15d-14(a) Certification of Ronald D. Croatti
|
|
* 31.2
|
Rule 13a-14(a)/15d-14(a) Certification of Steven S. Sintros
|
|
** 32.1
|
Certification of Chief Executive Officer Pursuant to 18 U.S.C. Section 1350, as adopted pursuant to Section 906 of the Sarbanes Oxley Act of 2002
|
|
** 32.2
|
Certification of Chief Financial Officer Pursuant to 18 U.S.C. Section 1350, as adopted pursuant to Section 906 of the Sarbanes Oxley Act of 2002
|
|
|
* Filed herewith
|
|
|
** Furnished herewith
|
Pursuant to the requirements of Section 13 or 15(d) of the Securities Exchange Act of 1934, the registrant has duly caused this report to be signed on its behalf by the undersigned, thereunto duly authorized.
|
UniFirst Corporation
By: /s/ Ronald D. Croatti
Ronald D. Croatti
President and Chief Executive Officer
|
October 27, 2010
Pursuant to the requirements of the Securities Exchange Act of 1934, this report has been signed below by the following persons on behalf of the registrant and in the capacities and on the dates indicated.
|
NAME
|
TITLE
|
DATE
|
|
/s/ Ronald D. Croatti
Ronald D. Croatti
/s/ Steven S. Sintros
Steven S. Sintros
/s/ Cynthia Croatti
Cynthia Croatti
/s/ Phillip L. Cohen
Phillip L. Cohen
/s/ Robert F. Collings
Robert F. Collings
/s/ Anthony F. DiFillippo
Anthony F. DiFillippo
/s/ Donald J. Evans
Donald J. Evans
/s/ Michael Iandoli
Michael Iandoli
/s/Thomas Postek
Thomas S. Postek
|
Principal Executive Officer and Director
Principal Financial Officer and
Principal Accounting Officer
Director
Director
Director
Director
Director
Director
Director
|
October 27, 2010
October 27, 2010
October 27, 2010
October 27, 2010
October 27, 2010
October 27, 2010
October 27, 2010
October 27, 2010
October 27, 2010
|
DESCRIPTION
|
3.1
|
Restated Articles of Organization (incorporated by reference to Exhibit 3.1 to the Company's Current Report on Form 8-K filed with the Commission on July 5, 2006); Articles of Amendment dated January 13, 1988 (incorporated by reference to Exhibit 3.2 to the Company's Current Report on Form 8-K filed with the Commission on July 5, 2006); and Articles of Amendment dated January 21, 1993 (incorporated by reference to Exhibit 3.3 to the Company's Current Report on Form 8-K filed with the Commission on July 5, 2006)
|
|
3.2
|
By-laws (incorporated by reference to Exhibit 3.1 to the Company’s Current Report on Form 8-K filed with the Commission on January 10, 2008)
|
|
4.1
|
Specimen Stock Certificate for Shares of Common Stock (incorporated by reference to Exhibit 4.1 to the Company's Current Report on Form 8-K filed with the Commission on July 5, 2006)
|
|
10.1
|
Form of UniFirst Corporation stock option award to non-employee directors (incorporated by reference to Exhibit 10-E to the Company’s Annual Report on Form 10-K for the fiscal year ended August 28, 2004 filed with the Commission on November 12, 2004)
|
|
10.2
|
Form of UniFirst Corporation stock option award to executive officers (incorporated by reference to Exhibit 10-F to the Company’s Annual Report on Form 10-K for the fiscal year ended August 28, 2004 filed with the Commission on November 12, 2004)
|
|
10.3
|
UniFirst Corporation Unfunded Supplemental Executive Retirement Plan dated as of March 8, 2006 (incorporated by reference to the Company’s Current Report on Form 8-K and the exhibit thereto filed with the Commission on March 8, 2006)
|
|
10.4
|
Amendment to the UniFirst Corporation Unfunded Supplemental Executive Retirement Plan dated as of January 8, 2008 (incorporated by reference to Exhibit 10.1 to the Company’s Current Report on Form 8-K filed with the Commission on January 10, 2008)
|
|
10.5
|
Amended and Restated Revolving Credit Agreement, dated as of June 14, 2004 (incorporated by reference to Exhibit 10.1 the Company’s Current Quarterly Report on Form 10-Q filed with the Commission on April 9, 2009)
|
|
10.6
|
Modification No. 1, dated as of October 31, 2005, to the Amended and Restated Revolving Credit Agreement, dated as of June 14, 2004 (incorporated by reference to Exhibit 10.2 the Company’s Current Quarterly Report on Form 10-Q filed with the Commission on April 9, 2009)
|
|
10.7
|
Modification No. 2, dated as of March 22, 2006, to the Amended and Restated Revolving Credit Agreement, dated as of June 14, 2004 (incorporated by reference to Exhibit 10.3 the Company’s Current Quarterly Report on Form 10-Q filed with the Commission on April 9, 2009)
|
|
10.8
|
Modification No. 3, dated as of September 13, 2006, to the Amended and Restated Revolving Credit Agreement, dated as of June 14, 2004 (incorporated by reference to Exhibit 10.4 the Company’s Current Quarterly Report on Form 10-Q filed with the Commission on April 9, 2009)
|
|
10.9
|
Note Purchase Agreement, dated as of June 1, 2004 (incorporated by reference to Exhibit 10.5 the Company’s Current Quarterly Report on Form 10-Q filed with the Commission on April 9, 2009)
|
|
10.10
|
Note Purchase Agreement, dated as of September 14, 2006 (incorporated by reference to Exhibit 10.6 the Company’s Current Quarterly Report on Form 10-Q filed with the Commission on April 9, 2009)
|
|
10.11
|
Form of Restricted Stock Award Agreement under the UniFirst Corporation Amended 1996 Stock Incentive Plan (incorporated by reference to Exhibit 10.7 the Company’s Current Quarterly Report on Form 10-Q filed with the Commission on April 9, 2009)
|
|
10.12
|
Employment Agreement, dated as of April 5, 2010, by and between UniFirst Corporation and Ronald D. Croatti (incorporated by reference to Exhibit 10.1 to the Company's Quarterly Report on Form 10-Q filed with the Commission on April 8, 2010)
|
|
10.13
|
Restricted Stock Award Agreement, dated April 5, 2010, by and between UniFirst Corporation and Ronald D. Croatti (incorporated by reference to Exhibit 10.2 to the Company's Quarterly Report on Form 10-Q filed with the Commission on April 8, 2010)
|
|
10.14
|
Restricted Stock Award Agreement, dated April 5, 2010, by and between UniFirst Corporation and Ronald D. Croatti (incorporated by reference to Exhibit 10.3 to the Company's Quarterly Report on Form 10-Q filed with the Commission on April 8, 2010)
|
|
10.15
|
UniFirst Corporation Amended 1996 Stock Incentive Plan (incorporated by reference to Exhibit 10.1 to the Company's Quarterly Report on Form 10-Q filed with the Commission on January 7, 2010)
|
|
10.16
|
Second Amendment to the UniFirst Corporation Amended 1996 Stock Incentive Plan (incorporated by reference to Exhibit 10.2 to the Company's Quarterly Report on Form 10-Q filed with the Commission on January 7, 2010)
|
|
10.17
|
Third Amendment to the UniFirst Corporation Amended 1996 Stock Incentive Plan (incorporated by reference to Exhibit 10.3 to the Company's Quarterly Report on Form 10-Q filed with the Commission on January 7, 2010)
|
|
10.18
|
Fourth Amendment to the UniFirst Corporation Amended 1996 Stock Incentive Plan (incorporated by reference to Exhibit 10.4 to the Company's Quarterly Report on Form 10-Q filed with the Commission on January 7, 2010)
|
|
10.19
|
Fifth Amendment to the UniFirst Corporation Amended 1996 Stock Incentive Plan (incorporated by reference to Exhibit 10.4 to the Company's Quarterly Report on Form 10-Q filed with the Commission on April 8, 2010)
|
|
* 21
|
List of Subsidiaries
|
|
* 23.1
|
Consent of Ernst & Young LLP, Independent Registered Public Accounting Firm
|
|
* 31.1
|
Rule 13a-14(a)/15d-14(a) Certification of Ronald D. Croatti
|
|
* 31.2
|
Rule 13a-14(a)/15d-14(a) Certification of Steven S. Sintros
|
|
** 32.1
|
Certification of Chief Executive Officer Pursuant to 18 U.S.C. Section 1350, as adopted pursuant to Section 906 of the Sarbanes Oxley Act of 2002
|
|
** 32.2
|
Certification of Chief Financial Officer Pursuant to 18 U.S.C. Section 1350, as adopted pursuant to Section 906 of the Sarbanes Oxley Act of 2002
|
|
|
* Filed herewith
|
|
|
** Furnished herewith
|